
Improvement of n-Butene Yield in Dimethyl Ether-to-Olefin Reaction Using Ferrierite Zeolite Catalysts

1
Organic Materials Diagnosis Group, Research Institute for Sustainable Chemistry, National Institute of Advanced Industrial Science and Technology (AIST), 3-11-32 Kagamiyama, Higashihiroshima 739-0046, Hiroshima, Japan
2
Faculty of Agriculture, Ehime University, 3-5-7 Tarumi, Matsuyama 790-8566, Ehime, Japan
*
Author to whom correspondence should be addressed.
Catalysts 2023, 13(7), 1040; https://doi.org/10.3390/catal13071040
Submission received: 27 April 2023
/
Revised: 21 June 2023
/
Accepted: 22 June 2023
/
Published: 26 June 2023
(This article belongs to the Topic Advances in Biomass Conversion)
Abstract
:Various ferrierite zeolites were investigated as catalysts for the dimethyl ether (DME)-to-olefin (DTO) reactions to efficiently synthesize n-butene, such as 1-butene, trans-2-butene, and cis-2-butene except for iso-butene using a fixed-bed flow reactor. Twenty P-loaded ferrierite zeolites with different structural parameters and acidic properties were prepared by the impregnation method by varying the P content and the temperature of air calcination as a pretreatment. The zeolites were characterized by X-ray diffraction (XRD), N2 adsorption-desorption, and NH3 temperature-programmed desorption (NH3-TPD). Micropore surface area, external surface area, total pore volume, micropore volume, and weak and strong acid sites affected the DTO reaction behavior. A high n-butene yield (31.2 C-mol%) was observed, which is higher than the previously reported maximum yield (27.6 C-mol%). Multiple regression analysis showed that micropore surface area and strong acid sites had a high correlation with n-butene yield. Based on our findings, we explained the reaction mechanism for selective n-butene synthesis except for iso-butene in the DTO reaction by the dual cycle model.
Keywords:
dimethyl ether; n-butene; ferrierite; micropore; strong acid; multiple regression analysis1. Introduction
1,3-Butadiene (1,3-BD) is one of the major building blocks in the production of synthetic rubbers and resins. Owing to the good performance of polybutadiene and acrylonitrile-butadiene-styrene (ABS) resin, the demand for 1,3-BD is expected to increase in the future. 1,3-BD is a common by-product in the production of ethylene from naphtha. However, the use of shale gas instead of naphtha for ethylene production has become popular in recent years as shale gas is cheaper than naphtha [1,2]. Shale gas mainly contains methane and ethane and is difficult to convert to 1,3-BD. Therefore, researchers have focused on developing other synthesis methods for 1,3-BD from carbon resources other than naphtha to accomplish its stable supply.
Biomass is the only renewable carbonaceous resource. Thus far, 1,3-BD has been synthesized from cellulose and hemicellulose, which are the main components of woody biomass, via alcohol and tetrahydrofuran [3,4,5,6]. Techno-economic analysis through simulation has eliminated the issues with this synthetic process from a technological and environmental perspective [7,8]. Since cellulose and hemicellulose have relatively simple structures, researchers have converted them into various petroleum substitutes [9,10]. However, as lignin has a complicated structure, few reports exist on its conversion into a single material. For the effective utilization of lignin and stable supply of 1,3-BD, the synthesis of 1,3-BD from lignin is desirable.
We have previously developed the 1,3-BD synthetic process from lignin (Figure 1) via simulations and experiments [11,12,13,14]. The process consists of four steps: gasification, dimethyl ether (DME) synthesis, DME-to-olefin (DTO) reaction, and isomerization/dehydrogenation. Lignin can be efficiently converted to 1,3-BD since the syngas (CO + H2) is produced by gasification, regardless of the structural complexity of lignin. Process simulation results indicate that improving the yield of n-butene such as 1-butene, trans-2-butene, and cis-2-butene in the DTO reaction is the most challenging aspect of the synthesis of 1,3-BD from lignin [13], since 1,3-BD synthesis via skeletal isomerization of iso-butene has not been reported.
Zeolites are promising catalysts for the DTO reaction [15]. Zeolites with topologies such as MFI [16,17,18], CHA [19,20], MSE [21,22,23,24], EUO [25,26], YFI [27], MOR [28,29], AEI/CHA [30,31] exhibit high propylene yields. Butene is reported as a by-product in these reports. Moreover, there have been few reports on the selective synthesis of linear alkenes with a carbon number of four except for iso-butene. The use of ferrierite zeolite resulted in a high n-butene yield in the DTO reaction [14]. Ferrierite zeolite has a bidirectional microporous structure formed by interconnected small (8-ring) and medium (10-ring) pores. Since it has a large specific area, a high reaction rate and shape-selective effect are expected by modifying the pore structure and adding appropriate active sites.
To improve the catalytic performance of ferrierite zeolites, it is necessary to change physicochemical properties without changing the topology. The catalytic performance is enhanced by the synthesis of specific nanoscale shapes [32,33], silanation [34], and the addition of metal/non-metal oxide [35,36]. Among them, the addition of phosphorous by the impregnation method easily changes the physicochemical properties of zeolites [37,38]. The addition of P to zeolites improved not only the selectivity [39] but also the catalyst lifetime [40].
In this study, we investigated the DTO reaction behavior over P-loaded ferrierite zeolites with different structural parameters and acid properties prepared by the impregnation method, resulting in the improvement of n-butene yield except for iso-butene. We performed multiple regression analysis to identify the physicochemical factors of zeolites that were statistically highly correlated with n-butene yield for designing highly efficient zeolites. Based on the obtained findings, we explained a reaction mechanism for n-butene synthesis in the DTO reaction over ferrierite zeolite.
2. Results and Discussion
Twenty P-loaded ferrierite zeolites were prepared by the impregnation method, and the DTO reaction was performed using a fixed-bed flow reactor. The P content was 0–12 wt.%, and the temperatures of air calcination, which is a pretreatment, were 450, 500, 550, and 600 °C. The prepared zeolites were notated as P(P content)_calcination temperature. For example, the zeolite with a P content of 3.3 wt.% and calcination temperature of 550 °C is denoted as P(3.3)_550.
2.1. Characterization
P-loaded zeolites were characterized by X-ray diffraction (XRD), N2 adsorption-desorption, and NH3 temperature-programmed desorption (NH3-TPD) analyses.
Figure 2 shows the XRD patterns of P-loaded ferrierite zeolites at a calcination temperature of 450 °C. At 2θ = 9.3 ± 0.1 (200), 22.3 ± 0.1 (420), 23.5 ± 0.1 (330), 25.2 ± 0.1 (040), 25.7 ± 0.1 (202), characteristic diffraction peaks of ferrierite [41] were observed. Five characteristic peaks of P(0)_450 were consistent with those of P-loaded zeolites (Figure 2). This result indicates that the phosphoric acid treatment did not damage the phase structure of the ferrierite zeolite. With increasing P content, the peak intensity decreased, whereas the half-value width increased. This result indicates that an increase in the P content leads to a decrease in crystal size. Mixing the zeolite and phosphoric acid by the impregnation method would facilitate the dissolution of a part of the zeolite. An increase in the P content increases the ratio of the amount of acid to the weight of zeolite. Therefore, the crystal size became smaller as the amount of zeolite dissolved in the phosphoric acid solution increased. The same trend was observed for P-loaded zeolites at the calcination temperatures of 500, 550, and 600 °C (Figures S1–S3).
N2 adsorption-desorption isotherms for P-loaded zeolites calcined at 450 °C are shown in Figure 3. The isotherms depended on the P content and corresponded to the IUPAC classification Type I and IV composite types. The low relative pressure region (p/p0 < 0.01) corresponds to Type I adsorption (Langmuir isotherm) and indicates the presence of micropores [42]. In addition, the high relative pressure region (0.95 < p/p0) corresponds to Type IV adsorption and indicates the presence of macropores [33]. The amount of N2 adsorption decreased with increasing P content. In particular, P(12)_450 did not adsorb in the low pressure region (p/p0 < 0.1), suggesting that increasing P content causes micropore clogging. Similarly, the significant decrease in adsorption in the high pressure region (0.9 < p/p0) indicates the disappearance of macropores.
A hysteresis loop was observed in P(1.4)_450, and no other zeolites were observed (Figure 3). At a calcination temperature of 500 °C, a similar trend was observed (Figure S4). The hysteresis loop is believed to result from a stepwise desorption mechanism due to the connection of pores with different diameters. This finding suggests that the connection of pores with different diameters was not significant in the parent zeolite and zeolites of P contents with 3 wt.% or more, whereas pores with extremely different diameters would be formed in P(1.4)_450 and P(1.1)_500. The addition of excess phosphoric acid would be reasonable for the formation of pores with almost the same diameters. In contrast, no hysteresis loop was observed in any zeolites at calcination temperatures of 550 and 600 °C (Figures S5 and S6). A higher calcination temperature would promote the migration of phosphate ions during heating even at a P content of approximately 1 wt.%, resulting in the formation of cylindrical pores.
Structural parameters of P-loaded zeolites were obtained from N2 adsorption-desorption isotherms (Table 1). At all calcination temperatures, the surface area and pore volume decreased with increasing P content. This tendency was previously observed in P-loaded Hβ zeolites [43]. van der Bij et al. observed from scanning transmission X-ray microscopy that the phosphorus loaded on H-ZSM-5 is present on and close to the external surface [44]. Phosphorus would serve as the glue, promoting zeolite agglomeration and reducing the external surface area. Excess phosphorus would migrate into the pores to a certain extent, reducing the micropore surface area and pore volume; however, mesopore formation was not observed in this case.
At almost the same P contents, the micropore surface area increased with increasing calcination temperature, while the external surface area was almost constant. The parent zeolite in this study had the cation type of NH4+ and moisture in the micropores. Higher calcination temperature would promote the removal of these compounds, leading to an increase in the micropore surface area.
NH3-TPD profiles of P-loaded ferrierite zeolites at a calcination temperature of 450 °C are shown in Figure 4. Even though ammonia adsorbs on strong acid sites, such as ammonium cation (protonic acidity), it also adsorbs on weak acid sites via hydrogen bonding, as evidenced by FT-IR spectroscopy in a previous study [45]. NH3-TPD can determine the amount of weak and strong acid sites; however, it is unable to distinguish between Brønsted and Lewis acidity. FT-IR-pyridine adsorption is a promising analytical technique for determining the number of these acid sites.
Two distinct peaks corresponding to weak and strong acid sites were observed in the NH3-TPD profiles (Figure 4). The center of the low temperature peak was at 201–203 °C for all the P contents. The center of the high temperature peak was at 474–491 °C for the P contents from 0 to 6.9 wt.% and at 565 °C for the P content of 12 wt.%. Similar trends were observed for NH3-TPD of P-loaded zeolites at the calcination temperatures of 500, 550, and 600 °C (Figures S7–S9).
At all calcination temperatures, the total surface area and total volume are significantly reduced at a P content of 12 wt.% (Table 1). A decrease in the surface area is consistent with a decrease in the number of strong acid sites. A smaller pore volume would lead to an inhibition of mass transfer of NH3. Therefore, it is possible that excess heat was required to move the NH3 molecules out of the extremely narrow pore.
The weak and strong acid sites evaluated based on the peak area are shown in Table 2. At all calcination temperatures, both sites decreased with increasing P content. Vu et al. proposed a surface structural model for the addition of P to zeolites [46]. Among the three hydroxy groups of phosphoric acid, two undergo dehydration condensation with Si-OH and Al-OH, which constitute the zeolite surface, and the non-participating P-OH become acid sites on the zeolite surface [46]. Thus, the addition of 1 mol of phosphoric acid to zeolite theoretically eliminates 2 mol of OH groups on the zeolite surface and yields 1 mol of P-OH. As the acid strength of P-OH is weaker than that of Al-OH, the addition of P to zeolites weakens the acidity [47]. These results suggest that an increase in the P content causes a monotonous decrease in the number of acid sites. In contrast, 2 wt.% P-loaded Hβ zeolite exhibited the maximum number of strong acid sites [43]. Up to a P content of 2 wt.%, an increase in the P content led to the binding of phosphate to the zeolite defect sites, resulting in an increase in the amount of Brønsted acid sites. In contrast, at 2 wt.% or more, the progress of dealumination would lead to a decrease in the Brønsted acid sites. The effect of P addition on the generation of acid sites may depend on topology.
2.2. DTO Reactions
Initially, the DTO reaction was performed at 400 °C using inert SiO2. DME conversion was 0.1%, and no n-butene was detected. This result indicates that n-butene is generated only in the presence of zeolite catalysts.
The DTO reactions were conducted using 20 P-loaded ferrierite zeolites (Table 3). The P content was 0–12 wt.% and calcination temperatures were 450, 500, 550, and 600 °C. The DME conversion and product yield, which depended on P content and calcination temperature, were 1.3–97.8% and 0.0–31.2 C-mol%, respectively. In particular, P(0)_450 showed the highest n-butene yield (31.2 C-mol%), which exceeds the previously reported maximum value of 27.6 C-mol% [14]. It was also possible to suppress the production of iso-butene. At each calcination temperature, the DME conversion and n-butene yield decreased with increasing P content. When the P content was maintained nearly constant, a clear effect of the calcination temperature was not observed on the catalytic behavior. These results suggest that the zeolite pore structure and acidity significantly affect the efficiency of n-butene synthesis.
2.3. Correlation between n-Butene Yield and Physicochemical Properties of Zeolite
As mentioned in Section 2.2, the highest n-butene yield was obtained in this study. Therefore, the statistical analysis of the physicochemical properties of these zeolites could provide useful information for designing highly efficient zeolites. The six physical properties of micropore surface area (x1), external surface area (x2), total pore volume (x3), micropore volume (x4), weak acid sites (x5), and strong acid sites (x6) were considered as explanatory variables, from which the correlation coefficient (rij) and n-butene yield (y) were determined (Table S1). The absolute values of the six correlation coefficients are ≥0.5, and their order of magnitude was x1 (0.706) > x4 (0.700) > x6 (0.690) > x2 (0.666) > x5 (0.636) > x3 (0.621).
For multiple regression analysis, an appropriate combination of explanatory variables must be selected. The explanatory variable tolerance (1 − rij2) is shown in Table 4. When this value is less than the critical value (0.1), multicollinearity occurs, resulting in a decrease in correlation accuracy. Considering tolerance, combinations of explanatory variables other than x1–x4, x2–x5, and x5–x6 were used for multiple regression analysis.
The explanatory variables, residual sum of squares (RSS), F-ratio, regression equation, and contribution rate of multiple regression analysis are shown in Table 5. The RSS was expressed as follows:
where, εi is the error, a0 is the intercept, a1–a6 are the partial regression coefficients, x1i–x6i are experimental data. It is derived from the error between the data and the regression equation, and a smaller value is desirable.
The F-ratio represents the reduction rate of the RSS when the explanatory variable is added, and was expressed as follows:
where q was the number of explanatory variables. An F-ratio ≥ 1 indicates the effective addition of the explanatory variable.
The multiple regression analysis can determine the partial regression coefficient (a1–a6) that minimizes the RSS of Equation (1). As a result, the regression equation is obtained as follows:
When no explanatory variables (q = 0) were used (trial 1), the RSS0 was the sum of the squares of the n-butene yields (3086). When x1 with the highest correlation coefficient for y was added (trial 2), the RSS1 decreased to 1150 and the F-ratio was > 1 (30.30). Hence, x1 was adopted as the explanatory variable. Then, we calculated the RSS2 when x2, x3, x5, and x6 were added to x1 (trial 3). Due to the low tolerance of x1–x4 (0.024 < 0.1, Table 4), we did not consider adding x4. The addition of x6 led to the smallest residual sum of squares (1062). Since the F-ratio was 1.41 (>1) upon the addition of x6, x6 was also added to the regression equation. Next, we calculated the RSS3 when x2 and x3 were added to x1 and x6 (trial 4). because x5–x6 has a low tolerance (0.086 < 0.1, Table 4), we did not consider adding x5. Moreover, as the trial 4 resulted in an F-ratio of <1, the multiple regression analysis was terminated without adding x2 and x3. When x1 (micropore surface area) and x6 (strong acid sites) were used as explanatory variables (trial 3), the contribution rate of the regression equation was 53.7% and the n-butene yield (y) could be explained well.
Zeolites without P loading exhibited high n-butene yields, which were P(0)_450 > P(0)_550 > P(0)_500 > P(0)_600 (Table 3). The order of micropore surface area and strong acid sites is P(0)_450 < P(0)_550 < P(0)_500 < P(0)_600 (Table 1), and P(0)_450 > P(0)_550 > P(0)_500 > P(0)_600 (Table 2), respectively. The order of n-butene yield, micropore surface area and strong acid are consistent. These two factors were confirmed to be important for obtaining high n-butene yields.
To improve the contribution rate, the addition of other explanatory variables is required. We focus on Brønsted and Lewis acidity. In the near future, we will investigate the Brønsted and Lewis acid sites by the FT-IR-pyridine adsorption method.
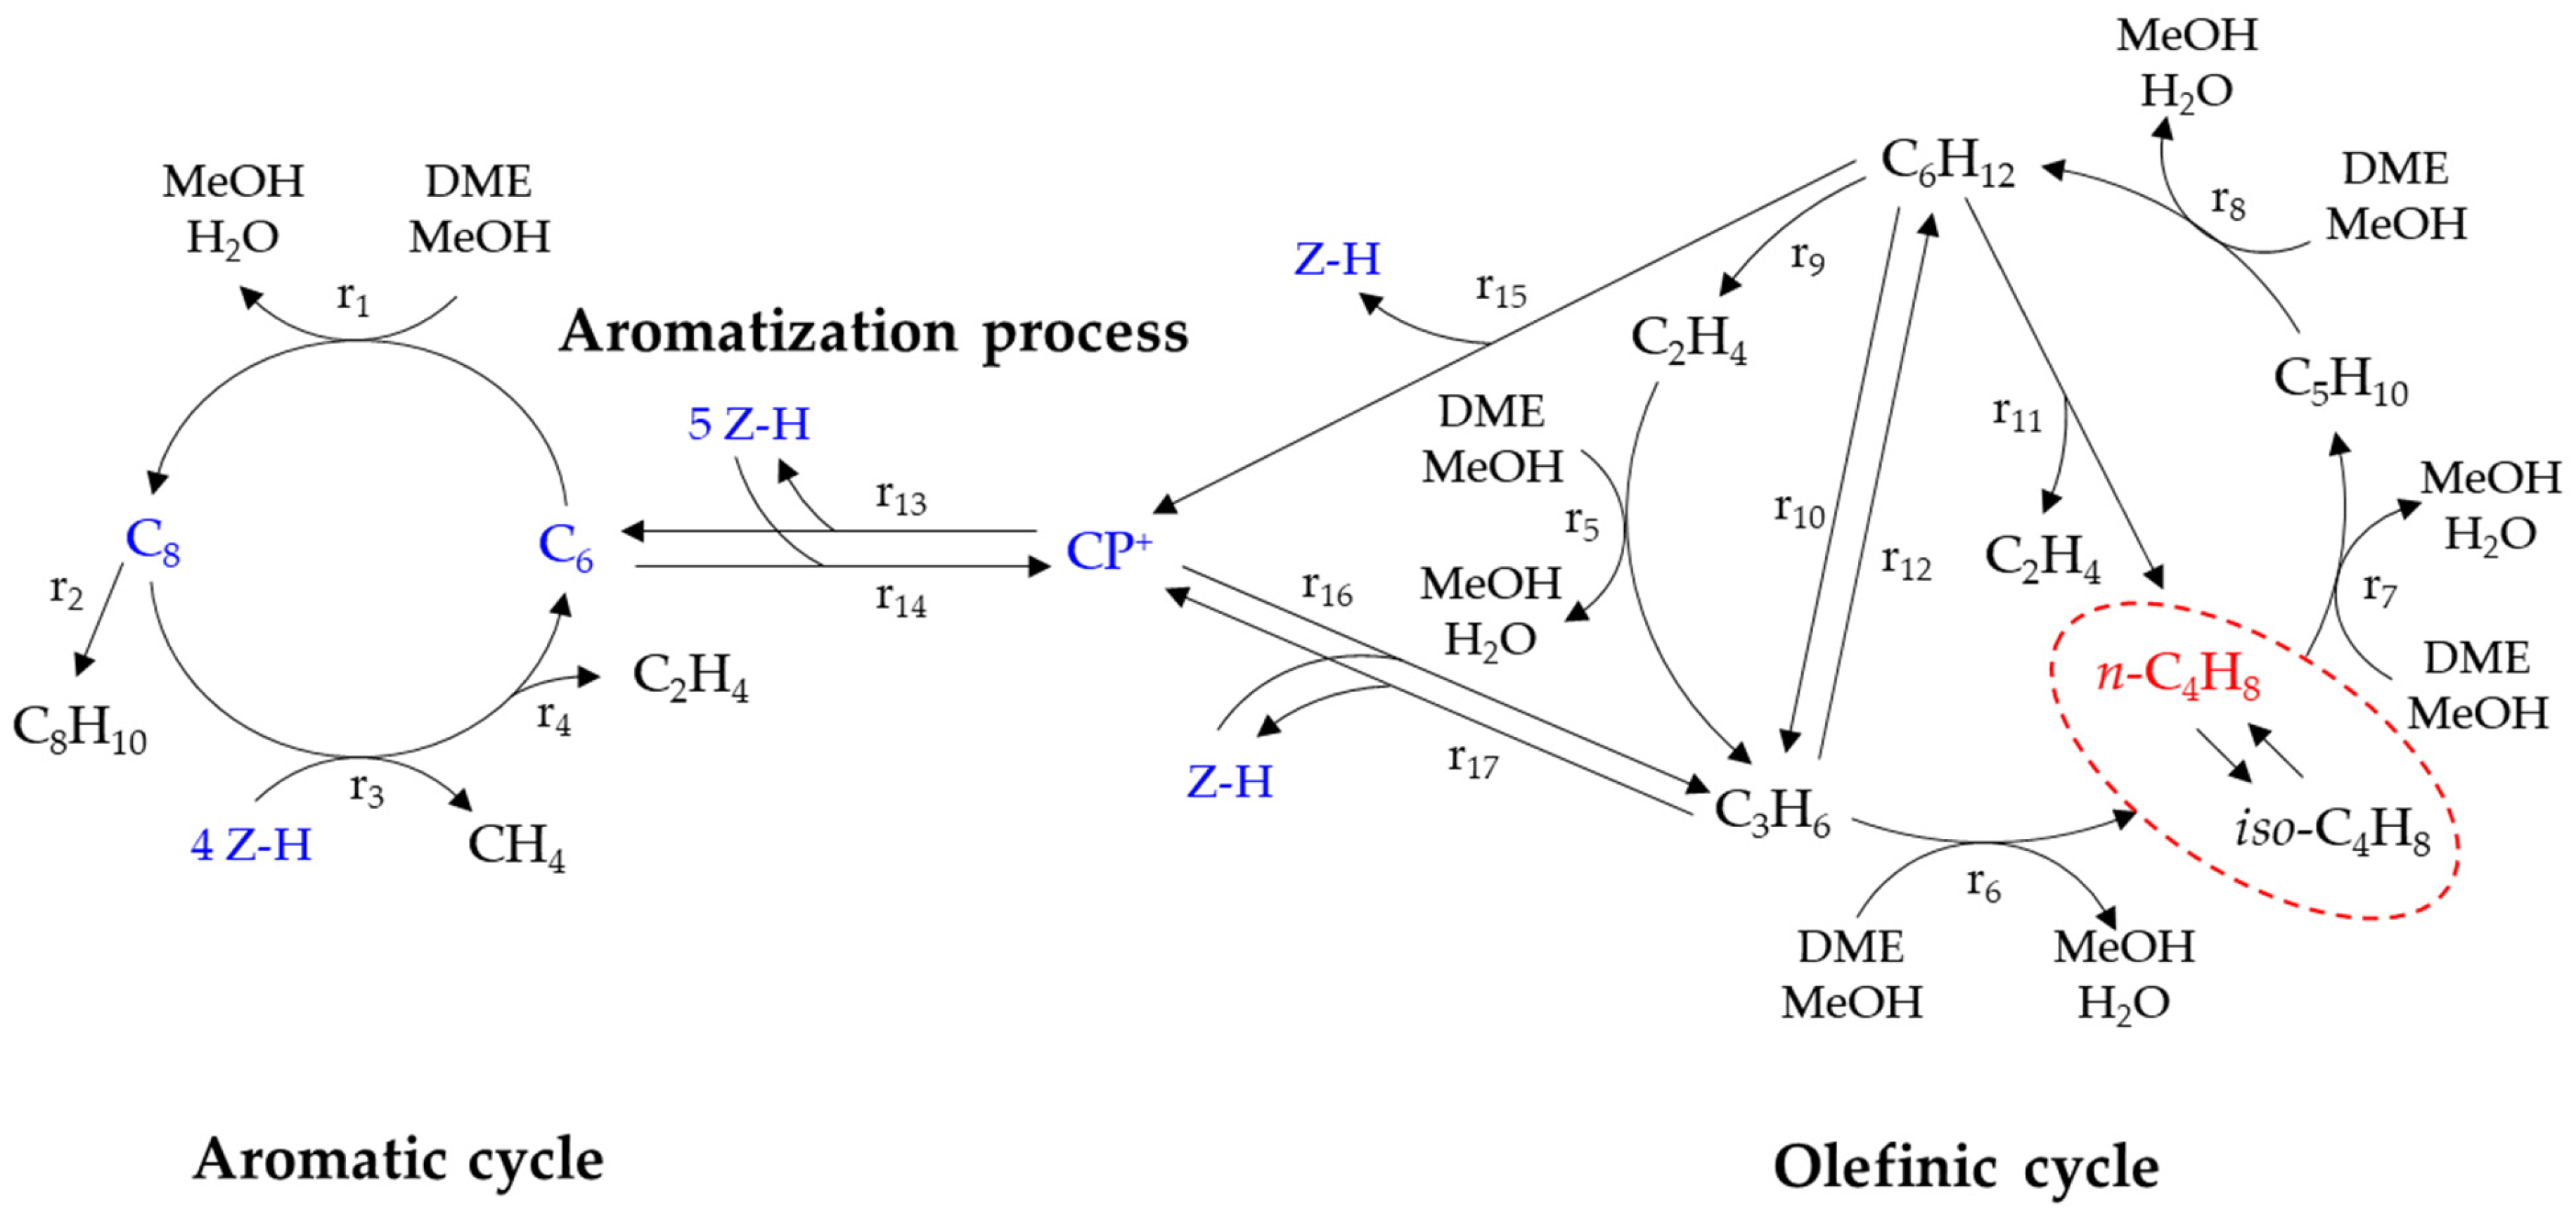
A dual cycle model has been previously proposed as the mechanism for the DTO reaction [48,49]. Based on the literature, a model for the DTO reaction mechanism is shown in Figure 5. This reaction mechanism involves an aromatic cycle, aromatization, and olefinic cycle and generates four reaction intermediates (highlighted in blue in Figure 5): aromatics in hydrocarbon pools 6 and 8, cyclopentenyl cations (CP+), and adsorbed hydrogen on the zeolite surface (Z-H).
The aromatic cycle begins with the alkylation reaction of the aromatic intermediates C6–C8 (reaction 1) followed by dealkylation to produce aromatic compounds (reaction 2), methane (reaction 3), and ethylene (reaction 4). The olefinic cycle involves olefin methylation (reactions 5, 6, 7, and 8), hexene cracking (reactions 9, 10, and 11), and propylene dimerization (reaction 12). The two cycles are associated with an aromatization process (reactions 13 and 14) involving an aromatic intermediate (C6) and CP+ [50]. In addition, reactions involving CP+ (reactions 15, 16, and 17) are considered.
The initial reaction mechanism has still been under discussion. Strong acid generally contains Brønsted acid. MeOH and dehydration-derived DME react to form active ethylene species on the Brønsted acid in the initial stages of the MeOH-to-olefin (MTO) reaction, followed by alkylation [51]. Therefore, we considered the formation of active ethylene species from DME and the Brønsted acid as the starting point of the olefinic cycle.
In this study, low yields of methane and ethylene and no aromatic compounds were observed (Table 3). In addition, the DTO reaction mechanism over MFI zeolite (ZSM-5) was explained by the dual cycle model in the literature. ZSM-5 has only 10-membered rings. In contrast, ferrierite zeolite has 8- and 10-membered rings, and the pore cross section is elliptically distorted, which limits the penetration of aromatic compounds into the pores. Moreover, the DTO reaction over ferrierite zeolites has been reported with lower methane, ethylene, and aromatic compound yields than that over ZSM-5 [14]. These findings suggest that the olefinic cycle is the main reaction route in the former reaction.
High n-butene yield in the olefinic cycle requires the promotion of propylene methylation (reaction 6), suppression of butene methylation (reaction 7), and promotion of hexene cracking (reactions 9, 10, and 11). Since the micropore surface area and n-butene yield had the highest correlation coefficient (Table S1), an increase in the micropore surface area would increase the contact frequency between the reaction intermediates and strong acid as the methylation active site. In the DTO reaction over EUO zeolite, an increase in the micropore surface area led to high yields of propylene and butene [26].
The activation energies for olefin methylation reactions with DME are in the order ethylene > propylene > butene > pentene [49]. This indicates that an appropriate balance between the butene production rate and disappearance rate is required. Ortega et al. reported that butene is relatively stable due to the high activation energy for butene disappearance [52]. Menges et al. reported that butene formation by methylation is 1.7 times faster than butene disappearance [53]. These findings support the idea that butene disappearance is kinetically limited.
The iso-butene yield was extremely low (Table 3). Hill et al. reported that the alkylation rate constant of iso-butene is at least 40 times higher than that of 1-butene, trans-2-butene, and cis-2-butene [54]. This result indicates that iso-butene formation via n-butene isomerization is suppressed. Khitev et al. reported an increase in the iso-butene selectivity with a decrease in the micropore/mesopore ratio of ferrierite zeolites in the skeletal isomerization of 1-butene [55]. This finding suggests that the presence of micropores in ferrierite sterically hinders the formation of iso-butene via n-butene isomerization. This observation is also supported by the absence of mesopores (Table 1).
The hexene yield was relatively low (Table 3). Higher temperatures are thermodynamically favorable for cracking. Propylene was detected at temperatures above 450 °C in hexane cracking using zeolite [56,57]. Considering the reaction temperature (400 °C), we inferred that the contribution of hexene cracking (reactions 9, 10, 11, and 15) and conversion (reaction 12) to the olefinic cycle was small.
Multiple regression analysis indicated that micropore surface area and strong acid sites are the relevant physicochemical factors to explain n-butene yield. The increase in the micropore surface area provided a sufficient number of strong acid sites to promote alkylation (reactions 5 and 6). In contrast, the micropores of ferrierite would have contributed to suppressing the skeletal isomerization of n-butene. Therefore, the reaction mechanism for n-butene synthesis in the DTO reaction over P-loaded ferrierite zeolites was successfully explained by the dual cycle model.
To further improve the n-butene yield, butene alkylation should be suppressed (reaction 7), and the yield of hydrocarbons with five or more carbon atoms should be reduced. The addition of P to zeolites can reduce the micropore surface area and strong acid sites. Notably, P(1.4)_450 exhibited a lower n-butene yield than that of P(0)_450 (Table 3). P contents ranging from 0 to 1.4 wt.% may result in micropore surface area and strong acid sites, which suppresses the formation of hydrocarbons with five or more carbon atoms.
The amount of catalyst and the feed gas flow ratio (W/F) will affect the contact frequency between the reaction intermediates and the strong acid. Zeolites with a P content of approximately 1 wt.% had a significantly higher n-butene yield than the C5 yield (Table 3). Therefore, W/F is considered to be one of the promising factors.
The micropore surface area and strong acid sites should be systematically controlled for the design of highly efficient ferrierite zeolite catalysts with low P contents.
3. Materials and Methods
3.1. Catalyst Preparation
A commercial ferrierite zeolite 720NHA was purchased from Tosoh Co., Ltd. (Tokyo, Japan). The manufacturer’s catalog indicates that 720NHA has the following features: SiO2/Al2O3 (mol/mol) = 18.5, cation type = NH4+, crystal size ≤ 1 µm, and particle size = 6 µm. P-loaded zeolites were prepared by the impregnation method. Methanol-based catalytic reactions over P-loaded zeolites with P contents of 0 to 15 wt.% have been reported [39,58]. In this study, a similar range of P contents was set at 0 to 12 wt.%.
The P contents were varied by adding different volumes of phosphoric acid aqueous solution (purity 85%, Fuji Film Wako Pure Chemical Industries, Ltd., Osaka, Japan) to approximately 5 g of zeolite powder. Distilled water was then added, and the mixture was thoroughly mixed. Prior to calcination, the mixture was dried in an oven at 80 °C overnight. The crucible was then heated in a muffle furnace to remove the solvent. The calcination temperatures were 450, 500, 550, and 600 °C. The temperature was increased from room temperature to the desired temperature in 1 h and then held for 2 h.
3.2. Characterization
XRD patterns were acquired using an X-ray diffractometer (RINT TTR III, Rigaku, Tokyo, Japan). The target, voltage, and current were Cu, 50 kV, and 300 mA, respectively. The sampling width was 0.02°, the scan speed was 2°/min, and the range was from 5° to 35°. Peak height indicates crystallinity. The crystal diameter is inversely proportional to the half width of the peak.
Structural parameters were measured using a specific surface area/pore size distribution analyzer (Belsorp-mini II, MicrotracBEL Corp., Osaka Japan). N2 adsorption-desorption isotherms were obtained by measuring the amount of N2 adsorption against pressure. The Brunauer-Emmett-Teller (BET) method was used for the average specific surface area and total pore volume. External surface area, micropore surface area, and micropore volume were evaluated by the t method.
NH3-TPD was performed using a BELCAT-B (MicrotracBEL Corp., Osaka, Japan) equipped with a thermal conductivity detector (TCD). In each run, approximately 0.05 g of zeolite was heated at 10 °C/min to 450 °C under a He stream of 50 mL/min. These conditions are held for 1 h following which the zeolite was cooled to 100 °C and held in these conditions for 10 min. NH3/He mixed gas (5/95 vol%) was supplied at 50 mL/min for 30 min and the zeolite was heated to 700 °C at a heating rate of 10 °C/min under a He flow of 50 mL/min. A Gaussian distribution was assumed for the obtained multiple peaks, and peak separation was performed using the Davidson–Fletcher–Powell (DFP) method. The NH3 molecule and the acid sites were assumed to be bound in a ratio of 1:1. The amounts of weak and the strong acid sites were calculated from the peak areas obtained at low and high temperatures, respectively.
3.3. DTO Reaction
A fixed-bed flow reactor was used for the DTO reaction test [14]. Zeolite (0.2 g) was fixed in a quartz reaction tube (inner diameter 9.0 mm, length 235 mm) using quartz wool. To measure the actual catalyst layer temperature, the tip of the thermocouple was placed near the center of the catalyst layer.
The catalyst layer was heated using an electric furnace while supplying air (200 mL (STP)/min) to the reactor using an air compressor. When the catalyst bed temperature reached approximately 350 °C, the air was switched to DME/N2 [10/90 (v/v), 150 mL (STP)/min]. As the DTO reaction is an exothermic reaction, the temperature of the catalyst layer spontaneously increased. The temperature rise is highly dependent on zeolites. Therefore, it was necessary to adjust the reaction temperature by changing the set temperature for each run. The temperature profiles from 350 to 400 °C slightly depended on zeolites, whereas the heating time was 5 min for all runs. The DME/N2 mixed gas was then set at 49 mL (STP)/min to start the reaction, and the catalyst bed temperature was adjusted to 400 ± 5 °C.
After 10 min of the reaction, the product gas discharged from the reactor was analyzed online using GC-TCD (GC-2014, Shimadzu, Kyoto, Japan) and GC-FID (GC-2014, Shimadzu, Kyoto, Japan). A MICROPACKED-ST column (id: 3.0 mm; length 6 m; Shinwa Chemical Industries Ltd., Kyoto, Japan) was used for GC-TCD. A DB-5 capillary column (id: 0.53 mm; length: 60 m; thickness of the stationary phase: 40 µm; Agilent Technology, Tokyo, Japan) and HP-PLOT/Q (id: 0.53 mm; length: 30 m; thickness of the stationary phase: 40 µm: Agilent Technology, Tokyo, Japan) were connected in series and used for GC-FID.
The heating program of GC-FID was as follows: the temperature was held at 50 °C for 2 min; increased to 90 °C at 8 °C/min and held for 16 min; further increased to 98 °C at 1 °C/min; and finally increased to 180 °C at 8 °C/min and held for 60 min.
The DME conversion and product yield were expressed as follows:
DME conversion [%] = (DMEin [mol] − DMEout [mol])/DMEin [mol] × 100,
Product yield [C-mol%] = C number in product gas [C-mol]/Total C number in feed gas [C-mol] × 100
Quantitative analysis using GC-FID was possible for products comprising up to 4 carbon atoms. Therefore, the DME conversion and product yields of hydrocarbons with ≤4 carbon atoms were calculated by calibrating their area ratio to nitrogen. The effective carbon number of MeOH was set at 0.4.
Many peaks attributed to compounds with 5 or more carbon atoms were observed. The peaks with retention times 36–42, 42–50, and 50–62 could be attributed to carbon numbers 5, 6, and 7, respectively. The effective carbon numbers of hydrocarbons having 5, 6, and 7 carbon atoms were set at 5, 6 and 7, respectively. Based on this assumption, the carbon number of the product was calculated, followed by the product yield.
4. Conclusions
DTO reactions were performed using 20 P-loaded ferrierite zeolites. The physicochemical properties that were highly correlated with n-butene yield were identified via multiple regression analysis. The conclusions of this study are summarized below:
The physicochemical properties of ferrierite zeolites could be systematically changed by changing P contents.
P(0)_450 exhibited the highest n-butene yield (31.2 C-mol%) among the P-loaded ferrierite zeolites with different pore structures and acidic properties.
Multiple regression analysis showed that the physicochemical properties of micropore surface area and strong acid sites explained the n-butene yield of 53.7%.
The reaction mechanism for selective n-butene synthesis except for iso-butene in the DTO reaction was explained by the dual cycle model.
Supplementary Materials
The following supporting information can be downloaded at: https://www.mdpi.com/article/10.3390/catal13071040/s1, Figure S1: XRD patterns of P-modified ferrierite zeolites calcined at 500 °C; Figure S2: XRD patterns of P-modified ferrierite zeolites calcined at 550 °C; Figure S3: XRD patterns of P-modified ferrierite zeolites calcined at 600 °C; Figure S4: N2 adsorption-desorption isotherms for P-modified ferrierite zeolites calcined at 500 °C; Figure S5: N2 adsorption-desorption isotherms for P-modified ferrierite zeolites calcined at 550 °C; Figure S6: N2 adsorption-desorption isotherms for P-modified ferrierite zeolites calcined at 600 °C; Figure S7: NH3-TPD profiles for P-modified ferrierite zeolites at calcined at 500 °C; Figure S8: NH3-TPD profiles for P-modified ferrierite zeolites at calcined at 550 °C; Figure S9: NH3-TPD profiles for P-modified ferrierite zeolites at calcined at 600 °C; Table S1: Supplementary table for multiple regression analysis.
Author Contributions
Data curation, T.H.; writing—original draft preparation, T.H.; writing—review and editing, M.A. and Y.E.; project supervision, Y.E. The manuscript has been read and revised by all the authors before submission. All authors have read and agreed to the published version of the manuscript.
Funding
This work was supported by the Fundamental Research Fund of the National Institute of Advanced Industrial Science and Technology (AIST), Japan. In addition, we did not receive any specific grant from funding agencies in the public, commercial, or not-for-profit sectors.
Data Availability Statement
Not applicable.
Acknowledgments
The authors are grateful for the fundamental grant from AIST and for receiving experimental assistance from Shintaro Ishimaru and Kazuhiro Aya.
Conflicts of Interest
The authors declare no conflict of interest.
References
- Cespi, D.; Passarini, F.; Vassura, I.; Cavani, F. Butadiene from biomass, life cycle perspective to address sustainability in the chemical industry. Green Chem. 2016, 18, 1625–1638. [Google Scholar] [CrossRef]
- Al-Douri, A.; Sengupta, D.; El-Halwagi, M.M. Shale gas monetization—A review of downstream processing to chemicals and fuels. J. Nat. Gas Sci. Eng. 2017, 45, 436–455. [Google Scholar] [CrossRef]
- Abdelrahman, O.A.; Park, D.S.; Vinter, K.P.; Spanjers, C.S.; Ren, L.; Cho, H.J.; Vlachos, G.V.; Fan, W.; Tsapatsis, M.; Dauenhauer, P.J. Biomass-derived butadiene by dehydra-decyclization of tetrahydrofuran. ACS Sustain. Chem. Eng. 2017, 5, 3732–3736. [Google Scholar] [CrossRef]
- Qi, Y.; Liu, Z.; Liu, S.; Cui, L.; Dai, Q.; He, J.; Dong, W.; Bai, C. Synthesis of 1,3-butadiene and its 2-substituted monomers for synthetic rubbers. Catalysts 2019, 9, 97. [Google Scholar] [CrossRef] [Green Version]
- Reschetilowski, W.; Hauser, M.; Alscher, F.; Klauck, M.; Kalies, G. Studies on the binary MgO/SiO2 mixed oxide catalysts for the conversion of ethanol to 1,3-butadiene. Catalysts 2020, 10, 854. [Google Scholar] [CrossRef]
- Sun, D.; Li, Y.; Yang, C.; Su, Y.; Yamada, Y.; Sato, S. Production of 1,3-butadiene from biomass-derived C4 alcohols. Fuel Proc. Technol. 2020, 197, 106193. [Google Scholar] [CrossRef]
- Farzad, S.; Mandegari, M.A.; Görgens, J.F. Integrated techno-economic and environmental analysis of butadiene production from biomass. Bioresour. Technol. 2017, 239, 37–48. [Google Scholar] [CrossRef]
- Kuznetsov, A.; Kumar, G.; Ardagh, A.; Tsapatisis, M.; Zhang, Q.; Dauenhauer, P.J. On the economics and process design of renewable butadiene from biomass-derived furfural. ACS Sustain. Chem. Eng. 2020, 8, 3273–3282. [Google Scholar] [CrossRef]
- Liu, C.; Lu, X.; Yu, Z.; Xiong, J.; Bai, H.; Zhang, R. Production of levulinic acid from cellulose and cellulosic biomass in different catalytic systems. Catalysts 2020, 10, 1006. [Google Scholar] [CrossRef]
- Sobuś, N.; Czekaj, I. Catalytic transformation of biomass-derived hemicellulose sugars by the one-pot method into oxalic, lactic, and levulinic acids using a homogeneous H2SO4 catalyst. Catalysts 2023, 13, 349. [Google Scholar] [CrossRef]
- Hanaoka, T.; Fujimoto, S.; Yoshida, M. Efficiency estimation and improvement of the 1,3-butadiene production process from lignin via syngas through process simulation. Energy Fuel 2017, 31, 12965–12976. [Google Scholar] [CrossRef]
- Hanaoka, T.; Fujimoto, S.; Kihara, H. Improvement of the 1,3-butadiene production process from lignin—A comparison with the gasification power generation process. Renew. Energy 2019, 135, 1303–1313. [Google Scholar] [CrossRef]
- Hanaoka, T.; Fujimoto, S.; Kihara, H. Evaluation of n-butene synthesis from dimethyl ether in the production of 1,3-butadiene from lignin: A techno-economic analysis. Renew. Energy 2021, 163, 964–973. [Google Scholar] [CrossRef]
- Hanaoka, T.; Aoyagi, M.; Edashige, Y. n-Butene synthesis in the dimethyl ether-to-olefin reaction over zeolites. Catalysts 2021, 11, 743. [Google Scholar] [CrossRef]
- Khadzhiev, S.N.; Magomedova, M.V.; Peresypkina, E.G. Kinetic models of methanol and dimethyl ether conversion to olefins over zeolite catalysts (Review). Petrol. Chem. 2015, 55, 503–521. [Google Scholar] [CrossRef]
- Al-Dughaither, A.S.; de Lasa, H. Neat dimethyl ether conversion to olefins (DTO) over HZSM-5: Effect of SiO2/Al2O3 on porosity, surface chemistry, and reactivity. Fuel 2014, 138, 52–64. [Google Scholar] [CrossRef]
- Crodero-Lanzac, T.; Bodríguez-Cano, M.A.; Palomoto, J.; Valero-Romero, M.J.; Aguayo, A.T.; Bilbao, J.; Rodríguez-Mirasol, J.; Cordero, T. Binderless ZrO2/HZSM-5 fibrillar composites by electrospinning as catalysts for the dimethyl ether-to-olefins process. Microporous Mesoporous Mater. 2022, 342, 112102. [Google Scholar] [CrossRef]
- Chen, Z.; Li, Z.; Zhang, Y.; Chevella, D.; Li, G.; Chen, Y.; Guo, X.; Liu, J.; Yu, J. A green route for the synthesis of nano-sized hierarchical ZSM-5 zeolite with excellent DTO catalytic performance. Chem. Eng. J. 2020, 388, 124322. [Google Scholar] [CrossRef]
- Gao, Y.; Cao, Y.; Chen, S.-L.; Wang, Y.; Zhu, R.; Sun, W.; Zhang, Q.; Fan, Y. Differences in product distribution measured with flame ionization detector gas chromatography and thermal conductivity detector gas chromatography during the di-methyl ether-to-olefins and methanol-to-olefins processes. Energy Fuel. 2017, 31, 13266–13272. [Google Scholar] [CrossRef]
- Zhang, S.; Chen, W.; Yang, L.; Xie, T.; Li, W.; Yu, D.; Fang, Y. Effect of morphology and acidity control of Ni-SAPO-34 zeolite on catalytic performance of dimethyl ether to olefins. J. Solid State Chem. 2021, 303, 122503. [Google Scholar] [CrossRef]
- Kubota, Y.; Inagaki, S. High-performance catalysts with MSE-type zeolite framework. Top. Catal. 2015, 58, 480–493. [Google Scholar] [CrossRef]
- Park, S.; Inagaki, S.; Kubota, Y. Selective formation of light olefins from dimethyl ether over MCM-68 modified with phosphate species. Catal. Today 2016, 265, 218–224. [Google Scholar] [CrossRef] [Green Version]
- Han, Q.; Park, S.; Inagaki, S.; Kubota, Y. Selective production of light olefins over MSE-type zeolite catalyst. J. Jpn. Pet. Inst. 2017, 60, 288–300. [Google Scholar] [CrossRef] [Green Version]
- Han, Q.; Enoeda, K.; Inagaki, S.; Kubota, Y. Catalytic performance of Ce-modified MCM-68 zeolite in the dimethyl ether-to-olefin reaction: Impact of high calcination temperature. Chem. Lett. 2017, 46, 1434–1437. [Google Scholar] [CrossRef] [Green Version]
- Ahmed, M.H.M.; Muraza, O.; Al-Amer, A.M.; Sugiura, Y.; Nishiyama, N. Development of desilicated EU-1 zeolite and its application in conversion of dimethyl ether to olefins. Microporous Mesoporous Mater. 2015, 207, 9–16. [Google Scholar] [CrossRef]
- Ahmed, M.H.M.; Muraza, O.; Al-Amer, A.M.; Miyake, K.; Nishiyama, N. Development of hierarchical EU-1 zeolite by sequential alkaline and acid treatments for selective dimethyl ether to propylene (DTP). Appl. Catal. A Gen. 2015, 497, 127–134. [Google Scholar] [CrossRef]
- Liu, Q.; Yoshida, Y.; Nakazawa, N.; Inagaki, S.; Kubota, Y. The synthesis of YNU-5 zeolite and its application to the catalysis in the dimethyl ether-to-olefin reaction. Materials 2020, 13, 2030. [Google Scholar] [CrossRef] [PubMed]
- Nasser, G.; Kurniawan, T.; Miyake, K.; Galadima, A.; Hirota, Y.; Nishiyama, N.; Muraza, O. Dimethyl ether to olefins over dealuminated mordenite (MOR) zeolites derived from natural minerals. J. Nat. Gas Sci. Eng. 2016, 28, 566–571. [Google Scholar] [CrossRef]
- Kurniawan, T.; Muraza, O.; Miyake, K.; Hakeem, A.S.; Hirota, Y.; Al-Amer, A.M.; Nishiyama, N. Conversion of dimethyl ether to olefins over nanosized mordenite fabricated by a combined high-energy ball milling with recrystallization. Ind. Eng. Chem. Res. 2017, 56, 4258–4266. [Google Scholar] [CrossRef]
- Zhao, D.; Zhang, Y.; Li, Z.; Wang, Y.; Yu, J. Synthesis of SAPO-18/34 intergrowth zeolites and their enhanced stability for dimethyl ether to olefins. RSC Adv. 2017, 7, 939–946. [Google Scholar] [CrossRef] [Green Version]
- Zhao, D.; Zhang, Y.; Li, Z.; Wang, Y.; Yu, J. Synthesis of AEI/CHA intergrowth zeolites by dual templates and their catalytic performance for dimethyl ether to olefins. Chem. Eng. J. 2017, 323, 295–303. [Google Scholar] [CrossRef]
- Lee, Y.; Park, M.B.; Kim, P.S.; Vicente, A.; Fernandez, C.; Nam, I.-S.; Hong, S.B. Synthesis and catalytic behavior of ferrierite zeolite nanoneedles. ACS Catal. 2013, 3, 617–621. [Google Scholar] [CrossRef]
- Zhang, S.; Wen, Z.; Yang, L.; Duan, C.; Lu, X.; Song, Y.; Ge, Q.; Fang, Y. Controllable synthesis of hierarchical porous petal-shaped SAPO-34 zeolite with excellent DTO performance. Microporous Mesoporous Mater. 2019, 274, 220–226. [Google Scholar] [CrossRef]
- Klemm, E.; Seitz, M.; Scheidat, H.; Emig, G. Controlling acidity and selectivity of HY-type zeolites by silanation. J. Catal. 1998, 173, 177–186. [Google Scholar] [CrossRef]
- Iida, A.; Nakamura, R.; Komura, K.; Sugi, Y. Remarkable improvement of catalytic performance in dimethyl ether to olefin reaction over CeO2-modified calcium-containing MFI type zeolite. Chem. Lett. 2008, 37, 494–495. [Google Scholar] [CrossRef]
- Hu, Z.; Zhang, H.; Wang, L.; Zhang, H.; Zhang, Y.; Xu, H.; Shen, W.; Tang, Y. Highly stable boron-modified hierarchical nanocrystalline ZSM-5 zeolite for the methanol to propylene reaction. Catal. Sci. Technol. 2014, 4, 2891–2895. [Google Scholar] [CrossRef]
- De Klerk, A. Isomerization of 1-butene to isobutene at low temperature. Ind. Eng. Chem. Res. 2004, 43, 6325–6330. [Google Scholar] [CrossRef]
- Dong, H.; Yu, H.; Wang, L.; Wang, Y.; Zhong, J.; Lian, Y. Catalytic performance of phosphorus modified HZSM-5 zeolite catalysts in the co-cracking reaction of n-hexane and methanol. Catal. Lett. 2022, 152, 1233–1243. [Google Scholar] [CrossRef]
- Niu, X.; Wang, K.; Bai, Y.; Du, Y.; Chen, Y.; Dong, M.; Fan, W. Selective formation para-xylene by methanol aromatization over phosphorus modified ZSM-5 zeolites. Catalysts 2020, 10, 484. [Google Scholar] [CrossRef]
- Omata, K.; Yamaguchi, Y.; Watanabe, Y.; Kodama, K.; Yamada, M. Artificial neural network (ANN)-aided optimization of ZSM-5 catalyst for the dimethyl ether to olefin (DTO) reaction from neat dimethyl ether (DME). Ind. Eng. Chem. Res. 2009, 48, 6256–6261. [Google Scholar] [CrossRef]
- Wei, P.; Zhu, X.; Wang, Y.; Chu, W.; Xie, S.; Yang, Z.; Liu, Z.; Li, Z.; Xu, L. Rapid synthesis of ferrierite zeolite through microwave assisted organic template free route. Microporous Mesoporous Mater. 2019, 279, 220–227. [Google Scholar] [CrossRef]
- Sing, K.S.W.; Everett, D.H.; Haul, R.A.W.; Moscou, L.; Pierotti, R.A.; Rouquél, R.; Siemieniewska, T. Reporting physisorption data for gas/solid systems with special reference to the determination of surface area and porosity. Pure Appl. Chem. 1985, 57, 603–619. [Google Scholar] [CrossRef]
- Wang, X.; Lv, Y.; Zhu, S.; Wang, X.; Deng, C. Phosphoric acid modification of Hβ zeolite for guaiacol hydrodeoxygenation. Catalysts 2021, 11, 962. [Google Scholar] [CrossRef]
- Van der Bij, H.E.; Aramburo, L.R.; Arstad, B.; Dynes, J.J.; Wang, J.; Weckhuysen, B.M. Phosphatation of zeolite H-ZSM-5: A combined microscopy and spectroscopy study. ChemPhysChem 2014, 15, 283–292. [Google Scholar] [CrossRef] [PubMed]
- Al-Dughaither, A.S.; de Lasa, H. HZSM-5 zeolites with different SiO2/Al2O3 ratios. Characterization and NH3 desorption kinetics. Ind. Eng. Chem. Res. 2014, 53, 15303–15316. [Google Scholar] [CrossRef]
- Vu, D.V.; Hirota, Y.; Nishiyama, N.; Egashira, Y.; Ueyama, K. High propylene selectivity in methanol-to-olefin reaction over H-ZSM-5 catalyst treated with phosphoric acid. J. Jpn. Pet. Inst. 2010, 53, 232–238. [Google Scholar] [CrossRef] [Green Version]
- Soh, J.C.; Chong, S.L.; Hossain, S.S.; Cheng, C.K. Catalytic ethylene production from ethanol dehydration over non-modified and phosphoric acid modified Zeolite H-Y (80) catalysts. Fuel Proc. Technol. 2017, 158, 85–95. [Google Scholar] [CrossRef] [Green Version]
- Olsbye, U.; Svelle, S.; Bjørgen, M.; Beato, P.; Janssens, T.V.W.; Joensen, F.; Bordiga, S.; Lillerud, K.P. Conversion of methanol to hydrocarbons: How zeolite cavity and pore size controls product selectivity. Angew. Chem. Int. Edit. 2012, 51, 5810–5831. [Google Scholar] [CrossRef]
- Magomedova, M.; Starozhiskaya, A.; Davidov, I.; Mximov, A.; Kravstov, M. Dual-cycle mechanism based kinetic model for DME-to-olefin synthesis on HZSM-5-type catalysts. Catalysts 2021, 11, 1459. [Google Scholar] [CrossRef]
- Hu, M.; Wang, C.; Gao, X.; Chu, Y.; Qi, G.; Wang, Q.; Xu, G.; Xu, J.; Deng, F. Establishing a link between the dual cycles in methanol-to-olefins conversion on H-ZSM-5: Aromatization of cycloalkenes. ACS Catal. 2020, 10, 4299–4305. [Google Scholar] [CrossRef]
- Sun, T.; Chen, W.; Xu, S.; Zheng, A.; Wu, X.; Zeng, S.; Wang, N.; Meng, X.; Wei, Y.; Liu, Z. The first carbon-carbon bond formation mechanism in methanol-to-hydrocarbons process over chabazite zeolite. Chem 2021, 7, 2415–2428. [Google Scholar] [CrossRef]
- Ortega, C.; Hessel, V.; Kolb, G. Dimethyl ether to hydrocarbons over ZSM-5: Kinetic study in an external recycle reactor. Chem. Eng. J. 2018, 354, 21–34. [Google Scholar] [CrossRef]
- Menges, M.; Kraushaar-Czarnetzki, B. Kinetics of methanol to olefins over AlPO4-bound ZSM-5 extrudates in a two-stage unit with dimethyl ether pre-reactor. Microporous Mesoporous Mater. 2012, 164, 172–181. [Google Scholar] [CrossRef]
- Hill, I.M.; Ng, Y.S.; Bhan, A. Kinetics of butene isomer methylation with dimethyl ether over zeolite catalysts. ACS Catal. 2012, 2, 1742–1748. [Google Scholar] [CrossRef]
- Khitev, Y.P.; Ivanova, I.I.; Kolyagin, Y.G.; Ponomareva, O.A. Skeletal isomerization of 1-butene over micro/mesoporous materials based on FER zeolite. Appl. Catal. A Gen. 2012, 441–442, 123–135. [Google Scholar] [CrossRef]
- Nawaz, Z.; Ziaoping, T.; Jie, Z.; Fei, W.; Naveed, S. Catalytic cracking of 1-hexene to propylene using SAPO-34 catalysts with different bulk topologies. Chin. J. Catal. 2009, 30, 1049–1057. [Google Scholar] [CrossRef]
- Sun, H.; Cao, L.; Zhang, Y.; Zhao, L.; Gao, J.; Xu, C. Effect of catalyst acidity and reaction temperature on hexene cracking reaction to produce propylene. Energy Fuel 2021, 35, 3296–3306. [Google Scholar] [CrossRef]
- Song, Y.; Zhang, L.-L.; Li, G.-D.; Shang, Y.-S.; Zhao, X.-M.; Ma, T.; Zhang, L.-M.; Zhai, Y.-L.; Gong, Y.-J.; Xu, J.; et al. ZSM-5 extrudates modified with phosphorus as a super effective MTP catalyst: Impact of the acidity on binder. Fuel Proc. Technol. 2017, 168, 105–115. [Google Scholar] [CrossRef]
Figure 1.
1,3-BD synthetic process from lignin.
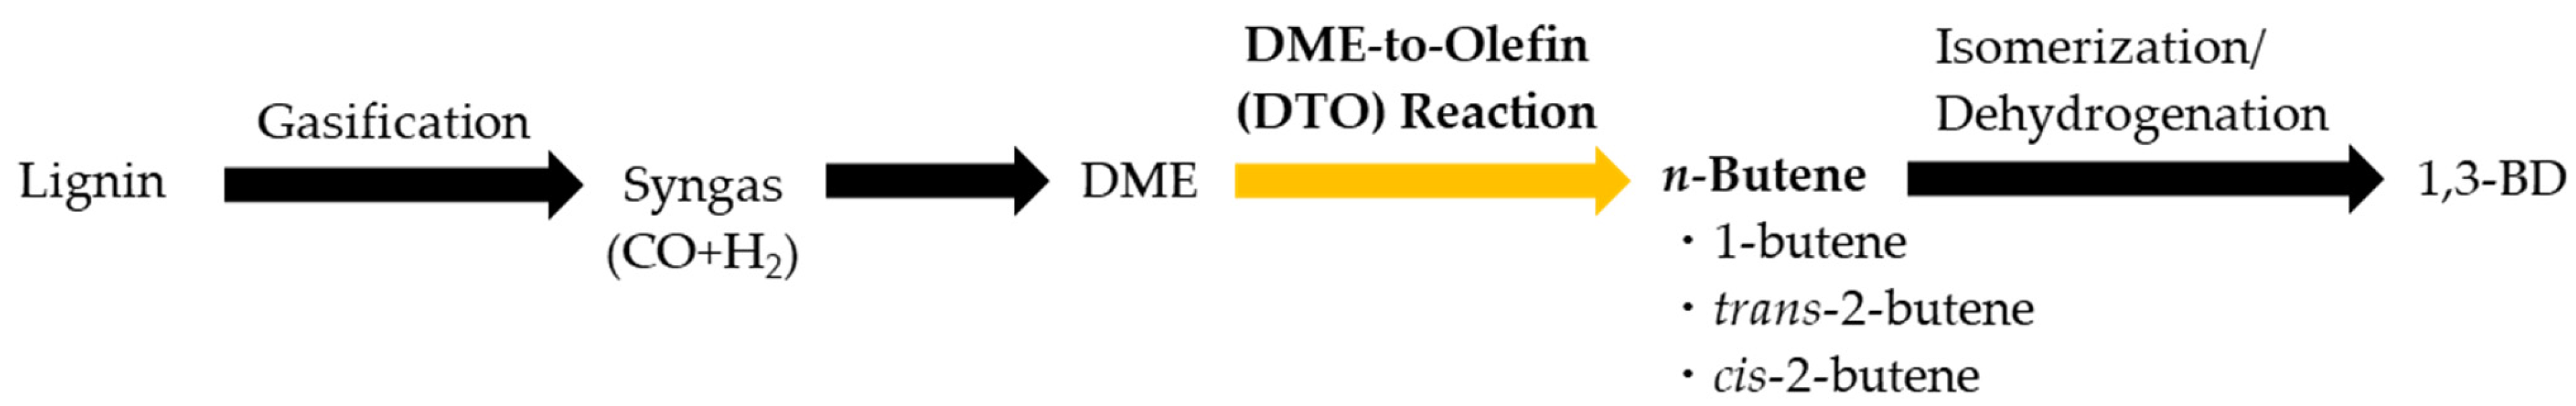
Figure 2.
XRD patterns of P-modified ferrierite zeolites calcined at 450 °C.

Figure 3.
N2 adsorption-desorption isotherms for P-modified ferrierite zeolites calcined at 450 °C.

Figure 4.
NH3-TPD profiles of P-modified ferrierite zeolites calcined of 450 °C.

Figure 5.
Dual cycle model for the DTO reaction mechanism over P-loaded ferrierite zeolites.

Table 1.
Pore parameters for P-modified ferrierite zeolites at different calcination temperatures.
| Catalyst | Surface Area (m2 g−1) | Pore Volume (cm3 g−1) | |||
|---|---|---|---|---|---|
| Total 1 | External 2 | Micro 2 | Total 1 | Micro 2 | |
| P(0)_450 | 297 | 28 | 352 | 0.37 | 0.11 |
| P(1.4)_450 | 280 | 22 | 339 | 0.27 | 0.11 |
| P(3.3)_450 | 148 | 21 | 168 | 0.20 | 0.06 |
| P(6.9)_450 | 27 | 12 | 13 | 0.11 | 0.01 |
| P(12)_450 | 10 | 5 | 5 | 0.04 | 0.00 |
| P(0)_500 | 366 | 27 | 460 | 0.37 | 0.14 |
| P(1.1)_500 | 288 | 21 | 361 | 0.29 | 0.11 |
| P(3.7)_500 | 54 | 20 | 34 | 0.23 | 0.02 |
| P(6.9)_500 | 21 | 14 | 6 | 0.14 | 0.00 |
| P(12)_500 | 11 | 6 | 4 | 0.05 | 0.00 |
| P(0)_550 | 349 | 27 | 436 | 0.33 | 0.13 |
| P(1.1)_550 | 323 | 25 | 392 | 0.37 | 0.12 |
| P(3.3)_550 | 166 | 24 | 189 | 0.32 | 0.06 |
| P(6.9)_550 | 21 | 11 | 8 | 0.15 | 0.01 |
| P(12)_550 | 12 | 3 | 9 | 0.04 | 0.00 |
| P(0)_600 | 380 | 29 | 474 | 0.38 | 0.14 |
| P(1.2)_600 | 306 | 19 | 383 | 0.35 | 0.11 |
| P(3.3)_600 | 190 | 16 | 229 | 0.28 | 0.07 |
| P(6.7)_600 | 16 | 9 | 6 | 0.13 | 0.03 |
| P(12)_600 | 10 | 4 | 5 | 0.05 | 0.03 |
1 calculated using the Brunauer-Emmett-Teller (BET) method, 2 calculated using t-plot.
Table 2.
Acidic properties of P-modified ferrierite zeolites at different calcination temperatures.
| Catalyst | Weak (mmol g−1) | Strong (mmol g−1) | Total (mmol g−1) |
|---|---|---|---|
| P(0)_450 | 1.45 | 1.43 | 2.87 |
| P(1.4)_450 | 1.39 | 1.30 | 2.69 |
| P(3.3)_450 | 1.08 | 1.02 | 2.10 |
| P(6.9)_450 | 0.74 | 0.83 | 1.57 |
| P(12)_450 | 0.54 | 0.60 | 1.14 |
| P(0)_500 | 1.40 | 1.31 | 2.70 |
| P(1.1)_500 | 1.34 | 1.15 | 2.49 |
| P(3.7)_500 | 1.12 | 0.83 | 1.95 |
| P(6.9)_500 | 0.89 | 0.66 | 1.55 |
| P(12)_500 | 0.50 | 0.38 | 0.88 |
| P(0)_550 | 1.45 | 1.37 | 2.82 |
| P(1.1)_550 | 1.24 | 1.06 | 2.29 |
| P(3.3)_550 | 1.10 | 0.86 | 1.96 |
| P(6.9)_550 | 0.63 | 0.54 | 1.17 |
| P(12)_550 | 0.26 | 0.12 | 0.37 |
| P(0)_600 | 1.32 | 1.03 | 2.35 |
| P(1.2)_600 | 1.19 | 0.89 | 2.08 |
| P(3.3)_600 | 1.01 | 0.73 | 1.74 |
| P(6.7)_600 | 0.70 | 0.59 | 1.29 |
| P(12)_600 | 0.33 | 0.20 | 0.53 |
Table 3.
Catalytic performance of P-modified ferrierite zeolites in the DTO reaction.
| Catalyst | DME Conv. (%) | Product Yield (C-mol%) | |||||||||
|---|---|---|---|---|---|---|---|---|---|---|---|
| C1–C3 | C2= | C3= | MeOH | C4 1 | i-C4= | 1,3-BD | n-C4= 2 | C5 | C6≤ | ||
| P(0)_450 | 97.8 | 3.9 | 4.0 | 9.1 | 2.6 | 0.1 | 4.7 | 0.4 | 31.2 | 33.3 | 8.6 |
| P(1.4)_450 | 12.2 | 1.2 | 0.2 | 0.6 | 2.5 | 0.0 | 0.0 | 0.1 | 4.6 | 2.5 | 0.6 |
| P(3.3)_450 | 3.6 | 0.9 | 0.5 | 0.1 | 1.8 | 0.0 | 0.0 | 0.0 | 0.2 | 0.1 | 0.0 |
| P(6.9)_450 | 3.0 | 0.4 | 0.3 | 0.0 | 2.3 | 0.0 | 0.0 | 0.0 | 0.0 | 0.0 | 0.0 |
| P(12)_450 | 1.9 | 0.2 | 0.0 | 0.1 | 1.2 | 0.0 | 0.0 | 0.0 | 0.2 | 0.1 | 0.0 |
| P(0)_500 | 89.5 | 4.9 | 4.8 | 7.2 | 4.1 | 0.3 | 5.8 | 0.3 | 27.8 | 28.8 | 5.7 |
| P(1.1)_500 | 12.6 | 1.2 | 0.1 | 0.5 | 3.0 | 0.0 | 0.1 | 0.1 | 4.5 | 2.5 | 0.6 |
| P(3.7)_500 | 3.2 | 0.9 | 0.3 | 0.1 | 1.5 | 0.0 | 0.0 | 0.0 | 0.3 | 0.1 | 0.0 |
| P(6.9)_500 | 2.9 | 0.7 | 0.3 | 0.0 | 1.9 | 0.0 | 0.0 | 0.0 | 0.0 | 0.0 | 0.0 |
| P(12)_500 | 1.8 | 0.3 | 0.1 | 0.0 | 1.3 | 0.0 | 0.0 | 0.0 | 0.0 | 0.0 | 0.0 |
| P(0)_550 | 93.8 | 6.0 | 5.3 | 7.3 | 5.0 | 0.3 | 5.7 | 0.4 | 29.8 | 28.6 | 5.3 |
| P(1.1)_550 | 7.7 | 1.1 | 0.1 | 0.3 | 2.2 | 0.0 | 0.0 | 0.0 | 2.5 | 1.1 | 0.3 |
| P(3.3)_550 | 3.5 | 0.9 | 0.3 | 0.1 | 2.0 | 0.0 | 0.0 | 0.0 | 0.2 | 0.1 | 0.0 |
| P(6.9)_550 | 2.3 | 0.5 | 0.2 | 0.0 | 1.6 | 0.0 | 0.0 | 0.0 | 0.0 | 0.0 | 0.0 |
| P(12)_550 | 1.3 | 0.3 | 0.0 | 0.0 | 1.0 | 0.0 | 0.0 | 0.0 | 0.0 | 0.0 | 0.0 |
| P(0)_600 | 67.9 | 5.2 | 3.1 | 3.3 | 11.3 | 0.3 | 3.5 | 0.4 | 19.8 | 17.7 | 3.3 |
| P(1.2)_600 | 13.3 | 1.8 | 0.1 | 0.4 | 3.9 | 0.0 | 0.1 | 0.1 | 3.9 | 2.5 | 0.5 |
| P(3.3)_600 | 3.6 | 1.1 | 0.4 | 0.1 | 1.6 | 0.0 | 0.0 | 0.0 | 0.3 | 0.1 | 0.0 |
| P(6.7)_600 | 2.8 | 0.6 | 0.3 | 0.0 | 1.8 | 0.0 | 0.0 | 0.0 | 0.0 | 0.0 | 0.0 |
| P(12)_600 | 3.2 | 0.9 | 0.3 | 0.1 | 1.5 | 0.0 | 0.0 | 0.0 | 0.3 | 0.1 | 0.0 |
1 n-butane + iso-butane, 2 1-butene + trans-2-butene + cis-2-butene.
Table 4.
Tolerance between selected explanatory variables.
| Selected Explanatory Variables | Tolerance |
|---|---|
| x1-x2 | 0.261 |
| x1-x3 | 0.163 |
| x1-x4 | 0.024 |
| x1-x5 | 0.245 |
| x1-x6 | 0.332 |
| x2-x3 | 0.104 |
| x2-x4 | 0.282 |
| x2-x5 | 0.078 |
| x2-x6 | 0.179 |
| x3-x4 | 0.173 |
| x3-x5 | 0.148 |
| x3-x6 | 0.314 |
| x4-x5 | 0.267 |
| x4-x6 | 0.352 |
| x5-x6 | 0.086 |
Table 5.
Multiple regression analysis.
| Trial | Explanatory Variable | RSS | F-Ratio | Regression Equation | Contribution Rate (%) |
|---|---|---|---|---|---|
| 1 | None | 3086 | |||
| 2 | x1 | 1150 | 30.30 | y = −1.76 + 0.04 x1 | 49.9 |
| 3 | x1, x2 | 1119 | |||
| x1, x3 | 1141 | ||||
| x1, x5 | 1145 | ||||
| x1, x6 | 1062 | 1.41 | y = −7.01 + 0.03 x1 + 9.97 x6 | 53.7 | |
| 4 | x1, x6, x2 | 1060 | 0.03 | y = −6.81 + 0.03 x1 + 11.32 x6 − 0.10 x2 | 53.8 |
| x1, x6, x3 | 1018 | 0.68 | y = −5.08 + 0.04 x1 + 12.54 x6 − 31.74 x3 | 55.6 |
Disclaimer/Publisher’s Note: The statements, opinions and data contained in all publications are solely those of the individual author(s) and contributor(s) and not of MDPI and/or the editor(s). MDPI and/or the editor(s) disclaim responsibility for any injury to people or property resulting from any ideas, methods, instructions or products referred to in the content. |
© 2023 by the authors. Licensee MDPI, Basel, Switzerland. This article is an open access article distributed under the terms and conditions of the Creative Commons Attribution (CC BY) license (https://creativecommons.org/licenses/by/4.0/).
Share and Cite
MDPI and ACS Style
Hanaoka, T.; Aoyagi, M.; Edashige, Y. Improvement of n-Butene Yield in Dimethyl Ether-to-Olefin Reaction Using Ferrierite Zeolite Catalysts. Catalysts 2023, 13, 1040. https://doi.org/10.3390/catal13071040
AMA Style
Hanaoka T, Aoyagi M, Edashige Y. Improvement of n-Butene Yield in Dimethyl Ether-to-Olefin Reaction Using Ferrierite Zeolite Catalysts. Catalysts. 2023; 13(7):1040. https://doi.org/10.3390/catal13071040
Chicago/Turabian StyleHanaoka, Toshiaki, Masaru Aoyagi, and Yusuke Edashige. 2023. "Improvement of n-Butene Yield in Dimethyl Ether-to-Olefin Reaction Using Ferrierite Zeolite Catalysts" Catalysts 13, no. 7: 1040. https://doi.org/10.3390/catal13071040
Note that from the first issue of 2016, this journal uses article numbers instead of page numbers. See further details here.