
Mechanistic Kinetic Modelling Framework for the Conversion of Waste Crude Glycerol to Value-Added Hydrogen-Rich Gas


1
Clean Energy Technologies Research Institute (CETRI), Process Systems Engineering, Faculty of Engineering and Applied Science, University of Regina, 3737 Wascana Parkway, Regina, SK S4S 0A2, Canada
2
Petroleum Systems Engineering, Faculty of Engineering and Applied Science, University of Regina, 3737 Wascana Parkway, Regina, SK S4S 0A2, Canada
*
Author to whom correspondence should be addressed.
Catalysts 2022, 12(2), 200; https://doi.org/10.3390/catal12020200
Submission received: 29 December 2021
/
Revised: 1 February 2022
/
Accepted: 4 February 2022
/
Published: 7 February 2022
(This article belongs to the Special Issue Catalytic Conversion of Glycerol)
Abstract
:The kinetics for crude glycerol autothermal reforming was studied over S/C ratio of 2.6 and O2/C ratio of 0.125 using 5% Ni/CeZrCa catalyst. Both power law and mechanistic kinetic models were studied. The overall power law model for crude glycerol autothermal reforming was investigated with a pre-exponential factor of 4.3 × 10¹⁰ mol/gcat·min and activation energy of 8.78 × 10⁴ J/mol. The reaction orders with respect to crude glycerol, water and oxygen are 1.04, 0.54 and 1.78 respectively. The power law model presented an absolute average deviation of 5.84%, which showed a good correlation between the predicted and experimental rate. Mechanistic models were developed for crude glycerol autothermal reforming. For steam reforming, the Eley–Rideal approach best described the reaction rate with the surface reaction being the rate-determining step (AAD < 10%). The kinetics of the total oxidation reaction was best described by the power law model with an AAD of less than 1%, whereas for the TOR process, the molecular adsorption of crude glycerol with an AAD of 14.6% via Langmuir Hinshelwood Hougen-Watson approach was best. CO2 methanation resulted in an AAD of 5.8% for the adsorption of carbon dioxide (CO2) by the Eley–Rideal mechanism.
1. Introduction
The production of net-zero fuels has taken on intense focus in recent years as the world works to produce substitutes for hydrocarbon fuels, where their combustion emissions contribute to ongoing climate change. While there are a variety of fuels to consider, they are generally either zero-emission fuels (as in the case of hydrogen, which produces water vapour when combusted), or are net-zero emission fuels as may be the cases in biodiesel production (where the inputs may themselves be derived from plant-based wastes and feedstocks). Production of biodiesel in particular is an interesting net-zero fuel, since its application areas (e.g., heavy-duty construction and agricultural equipment, remote location baseload and on-demand power generation, etc.) are challenging to decarbonize through either electrification or hydrogen fuel vectors. Furthermore, upcoming legislative changes in Canada will see greater emphasis placed on low-emission fuels, where biodiesel may be used as a blending feedstock for petroleum products retailers to meet these requirements and continue serving their customers.
The production of biodiesel from plant and animal oils is relatively straightforward, in that triglycerides present in biological oils undergo transesterification in the presence of an alcohol like methanol and a catalyst to produce biodiesel and glycerol (C3H8O3), which must be separated from one another in order to produce marketable biodiesel [1]. With biodiesel production expected to total 46 billion liters per year from 2023 to 2025 [2], the production of crude glycerol will total an estimated 4.6 billion liters through the same period (presuming a 10% co-production with biodiesel [3,4,5]). This presents a challenge: while there is a growing need for biodiesel (therein presenting a market opportunity for producers), by-product glycerol has limited marketable uses even at current production volumes.
The bottleneck presented by co-production of glycerol has prompted much work on the conversion and use of glycerol in value-added applications [6,7,8]. Investigations have explored the conversion of glycerol to different acids, alcohols and diols, ethers, acrolein, glycerol carbonate, and other commercial chemicals (see Table 1, below). In addition, investigators have also explored the reforming of glycerol into synthesis gas [9,10,11]—a compelling option if this reforming can be completed autothermally and produced hydrogen can either be captured for fuel use or incorporated into existing hydrogen supply networks (e.g., in the case where a biodiesel facility is integrated into a petrochemical complex). A further advantage may be realized if glycerol can be reformed on a ‘feed-flexible’ basis—i.e., where crude glycerol (subject to minimal treatment) can be reacted directly to produce synthesis gas, and crude glycerol composition can be free to fluctuate as reaction conditions and feed sources change.
Crude glycerol reforming is not as straightforward as what might be assumed for the reforming of pure glycerol; following separation of crude biodiesel, crude glycerol may contain other impurities like residual methanol, soaps (from saponification side reactions [17]), water, and residual free fatty acids (FFAs) and fatty acid methyl esters (FAME) not recovered to the biodiesel stream [18]. In this case, the reforming of crude glycerol involves not just the reforming of glycerol itself, but potentially that of its contaminants and intermediate products as well.
The reforming of glycerol itself has been investigated in the literature. Sundari and Vaidya [19] studied the kinetics of pure glycerol steam reforming over Ru/Al2O3 catalyst. In their work, glycerol decomposition and water–gas shift were the primary reactions. In deriving the mechanistic equation, the process description included reversible glycerol adsorption, Eley–Rideal reaction of adsorbed glycerol with gas-phase steam, decomposition of the adsorbed compex to intermediates, and ultimately to gas-phase carbon dioxide and hydrogen. Their studies were conducted at a temperature of 350–500 °C and a steam-to-glycerol ratio of 3 to 12. Cheng et al. [20] studied the kinetics of glycol steam reforming using a Co-Ni/Al2O3 catalyst. The study parameters ranged between a steam-to-carbon ratio of 3:1 to 12:1 and a temperature of 773 to 823 K, all at a pressure of 1 atm. Power law, single- and dual-site Eley–Rideal (ER) and Langmuir–Hinshelwood–Hougen–Watson (LHHW) models were derived and parameterized, with the LHHW model describing molecular adsorption of glycerol and steam onto the catalyst surface with rate-limiting surface reaction prevailing as the most accurate model. Authayanun et al. [21] studied the thermodynamics of hydrogen production for fuel cells via the autothermal reforming of crude glycerol, where the composition of crude glycerol was dependent on the raw material used for upstream biodiesel production. The parameters analysed were operating temperature, oxygen-to-feed (crude glycerol) ratio, and steam-to-feed ratio. The crude glycerol was modeled as a mixture of pure glycerol and methanol. The product composition in their studies was solely based on thermodynamic analysis, leaving out the effects of a catalyst. They concluded that the most suitable oxygen-to-carbon ratio resided in the range of 0.4–0.7, depending on the purity of the crude glycerol, and also found that the oxygen requirement (to maintain autothermal conditions) increased as the feed flow of steam increased and the ratio of methanol to glycerol decreased. Liu and Lawal [22] developed a kinetic rate expression for the autothermal reforming of glycerol over a monolith catalyst, based on a LHHW mechanism. The standard operating conditions chosen were: 650 °C, 1 atm, steam-to-carbon ratio of 0.4, and oxygen-to-carbon ratio of 0.15. The atomic matrix approach was used to determine the number of independent reactions which could be used to describe the overall autothermal reforming process. For a catalyst weight above 0.012 g, it was found that all of the oxygen fed to the reactor was consumed—prompting only the steam reforming and water–gas shift reactions to be modelled. Both single-site and dual-site LHHW mechanisms were proposed, with the main difference between models being the assumption of whether adsorption was dissociative or non-dissociative. It was also noted, given the removal of water from glycerol, that the adsorption of OH on the active site was likely.
Reaction schemes proposed in literature are noted below in Table 2.
Kinetic studies were completed by Ghani et al. [18] in our laboratories for the autothermal reforming of synthetic crude glycerol over a 5% Ni/CeZrCa catalyst with operating ranges of 773–873 K, 0.05–0.20 O/C ratio, and 1.6–3.6 S/C ratio. Power law modelling showed a first-order dependence on crude glycerol, a 0.5-order dependence on steam, and a second-order dependence on oxygen partial pressure.
To our present awareness, however, there does not seem to be available in literature a detailed mechanistic analysis of crude glycerol reforming kinetic data. As such, the objective of this present study (having access to the raw kinetic data produced by Ghani et al. [9]) is to postulate an appropriate set of mechanistic rate expressions that reflect the kinetics of crude glycerol reforming. In addition to this, use of the mechanistic rate expressions will be featured as part of reactor simulations to conduct a parametric study of reactor performance using this catalyst.
2. Preceding Experimental and Analytical Work
2.1. Catalyst Development and Kinetic Testing
The experimental data used were taken from the preceding study by Ghani et al. [18], which will be briefly reviewed here.
An initial catalyst screening study was conducted by the same investigators [23], testing the effect of gadolinium, magnesium, and calcium promoters on ceria–zirconia catalyst support. Surfactant-assisted support precipitation using cetyltrimethylammonium bromide (CTAB) was used, where nitrate salts of catalyst support precursors were mixed with CTAB in a 0.5:1 surfactant-to-metal molar ratio. This solution was then pH adjusted using ammonium hydroxide and aged for five days at 90 °C, where the precipitate was then filtered, washed, and dried at 120 °C for 12 h. The catalyst support was then calcined at 650 °C for 3 h, and next underwent incipient wetness impregnation to achieve a metal loading of 5% nickel (using nickel nitrate solution) prior to being calcined again at the same conditions and duration. For the prepared catalysts, a series of reactor tests were completed to perform a parametric analysis of various catalyst preparation factors including support promoter, reduction temperature, calcination temperature, steam-to-carbon ratio, and oxygen-to-carbon ratio. These parameters were evaluated for the autothermal reforming of crude glycerol, which was prepared based on the compositional analysis of industrially sourced crude glycerol received from a Canadian biodiesel producer (containing 45.6% free glycerol, 11.2% methanol, 8.3% water, 29.1% potassium palmitate soap, 3.8% oleic acid, and 1.0% sodium chloride). This screening study determined the most preferable catalyst for autothermal crude glycerol reforming to be calcium-promoted nickel–ceria–zirconia. Greater details are provided in Ghani et al. [23].
Catalyst activity testing and kinetic data collection were conducted within an electrically heated packed bed tubular reactor (12.7 mm internal diameter by ~45 mm reaction zone length), illustrated in Ghani et al. [18]. Ni/CeZrCa Catalyst (diluted with alumina) loaded into the reactor was first heated to 600 °C under pure nitrogen atmosphere, and then (once stable temperature was achieved) reduced under 100 mL/h of 5% hydrogen (in nitrogen) gas flow for two hours. Once complete, inlet gas flow was switched to compressed air supply, and the crude glycerol syringe pump (loaded with crude glycerol) was set at a rate of 0.15 mL/min [24]. Air flow was adjusted to meet the required oxygen-to-carbon ratio, while the crude glycerol water was mixed with water to achieve the required steam-to-carbon ratio. Temperature was monitored using a K-type thermocouple placed within the reactor. Reactor effluents were cooled using a water-cooled condenser, with remnant gases directed to gas chromatography for analysis. Lastly, integral reactor test data was taken to determine a power law model that could replicate the experimentally observed conversion of crude glycerol.
2.2. Preceding Reaction Rate Power Law Modelling
Ghani et al. [18] developed an empirical formula for crude glycerol (), with the overall stoichiometric equation for autothermal reforming being:
According to Ghani et al. [18], a typical autothermal reaction is composed of steam reforming and partial oxidation as well as methanation, methane dry reforming, glycerol decomposition, coke formation, and other associated reactions. Some of the reactions involved are as follows:
With the wide variety of possible reactions involved in the autothermal reforming of hydrocarbons and oxy-hydrocarbons, it is prudent to know which exact reactions define the system. As noted by Liu and Lawal [22], a matrix approach is used to obtain the rank of the matrix—indicating the number of independent reactions describing the system being studied. The matrix (shown in Table 3) is constructed by identifying the atomic species C, H, and O present in each of the possible chemical species consumed or formed during the autothermal reforming of glycerol. For a total of six (6) possible species, and finding this constructed matrix to be rank three (3), taking the difference reveals the number of independent reactions—totalling three (3)—that may be used to represent this system.
Based on the final stoichiometric equation proposed by Ghani et al. [9], and based on GC analysis, it could be inferred that the three (3) main reactions are:
- Steam reforming.
- Total oxidation (where the formation of carbon monoxide was not observed).
- Carbon dioxide methanation (where the formation of methane was observed).
The power law rate expression is written in terms of reactant and/or production concentrations. It can consider the reversibility and irreversibility of the reaction. Assuming the overall reaction is elementary, the power law rate expression can be given in terms of the stoichiometric coefficients observed in Equation (1).
For the reversible power law expression, both the forward and reverse reactions are considered as follows:
For the irreversible case, only the forward reaction is considered:
2.3. Preceding Reactor Modelling in COMSOL
A straightforward reactor modelling study using the power law developed by Ghani et al. [18] was completed by Afabor et al. [25]. A transient two-dimensional axisymmetric pseudo-homogeneous reactor model was developed within COMSOL Multiphysics to replicate the experimental reactor. Comparison between experimental and calculated results indicated an AAE of 8.9%. The effect of including vs. excluding the axial dispersion term in the reactor model was determined to be negligible, while parametric simulations of crude glycerol conversion versus space velocity and reaction temperature.
As part of their conclusions, Afabor et al. [25] recommended that the next step in their line of investigation be to consider the development of a more generalized model. In the work described here, a mechanistic vs. power law type reaction rate expression is developed to help expand this generality. Furthermore, one-dimensional vs. two-dimensional reactor modelling frameworks, both respectively considering a pseudo-homogeneous and simplified heterogeneous modelling approach, are developed in MATLAB and COMSOL, respectively, and the simulation results of these reactor models are compared. Parametric study of the reactor using the mechanistic model and the reactor models developed is also provided.
3. Kinetic Analysis
3.1. Verification of Absence of Transport Limitations
In their preceding work, Ghani et al. [18] conducted qualitative experimental testing to confirm the absence of transport limitations that may lead to misinterpretation of kinetic data. This took the form of comparisons between pellet size and crude glycerol conversion, as well as reactant flow rate and crude glycerol conversion. Observing no correlations in either case, it was determined that the selected pellet size (0.8 mm) and tested flow rate conditions would not present any transport limitations.
However, greater confidence in this assertion was desired. Transport limitations may be tested quantitatively following defined criteria to evaluate the presence of transport limitations.
Internal heat transfer limitations may be assessed via the following expression [26]:
In this expression, is the maximum observed thermal gradient within the catalyst pellets, is the species effective diffusivity (which may be calculated from the Bosanquet approximation between molecular diffusivity and Knudsen diffusivity [27]), and are the species concentrations at the catalyst surface and core, is the heat of reaction, and is the catalyst pellet effective thermal conductivity. Evaluation of the kinetic data indicated was found to be 0.15 K, indicating no significant thermal gradients within the catalyst pellets.
External heat transfer limitations may be assessed by [26]:
In this expression, is the maximum observed thermal gradient existing across the catalyst thin film (i.e., gas-phase boundary layer at the catalyst solid surface), is the characteristic length (which, for a spherical geometry, will be one-third of the catalyst radius), is the observed reaction rate, and is the convective heat transfer coefficient calculated for the catalyst thin film. Evaluation of the kinetic data indicated was found to be 0.6 K, indicating no significant thermal gradients existed between the catalyst pellets and the bulk gas.
A more rigorous criterion developed by Mears [28,29] was also used to evaluate the presence of thermal gradients in the catalyst thin film. The criterion is given as:
In this expression, is the catalyst bed bulk density, is the catalyst pellet radius, is the activation energy, is the reaction temperature, and is the universal gas constant. Calculation of this ratio reveals a value of 0.02, again indicating that thin film heat transport limitations did not exist.
Catalyst internal mass transfer limitations may be assessed using the Weisz–Prater criterion, expressed as [27,30]:
Calculation of the Weisz–Prater criterion revealed a value of 0.24, satisfying the condition implying no presence of significant intraparticle mass transfer limitations.
Catalyst thin film mass transfer limitations may be assessed by the following expression [26]:
Here, represents the catalyst thin film mass transfer coefficient. This ratio was calculated to be 0.0069, indicating that there was no significant limitation caused by thin film mass transfer.
Again, the more rigorous criterion given by Mears [28] for mass transfer limitations in the catalyst thin film was also considered. The criterion is defined as:
Here, represents the order of the reaction. This ratio was calculated to be 0.072, well below the limit of 0.1—indicating further that catalyst thin film mass transfer limitations were not present.
3.2. Mechanistic Model Development
Following the approach of Liu and Lawal [22], the autothermal reforming of crude glycerol was subdivided into three (3) independent reactions, where the kinetics were studied for each reaction. Reaction mechanisms following the Eley–Rideal (ER), and Langmuir–Hinshelwood–Hougen–Watson (LHHW) were developed for each of these reactions. For the sake of simplicity, crude glycerol was written out as pure glycerol in both the derived mechanistic rate expression as well as for the reversible and irreversible power law rate expressions. The reactions considered were as follows:
3.2.1. Glycerol Steam Reforming (SR)
The steam reforming reaction occurs when steam reacts with crude glycerol to form carbon dioxide and hydrogen gas. The stoichiometric equation for this reaction is given in Equation (17). According to Sundari et al. [19] and Cheng et al. [20], a plausible mechanism for glycerol steam reforming often includes dehydrogenation and scission of C-C and C-O bonds as well as dehydration and hydration reaction steps.
In the Eley–Rideal approach, it was assumed that steam reforming did not produce methane as one of the products, and that the mechanism followed a reactant adsorption, surface reaction, and product desorption process. Vacant active sites were also accounted for in the site balance. The hypothesized mechanism is described as follows:
In the LHHW approach, the assumption is made that both crude glycerol and steam adsorb to the catalyst active site. The approach of Cheng et al. [20] was modified to consider both molecular and atomic adsorption of the reactants in order to gain a better understanding of the mechanism. The mechanism is as follows:
The proposed rate expressions for crude glycerol steam reforming are presented in Table 4 below.
3.2.2. Total Oxidative Reforming (TOR)
Oxidation reactions can be categorized into either total oxidation or partial oxidation. For partial oxidation, the obtained products are CO and H2 [31,32,33,34], whereas for total oxidation the products formed are CO2 and H2O [35,36,37]. In this work, crude glycerol is reacted with oxygen to produce carbon dioxide and water. The reaction is exothermic and is given by Equation (18).
In the Eley–Rideal model, oxygen was assumed to be absorbed onto the catalyst active site with crude glycerol existing in the bulk gas phase. This assumed a single site mechanism as follows:
A variation of this mechanism, considering dissociative vs. molecular adsorption of oxygen, was also investigated. The mechanism is as follows:
In the Langmuir–Hinshelwood model, oxygen and crude glycerol are both adsorbed onto the active sites. The mechanism is described below.
The proposed rate expressions for crude glycerol oxidation are presented in Table 5 below.
3.2.3. Carbon Dioxide (CO2) Methanation
Carbon dioxide methanation occurs between carbon dioxide and hydrogen gas to form steam and methane gas—an undesired product in this work. This reaction is exothermic and is given by equation (19). Both power law rate expressions and mechanistic rate expressions were considered in this work. For the power law rate expression, the assumption of an irreversible reaction resulted in a high AAD relative to experimental data. As such, a mechanistic model formulation similar to Koschany et al. [39], where kinetics via PLM and LHHW were studied over a NiAl(O)x catalyst, was adopted to improve the AAD than just the conventional Arrhenius-style power law expression, where the reversibility of the methanation reaction was accounted for. Attempts were made to fit other models from the literature to the experimental data, but none were successful. Additional information on CO2 methanation is available from Amaral [40].
Two main groupings of mechanistic Eley–Rideal models were hypothesized. The first is based on carbon dioxide onto the active site:
The second considers hydrogen adsorption onto the active site:
4. Results and Discussion
4.1. Parameter Estimation
The values of the parameters were estimated using Non-Linear Regression Software (NLREG) and MATLAB 2017a. NLREG uses the Levenberg–Marquardt algorithm. In addition, parity plots were drawn to analyse the deviation of the predicted rates from the experimental ones. Models presenting an average absolute error (AAD) in excess of 20% were rejected. The parameter estimates for the successful rate expressions are shown in Table 9, Table 10, Table 11 and Table 12.
4.2. Thermodynamic Scrutiny
The successful mechanistic models were next subjected to thermodynamic scrutiny so as to evaluate their thermodynamic consistency. The most commonly used criteria are the Boudart–Mears–Vannice (BMV) rules [30,42] which are what is used here. The Van’t Hoff equation is the basis for thermodynamic scrutiny, and is given as follows:
where is enthalpy, is entropy, is the universal gas constant, and is the adsorption constant, expressed as:
where is the adsorption constant, and is the heat of adsorption.
The BMV criteria are given below in Equations (49)–(51). The resulting thermodynamic scrutiny for each model is given in Table 13, Table 14 and Table 15.
4.3. Comparison with Other Literature Studies
An activation energy comparison with available literature was done where the activation energy for the power law models was compared with available literature (a summary is given in Table 16 below). In the absence of heat and mass transfer resistances, the activation energies for steam reforming, total oxidation, and CO2 methanation were found to be 8.09 × 10⁴ kJ/mol, 8.7 × 10⁴ kJ/mol, and 8.86 × 10⁴ kJ/mol, respectively. Variation between these activation energies may be attributed to variation between experimental conditions like steam–arbon ratio, oxygen–carbon ratio, or temperature ranges used. Other contributing factors might be the type of catalyst, feed flow rate, and the initial mole fractions of reacting species present in the solution.
5. Reactor Simulation
5.1. Modelling Approach and Solution Method
Transient one-dimensional pseudo-homogeneous and simplified heterogeneous reactor models were constructed following a cell-centred finite difference numerical discretization scheme programmed into MATLAB 2017a to draw a comparison between the suitability of the two approaches for simulating the reforming of crude glycol in the experimental reactor used for the kinetic studies. The expressions for these models are presented in Table 17 and Table 18. The boundary conditions applied are summarized in Table 19.
5.2. Review and Discussion of Simulation Results
5.2.1. Model Validation
Crude glycerol conversion predicted by the one-dimensional pseudo-homogeneous and heterogeneous reactor models developed in MATLAB were validated against the experimental work conducted by Ghani et al. [18], finding the absolute average deviation (AAD) to be 10.0% and 12.7% for each respective model. Furthermore, two-dimensional pseudo-homogeneous and heterogeneous reactor models developed in COMSOL were also validated against experimental results. The maximum absolute average deviation (AAD) between the conversions was 12.08 % and 13.12 % for the 2D PH and 2D HET models, respectively. The variations in the validation results may be as a result of the assumptions made like incompressible fluid, constant velocity and the variabilities in estimating thermo-physical properties of the reactants and products [48].
Additionally, the mole fraction was also validated with the experimental results. Table 23 illustrates the average absolute error between the predicted and experimental mole fractions for each of the species noted. In general terms, the one-dimensional pseudo-homogeneous modelling approach produced simulated results closer to the experimental observations than other modelling approaches did. It is interesting to note varied comparisons in the errors observed for each species. In the case of oxygen, greatest accuracy was found for the 1D pseudo-homogeneous model, whereas methane outlet concentration was predicted best by the 2D heterogeneous model (despite there being significant errors using this model for oxygen, carbon dioxide, and hydrogen). Carbon dioxide appeared to be best represented by the one-dimensional models vs. two dimensional models.
Parity plots for both the one-dimensional pseudo-homogeneous and heterogeneous models are given in Figure 4. The two-dimensional pseudo-homogeneous model led to closer predictions of experimental results than the two-dimensional heterogeneous model. It was found that the numerical solution overpredicted CO2 and N2 and underpredicted H2. It could be that the assumptions made for the numerical model at the early stages and exit deviated slightly from the experimental ones. In addition, the conversion from the experimental work was higher at the inlet conditions for the experimental work than it was for the numerical. Thus, the numerical model is better at predicting the conversion of crude glycerol found from the experiments between a range of 0.58–0.8.
5.2.2. Comparison between Modelling Approaches
A comparison was made between the one-dimensional models (developed in MATLAB) and the two-dimensional models (developed in COMSOL). Reactor profiles generated for temperature, species mole fraction, and crude glycerol conversion were compared between each model. In comparing the results of the one-dimensional pseudo-homogeneous and heterogeneous models, negligible difference was observed in terms of predicted species mole fractions (as seen in Figure 5). The only substantial difference noted was that of predicted temperature profile, where the heterogeneous model predicted a reactor outlet temperature of about 20 K higher than what was predicted by the pseudo-homogeneous model. Similar results were observed by Halabi et al. [49] and Lordanidis [50], and are likely the result of the incorporation of thin-film heat transfer resistance in the heterogeneous model (which is otherwise ignored in the pseudo-homogeneous model). The increased resistance to removing heat from the catalyst surface raises the catalyst surface temperature, raising the reaction rate and further increasing the rate of heat generation.
Comparison of the two-dimensional reactor models developed in COMSOL showed a higher conversion of crude glycerol in the first half of the reactor versus the one-dimensional models developed in MATLAB. This difference could be attributed to the inclusion of axial dispersion in the one-dimensional models (whereas this was omitted from the two-dimensional models). Temperature profiles generated by the two-dimensional models presented the same general trends as the one-dimensional cases. The reaction rate is high close to the entrance of the reactor due to the higher reactant concentrations. Exothermic reactions taking place at the entrance of the reactor may have contributed to the higher temperatures observed relative to the latter half of the reactor which was almost flat due to the dominance of endothermic reactions. The heat produced by the exothermic reactions was consumed by the endothermic reaction, with the overall autothermal reforming process being sustained throughout the reactor. As such, there was no substantial decrease in temperature at the outlet.
Crude glycerol conversion for each reactor modelling approach were compared in Figure 6. When the conversions were compared, it was seen that the predicted conversion was highest using the two-dimensional heterogeneous model, followed by the one-dimensional pseudo-homogeneous model, the two-dimensional pseudo-homogeneous model, and lowest using the one-dimensional heterogeneous model. This could be because of the additional terms added to the two-dimensional models, predicting stronger mixing of reactants and therein higher reaction rates and conversion. Another possible difference may be in the assumptions involved in each respective model. Noting this; however, it is important to bear in mind that each modelling approach presents similar predictions of crude glycerol conversion at the reactor outlet, with the most significant variation being seen within the first 20 mm of the reactor. Lastly, it was found that there was no significant variation in concentration in the radial direction for the two-dimensional models. In this case, combined with the better reflection of experimental data (as noted in Table 23), one-dimensional reactor modelling approaches are sufficient for modelling the autothermal reforming of crude glycerol.
5.2.3. Effects of Temperature
Temperature is an important factor that favours the kinetics of the system. From Figure 7, it can be seen that (at a particular space time) increasing the temperature increases the crude glycerol conversion of the system. According to Jimmy et al. [51], to achieve thermoneutral conditions for autothermal reforming of crude glycerol, the optimum conditions of S/C = 2.6 with an adiabatic temperature of 923 K yields maximum hydrogen. Furthermore, compared to the simulation results of Afabor et al. [25] (calculated for a space velocity of 6.0 gcat·min/mol vs. 12.71 gcat·min/mol considered here), much lower reactor outlet crude glycerol conversions are noted (e.g., for 673 K, Afabor et al. indicate ~40% conversion versus 10.9% indicated here; similarly, ~70% conversion is indicated in the previous study versus 46.3% indicated here).
5.2.4. Effects of Axial Dispersion
Axial dispersion was found to have negligible effect on the predicted exit mass fractions of each species, as shown in Figure 8. This can be attributed to the plug flow criterion (). Additionally, at steady state, the complete mixing and the plug flow condition also ensures no back mixing. Thus, little to no variation is seen in the profile. Figure 9 also shows the effect of axial dispersion on the reactor temperature profile, revealing that the inclusion and exclusion of this term has virtually no impact on the predicted temperature profile. Overall, it is observed that the axial dispersion term has a negligible effect on model predictions.
5.2.5. Effects of Space Velocity on Reactor Performance
The overall aim of reactor design is to enhance its performance. In this work, the performance is analysed in terms of crude glycerol conversion and hydrogen yield. From Figure 10, it is seen that increasing the space time results in an increase in both crude glycerol conversion and hydrogen yield. The weight-time (W/FA0) used were 12.71, 50.94, 76.47 and 101.94 gcat·min/mol with associated conversions of 38%, 59%, 73% and 88%, respectively. In fact, at the entrance of the reactor, a sharp increase in crude glycerol conversion and hydrogen yield was observed within the first half of the reactor length, followed by a slight continued increase in the second half. At a reactor length of 0.025 m, about 93 % of the crude glycerol conversion and hydrogen yield had been obtained and thus only 7 % more conversion and yield could be achieved by the remaining 0.02 m. Again drawing comparison with the preceding study of Afabor et al. [25], lower relative crude glycerol conversions were predicted (e.g., where Afabor et al. predicted ~74% conversion for a space velocity of 10.8 gcat·min/mol, simulation results shown here predicted 37.9%).
5.2.6. Effects of Reactor Catalyst Bed Length on Conversion
The degree of crude glycerol conversion observed in fixed-bed catalytic reactors is also dependent on the residence time, generally defined by the catalyst bed length. Logically, longer catalyst bed lengths result in greater residence time—at the cost of increased tube and catalyst materials. It is, therefore, important to understand the trade-off between catalyst bed length and observed crude glycerol conversion. Simulations were conducted at varying catalyst bed lengths of 45 mm, 75 mm and 100 mm (see Figure 11), resulting in crude glycerol outlet conversions of 84%, 88% and 90%, respectively. It can also be observed that a substantial amount of crude glycerol conversion occurs at the inlet of the reactor, within only a marginal incremental conversion observed beyond a catalyst bed length of 10 mm. Depending on the difficulty of downstream separations, it may even be reasonable to consider an 80% conversion cut-off, such that only a 10–15 mm catalytic bed length would be necessary.
6. Conclusions
The intrinsic kinetics of crude glycerol autothermal reforming (ATR) was studied over Ni/CeZrCa catalyst at conditions of 773–923 K at atmospheric pressure, steam-to-carbon ratio of 2.6, and oxygen-to-carbon ratio of 0.125. The intrinsic kinetic data provided by Ghani et al. [9] were not limited by heat or mass transfer, and conditions were assumed to be far from equilibrium. The kinetics were studied following a power law approach as well as by proposing several kinetic mechanisms following the LHHW and Eley–Rideal frameworks.
For steam reforming, it was found that the hypothesized Eley–Rideal models best described the reaction rate, with ER 4 ultimately being chosen as the preferred model following thermodynamic scrutiny, possessing an AAD of less than 10%. This model reflected a rate-limiting reaction between adsorbed intermediate and steam. The most suitable model for total oxidation was found to be the power law model. Generally, LHHW-based mechanistic rate expressions performed better than those based on an Eley–Rideal-style mechanism. The mechanistic model considering the molecular adsorption of crude glycerol was found to be the best mechanistic description, with an AAD of 14.6%. Lastly, the CO2 methanation reaction was best described by an Eley–Rideal-type mechanism considering the adsorption of carbon dioxide, presenting an AAD of 5.8%.
Author Contributions
Conceptualization, H.I., A.S.; methodology, A.O.; software, A.O.; validation, All Authors; formal analysis, A.O.; investigation, A.O.; resources, H.I. and A.S.; data curation, M.F.; writing—original draft preparation, A.O. and M.F.; writing—review and editing, M.F., E.S. and H.I.; visualization, A.O. and M.F.; supervision, H.I and A.S.; project administration, H.I.; funding acquisition, H.I. All authors have read and agreed to the published version of the manuscript.
Funding
This research was funded by the Natural Sciences and Engineering Research Council of Canada Discovery Grant (NSERC-DG) and Canada Foundation for Innovation (CFI). Partial funding was also received from Faculty of Engineering and the VPR’s Office at the University of Regina.
Conflicts of Interest
The authors declare no conflict of interest.
References
- Knothe, G.; Razon, L.F. Biodiesel fuels. Prog. Energy Combust. Sci. 2017, 58, 36–59. [Google Scholar] [CrossRef]
- I.E. Agency. Renewables 2020: Analysis and Forecast to 2025. Paris. 2020. Available online: https://www.iea.org/reports/renewables-2020 (accessed on 15 December 2021).
- Quispe, C.A.G.; Coronado, C.J.R.; Carvalho, J.A., Jr. Glycerol: Production, consumption, prices, characterization and new trends in combustion. Renew. Sustain. Energy Rev. 2013, 27, 475–493. [Google Scholar] [CrossRef]
- He, Q.; McNutt, J.; Yang, J. Utilization of the residual glycerol from biodiesel production for renewable energy generation. Renew. Sustain. Energy Rev. 2017, 71, 63–76. [Google Scholar] [CrossRef]
- Chilakamarry, C.R.; Sakinah, A.M.M.; Zularisam, A.W.; Pandey, A. Glycerol waste to value added products and its potential applications. Syst. Microbiol. Biomanuf. 2021, 1, 378–396. [Google Scholar] [CrossRef]
- Bagnato, G.; Iulianelli, A.; Sanna, A.; Basile, A. Glycerol Production and Transformation: A Critical Review with Particular Emphasis on Glycerol Reforming Reaction for Producing Hydrogen in Conventional and Membrane Reactors. Membranes 2017, 7, 17. [Google Scholar] [CrossRef] [PubMed]
- Vivek, N.; Sindhu, R.; Madhavan, A.; Anju, A.J.; Castro, E.; Faraco, V.; Pandey, A.; Binod, P. Recent advances in the production of value added chemicals and lipids utilizing biodiesel industry generated crude glycerol as a substrate—Metabolic aspects, challenges and possibilities: An overview. Bioresour. Technol. 2017, 239, 507–517. [Google Scholar] [CrossRef]
- Nda-Umar, U.; Ramli, I.; Taufiq-Yap, Y.; Muhamad, E. An Overview of Recent Research in the Conversion of Glycerol into Biofuels, Fuel Additives and other Bio-Based Chemicals. Catalysts 2018, 9, 15. [Google Scholar] [CrossRef] [Green Version]
- Adeniyi, A.G.; Ighalo, J.O. A review of steam reforming of glycerol. Chem. Pap. 2019, 73, 2619–2635. [Google Scholar] [CrossRef]
- Roslan, N.A.; Abidin, S.Z.; Ideris, A.; Vo, D.-V.N. A review on glycerol reforming processes over Ni-based catalyst for hydrogen and syngas productions. Int. J. Hydrogen Energy 2020, 45, 18466–18489. [Google Scholar] [CrossRef]
- Saeidabad, N.G.; Noh, Y.S.; Eslami, A.A.; Song, H.T.; Kim, H.D.; Fazeli, A.; Moon, D.J. A Review on Catalysts Development for Steam Reforming of Biodiesel Derived Glycerol; Promoters and Supports. Catalysts 2020, 10, 910. [Google Scholar] [CrossRef]
- Hejna, A.; Kosmela, P.; Formela, K.; Piszczyk, Ł.; Haponiuk, J.T. Potential applications of crude glycerol in polymer technology–Current state and perspectives. Renew. Sustain. Energy Rev. 2016, 66, 449–475. [Google Scholar] [CrossRef]
- Anitha, M.; Kamarudin, S.K.; Kofli, N.T. The potential of glycerol as a value-added commodity. Chem. Eng. J. 2016, 295, 119–130. [Google Scholar] [CrossRef]
- Carlucci, C. A Focus on the Transformation Processes for the Valorization of Glycerol Derived from the Production Cycle of Biofuels. Catalysts 2021, 11, 280. [Google Scholar] [CrossRef]
- Canela-Xandri, A.; Balcells, M.; Villorbina, G.; Christou, P.; Canela-Garayoa, R. Preparation and Uses of Chlorinated Glycerol Derivatives. Molecules 2020, 25, 2511. [Google Scholar] [CrossRef]
- Bozkurt, Ö.D.; Tunç, F.M.; Bağlar, N.; Çelebi, S.; Günbaş, İ.D.; Uzun, A. Alternative fuel additives from glycerol by etherification with isobutene: Structure–performance relationships in solid catalysts. Fuel Process. Technol. 2015, 138, 780–804. [Google Scholar] [CrossRef]
- Agarwal, A.K.; Gupta, J.G.; Dhar, A. Potential and challenges for large-scale application of biodiesel in automotive sector. Prog. Energy Combust. Sci. 2017, 61, 113–149. [Google Scholar] [CrossRef]
- Ghani, A.A.; Torabi, F.; Ibrahim, H. Kinetics of hydrogen production by the autothermal reforming of crude glycerol over modified nickel supported catalyst. J. Environ. Chem. Eng. 2017, 5, 5827–5835. [Google Scholar] [CrossRef]
- Sundari, R.; Vaidya, P.D. Reaction Kinetics of Glycerol Steam Reforming Using a Ru/Al2O3 Catalyst. Energy Fuels 2012, 26, 4195–4204. [Google Scholar] [CrossRef]
- Cheng, C.K.; Foo, S.Y.; Adesina, A.A. Glycerol Steam Reforming over Bimetallic Co-Ni/Al2O3. Ind. Eng. Chem. Res. 2010, 49, 10804–10817. [Google Scholar] [CrossRef]
- Authayanun, S.; Arpornwichanop, A.; Paengjuntuek, W.; Assabumrungrat, S. Thermodynamic study of hydrogen production from crude glycerol autothermal reforming for fuel cell applications. Int. J. Hydrogen Energy 2010, 35, 6617–6623. [Google Scholar] [CrossRef]
- Liu, Y.J.; Lawal, A. Kinetic study of autothermal reforming of glycerol in a dual layer monolith catalyst. Chem. Eng. Process 2015, 95, 276–283. [Google Scholar] [CrossRef]
- Ghani, A.A.; Torabi, F.; Ibrahim, H. Autothermal reforming process for efficient hydrogen production from crude glycerol using nickel supported catalyst: Parametric and statistical analyses. Energy 2018, 144, 129–145. [Google Scholar] [CrossRef]
- Ghani, A.M.A. Hydrogen Production by the Cataylitic Auto-Thermal Reforming of Synthetic Crude Glycerol in a Packed Bed Tubular Reactor. Master’s Thesis, University of Regina, Regina, SK, Canada, 2015. [Google Scholar]
- Afabor, E.; Salama, A.; Ibrahim, H. Packed bed reactor modeling of the catalytic auto-thermal reforming of synthetic crude glycerol. J. Environ. Chem. Eng. 2017, 5, 4850–4857. [Google Scholar] [CrossRef]
- Levenspiel, O. Chemical Reaction Engineering, 3rd ed.; Wiley: New York, NY, USA, 1999. [Google Scholar]
- Froment, G.F.; Bischoff, K.B.; de Wilde, J. Chemical Reactor Analysis and Design, 3rd ed.; Wiley: Hoboken, NJ, USA, 2011. [Google Scholar]
- Mears, D.E. Tests for Transport Limitations in Experimental Catalytic Reactors. Ind. Eng. Chem. Process Des. Dev. 1971, 10, 541–547. [Google Scholar] [CrossRef]
- Mears, D.E. Diagnostic criteria for heat transport limitations in fixed bed reactors. J. Catal. 1971, 20, 127–131. [Google Scholar] [CrossRef]
- Vannice, M.A. Kinetics of Catalytic Reactions, 1st ed.; Springer: New York, NY, USA, 2005. [Google Scholar]
- Hu, Y.H.; Ruckenstein, E. Transient Kinetic Studies of Partial Oxidation of CH4. J. Catal. 1996, 158, 260–266. [Google Scholar] [CrossRef]
- Dinh, D.K.; Kang, H.S.; Jo, S.; Lee, D.H.; Song, Y.-H. Partial oxidation of diesel fuel by plasma—Kinetic aspects of the reaction. Int. J. Hydrogen Energy 2017, 42, 22756–22764. [Google Scholar] [CrossRef]
- Ibrahim, H.H.; Idem, R.O. Kinetic studies of the partial oxidation of isooctane for hydrogen production over a nickel–alumina catalyst. Chem. Eng. Sci. 2006, 61, 5912–5918. [Google Scholar] [CrossRef]
- Oluku, I.; Khan, F.; Idem, R.; Ibrahim, H. Mechanistic kinetics and reactor modelling of hydrogen production from the partial oxidation of diesel over a quartenary metal oxide catalyst. Mol. Catal. 2018, 451, 255–265. [Google Scholar] [CrossRef]
- Hohn, K.L.; Lin, Y.C. Catalytic partial oxidation of methanol and ethanol for hydrogen generation. ChemSusChem 2009, 2, 927–940. [Google Scholar] [CrossRef]
- Beretta, A.; Groppi, G.; Lualdi, M.; Tavazzi, I.; Forzatti, P. Experimental and Modeling Analysis of Methane Partial Oxidation: Transient and Steady-State Behavior of Rh-Coated Honeycomb Monoliths. Ind. Eng. Chem. Res. 2009, 48, 3825–3836. [Google Scholar] [CrossRef]
- Battin-Leclerc, F. Detailed chemical kinetic models for the low-temperature combustion of hydrocarbons with application to gasoline and diesel fuel surrogates. Prog. Energy Combust. Sci. 2008, 34, 440–498. [Google Scholar] [CrossRef] [Green Version]
- Huang, H.; Wang, Z.; Liu, H.; Sun, H.; Wei, Y.; Zhou, X. A kinetic model for analyzing partial oxidation reforming of heavy hydrocarbon over a novel self-sustained electrochemical promotion catalyst. Int. J. Hydrogen Energy 2012, 37, 15125–15134. [Google Scholar] [CrossRef]
- Koschany, F.; Schlereth, D.; Hinrichsen, O. On the kinetics of the methanation of carbon dioxide on coprecipitated NiAl(O)x. Appl. Catal. B-Environ. 2016, 181, 504–516. [Google Scholar] [CrossRef]
- Amaral, R. Kinetics of CO2 Methanation over a Ni Alumina Industrial Catalyst. Master’s Thesis, University of Lisbon, Lisbon, Portugal, 2016. [Google Scholar]
- Weatherbee, G.D.; Bartholomew, C.H. Hydrogenation Of CO2 On Group-Viii Metals. 2. Kinetics And Mechanism Of CO2 Hydrogenation On Nickel. J. Catal. 1982, 77, 460–472. [Google Scholar] [CrossRef]
- Halabi, M.H.; de Croon, M.H.J.M.; van der Schaaf, J.; Cobden, P.D.; Schouten, J.C. Intrinsic kinetics of low temperature catalytic methane–steam reforming and water–gas shift over Rh/CeαZr1−αO2 catalyst. Appl. Catal. A Gen. 2010, 389, 80–91. [Google Scholar] [CrossRef]
- Adhikari, S.; Fernando, S.D.; Haryanto, A. Kinetics and Reactor Modeling of Hydrogen Production from Glycerol via Steam Reforming Process over Ni/CeO2 Catalysts. Chem. Eng. Technol. 2009, 32, 541–547. [Google Scholar] [CrossRef]
- Pant, K.K.; Jain, R.; Jain, S. Renewable hydrogen production by steam reforming of glycerol over Ni/CeO2 catalyst prepared by precipitation deposition method. Korean J. Chem. Eng. 2011, 28, 1859–1866. [Google Scholar] [CrossRef]
- Hemings, E.B.; Cavallotti, C.; Cuoci, A.; Faravelli, T.; Ranzi, E. A Detailed Kinetic Study Of Pyrolysis And Oxidation Of Glycerol (Propane-1,2,3-Triol). Combust. Sci. Technol. 2012, 184, 1164–1178. [Google Scholar] [CrossRef]
- Nguyen, T.H.; Lamacz, A.; Krzton, A.; Ura, A.; Chalupka, K.; Nowosielska, M.; Rynkowski, J.; Djega-Mariadassou, G. Partial oxidation of methane over Ni-0/La2O3 bifunctional catalyst II: Global kinetics of methane total oxidation, dry reforming and partial oxidation. Appl. Catal. B-Environ. 2015, 165, 389–398. [Google Scholar] [CrossRef]
- Rout, K.R.; Jakobsen, H.A. A numerical study of fixed bed reactor modelling for steam methane reforming process. Can. J. Chem. Eng. 2015, 93, 1222–1238. [Google Scholar] [CrossRef]
- Muthukumar, P.; Singhal, A.; Bansal, G.K. Thermal modeling and performance analysis of industrial-scale metal hydride based hydrogen storage container. Int. J. Hydrogen Energy 2012, 37, 14351–14364. [Google Scholar] [CrossRef]
- Halabi, M.; Decroon, M.; Vanderschaaf, J.; Cobden, P.; Schouten, J. Modeling and analysis of autothermal reforming of methane to hydrogen in a fixed bed reformer. Chem. Eng. J. 2008, 137, 568–578. [Google Scholar] [CrossRef]
- Lordanidis, A.A. Mathematical Modeling of Catalytic Fixed Bed Reactors. Ph.D. Thesis, University of Twente, Enschede, The Netherlands, 2002. [Google Scholar]
- Jimmy, U.; Mohamedali, M.; Ibrahim, H. Thermodynamic Analysis of Autothermal Reforming of Synthetic Crude Glycerol (SCG) for Hydrogen Production. ChemEngineering 2017, 1, 4. [Google Scholar] [CrossRef] [Green Version]
Figure 1.
Parity plot for steam reforming of crude glycerol.
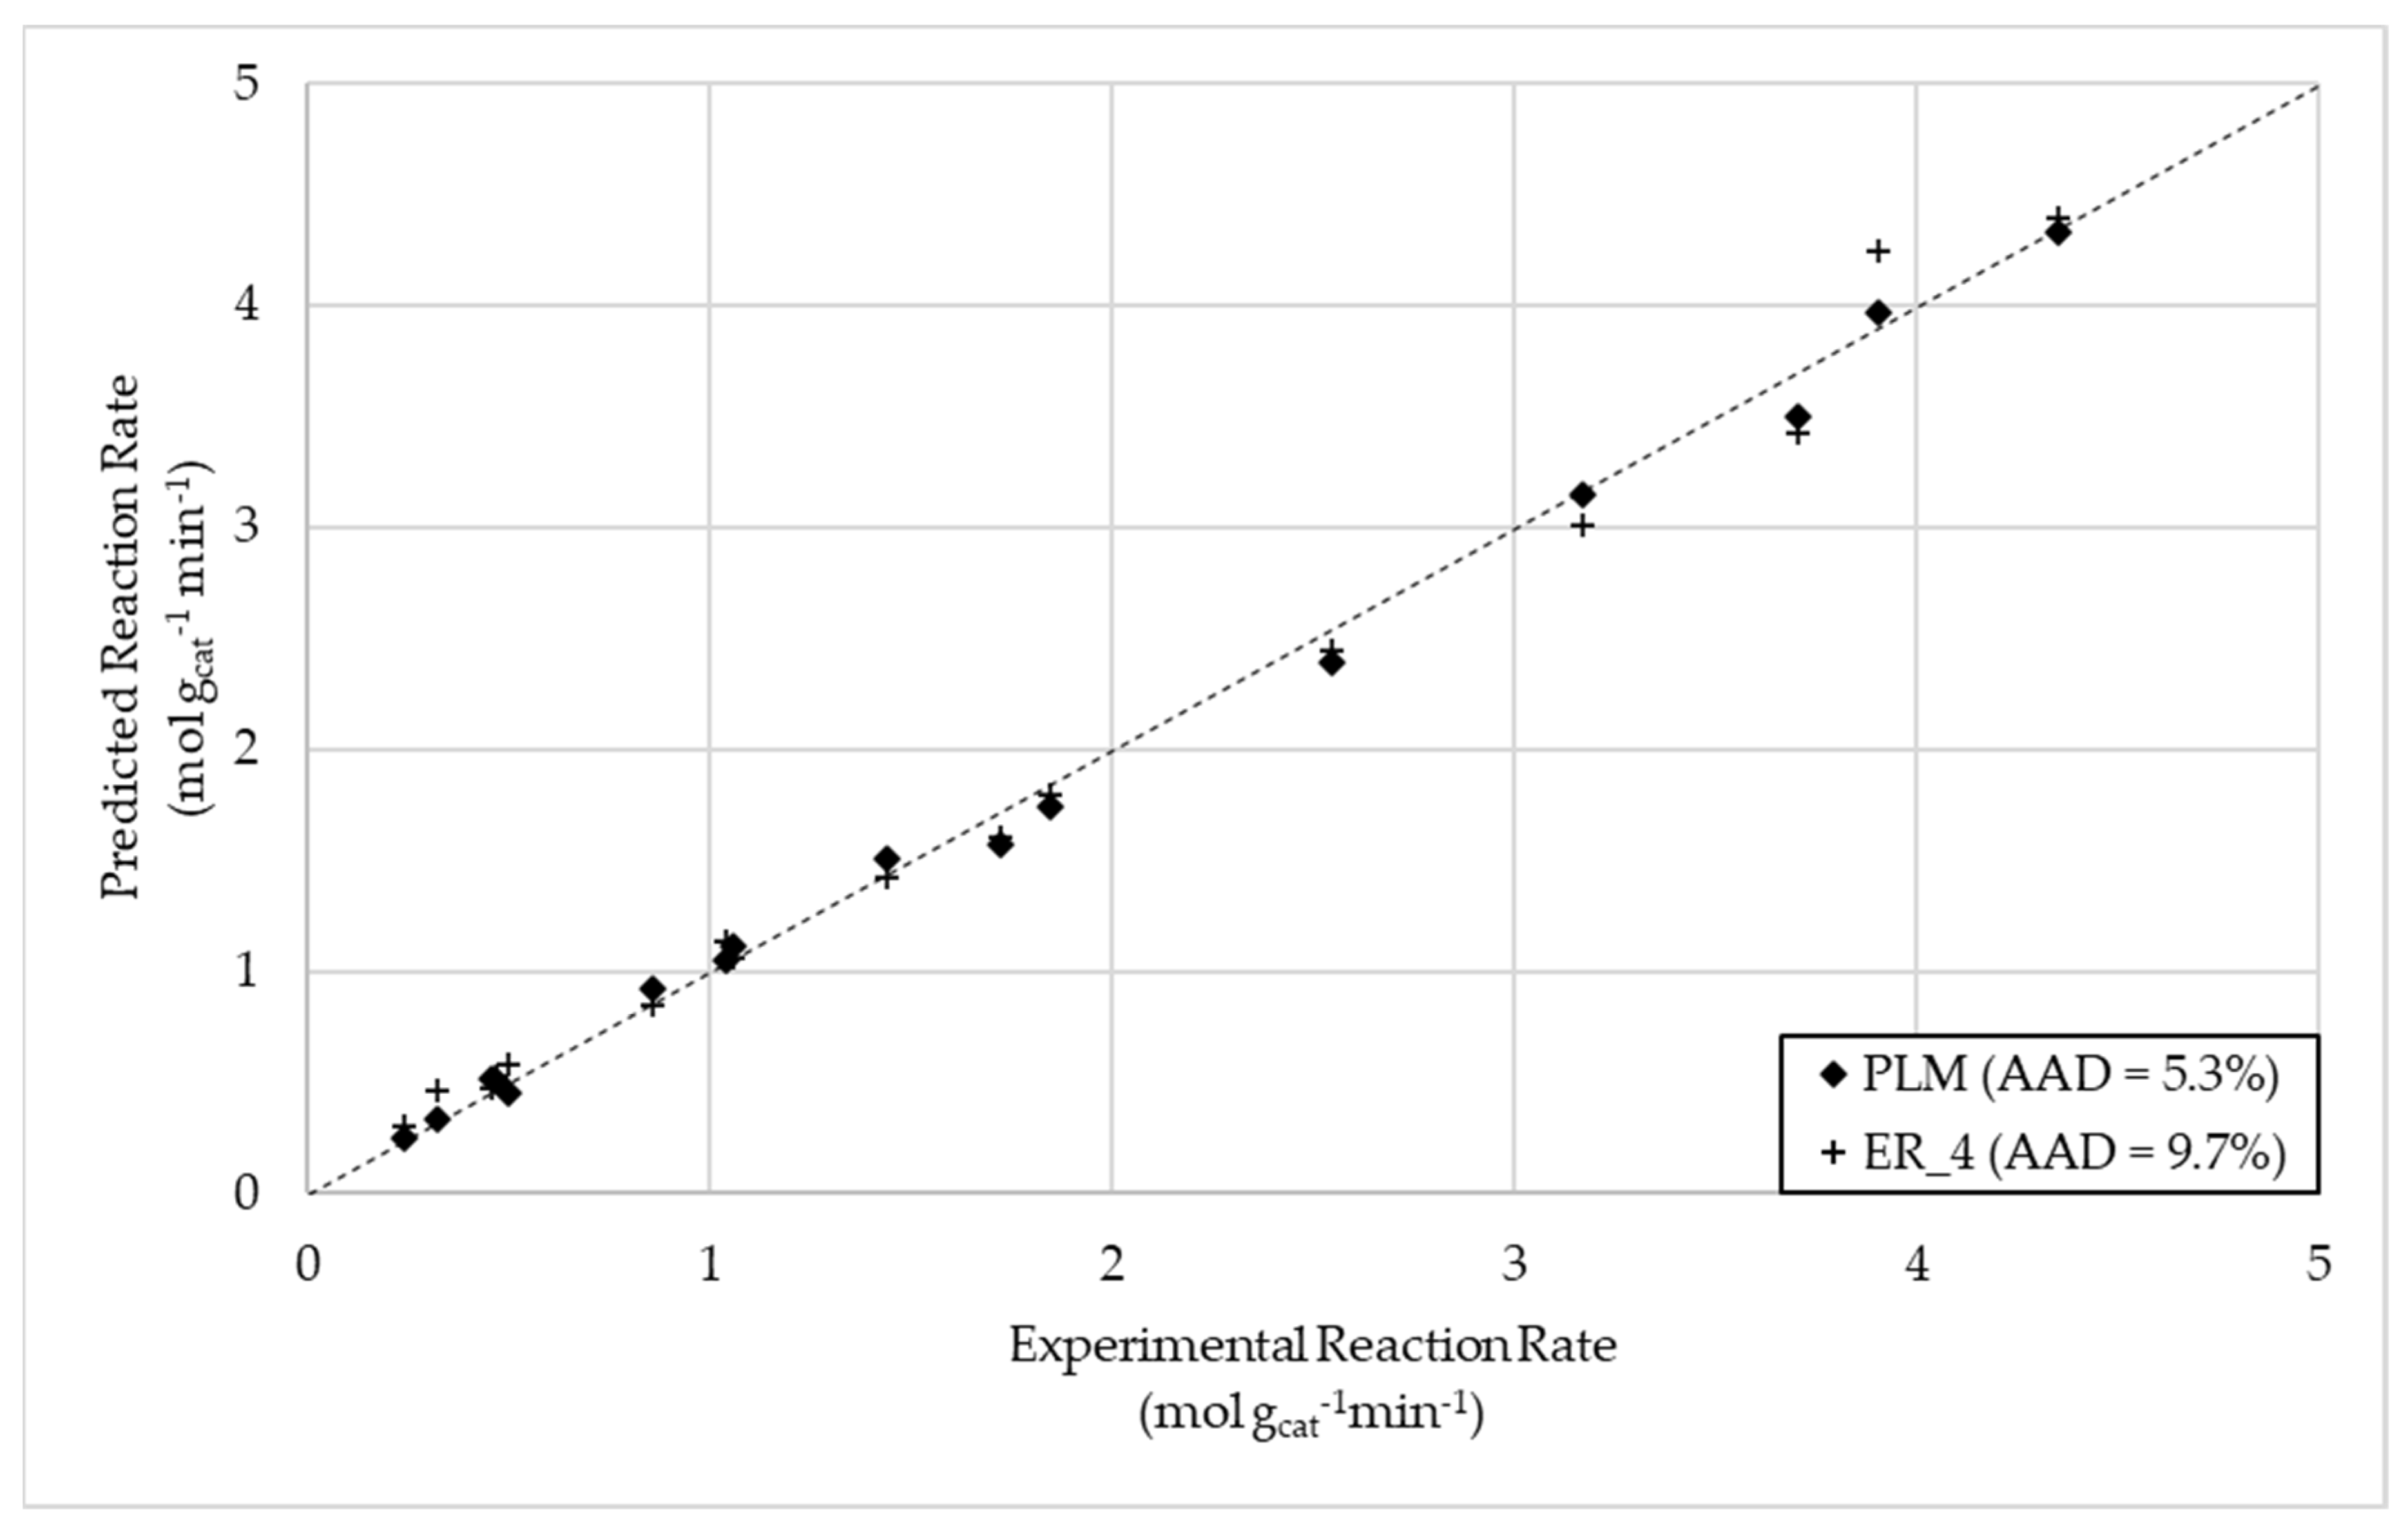
Figure 2.
Parity plot for total oxidation of crude glycerol.
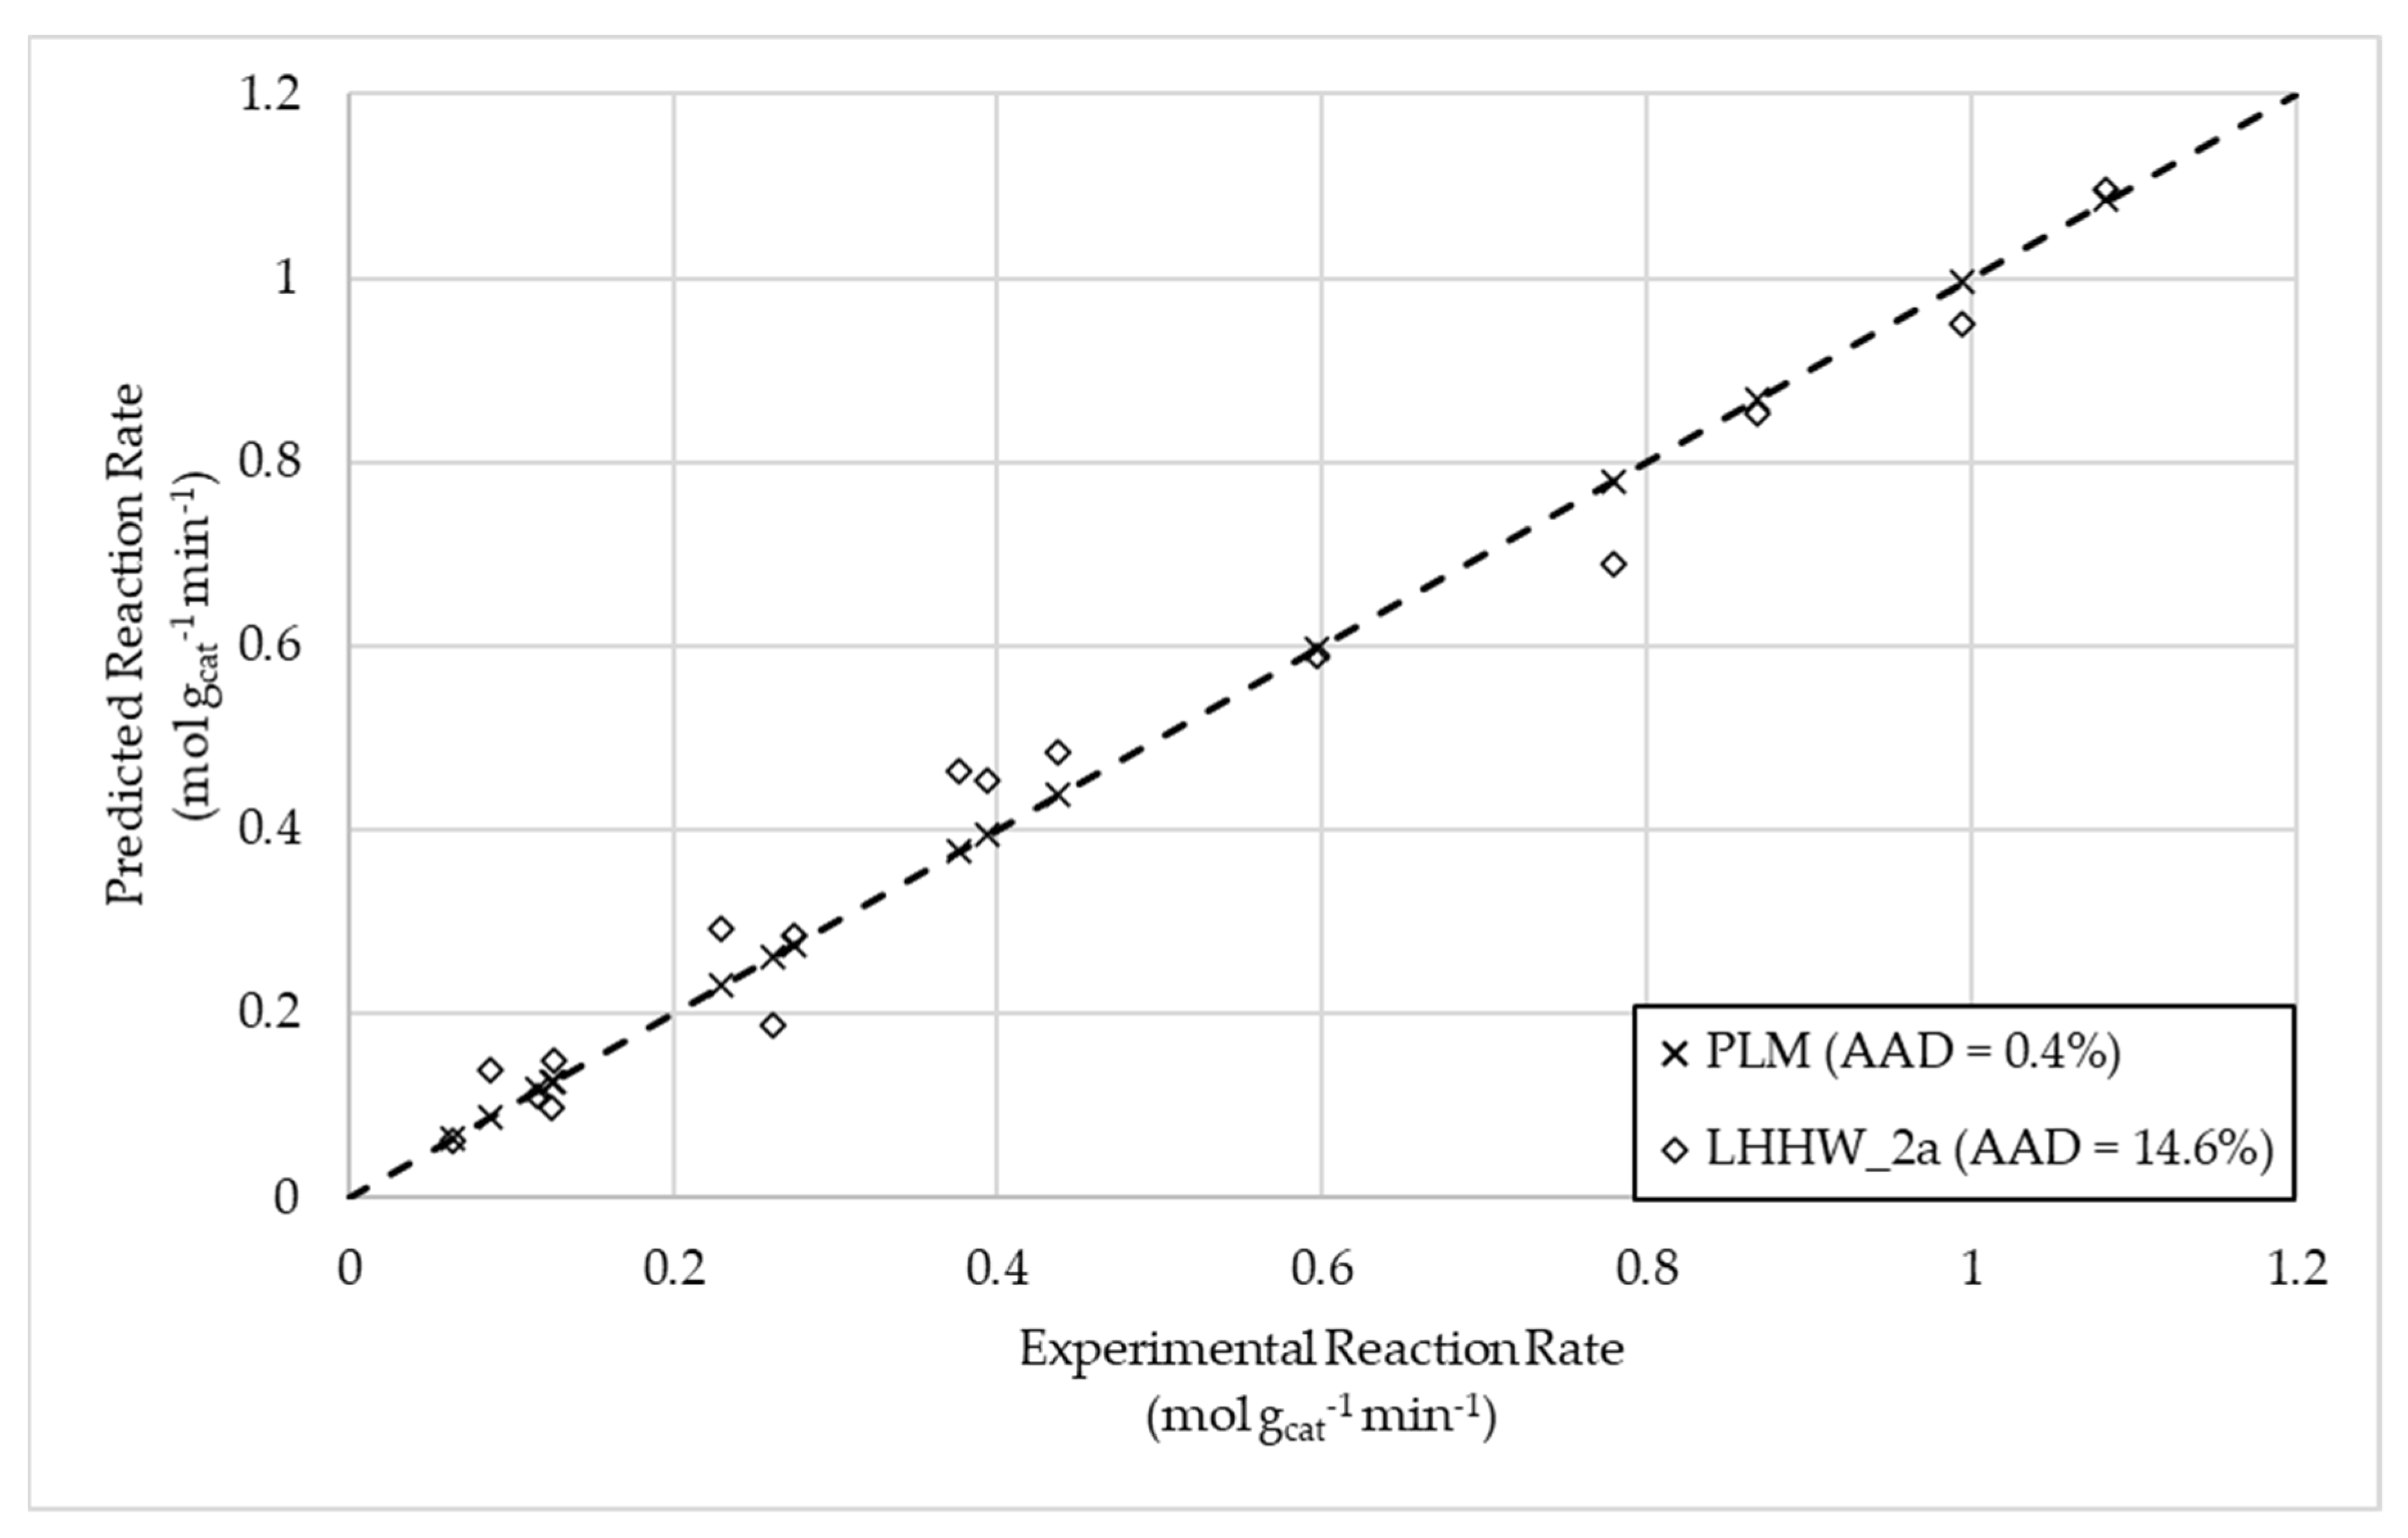
Figure 3.
Parity plot for CO2 methanation in crude glycerol reforming.
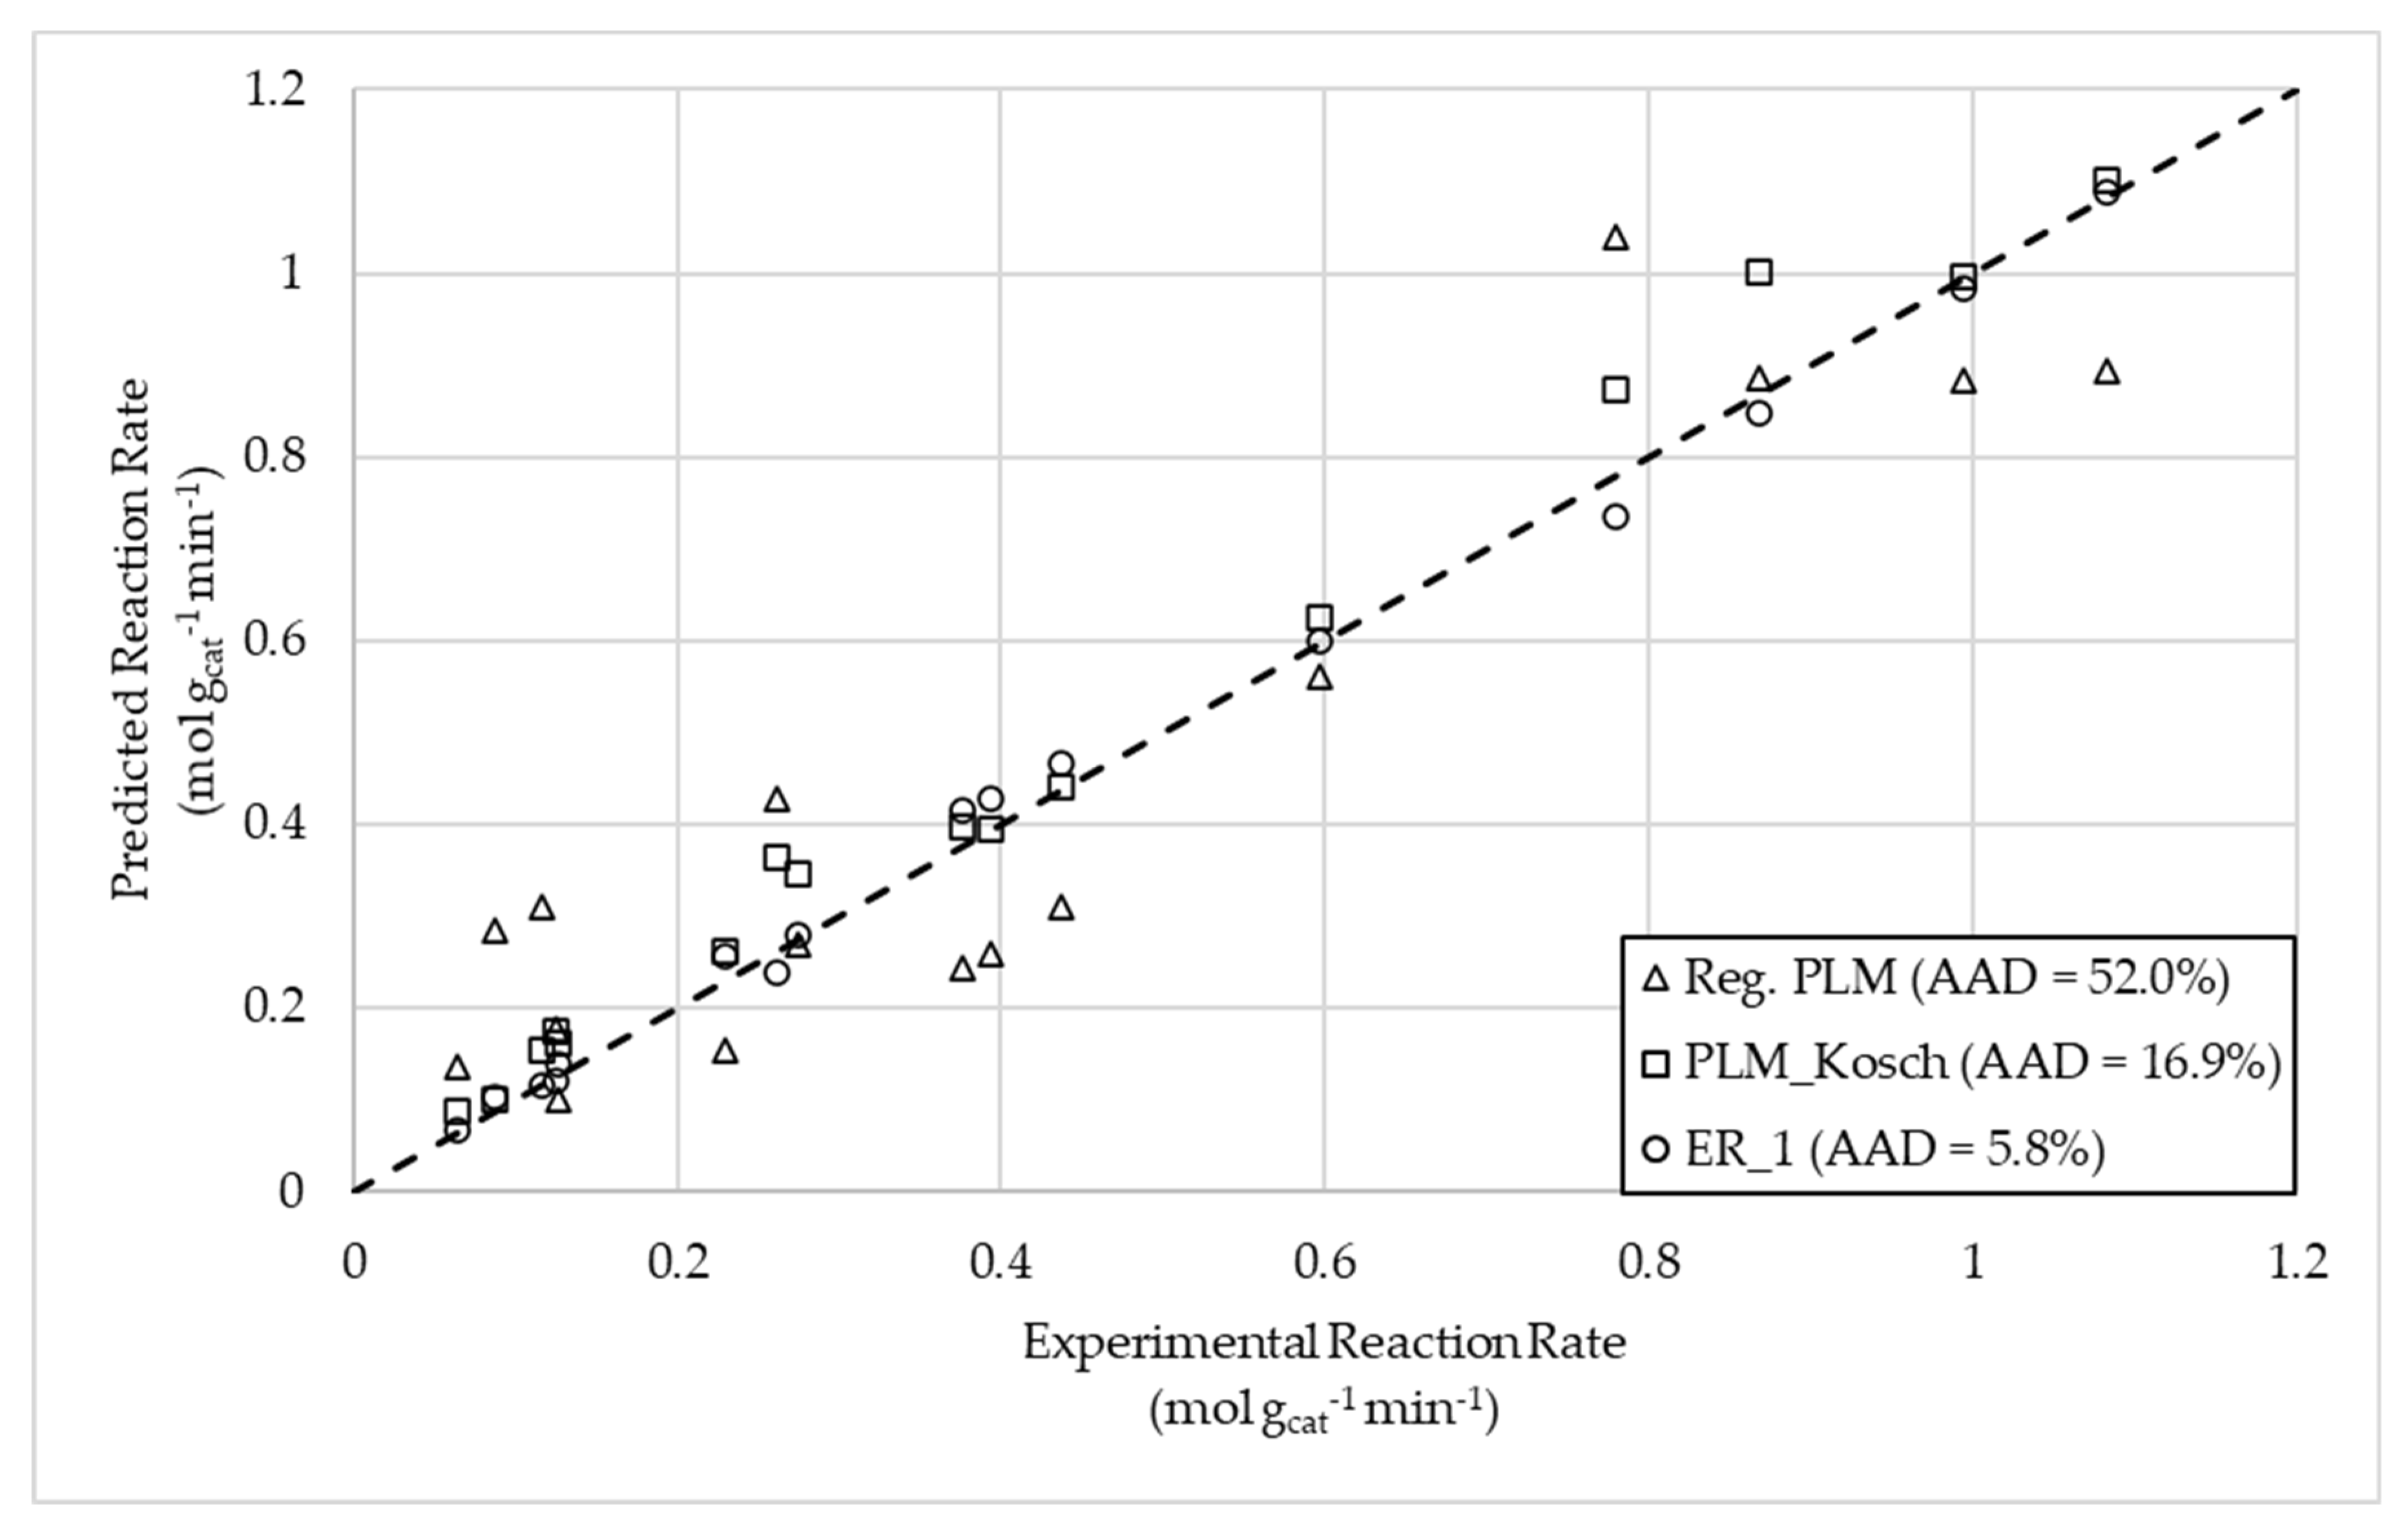
Figure 4.
Parity charts for predicted crude glycerol conversions versus experimental crude glycerol conversions. (a) one-dimensional pseudo-homogeneous (MATLAB); (b) one-dimensional simplified heterogeneous (MATLAB); (c) two-dimensional pseudo-homogeneous (COMSOL); (d) two-dimensional simplified heterogeneous (COMSOL).

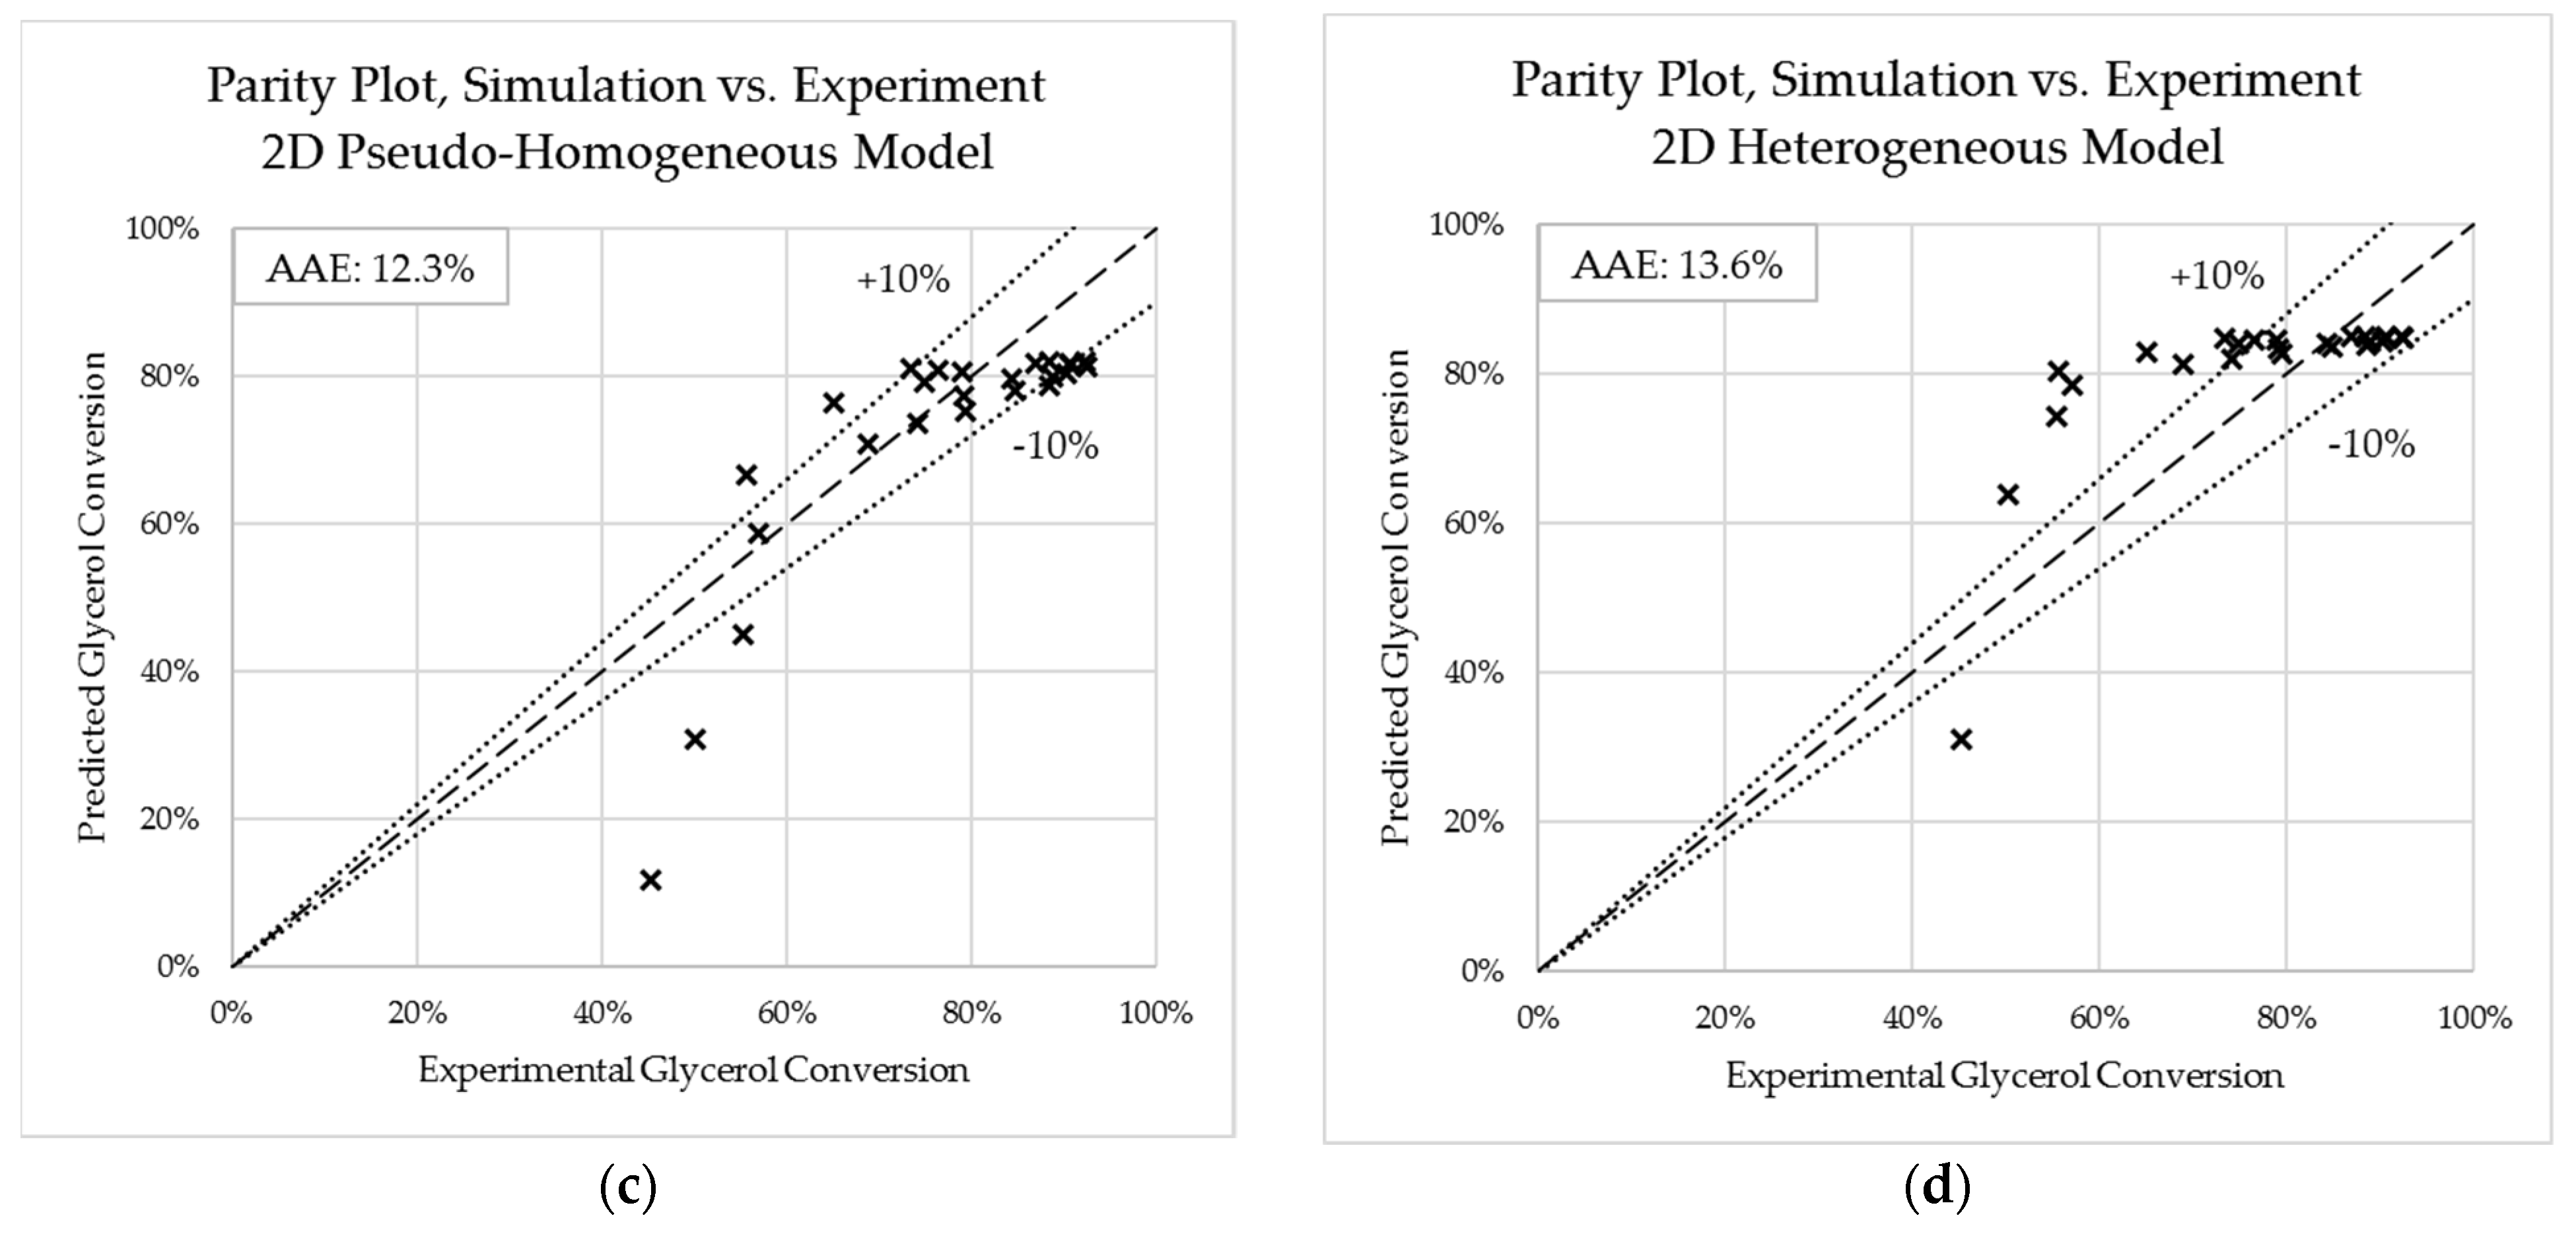
Figure 5.
Predicted reactor species mole fraction profiles for each modelling framework along the reactor length for (a) crude glycerol; (b) oxygen; (c); hydrogen; (d) carbon dioxide; (e) nitrogen; (f) steam; (g) methane.
Figure 5.
Predicted reactor species mole fraction profiles for each modelling framework along the reactor length for (a) crude glycerol; (b) oxygen; (c); hydrogen; (d) carbon dioxide; (e) nitrogen; (f) steam; (g) methane.
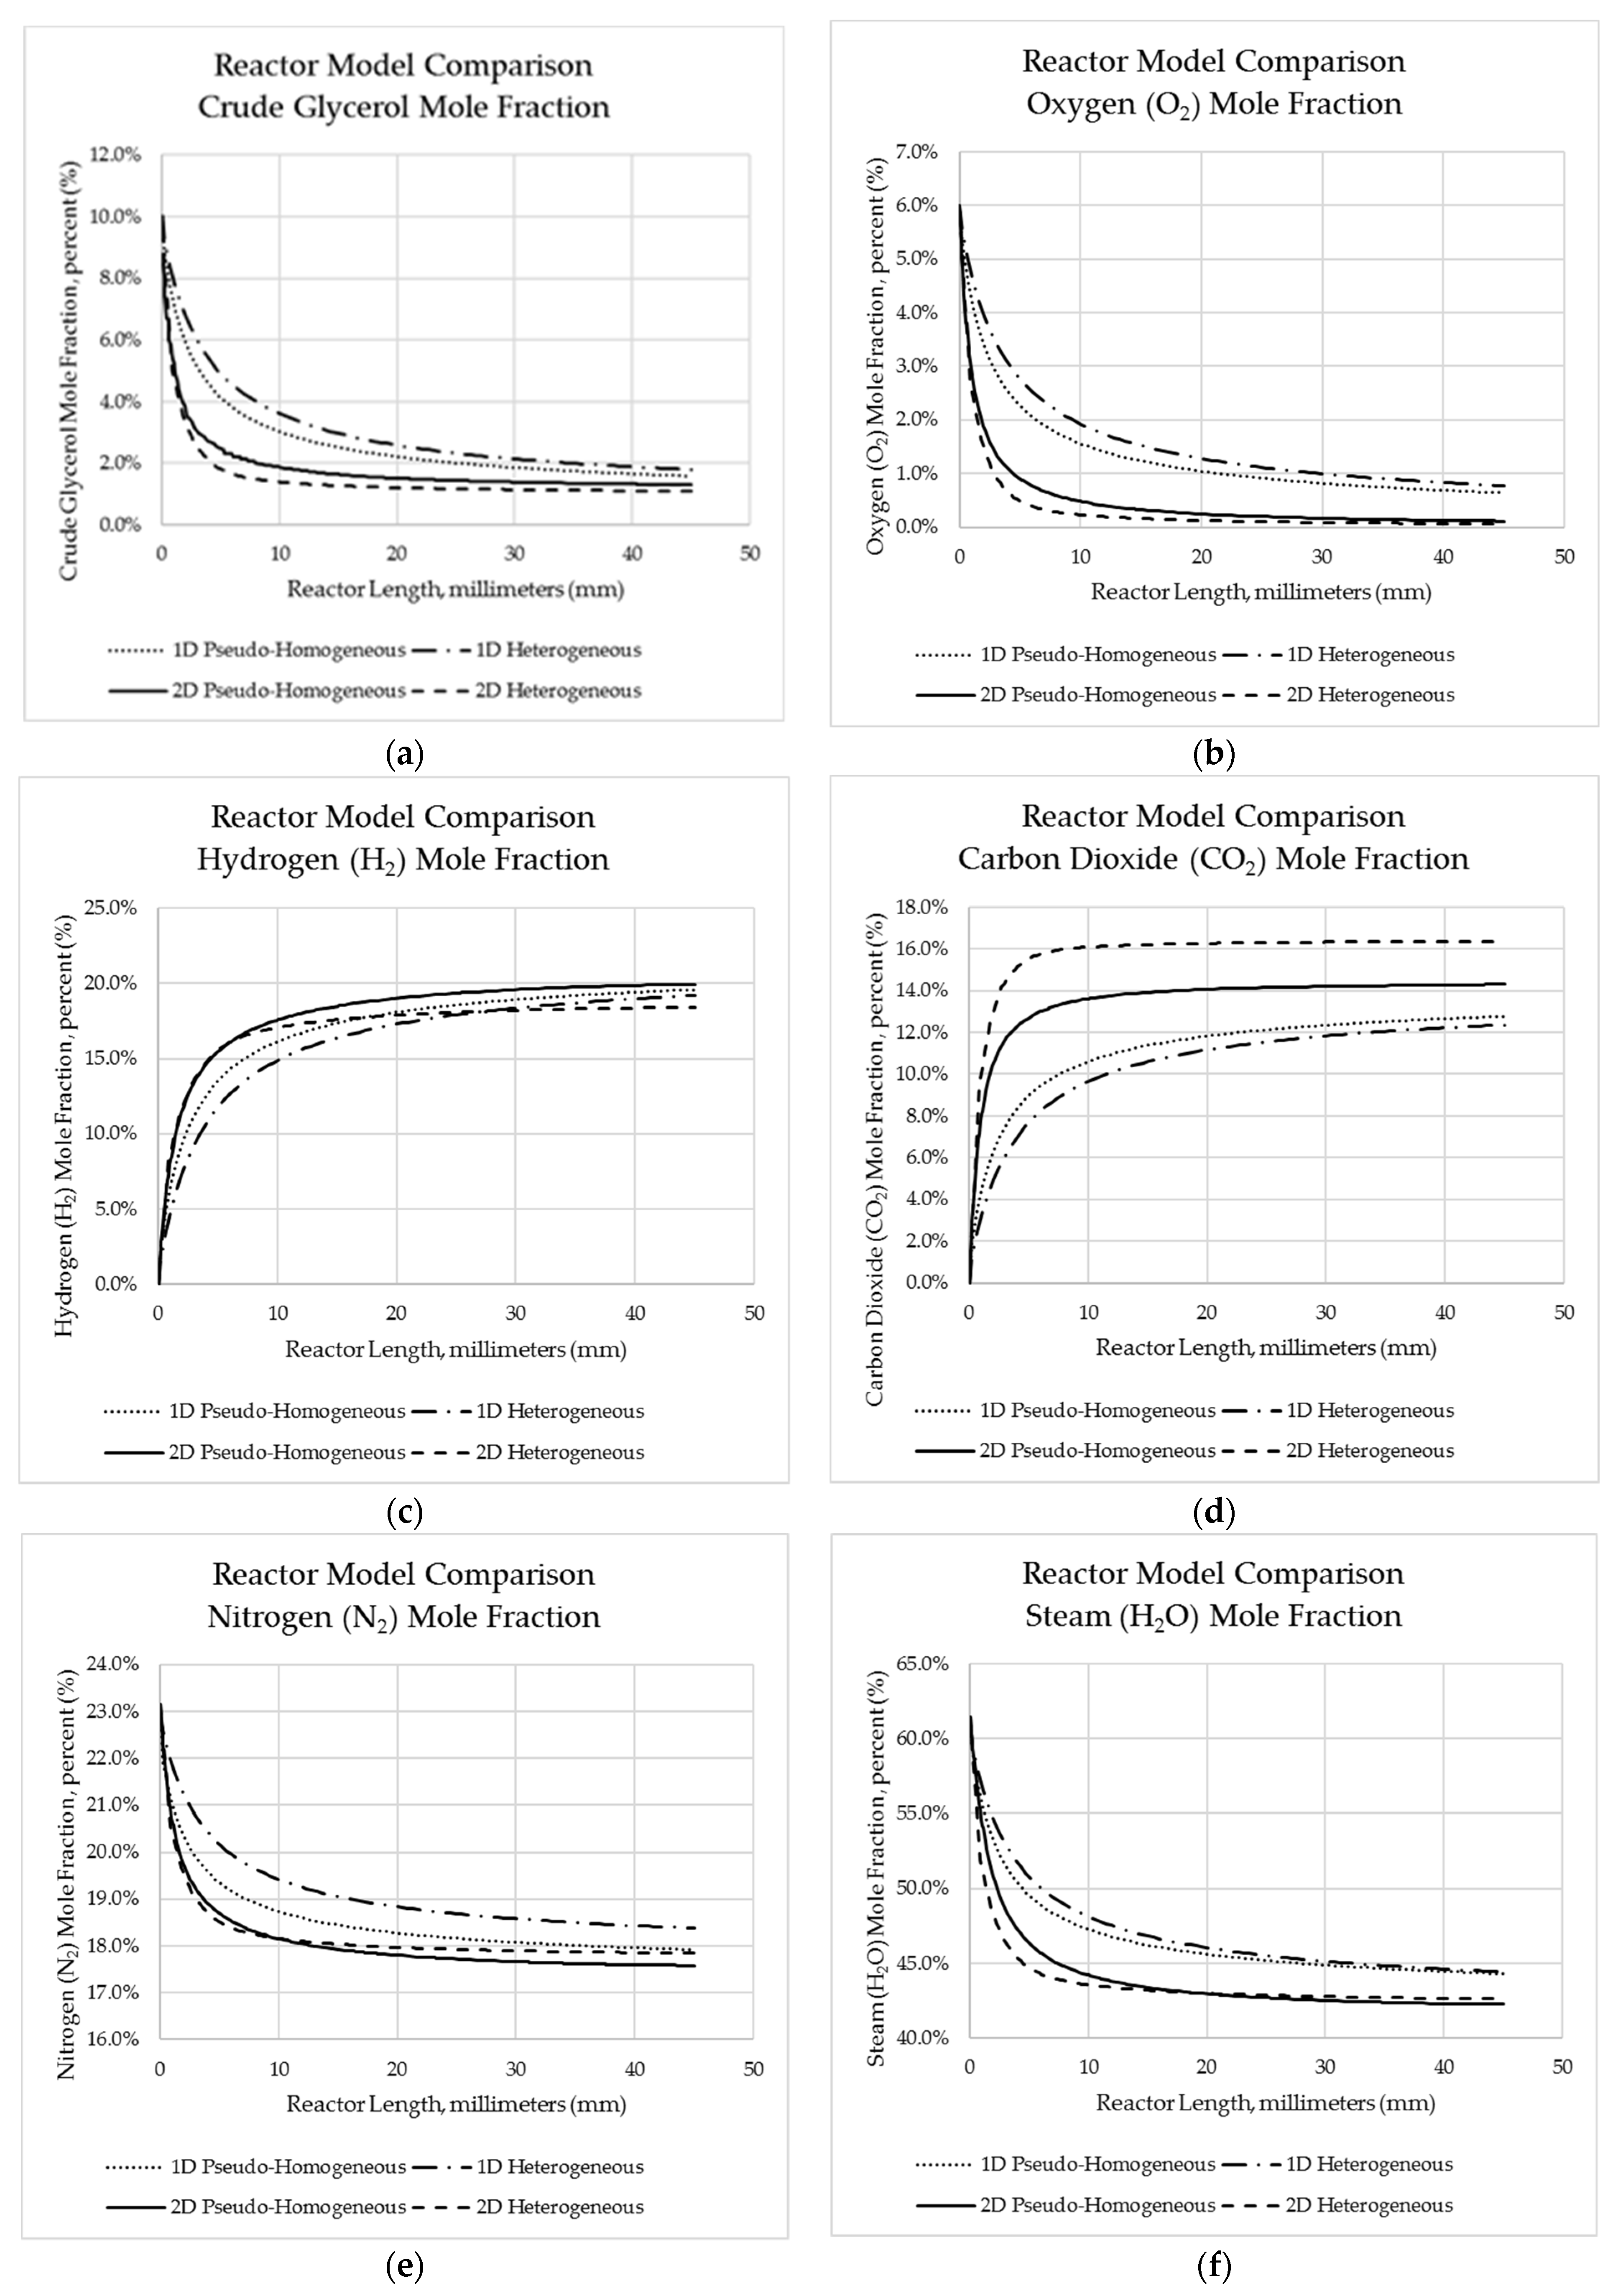
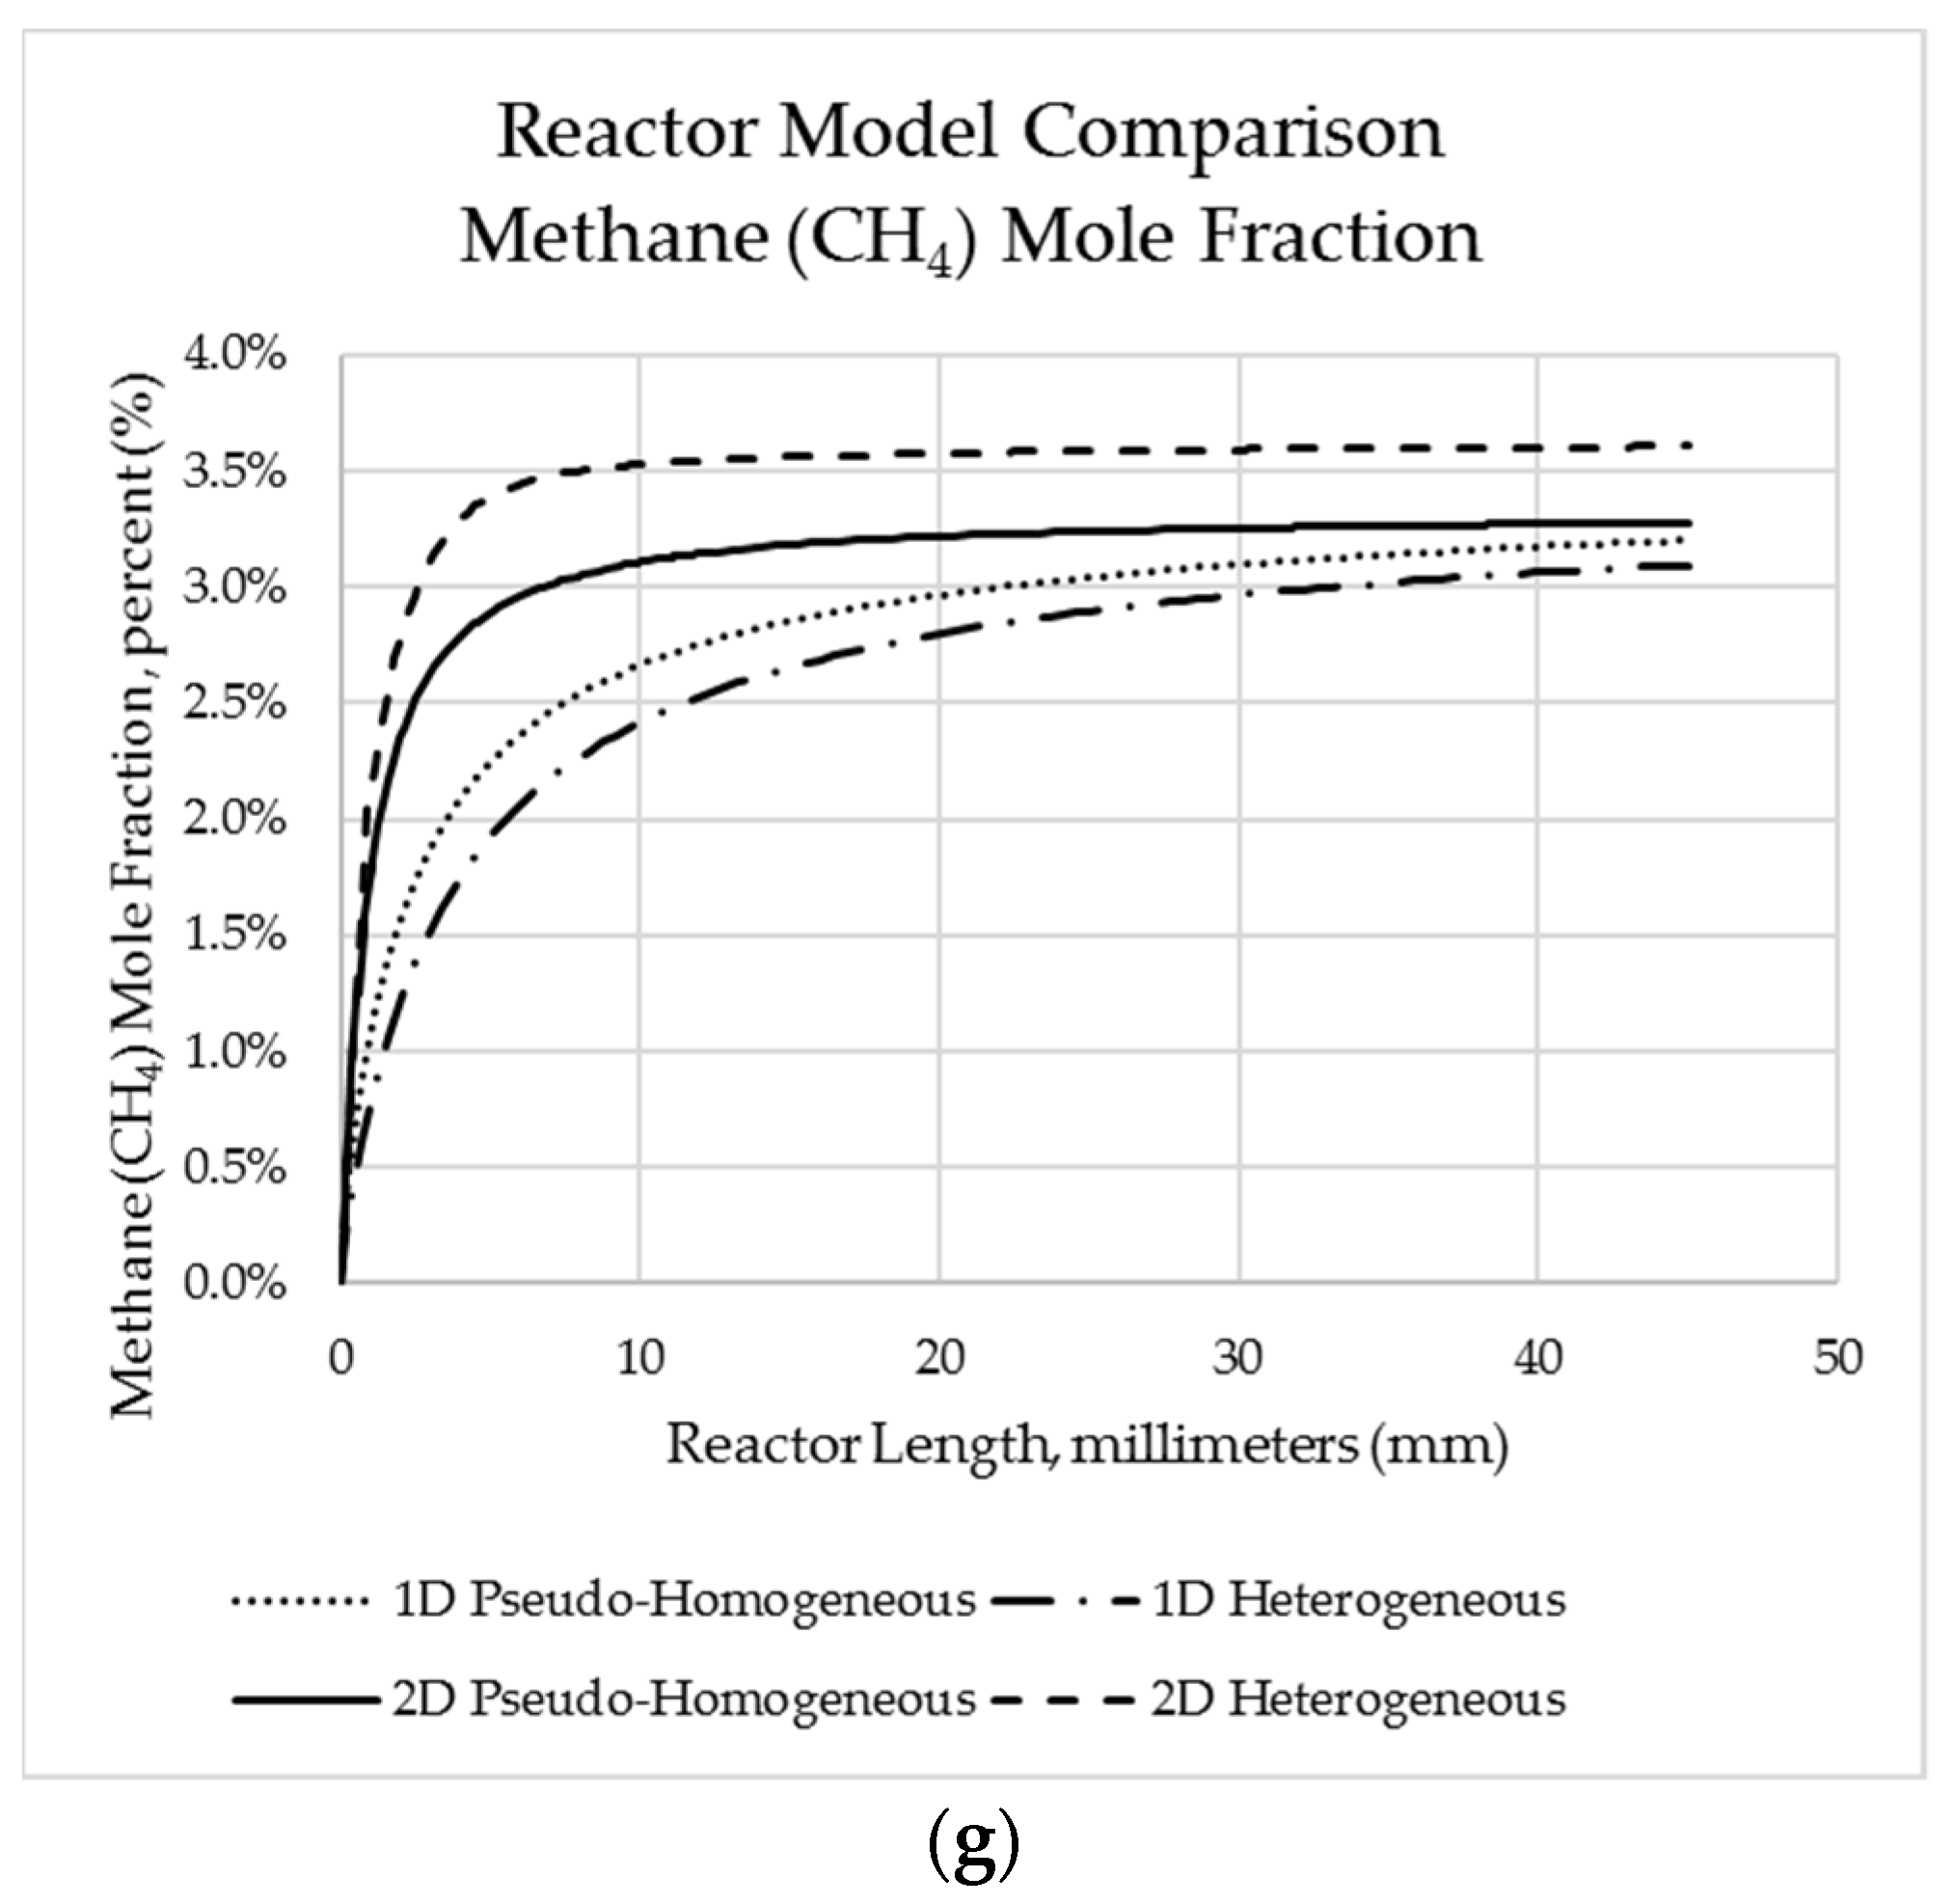
Figure 6.
Predicted crude glycerol conversion profiles for each modelling framework.
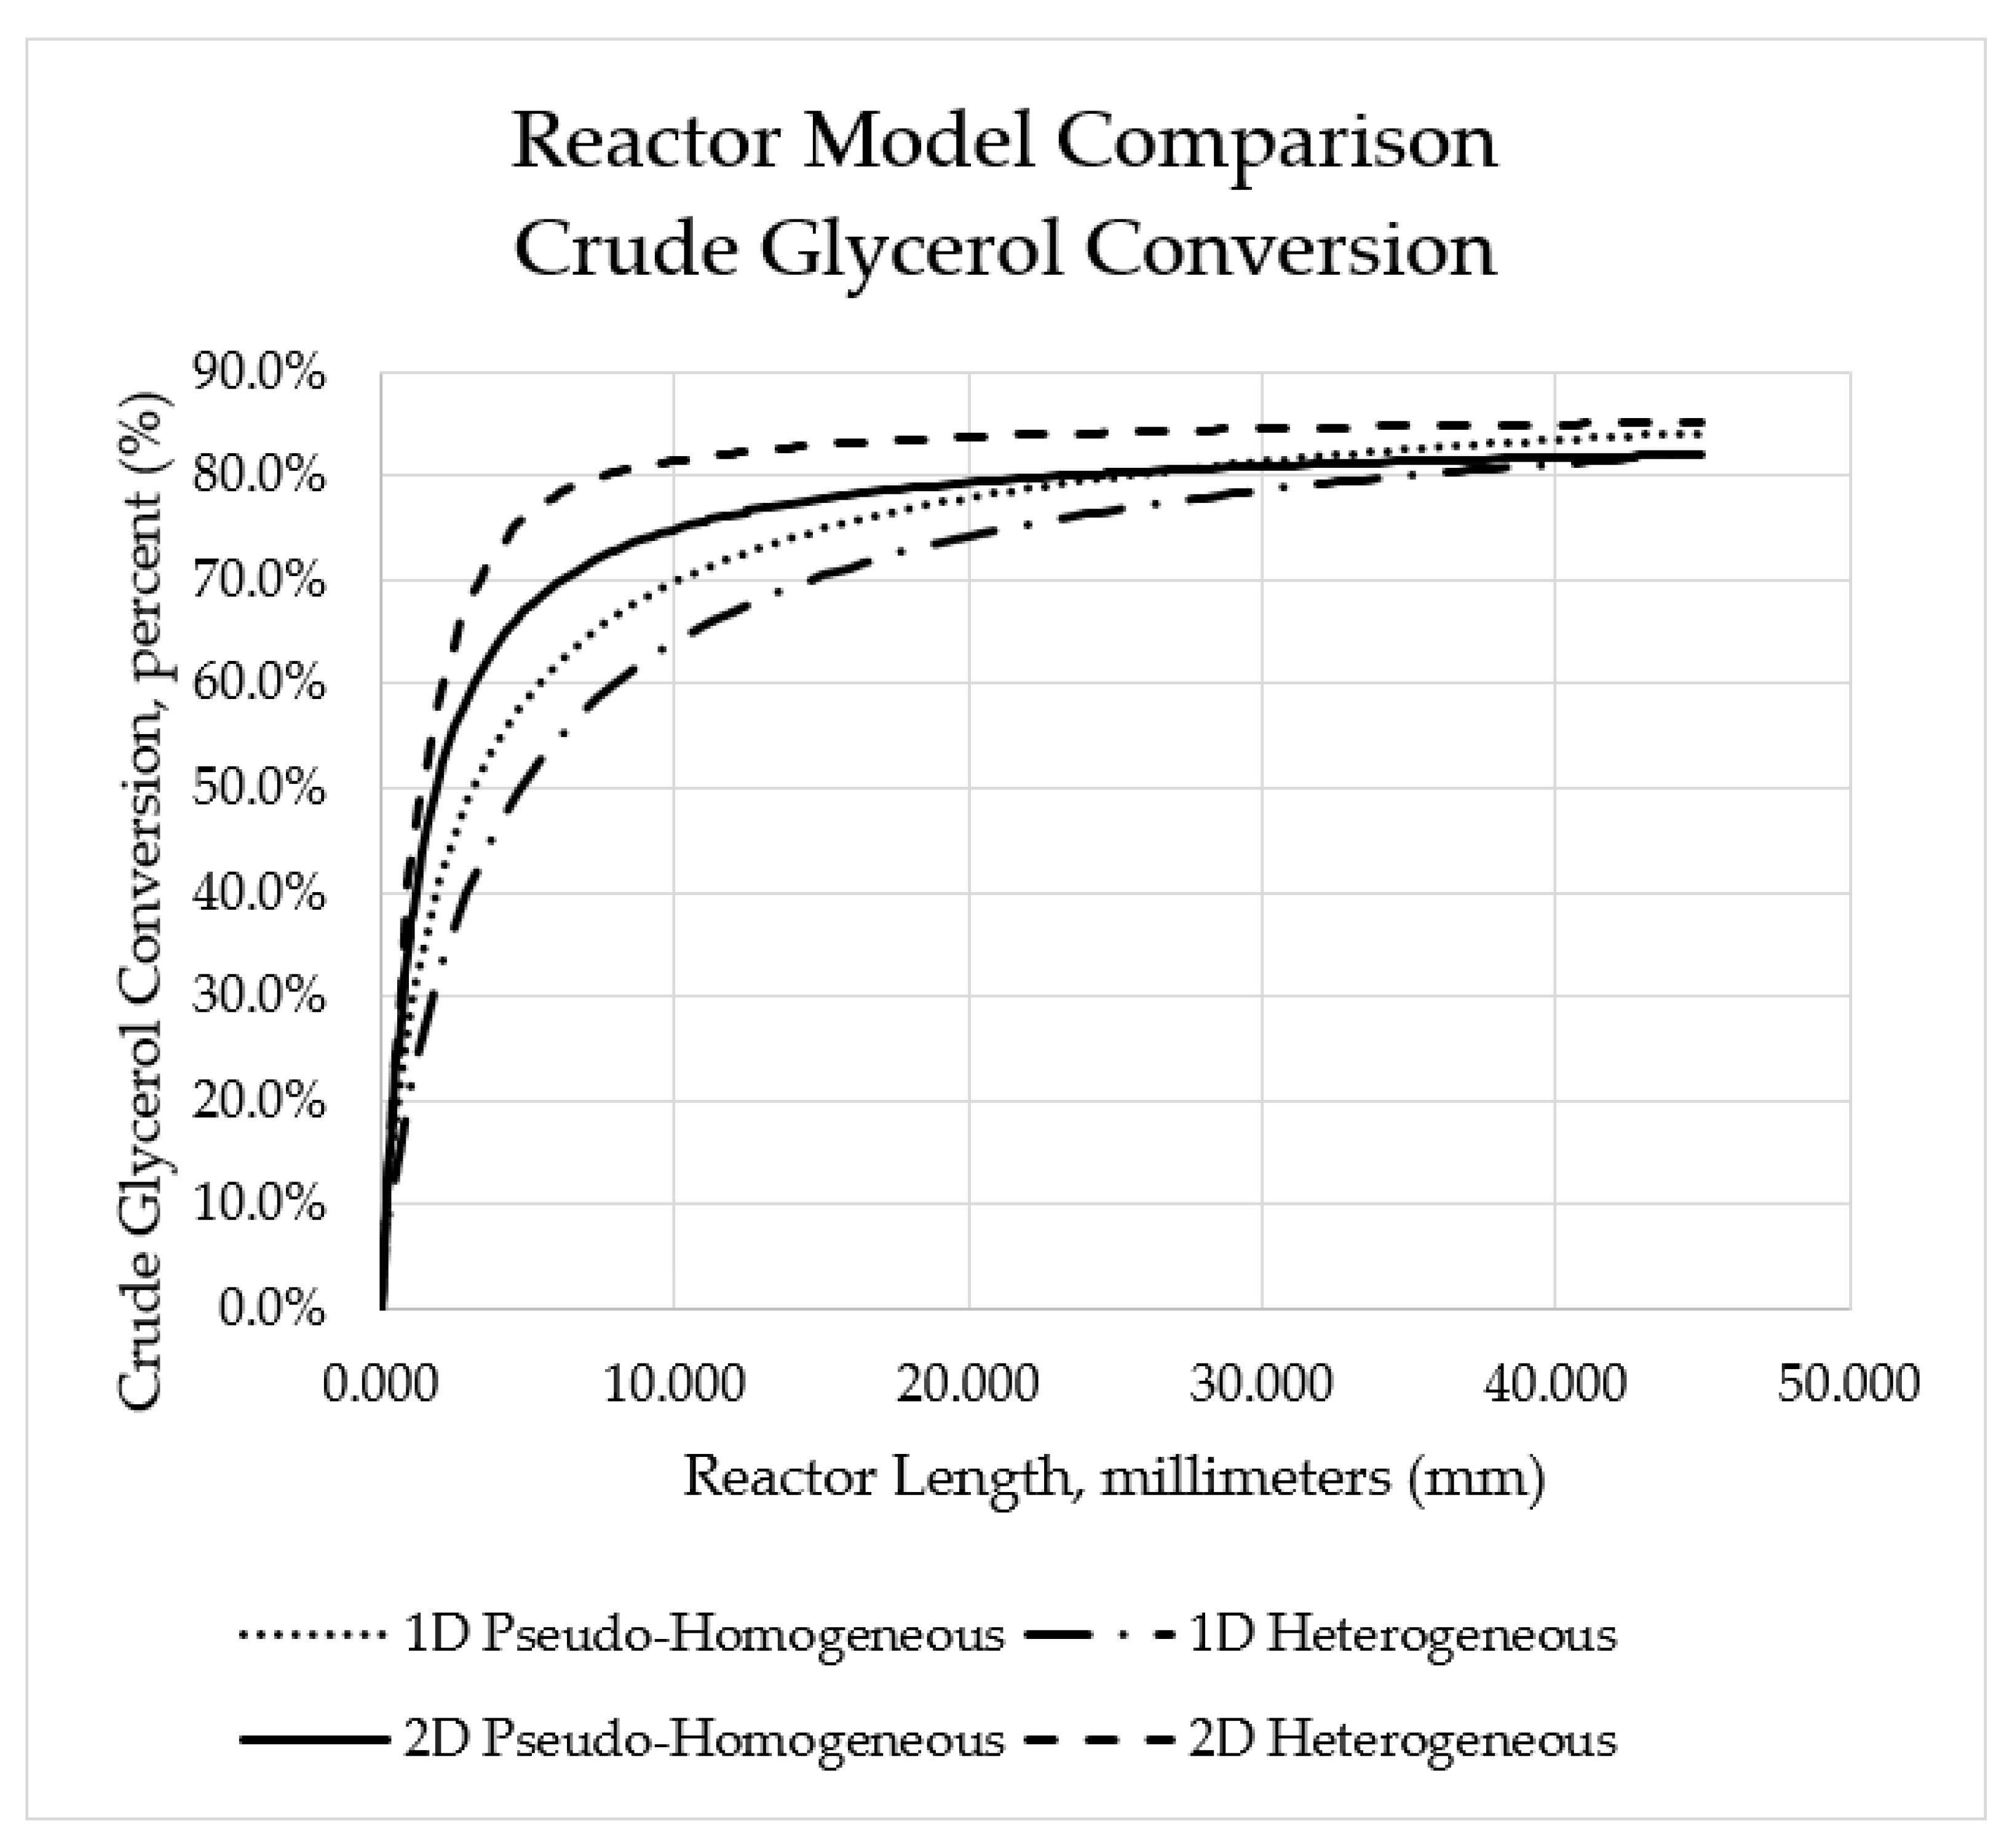
Figure 7.
Effect of reactor temperature on crude glycerol conversion for space velocity of 12.71 gcat·min/mol.
Figure 7.
Effect of reactor temperature on crude glycerol conversion for space velocity of 12.71 gcat·min/mol.
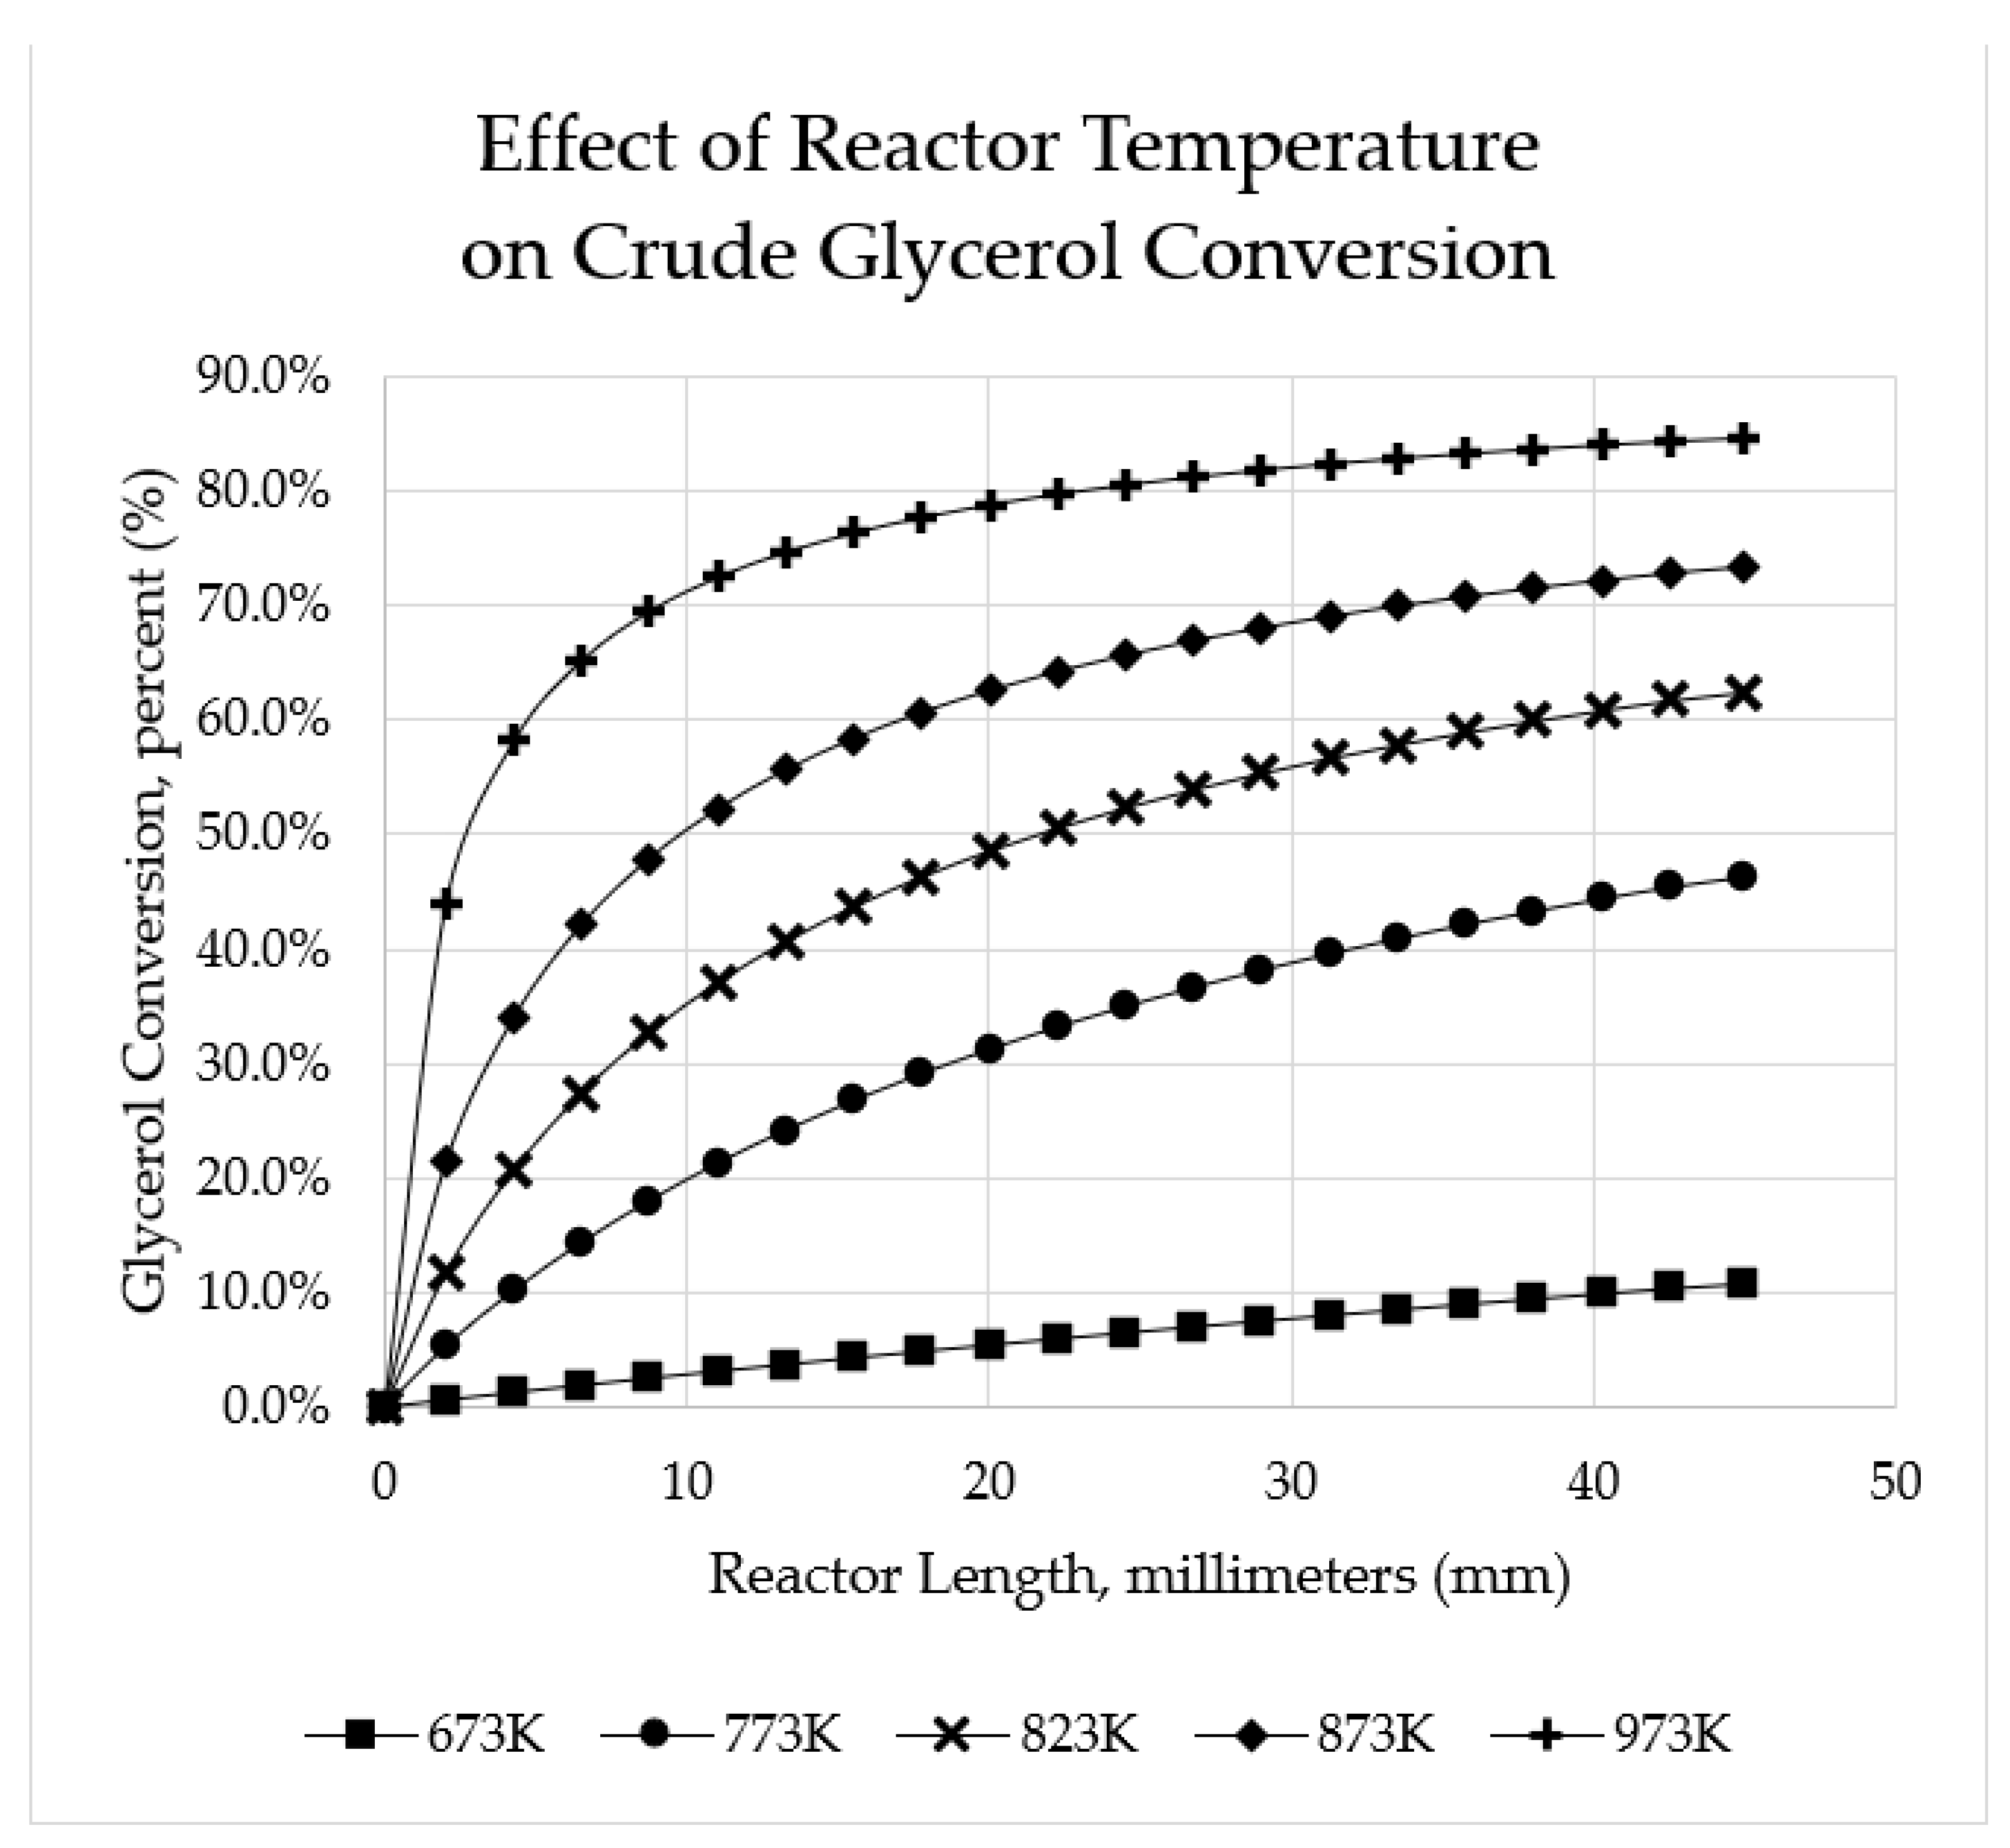
Figure 8.
Influence of one-dimensional reactor model axial dispersion term on predicted outlet species mole fractions.
Figure 8.
Influence of one-dimensional reactor model axial dispersion term on predicted outlet species mole fractions.

Figure 9.
Influence of one-dimensional reactor model axial dispersion term on predicted reactor temperature profiles.
Figure 9.
Influence of one-dimensional reactor model axial dispersion term on predicted reactor temperature profiles.

Figure 10.
Influence of space velocity on (a) predicted crude glycol conversion and (b) hydrogen yield.
Figure 10.
Influence of space velocity on (a) predicted crude glycol conversion and (b) hydrogen yield.
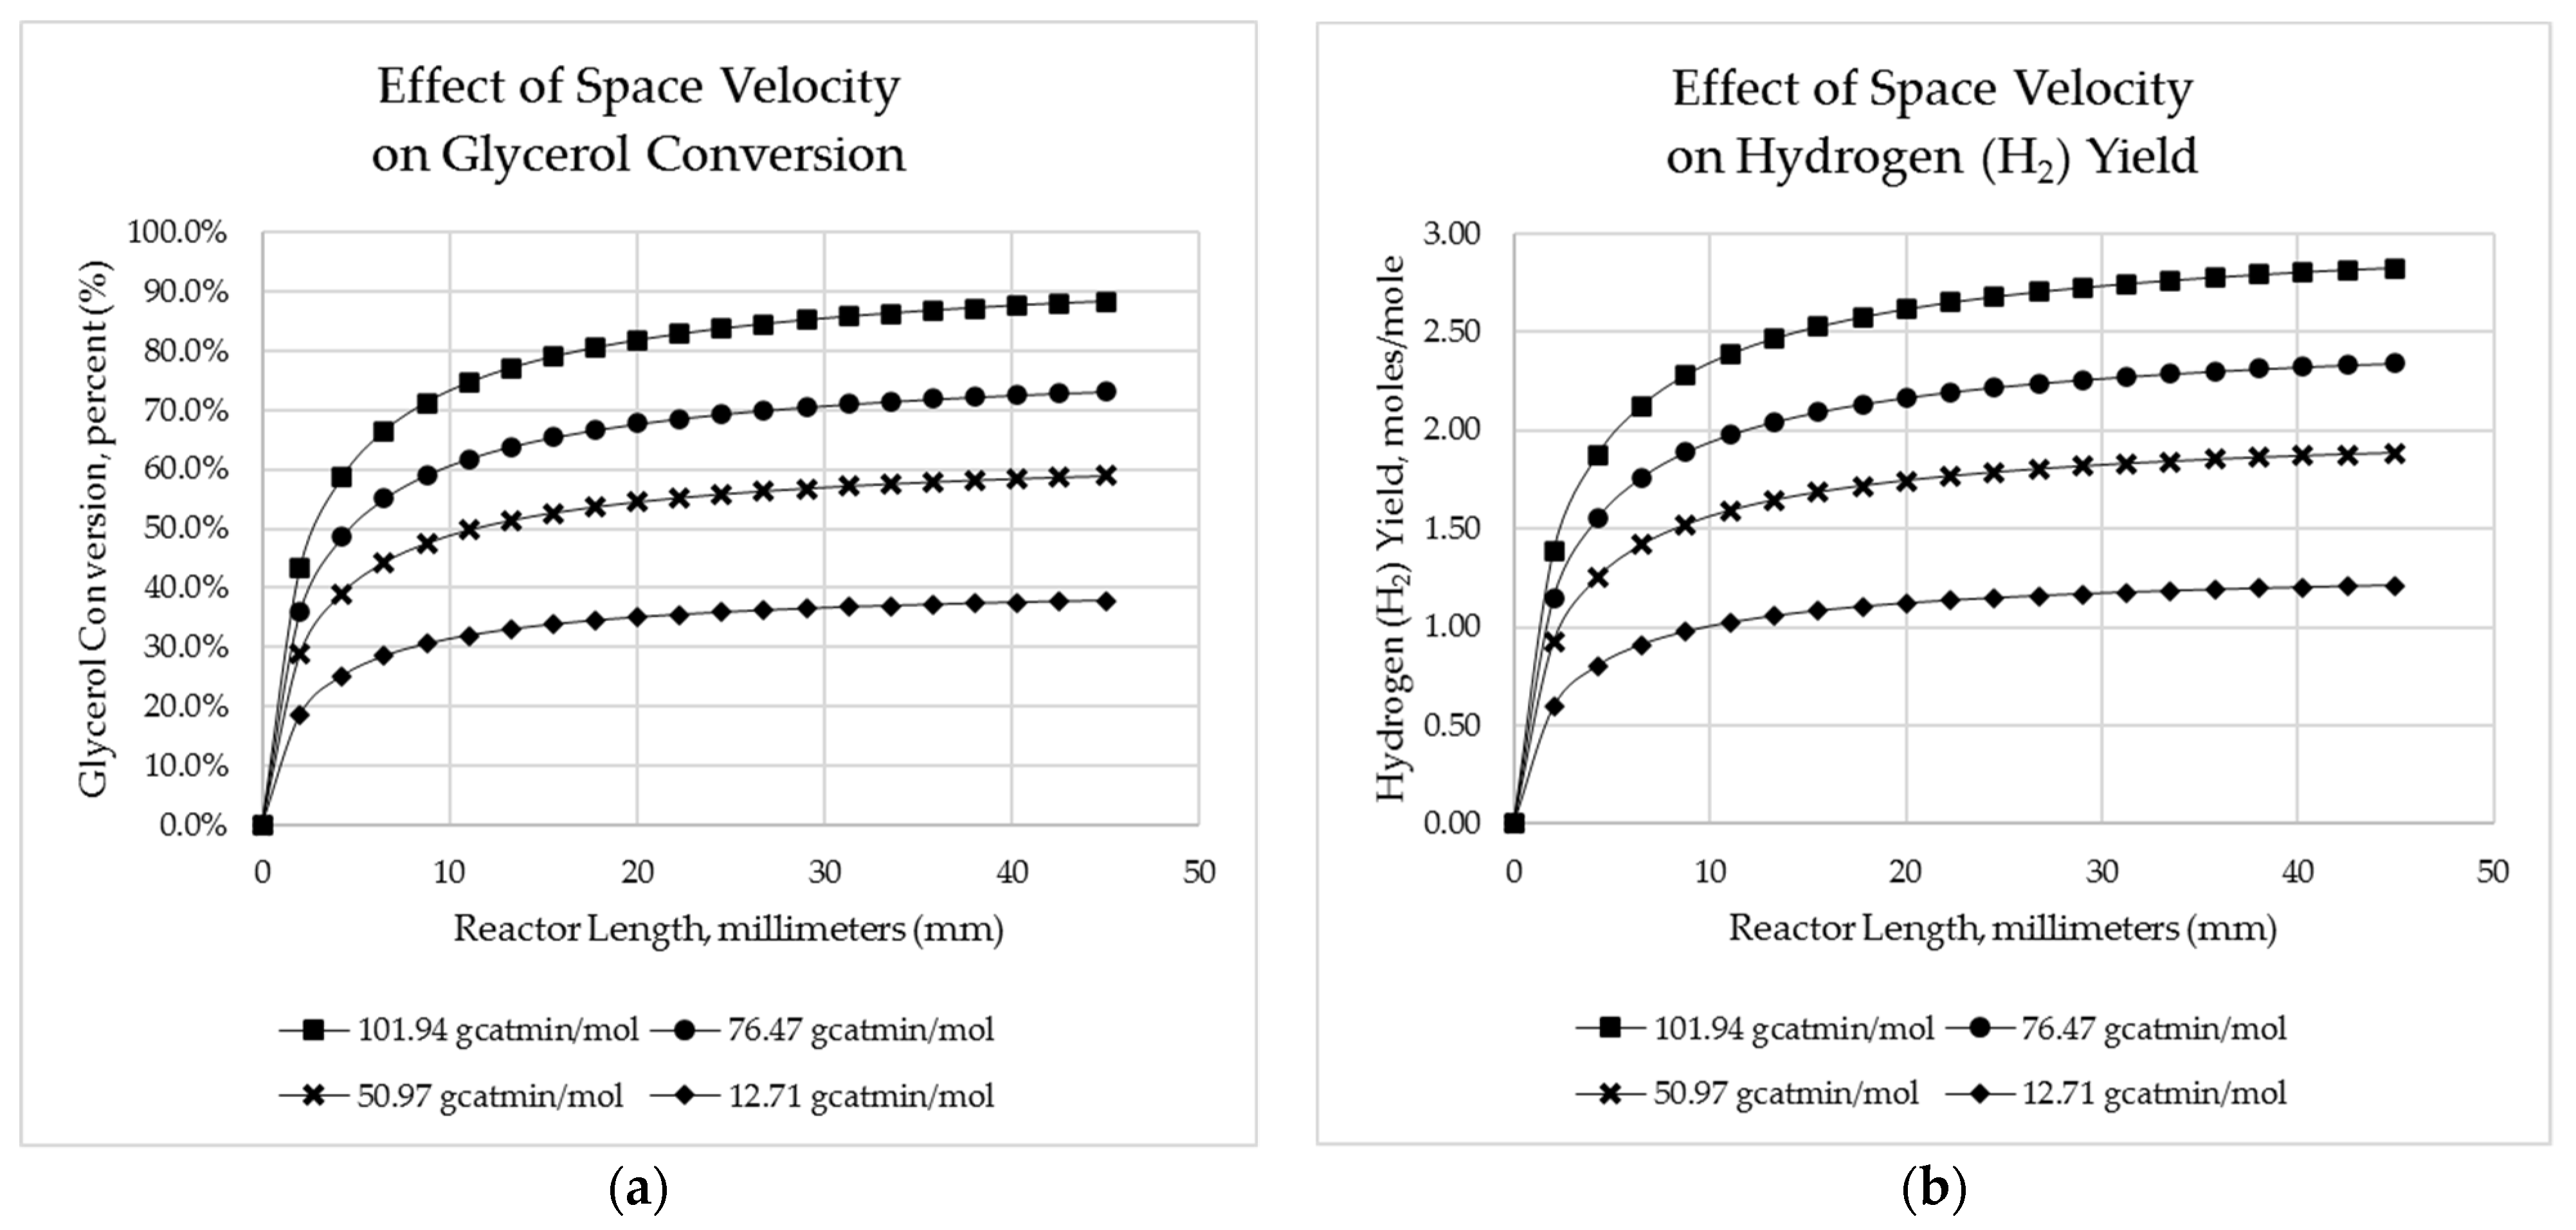
Figure 11.
Influence of reactor length on predicted crude glycerol conversion.


| Glycerol Products | Reaction Process | Glycerol Products | Reaction Process |
|---|---|---|---|
| Hydrogen | Oxyhydrocarbon Reforming | 1,2-propanediol | Hydrogenolysis or Fermentation |
| Glycerol carbonate | Carboxylation or Glycerolysis | 1,3-propanediol | Hydrogenolysis |
| Polyglycerol | Polymerization | Ethylene glycol | Hydrogenolysis |
| Acrolein | Dehydration | Epichlorohydrin | Halogenation |
| Acrylic Acid | Dehydration | Polyhydroxybutyrate (PHB) | Fermentation |
| 1,3-Dihydroxyacetone (DHA) | Oxidation or Fermentation | Propanol | Fermentation |
| Glyceraldehyde | Oxidation | Butanol | Fermentation |
| Glyceric acid | Oxidation | Butanediol | Fermentation |
| Glycolic acid | Oxidation | Lactic Acid | Fermentation |
| Hydroxypyruvic acid | Oxidation | Propionic acid | Fermentation |
| Mesoxalic acid | Oxidation | Citric acid | Fermentation |
| Oxalic acid | Oxidation | Succinic acid | Fermentation |
| Tartronic acid | Oxidation | Glyceric Acid | Fermentation |
| Hydroxyethanoic acid | Oxidation | Mannitol | Fermentation |
| Formic acid | Oxidation | Erythritol | Fermentation |
| Glycerol Ethers | Etherification | Arabitol | Fermentation |
| Hydrogen | Oxyhydrocarbon Reforming | 1,2-propanediol | Hydrogenolysis or Fermentation |
Table 2.
Proposed reaction schemes for glycerol/glycol in the literature.
| Sundari and Vaidya [19] | Liu and Lawal [22] |
|---|---|
| Cheng et al. [20] | Authayanun et al. [21] |
Table 3.
Atomic matrix for crude glycerol reforming.
| Atom | Compound | |||||
|---|---|---|---|---|---|---|
| - | 1 | 3 | 1 | - | - | |
| H | 2 | - | 8 | 4 | 2 | - |
| O | - | 2 | 3 | - | 1 | 2 |
Table 4.
Summary of rate equation assuming each step as a rate determining step assuming both reversible and irreversible reactions.
Table 4.
Summary of rate equation assuming each step as a rate determining step assuming both reversible and irreversible reactions.
| Equation (r.d.s.) | Rate Law Expression |
|---|---|
| ER_1 (Equation (20)) (Reversible) | |
| ER_2 (Equation (21)) (Reversible) | |
| ER_3 (Equation (22)) (Reversible) | |
| ER_4 (Equation (23)) (Reversible) | |
| ER_5 (Equation (20)) (Irreversible) | |
| ER_6 (Equation (21)) (Irreversible) | |
| ER_7 (Equation (22)) (Irreversible) | |
| ER_8 (Equation (23)) (Irreversible) | |
| LHHW_1 (Equation (24)) (Reversible) | |
| LHHW_2 (Equation (25)) (Reversible) | |
| LHHW_3 (Equation (26)) (Reversible) | |
| LHHW_4 (Equation (27)) (Reversible) |
Note: .
Table 5.
Rate law expression for Eley–Rideal and Langmuir–Hinschelwood models via oxidation reforming route.
Table 5.
Rate law expression for Eley–Rideal and Langmuir–Hinschelwood models via oxidation reforming route.
| Equation (r.d.s.) | Rate Law Expression |
|---|---|
| ER_1 (Equation (28)) | |
| ER_2 (Equation (29)) | |
| ER_3 (Equation (30)) | |
| ER_4 (Equation (31)) | |
| ER_5 (Equation (32)) | |
| ER_6 (Equation (33)) | |
| ER_7 (Equation (34)) | |
| LHHW_1 (Equation (35)) | |
| LHHW_2 (Equation (36)) | |
| LHHW_2a (Equation (37)) | |
| LHHW_3 (Equation (38)) | |
| LHHW_4 (Equation (39)) | |
| LHHW_5 (Equation (40)) | |
| LHHW_6 Huang et al. [38] | |
| LHHW_7 Huang et al. [38] | Based on Huang et al. (2012) using a reversible reaction and the stoichiometry equation as an elementary reaction |
Note: .
Table 6.
Summary of rate law expression for CO2 methanation.
| Equation (r.d.s.) | Rate Law Expression |
|---|---|
| ER_1 (Equation (41)) | |
| ER_2 (Equation (42)) | |
| ER_3 (Equation (43)) |
Table 7.
Summary of Rate Law Expression for H2 adsorption on active site.
| Equation (r.d.s.) | Rate Law Expression |
|---|---|
| ER_4 (Equation (42)) | |
| ER_5 (Equation (43)) | |
| ER_6 (Equation (44)) |
Table 9.
Parameter estimates for the overall power law model.
| Estimated Parameter | Irreversible Expression | Reversible Expression |
|---|---|---|
| - | ||
| - | ||
| - | ||
| - | ||
| - |
Note: and are the forward and reverse frequency factors; and are the activation energies for the forward and reverse reactions, respectively; , and are the forward reaction rate exponents; , , and are the reverse reaction rate exponents.
Table 10.
Parameter estimates for steam reforming models (with MATLAB 2017a).
| Parameter | PLM | ER 3 | ER 4 | ER 5 |
|---|---|---|---|---|
| - | - | - | ||
| - | - | - | ||
| - | - | |||
| - | - | |||
| - | - | - | ||
| - | - | |||
| - | - | - | ||
| - | - | |||
| - | - | - |
Note: and are the frequency factor and activation energy, respectively; and are the power law model exponents; is the equilibrium constant; , , , , , , and are the adsorption constants.
Table 11.
Parameter estimates for total oxidation models (with MATLAB 2017a).
| Parameter | PLM | LHHW 2 | LHHW 7 |
|---|---|---|---|
| - | - | ||
| n | - | - | |
| - | - | ||
| - | - | ||
| - | - | ||
| - | - | ||
| - | - | ||
| - | - | ||
| - | - |
Note: and are the frequency factor and activation energy, respectively; and are the power law model exponents; is the equilibrium constant; , , , , , and are the adsorption constants.
Table 12.
Parameter estimates for CO2 methanation models (with MATLAB 2017a).
| Parameter | PLM | ER 1 |
|---|---|---|
| - | ||
| - | ||
| - | ||
| - |
Note: and are the frequency factor and activation energy, respectively; and are the power law model exponents; is the equilibrium constant; , and are the adsorption constants.
Table 13.
BMV Estimates for the thermodynamics scrutiny of steam reforming model.
| Model | Parameter | Criterion 1 | Criterion 2 | Criterion 3 | |
|---|---|---|---|---|---|
| ER 4 | [J mol−1] | ||||
| [kPa−1] | |||||
| J mol−1 K−1] | |||||
| J mol−1] | |||||
| [kPa−1] | |||||
| J mol−1 K−1] | |||||
Table 14.
BMV estimates for the thermodynamics scrutiny of total oxidation model.
| Model | Parameter | Criterion 1 | Criterion 2 | Criterion 3 | |
|---|---|---|---|---|---|
| LHHW 2 | [J mol−1] | ||||
| [kPa−1] | |||||
| [J mol−1 K−1] | |||||
| [J mol−1] | |||||
| [kPa−1] | |||||
| [J mol−1 K−1] | |||||
Table 15.
BMV estimates for the thermodynamics scrutiny of co2 methanation model.
| Model | Parameter | Criterion 1 | Criterion 2 | Criterion 3 | |
|---|---|---|---|---|---|
| ER 1 | [J mol−1] | < 1 | |||
| [kPa−1] | |||||
| [J mol−1 K−1] | −52.49 | ||||
| [J mol−1] | < 1 | ||||
| [kPa−1] | |||||
| [J mol−1 K−1] | −46.14 | ||||
Table 16.
Comparison with reforming activation energies from literature.
| Reforming Process | Catalyst | Temperature (K) | Activation Energy (J/mol) | Ref. |
|---|---|---|---|---|
| Steam Reforming | Ni/CeZrCa | 773–923 | This work | |
| Ni/CeO2 | 873 | [43] | ||
| Ni/CeO2 | 673–973 | [44] | ||
| Co-Ni/Al2O3 | 773–823 | [20] | ||
| Total Oxidation | Ni/CeZrCa | 773–923 | This work | |
| N/A | N/A | (pyrolysis) | [45] | |
| La2O3 | 773–873 | (Methane) | [46] | |
| CO2 Methanation | Ni/CeZrCa | 773–923 | This work | |
| La2O3 | 773–873 | (Methane) | [46] | |
| Ni/Al(O)x | 555 | [39] |
Table 17.
One-dimensional pseudo-homogeneous model expressions [47].
Table 17.
One-dimensional pseudo-homogeneous model expressions [47].
| (52) | |
| (53) | |
| (54) | |
| (55) |
Table 18.
One-dimensional simplified heterogeneous model expressions [38].
Table 18.
One-dimensional simplified heterogeneous model expressions [38].
| (56) | |
| (57) | |
| (58) | |
| (59) | |
| (60) |
Table 19.
Boundary conditions applied in one-dimensional reactor models.
| Pseudo-Homogeneous | Simplified Heterogeneous | ||
|---|---|---|---|
Table 20.
Two-dimensional pseudo-homogeneous model expressions.
| (61) | |
| (62) |
Table 21.
Two-dimensional simplified heterogeneous model expressions.
| (63) | |
| (64) | |
| (65) | |
| (66) |
Table 22.
Boundary conditions applied in two-dimensional reactor models.
| , | ||
Table 23.
Mole fraction validation with experimental work.
| Species | Absolute Average Deviation (AAD) | |||
|---|---|---|---|---|
| 1D PH | 1D HET | 2D PH | 2D HET | |
| O2 | 3.7% | 16.2% | 7.7% | 16.2% |
| N2 | 9.1% | 12.8% | 3.9% | 3.3% |
| CO2 | 8.6% | 6.0% | 18.2% | 32.6% |
| H2 | 10.5% | 11.6% | 11.6% | 20.1% |
| CH4 | 6.1% | 8.4% | 6.6% | 0.6% |
Publisher’s Note: MDPI stays neutral with regard to jurisdictional claims in published maps and institutional affiliations. |
© 2022 by the authors. Licensee MDPI, Basel, Switzerland. This article is an open access article distributed under the terms and conditions of the Creative Commons Attribution (CC BY) license (https://creativecommons.org/licenses/by/4.0/).
Share and Cite
MDPI and ACS Style
Odoom, A.; Fabrik, M.; Salama, A.; Shirif, E.; Ibrahim, H. Mechanistic Kinetic Modelling Framework for the Conversion of Waste Crude Glycerol to Value-Added Hydrogen-Rich Gas. Catalysts 2022, 12, 200. https://doi.org/10.3390/catal12020200
AMA Style
Odoom A, Fabrik M, Salama A, Shirif E, Ibrahim H. Mechanistic Kinetic Modelling Framework for the Conversion of Waste Crude Glycerol to Value-Added Hydrogen-Rich Gas. Catalysts. 2022; 12(2):200. https://doi.org/10.3390/catal12020200
Chicago/Turabian StyleOdoom, Anita, Michael Fabrik, Amgad Salama, Ezeddin Shirif, and Hussameldin Ibrahim. 2022. "Mechanistic Kinetic Modelling Framework for the Conversion of Waste Crude Glycerol to Value-Added Hydrogen-Rich Gas" Catalysts 12, no. 2: 200. https://doi.org/10.3390/catal12020200
Note that from the first issue of 2016, this journal uses article numbers instead of page numbers. See further details here.