Article

Photocatalytic Degradation of Thiacloprid Using Tri-Doped TiO2 Photocatalysts: A Preliminary Comparative Study

1
Department of Industrial Engineering, University of Salerno, Via Giovanni Paolo II, 132, 84084 Fisciano, Italy
2
Department of Chemistry and Biology “A. Zambelli” & INSTM Research Unit, University of Salerno, Via Giovanni Paolo II, 132, 84084 Fisciano, Italy
*
Authors to whom correspondence should be addressed.
Catalysts 2021, 11(8), 927; https://doi.org/10.3390/catal11080927
Submission received: 30 June 2021 / Revised: 26 July 2021 / Accepted: 29 July 2021 / Published: 30 July 2021
(This article belongs to the Special Issue Heterogeneous Photocatalysis: A Solution for a Greener Earth)

Abstract

:
Different tri-doped TiO2 photocatalysts (Fe-N-P/TiO2, Fe-N-S/TiO2, Fe-Pr-N/TiO2, Pr-N-S/TiO2, and P-N-S/TiO2) were successfully prepared and tested in the photocatalytic removal of thiacloprid (THI) under UV-A, visible, and direct solar light irradiation. The physical-chemical properties of the prepared catalysts were analyzed by different characterization techniques, revealing that dopants are effectively incorporated into the anatase TiO2 lattice, resulting in a decrease of the energy band gap. The reduction of photoluminescence intensity indicates a lower combination rate and longer lifespan of photogenerated carriers of all doped samples in comparison with the un-doped TiO2. The doped photocatalysts not only significantly promote the photodegradation under UV-A light irradiation but also extend the optical response of TiO2 to visible light region, and consequently improve the visible light degradation of THI. Fe-N-P tri-doped TiO2 sample exhibits the highest THI photodegradation degree (64% under UV-A light, 29% under visible light and 73% under solar light).

1. Introduction

Today, the most important commercial insecticides available on the market are neonicotinoids, thanks to their high insecticidal activity, adequate water solubility, and high stability [1]. Usage has spread beyond agriculture to home garden [2]. Unsurprisingly, widespread use of neonicotinoids has led to an almost ubiquitous environmental presence of these pollutants, including in surface water and groundwater [3]. The neonicotinoid insecticides, both at high and low concentrations (e.g., LC50 of 5 ng/bee) [4], bind to nervous systems causing receptor blockage, paralysis, and death. Thiacloprid (THI) is an insecticide, belonging to the second-generation neonicotinoid pesticides, introduced by Bayer Crop Science with the name Calipsol [5]. Like all neonicotinoid insecticides, THI selectively acts on the insect nervous system as an agonist of the nicotinic acetylcholine receptors. This unique mode of action makes THI highly applicable for controlling the biological effect on insects which developed resistance to conventional chlorinated hydrocarbons, organophosphate, carbamate, and pyrethroid insecticides [6]. Due to its high water solubility and recalcitrance to biodegradation, THI results still persistent in water after the conventional wastewater treatment [7]. Thus, various technologies have been tested to degrade THI from water. Unfortunately, all the proposed techniques suffer to relative low removal efficiency and require continued use of electricity and chemicals [8,9]. Therefore, it is of great importance to develop a reliable and effective method for removing THI from water.
Heterogeneous photocatalysis is an advanced oxidation technology, which offers a promising alternative to remove a great variety of organic pollutants with high efficient degradation rate. TiO2 is the most widely studied photocatalyst because of its excellent properties, such as non-toxic nature, water insolubility, low cost, favorable band edges position, photochemical stability, and high light conversion efficiency [10,11].
However, the large band gap energy of TiO2 (3.2 eV for anatase) makes it active only under UV-A light irradiation (~5% of solar spectrum) and scarcely efficient with visible light, which comprises large portion of solar spectrum (about 45%). Different strategies have been developed to enhance the photocatalytic efficiency of TiO2 under solar irradiation. Previous studies revealed that doping with various metals and non-metals elements (Fe-N and Fe-Pr) or coupling different semiconductors [12] lessens the band gap of TiO2 for the photo-excitation (red shift) and simultaneously reduces the recombination rate of photogenerated electron–hole pairs. One possible doping route is the incorporation into TiO2 crystal structure of non-metal elements, which could extend the light absorption to the visible region. Among non-metal elements, the TiO2 doping with nitrogen was considered to be the most effective one, due to its high stability and efficiency. In fact, nitrogen (atomic radius 0.56 Å) can be easily introduced into the TiO2 structure, due to the atomic size similar to oxygen (atomic radius 0.48 Å) [13]. Further, it was proved that doping with sulfur increases photocatalytic activity of TiO2 under visible light irradiation [14]. In the last few years, phosphorous doped TiO2 photocatalysts have also gained considerable research interest because of their high photocatalytic activity under visible light irradiation. The visible light response of P-doped TiO2 has been attributed to the formation of Ti−O−P bonds [15]. Although N-doped, S-doped, and P-doped TiO2 exhibited improved visible-light-induced photocatalytic activity, electron–hole recombination is still an obstacle that limits the effective use of non-metals doped TiO2 photocatalysts.
Doping lanthanides (such as Pr, Nd, Sm, and Yb), having a 4f electron configuration, can act as electron sink, thereby reducing the recombination of photogenerated electron-hole pairs and efficiently improving the photochemical or electrochemical properties of semiconductors [16].
On other hand, the doping with transition metals (such as Cr, Mn, Fe, Co, and Cu), having unfilled d-electron structures, can accommodate more electrons, introducing impurity levels in the band gap of TiO2 [17]. For example, Fe3+ having ionic radius (0.64 Å) close to Ti4+ (0.68 Å) could replace Ti in the crystalline structure, allowing the formation of an inter band, within the conduction band and the valence band edge, capable of absorbing visible light [18]. Doping TiO2 with two or more dopants has a significant synergistic effect on photocatalytic activity compared to un-doped samples [19]. The insertion of dopants in the TiO2 matrix changes the recombination dynamics of light charge carriers (electron–hole pairs) and causes the energy gap shift, resulting in nanoparticles active under visible light. Recently, tri-doped TiO2 has been the focus for further improving the visible light photocatalytic activity. Umare et al. [20] reported an enhanced visible light activity of Ga, N, and S co-doped TiO2 towards the decomposition of azo dyes. The highest dye removal efficiency, compared with the single doped and co-doped TiO2 was described by Maki et al., who synthetized Fe-Ce-N tri-doped TiO2 [21]. To our knowledge, a systematic study on effect of different elements (e.g., Fe, Pr and N, P, S) in tri-doped TiO2 for the removal of THI has never been reported.
In this work, different tri-doped TiO2 photocatalysts were successfully synthesized by sol-gel process. The effect of doping elements on the photoactivity of the tri-doped samples towards the degradation of THI in aqueous solution under UV-A, visible, and solar light irradiation was investigated. In particular, an initial concentration of THI equal to 0.5 mg/L was chosen since this pesticide belongs to the so-called “emerging contaminants”, and it is present at very low concentration (0.02–4.5 µg/L) in surface water [22,23].

2. Results

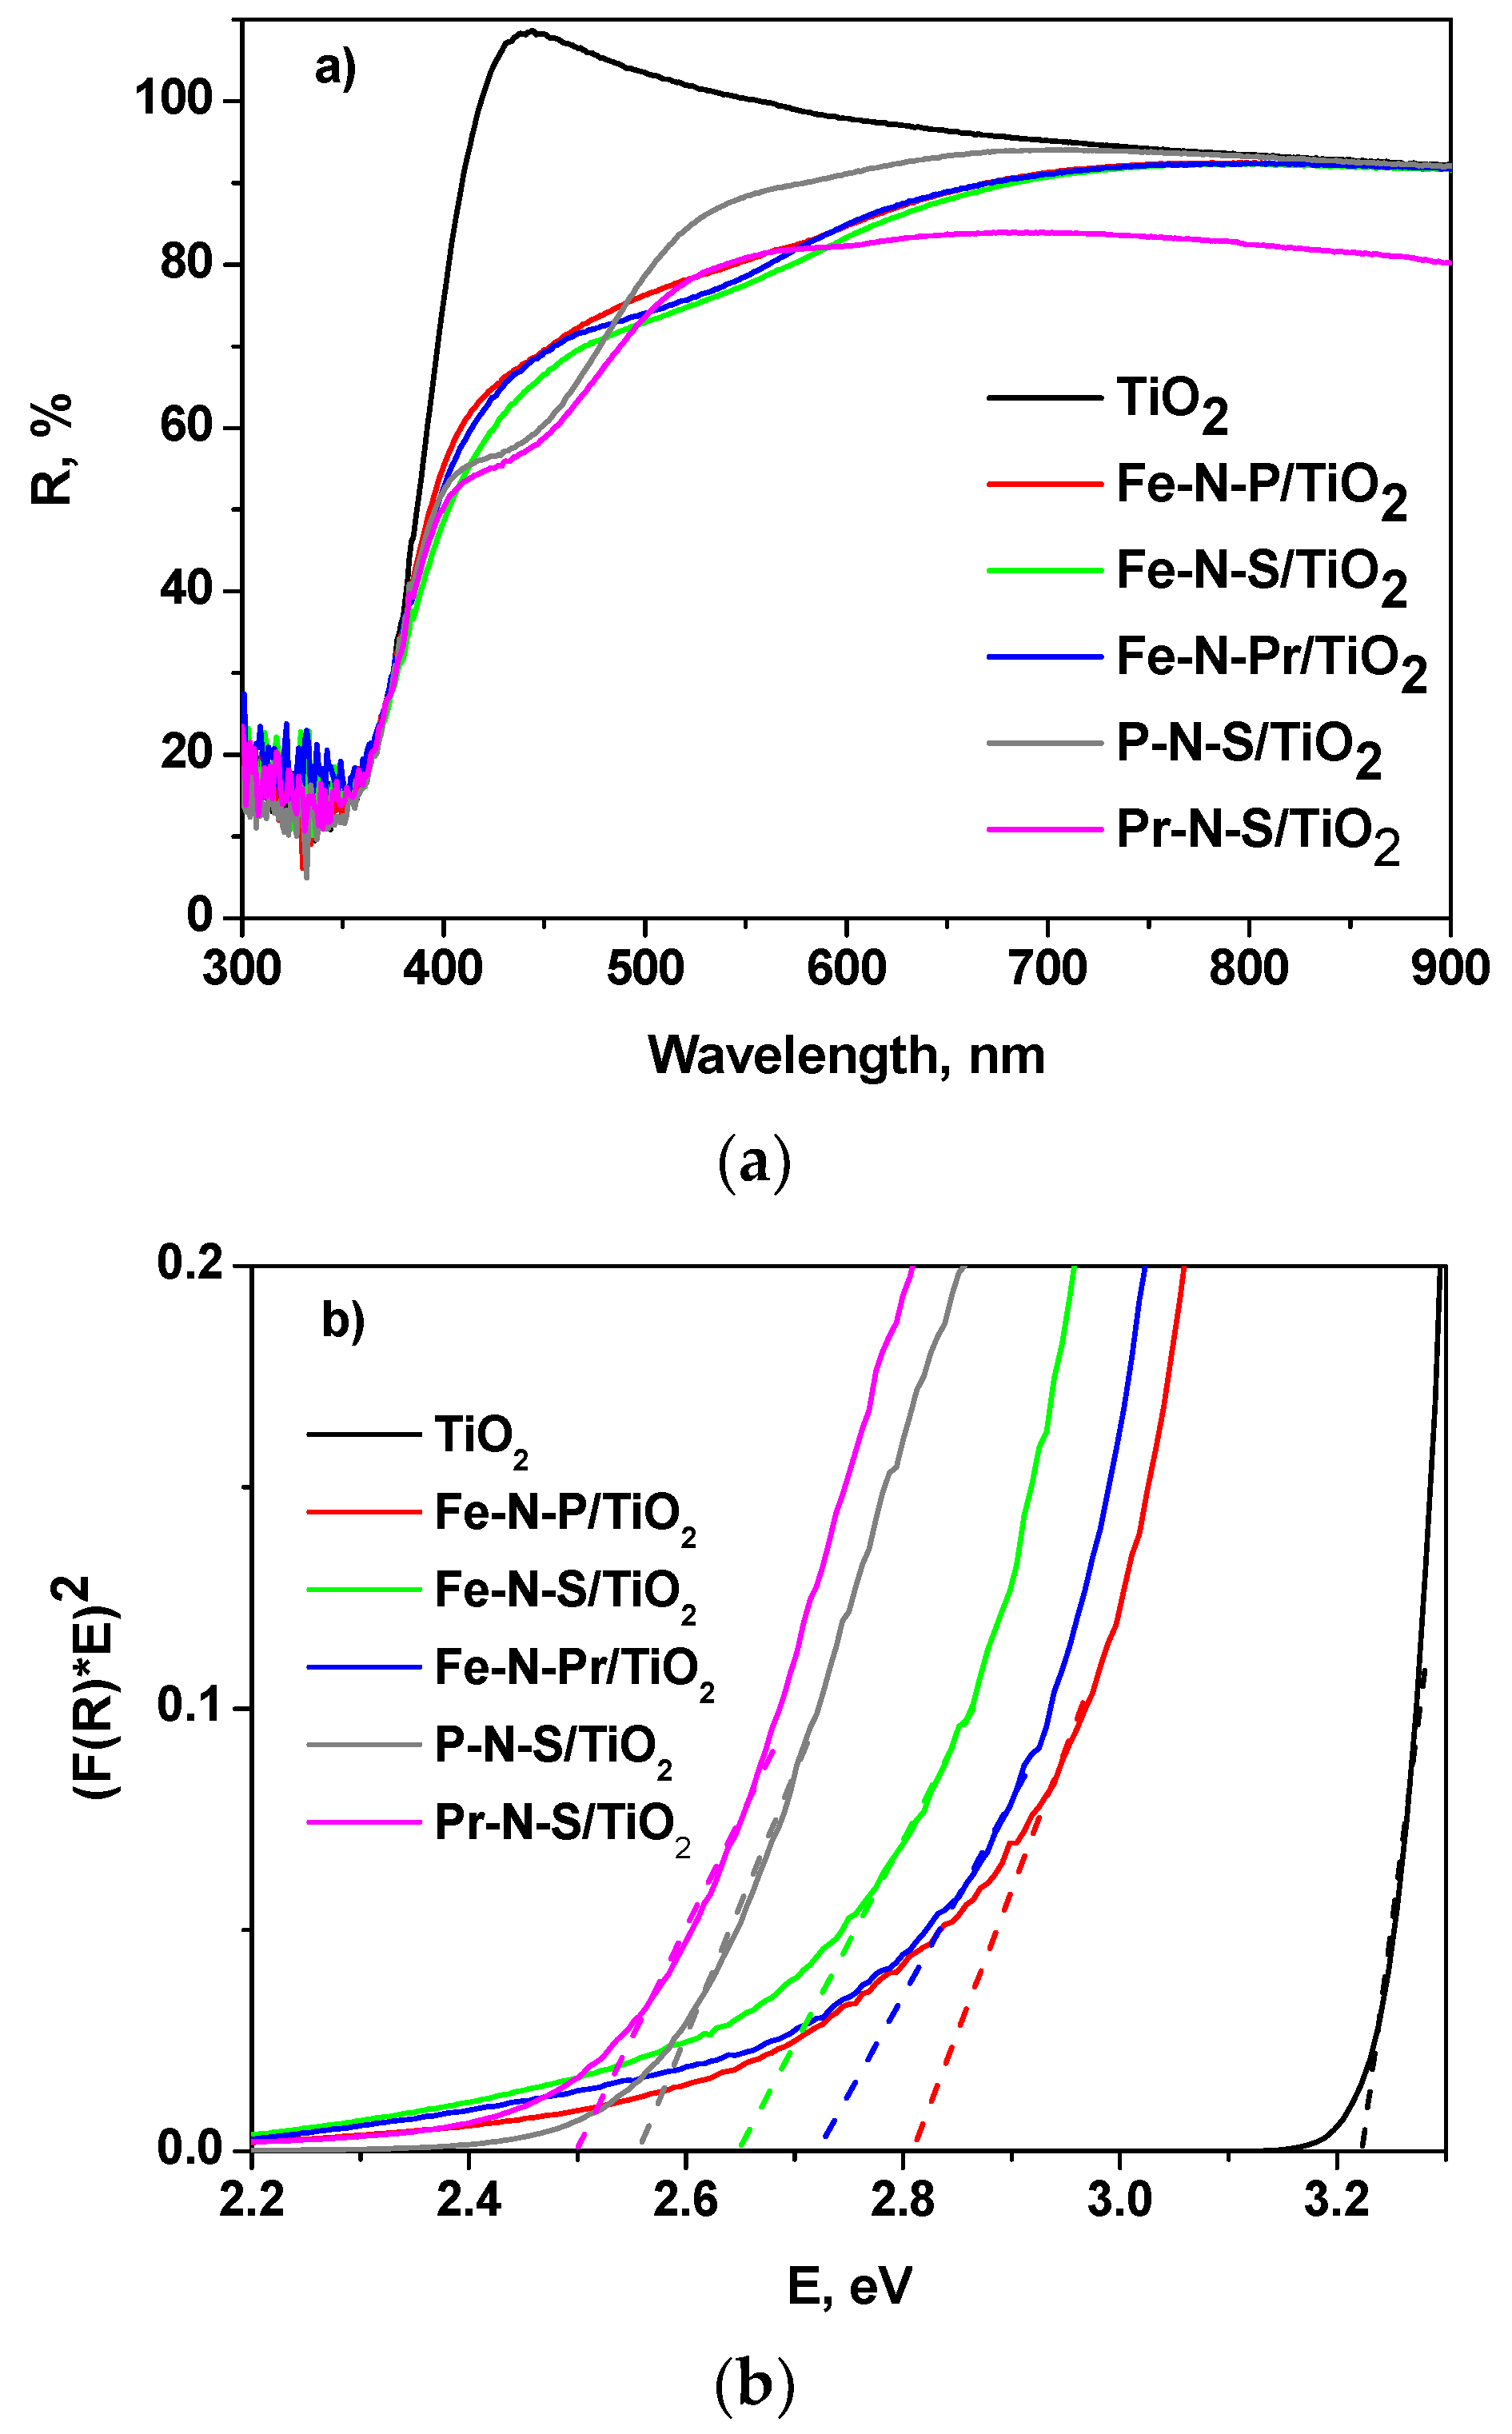
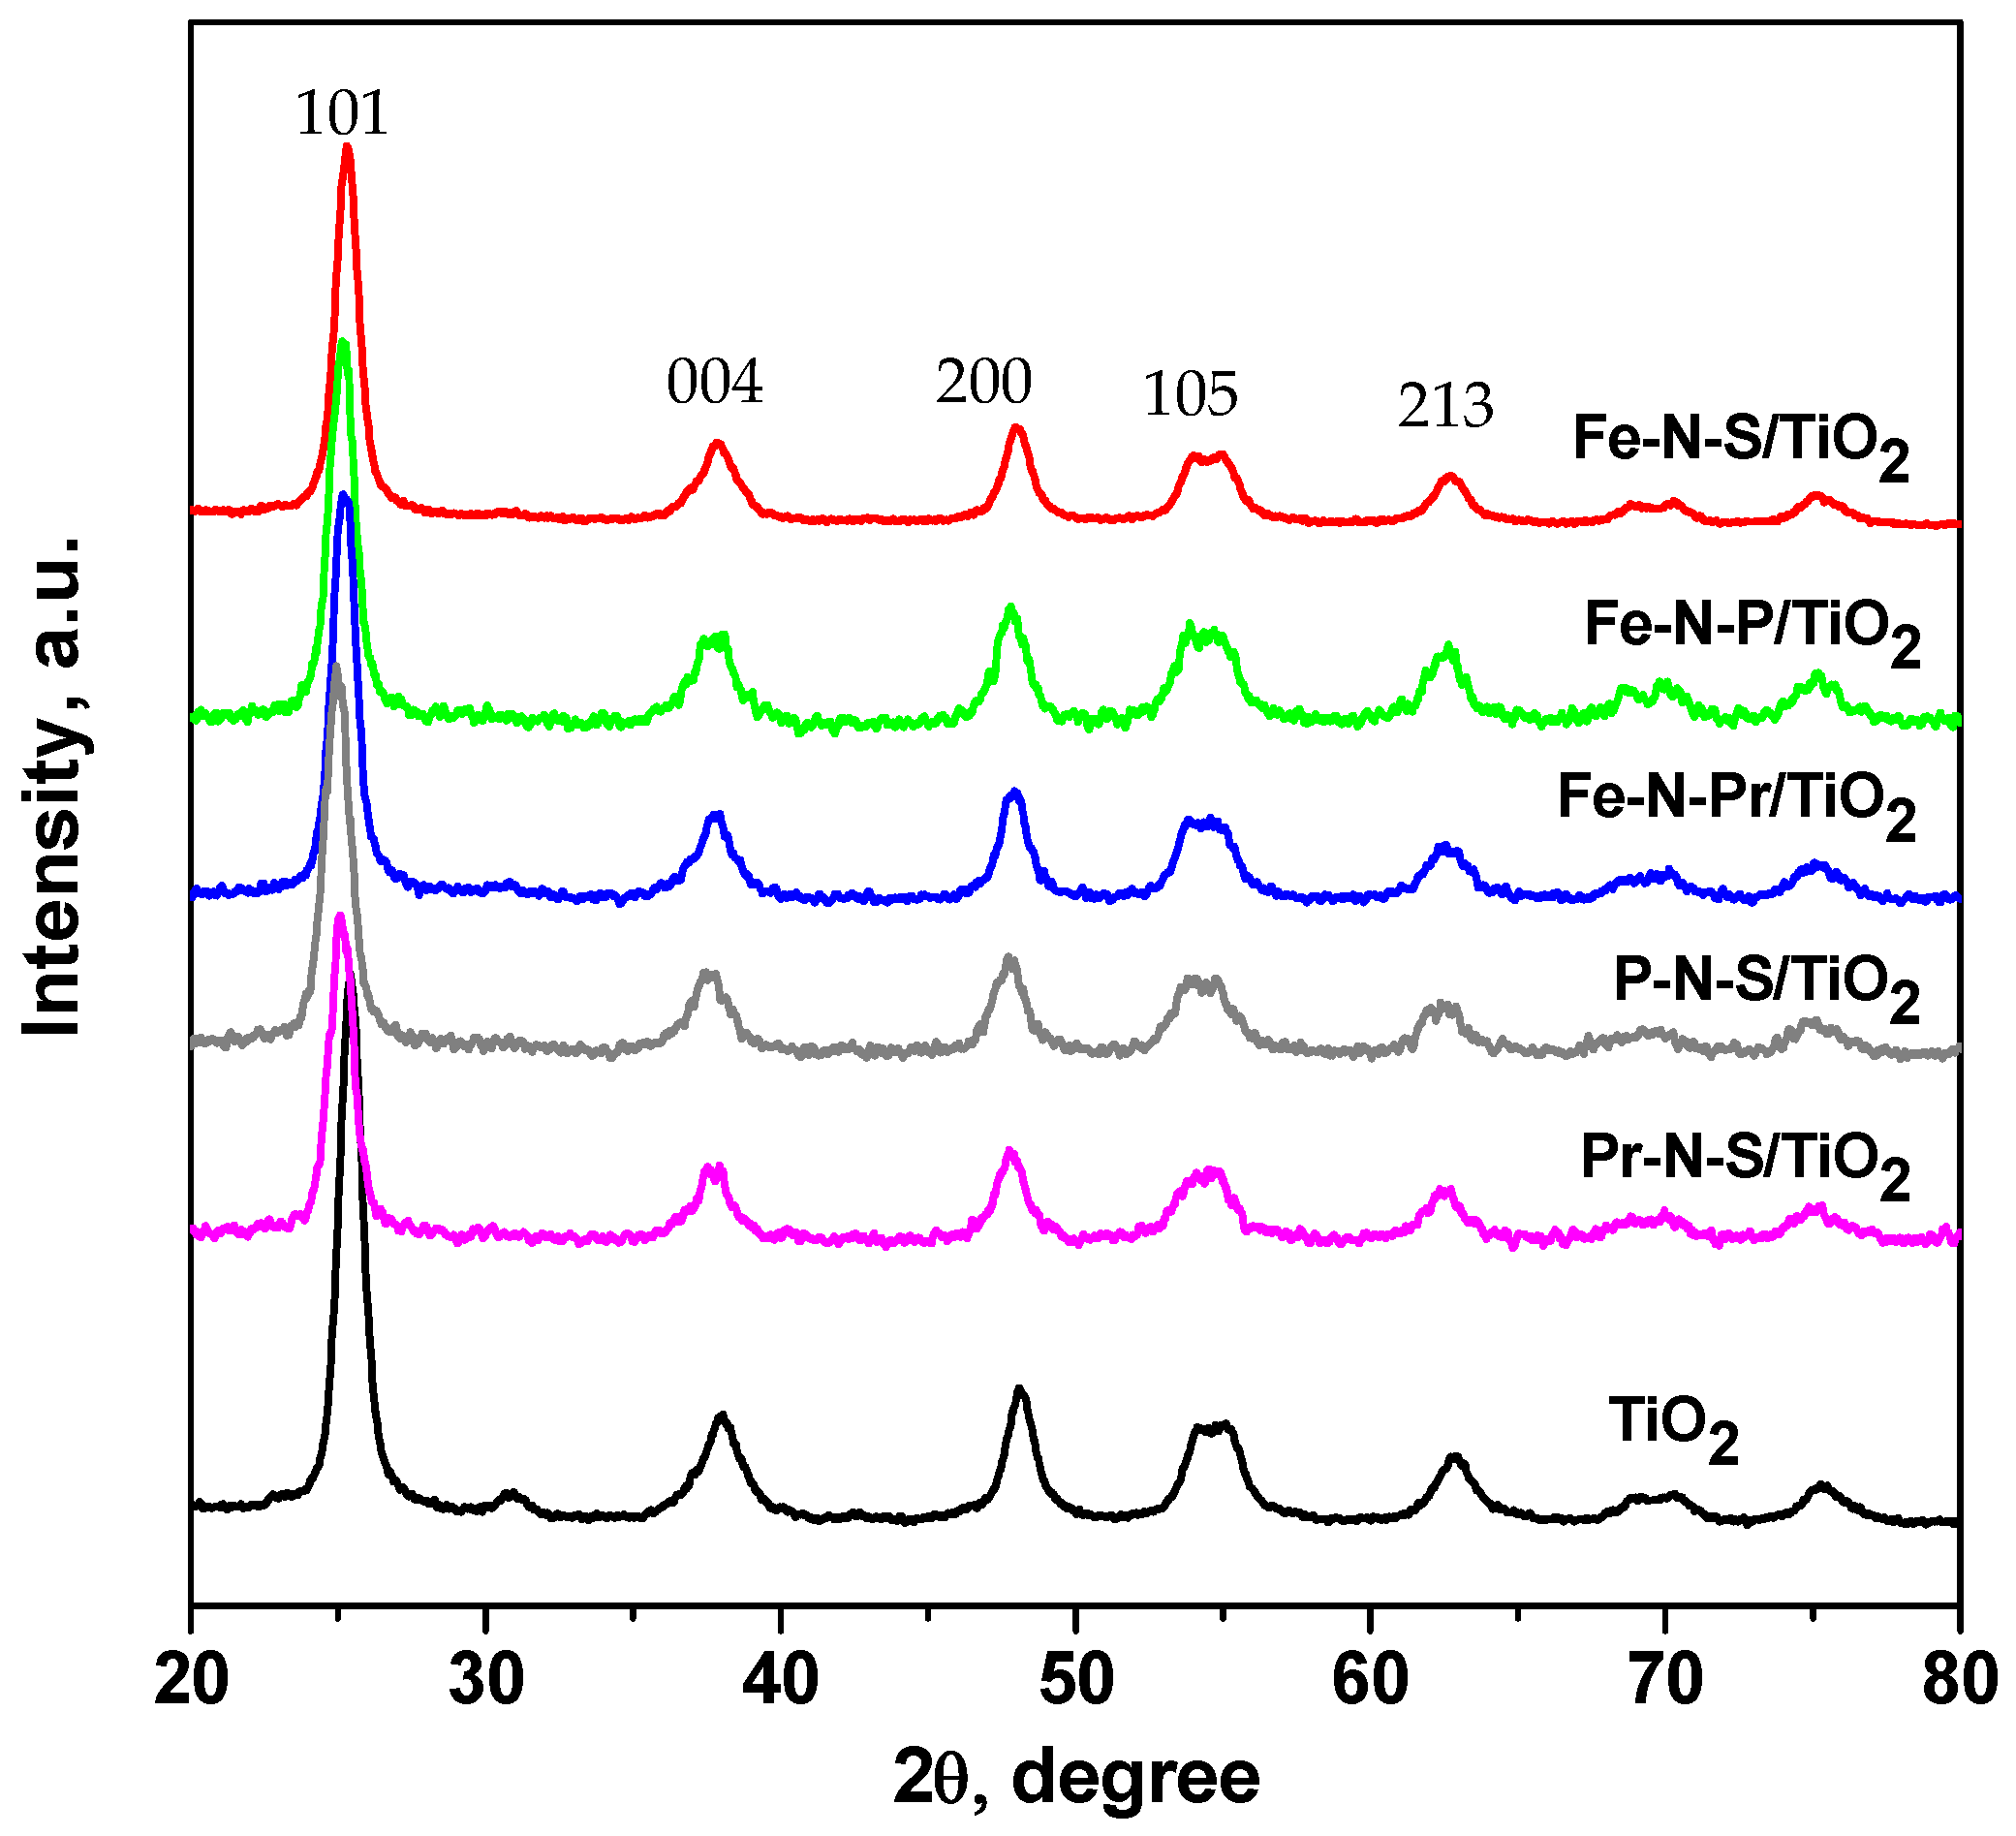
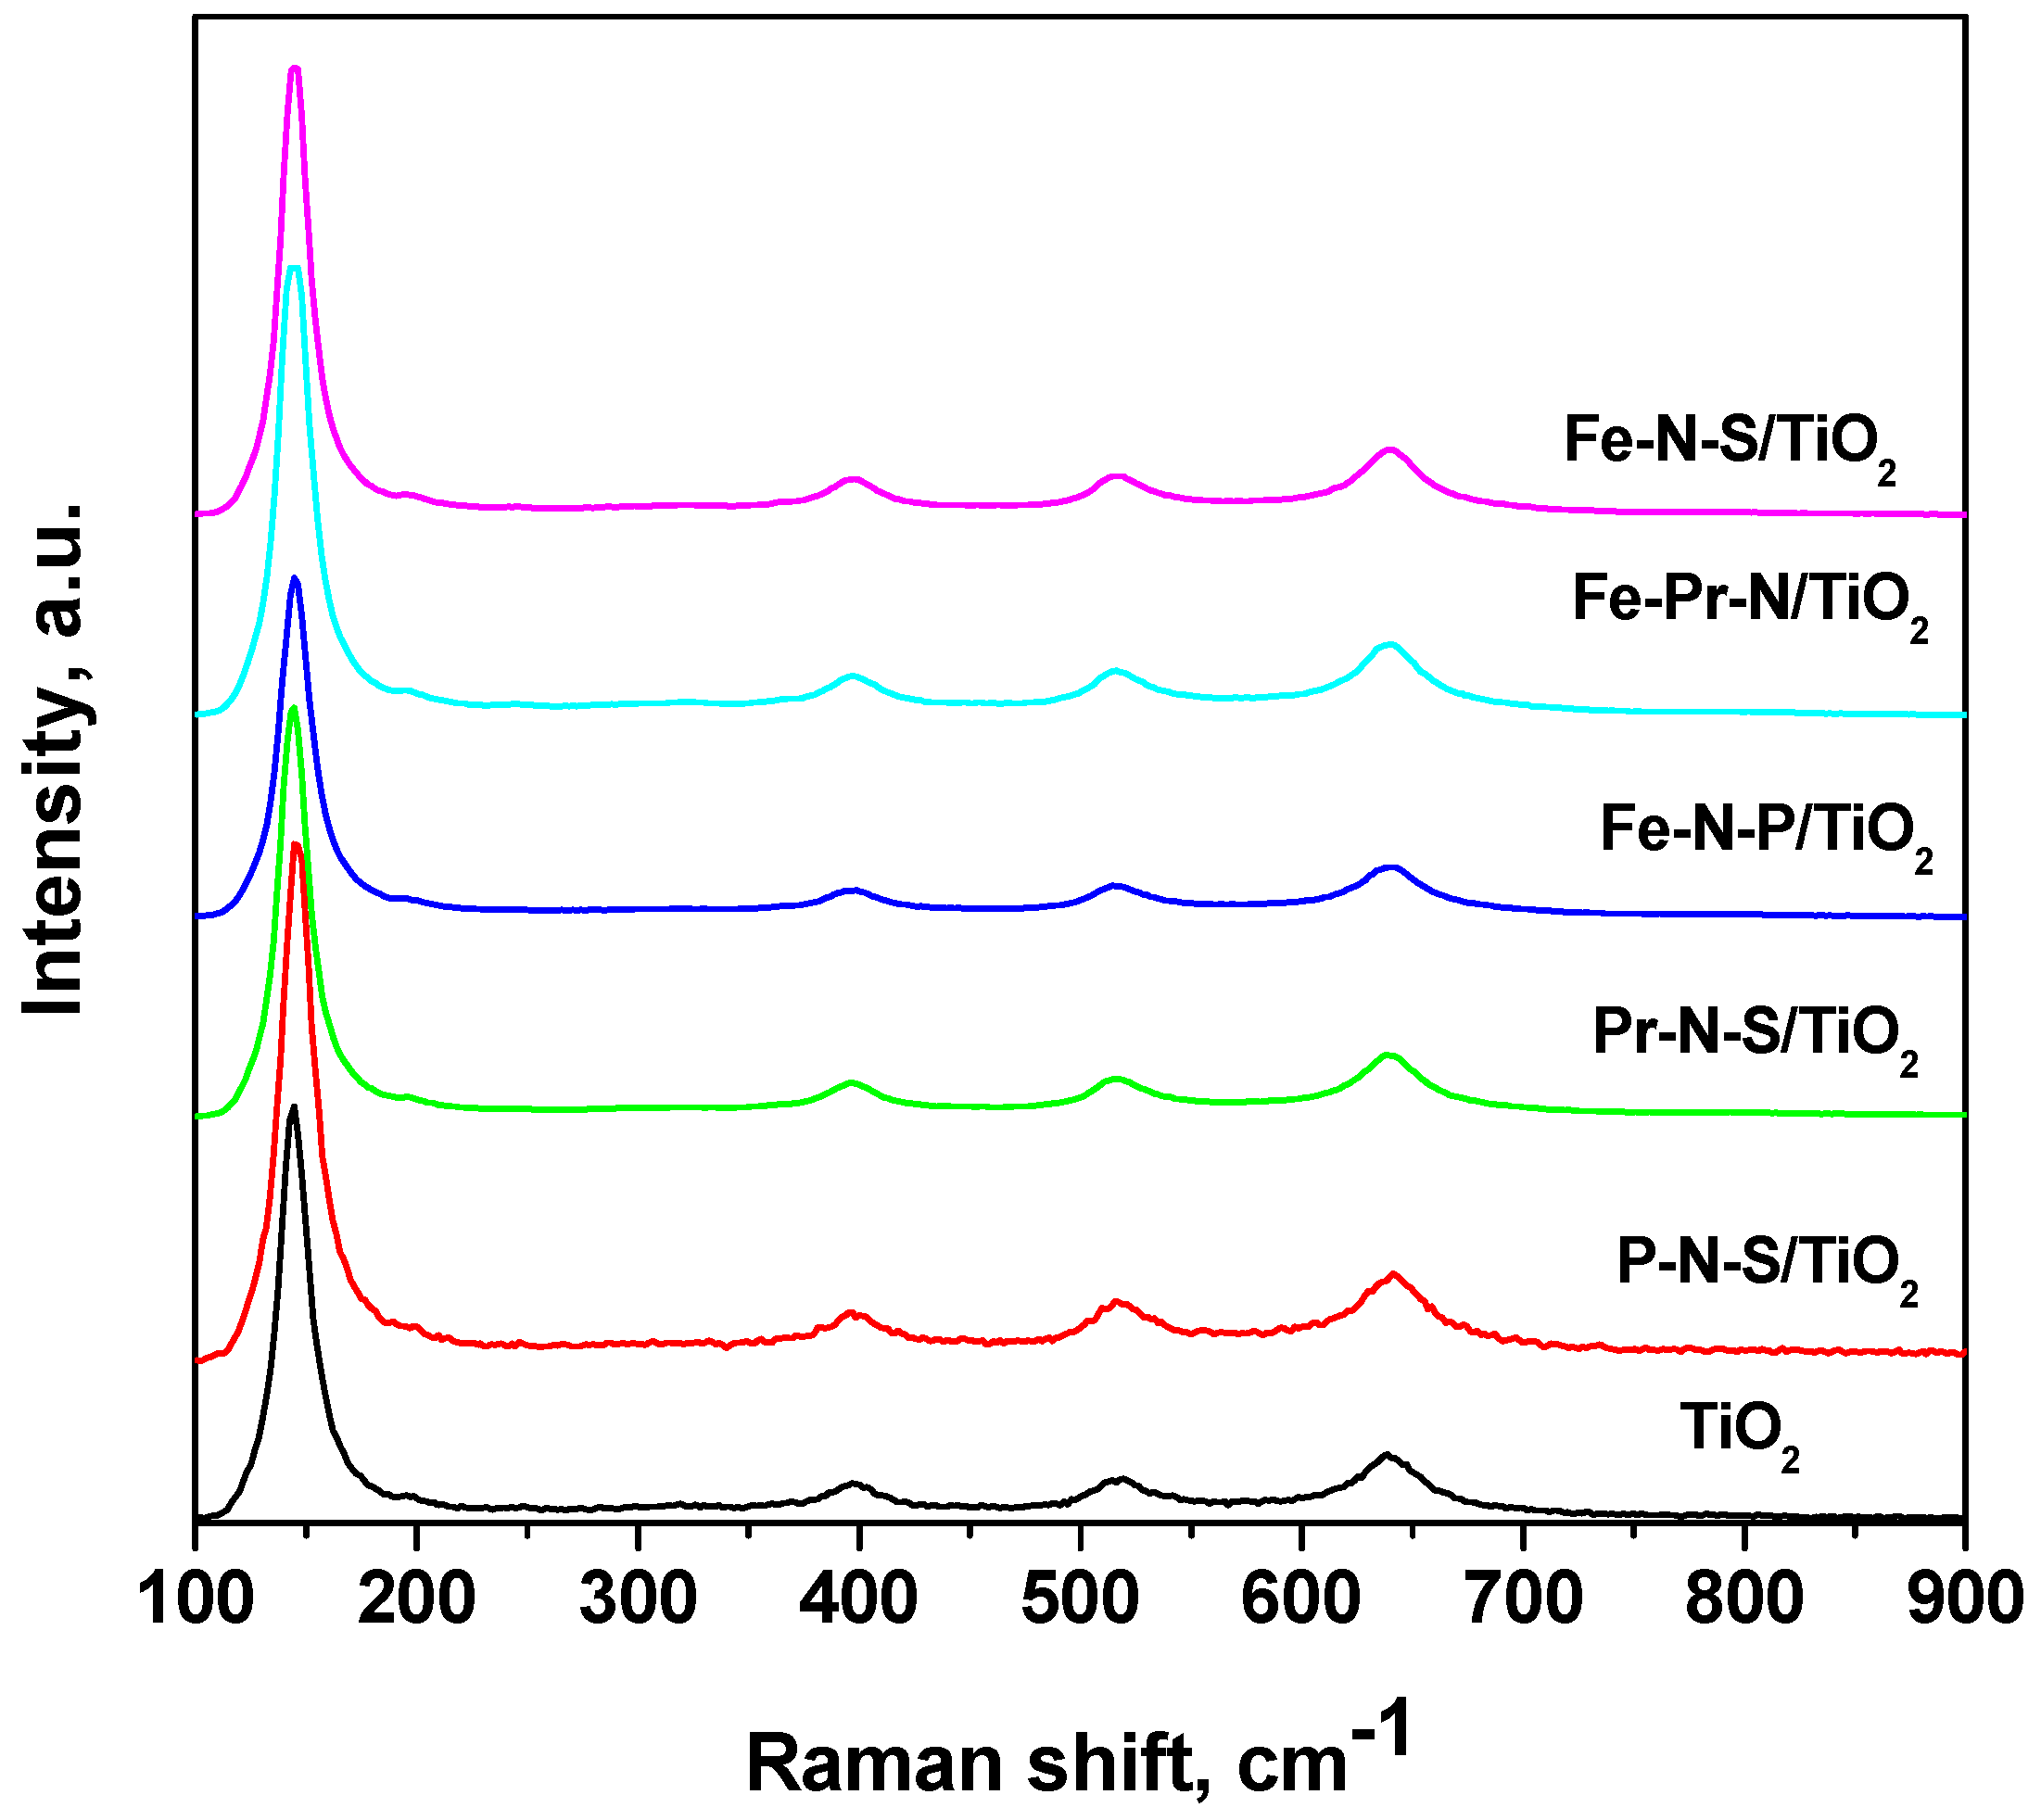
2.1. Characterization of Photocatalysts

Specific surface area (SBET) of synthesized tri-doped TiO2 samples, calculated by BET method, are reported in Table 1 and also compared with SBET of an un-doped TiO2 sample. The un-doped TiO2 sample shows SBET value of 107 m2 g−1, which is comparable with SBET value of P-N-S/TiO2 and Fe-N-P/TiO2 samples, while all the other tri-doped TiO2 samples have lower SBET values. Lower values of Fe-N-S/TiO2, Fe-N-P/TiO2, Fe-Pr-N/TiO2, and Pr-N-S/TiO2 SBET compared to un-doped TiO2 may be associated with the formation of metal oxide clusters which could obstruct (clog) structural pores [24]. Figure 1a reports UV-Vis DRS spectra of TiO2, Fe-N-P/TiO2, Fe-N-S/TiO2, Fe-Pr-N/TiO2, Pr-N-S/TiO2, and P-N-S/TiO2 samples in the range 300–900 nm.
The main absorption of the un-doped TiO2 is located in the UV-A region, and no absorption is detected in the visible region. The Fe-N-P/TiO2, Fe-N-S-TiO2, and Fe-Pr-N-TiO2 samples exhibit similar absorption performances in the range 450–600 nm, probably due to the presence of dopant elements into TiO2 lattice [25,26]. Both Pr-N-S/TiO2 and P-N-S/TiO2 sample absorption spectra present a shoulder in the visible region. Band gap energies (Ebg) are calculated by Kubelka–Munk function (Figure 2) [27], and the values are shown in Table 1. In detail, the band gap value decreases from 3.2 eV for un-doped TiO2 to 2.5–2.8 eV for the tri-doped TiO2 samples. These results demonstrate that the introduction of metallic and non-metallic elements in the TiO2 crystal structure can induce the absorption of visible light, due to the decrease of band gap value. XRD patterns of the un-doped TiO2 and tri-doped samples in the 2θ range 20–80° are reported in Figure 2.
Pure TiO2 and all tri-doped samples present only the characteristic XRD peaks of TiO2 anatase phase [28]. None of characteristic peaks of dopant element oxides have been detected in XRD patterns of all tri-doped samples; despite this, small quantity of oxides, lower than that detectable by the XRD, could be also present. Moreover, a remarkable shift of (101) reflection to lower 2θ angles, with respect to the TiO2 XRD peak position, was observed in the XRD pattern of Pr-N-S/TiO2 and P-N-S/TiO2 samples. This shift can be explained by the insertion of dopant elements into semiconductor TiO2 crystalline structure resulting in an increasing of TiO2 lattice parameters. It is, in fact, well known that the doping with non-metallic elements (such as nitrogen, phosphorus, and sulfur) implies lattice deformations, due to the substitution of oxygen atoms by non-metallic dopants, all of them having atomic/ionic radius larger than oxygen [29]. The average crystallite size and lattice parameters data (determined by using Scherrer’s equation and the (101) reflections of XRD patterns) of un-doped and tri-doped TiO2 samples are reported in Table 1. The crystallite sizes of most of tri-doped samples are lower than that of TiO2. This result is in agreement with literature studies [26,29,30], reporting that the tri-doping process commonly hinders the crystallite growth. In detail, P-N-S/TiO2 and Fe-N-P/TiO2 samples exhibit crystallite size values lower to that of un-doped TiO2 (10 nm). The lattice parameters (Table 1) of all tri-doped samples undergo an increase with respect to the value of un-doped titania (a = b = 3.74 Ǻ, c = 8.68 Ǻ), which could be attributed to the difference between the radius of dopant elements and those of the host semiconductor atoms [31].
Figure 3 reports the Raman spectra of all prepared samples in the range 100–900 cm−1.
The Raman bands at 144, 197, 399, 516, and 639 cm−1 were observed for un-doped TiO2 and tri-doped TiO2 samples, confirming the presence of anatase crystalline phase in all the prepared samples. It is worth noting that the most intense Raman band at 144 cm−1 of un-doped TiO2 was slightly shifted (blue shift) after the doping process. This experimental evidence could be related to the disorder in the TiO2 lattice due to the incorporation of dopant elements that generate defects (such as oxygen vacancies in anatase structure) [31].
Figure 4 shows the FTIR absorbance spectra of all tri-doped TiO2 samples. The IR band at about 3400 cm−1 is due to the O−H stretching vibration, and the band at 1630 cm−1 corresponds to the H−O−H bending vibration of adsorbed water on the photocatalysts surface [32]. The low-frequency broad band in the range 400–900 cm−1 corresponds to the Ti-O-Ti vibrational mode [33]. It is worth it to observe that all tri-doped TiO2 samples show different shape of low frequency band together with a little shift of the position to lower wavenumbers that could be an indication of structure defects [34]. Consistent with XRD results and according to studies already reported in the literature [32,33,34], the observed band shift should be related to the introduction of dopant species into the TiO2 framework. Figure 5 reports photoluminescence spectra (PL) of all the samples, acquired at room temperature in the emission range 325–500 nm, by using an excitation wavelength of 280 nm. All samples evidence a strong emission peak at ca 380 nm, due to the electron–hole pairs recombination. The intensity of this band, together with intensity of the entire emission spectrum, is instead reduced in all tri-doped TiO2 samples. In detail, the intensity of the 380 nm PL peak decreases in the following order: TiO2 > Fe-N-S/TiO2 > Fe-N-Pr/TiO2 > P-N-Pr/TiO2 > Pr-N-S/TiO2 > Fe-N-P/TiO2. As it is generally accepted that a low PL intensity indicates a lower electrons-holes recombination rate and longer duration of photogenerated carries [35], the result of Figure 5 suggests that, for tri-doped TiO2, a photogenerated gap separation higher than in un-doped TiO2 is expected. Keeping in mind that, generally, PL intensity is directly related with the recombination of electrons and holes, and lower PL intensity indicates a lower recombination rate, as well as higher lifespan of photogenerated carriers, this result is expected. The observed lower PL band intensity in tri-doped TiO2 with respect to un-doped TiO2 should be related to a better separation of photogenerated electron-hole in the doped samples.

2.2. Photocatalytic Activity Results

The photocatalytic degradation of THI in aqueous solution under UV-A and visible light irradiation was evaluated for all the doped photocatalysts and compared with bare TiO2. Figure 6 reports the THI relative concentration as a function of irradiation time for all the tested photocatalysts in presence of UV-A, visible, and direct solar light.
A progressive decrease of the THI concentration was observed in the presence of all the doped photocatalysts under UV-A, visible light, and direct solar light irradiation, evidencing that the doping of TiO2 is able to increase photocatalytic activity. The Fe-N-P tri-doped TiO2 sample exhibits the highest photodegradation degree (64% under UV-A light, 29% under visible light, and 73% under solar light) among all the samples, indicating that Fe, N, and P tri-doping comes possibly into a synergistic effect, resulting in a catalyst with superior performances than other doped one.
Considering that P-N-S/TiO2 and Fe-N-P/TiO2 samples showed a comparable SBET value, and despite the fact that P-N-S/TiO2 photocatalysts have an Ebg lower than that of Fe-N-P/TiO2 (Table 1), the highest photoactivity of such sample is possibly linked to a recombination rate of photogenerated electron-hole lower than the other tested samples (as shown by PL results).
Keeping in mind that, to our knowledge, no articles have been reported in the literature, so far, dealing with the use of the TiO2 tri-doped sample for THI removal under direct sunlight, these results are quite exciting. It is worth underlining that the optimized Fe-N-P/TiO2 catalyst showed a superior photocatalytic activity, especially under UV-A irradiation and sunlight using a pollutant concentration and catalyst dosage very low if compared with data reported in the literature (Table 2). Moreover, Fe-N-P/TiO2 sample evidenced a visible light activity very similar to a catalyst based on a noble metal (e.g., Ag3PO4) [1]. The degradation mechanism of THI is mainly driven by •OH radicals and holes. Indeed, it is reported in literature [36,37] that THI photodegradation mechanism proceeds via three different decomposition pathways because of non-selective attach by •OH radicals. During the photocatalytic reaction, the main by-products are formed by hydroxylation/oxidation reactions of the THI molecules and of the portions of the molecule resulting from the detachment of the (thiazolidin-2-ylidene) cyanamide group and/or the 2-chloro-5-methylpyridine group.

2.3. Kinetics Evaluation of THI Degradation

The apparent kinetic constant for THI degradation was calculated to underline the influence of doping elements on photocatalytic activity. It was assumed that the photocatalytic degradation rate depends on THI concentration in aqueous solution according to the pseudo first order kinetics [40]. Therefore, the following relationship (Equation (1)) is used for the estimation of k values:
ln ( C C 0 ) = k · t ,
where:
C 
= concentration of THI (mg L1) at the generic irradiation time;
C0 
= concentration of THI (mg L1) after the dark period;
T 
= irradiation time (min);
k 
= apparent kinetic constant (min1).
The values of the apparent kinetic constant k are calculated by plotting ln ( C C 0 ) as a function of the irradiation time (t). The obtained values (kUV, kVis, and ksolar for THI degradation) are reported in Table 3 for the TiO2, Fe-N-P/TiO2, Fe-N-S/TiO2, Fe-Pr-N/TiO2, P-N-S/TiO2, and Pr-N-S/TiO2 samples.
As it is possible to note, the Fe-N-P/TiO2 photocatalyst showed the highest apparent kinetic constant values (kUV = 6.0 × 10³ min1, kVis = 2.1 × 10³ min1, kSolar = 7.2 × 10³ min1) among all the analyzed samples.

3. Materials and Methods

3.1. Materials

Titanium tetraisopropoxide (C12H28O4Ti > 97% Sigma Aldrich, Milan, Italy), iron acetylacetonate (99.95% Sigma Aldrich), praseodymium nitrate hexahydrate (99.9% Sigma Aldrich), urea (CH4N2O Sigma Aldrich), phosphoric acid (H3PO4 > 99% Sigma-Aldrich), sodium sulfate (Na2SO4) thiacloprid (C10H9ClN4S > 99% Sigma-Aldrich), and distilled water were employed without additional purification treatment.

3.2. Preparation of Photocatalysts

Fe-N-x and y-N-S/TiO2 (where x is S, Pr, or P, and y is P or Pr) tri-doped photocatalysts were synthetized through sol-gel method. Fe-N-x photocatalysts were prepared starting from 50 mL of distilled water containing 1.2 g of urea [20] and 17 mL of phosphoric acid [42] or 0.025 g of sodium sulfate [43] or 0.0085 g of praseodymium nitrate hexahydrate [44]. Then, the obtained solution was mixed with a solution obtained dissolving 0.025 g of iron(II) acetylacetonate in 12.5 mL of titanium tetraisopropoxide [20,44]. The obtained photocatalysts were called Fe-N-P/TiO2 or Fe-N-S/TiO2 or Fe-N-Pr/TiO2. y-N-S/TiO2 photocatalysts were prepared starting from a 50 mL of distilled water and 1.2 g of urea and 17 mL of phosphoric acid or with 0.025 g of sodium sulfate or 0.0085 g of praseodymium nitrate hexahydrate. The obtained aqueous solution was finally added into 12.5 mL of titanium tetraisopropoxide. The obtained photocatalysts were named P-N-S/TiO2 or P-N-Pr/TiO2. The preparation of all the photocatalysts were carried out at room temperature, maintaining the systems under continuous stirring for 10 min. The obtained suspensions were centrifuged and washed with distilled water three times. Finally, the precipitates were placed in a furnace at 450 °C for 30 min in static air. Table 4 summarizes the solution volume and the amount of metal or non-metal precursors used for the synthesis, together with molar ratio values for all the prepared photocatalysts.

3.3. Photocatalytic Tests

Photocatalytic tests were carried out using a volume of 75 mL of THI aqueous solution (initial concentration: 0.5 mg/L) and 300 mg of catalyst. The batch photoreactor used for the all the tests was a Pyrex cylinder. The suspension was continuously mixed using an external recirculation system assured by a peristaltic pump. The reactor was irradiated by an UV-A (emission: 365 nm; irradiance 13 W/m2) and visible (emission range: 400–800 nm; irradiance: 16 W/m2) LEDs strip wrapped around and in contact with external surface of the reactor body. Moreover, additional tests were carried out under the direct solar light (latitude 40° N, longitude 14° E), the average solar UV-A irradiance for all the tests was about 2.2 W/m2. The total exposure time for each experiment was 180 min. Experiments under the direct solar light were performed on May and typically started at 10:00–11:00 a.m. till 01:00–02:00 p.m. Sunlight irradiance spectra were measured by radiometer BLACK-Comet Stellar Net UV-VIS (StellarNet, Tampa, FL, USA). During each test, the system was left in the dark for 60 min to reach the adsorption equilibrium of THI on the photocatalysts surface and then irradiated for 180 min. At different times, about 1.5 mL of the suspension was withdrawn from the photoreactor and filtered to remove the catalyst particles. The aqueous solution was then analyzed by HPLC UltiMate 3000 Thermo Scientific system (equipped with DAD detector, quaternary pump, column thermostat, and automatic sample injector with 100 µL loop) and using a reversed-phase Luna 5u C18 column (150 mm × 4.6 mm i.d., pore size 5 µm) (Phenomenex) at 25 °C. The mobile phase consisted of an acetonitrile/water mixture (70/30 v/v). The flow rate, injection volume, and detection wavelength were 1 mL/min, 40 µL, and 242 nm, respectively.

3.4. Chemical-Physical Characterization Methods

Laser Raman spectra were obtained at room temperature with a Dispersive MicroRaman (Invia, Renishaw), equipped with 514 nm laser, in the range 100–2000 cm−1 Raman shift. The ultraviolet-visible diffuse reflectance spectra (UV-Vis DRS) of the samples were recorded using a Perkin Elmer spectrometer Lambda 35 spectrophotometer using an RSA-PE-20 reflectance spectroscopy accessory (Labsphere, Inc., North Sutton, NH, USA). The band gap values of the samples were determined through the corresponding Kubelka–Munk function (KM) and by plotting (KM × hν2) against hν. The average crystallite size of the synthetized powders was calculated using Scherrer’s equation [45].
Wide-angle X-ray diffraction (WAXD) patterns were performed with an automatic Bruker D8 Advance diffractometer (VANTEC-1 detector) using reflection geometry and nickel filtered Cu-Kα radiation.
The lattice parameters were calculated using the following equation:
1 d ( h   k   l ) 2 = h 2 + k 2 a 2 + l 2 c 2 ,
where the value of d(h k l) for an XRD peak was determined from Bragg’s law:
2 d ( h   k   l )   ·   sin θ = n   ·   λ .
h, k, and l are the crystal planes, and d(h k l) is the distance between crystal plane of (h k l), while a and c are the lattice parameters (for tetragonal anatase phase of TiO2: a = b ≠ c). To evaluate the lattice parameters, the planes (1 0 1) and (2 0 0) for anatase were considered [46].
The Brunauer Emmett and Teller (BET) surface area of the samples was measured from dynamic N2 adsorption measurement at −196 °C, performed by a Costech Sorptometer 1042 after a pre-treatment for 30 min in He flow at 150 °C.
Fourier-transform infrared spectra (FT-IR) of the samples were obtained using TENSOR 27 BRUKER INSTRUMENT in the frequency range of 400–4000 cm−1 using KBr as reference pilot. Photoluminescence spectra (PL) of the samples were acquired using a VARIAN CARY-ECLIPSE spectrophotometer. The excitation wavelength was 250 nm. Reflected beams were measured in the range 300–500 nm.

4. Conclusions

The effect of different doping elements was assessed towards the photocatalytic degradation of thiacloprid under UV-A, visible, and solar light irradiation. The physical-chemical properties of all the samples were analyzed by different characterization techniques. In particular, XRD results showed the characteristic peaks of TiO2 in anatase phase, while no signals of dopant species oxide can be detected in all the tri-doped TiO2 samples. The increase in a and c axis lattice parameters, found from XRD patterns, and the shifting of the most intense mode in the Raman spectra of tri-doped TiO2 powder indicate the incorporation of doped elements in TiO2 lattice. The increase of absorption in the visible region and the shifting of the absorption edge of tri-doped TiO2 samples evidence a narrowing of the band gap due to dopants elements incorporation in TiO2 lattice, which is useful for visible light photocatalysis in practical applications. In addition, the reduction of PL intensity indicates a lower recombination rate and higher life span of photogenerated carriers for all the doped samples in comparison with the un-doped TiO2. Photocatalytic activity results showed that Fe-N-P tri-doped TiO2 exhibited the highest THI degradation degree (64% under UV-A light, 29% under visible light, and 73% under the direct solar light).

Author Contributions

A.M., W.N. and O.S. performed the experiments and wrote the manuscript. V.V. (Vincenzo Vaiano), V.V. (Vincenzo Venditto) and S.P. provided the concept, experimental design of the study, and reviewed the paper prior to submission. All authors discussed the results, analyzed the data, commented on, and revised the manuscript. All authors have read and agreed to the published version of the manuscript.

Funding

This research received no external funding.

Conflicts of Interest

The authors declare no conflict of interest.

References

  1. Lee, Y.-J.; Kang, J.-K.; Park, S.-J.; Lee, C.-G.; Moon, J.-K.; Alvarez, P.J.J. Photocatalytic degradation of neonicotinoid insecticides using sulfate-doped Ag3PO4 with enhanced visible light activity. Chem. Eng. J. 2020, 402, 126183. [Google Scholar] [CrossRef]
  2. Hladik, M.L.; Kolpin, D.W.; Kuivila, K.M. Widespread occurrence of neonicotinoid insecticides in streams in a high corn and soybean producing region, USA. Environ. Pollut. 2014, 193, 189–196. [Google Scholar] [CrossRef]
  3. Todey, S.A.; Fallon, A.M.; Arnold, W.A. Neonicotinoid insecticide hydrolysis and photolysis: Rates and residual toxicity. Environ. Toxicol. Chem. 2018, 37, 2797–2809. [Google Scholar] [CrossRef]
  4. Goulson, D. REVIEW: An overview of the environmental risks posed by neonicotinoid insecticides. J. Appl. Ecol. 2013, 50, 977–987. [Google Scholar] [CrossRef]
  5. Elbert, A.; Haas, M.; Springer, B.; Thielert, W.; Nauen, R. Applied aspects of neonicotinoid uses in crop protection. Pest Manag. Sci. 2008, 64, 1099–1105. [Google Scholar] [CrossRef] [PubMed]
  6. Jeschke, P.; Moriya, K.; Lantzsch, R.; Seifert, H.; Lindner, W.; Jelich, K.; Göhrt, A.; Beck, M.E.; Etzel, W. Thiacloprid (Bay YRC 2894)-A new member of the Chloronicotinyl Insecticide (CNI) family. Pflanzenschutz-Nachr. Bayer 2001, 54, 147–160. [Google Scholar]
  7. Yin, K.; Deng, Y.; Liu, C.; He, Q.; Wei, Y.; Chen, S.; Liu, T.; Luo, S. Kinetics, pathways and toxicity evaluation of neonicotinoid insecticides degradation via UV/Chlorine process. Chem. Eng. J. 2018, 346, 298–306. [Google Scholar] [CrossRef]
  8. Cernigoj, U.; Stangar, U.L.; Jirkovský, J. Effect of dissolved ozone or ferric ions on photodegradation of thiacloprid in presence of different TiO2 catalysts. J. Hazard. Mater. 2010, 177, 399–406. [Google Scholar] [CrossRef]
  9. Abramović, B.F.; Banić, N.D.; Šojić, D.V. Degradation of thiacloprid in aqueous solution by UV and UV/H2O2 treatments. Chemosphere 2010, 81, 114–119. [Google Scholar] [CrossRef]
  10. Guo, Q.; Zhou, C.; Ma, Z.; Yang, X. Fundamentals of TiO2 photocatalysis: Concepts, mechanisms, and challenges. Adv. Mater. 2019, 31, 1901997. [Google Scholar] [CrossRef] [PubMed]
  11. Pant, B.; Park, M.; Park, S.-J. Recent advances in TiO2 films prepared by Sol-Gel methods for photocatalytic degradation of organic pollutants and antibacterial activities. Coatings 2019, 9, 613. [Google Scholar] [CrossRef] [Green Version]
  12. Pant, B.; Ojha, G.P.; Kuk, Y.-S.; Kwon, O.H.; Park, Y.W.; Park, M. Synthesis and characterization of ZnO-TiO2/carbon fiber composite with enhanced photocatalytic properties. Nanomaterials 2020, 10, 1960. [Google Scholar] [CrossRef] [PubMed]
  13. Anas, M.; Han, D.; Mahmoud, K.; Park, H.; Abdel-Wahab, A. Photocatalytic degradation of organic dye using titanium dioxide modified with metal and non-metal deposition. Mater. Sci. Semicond. Process. 2015, 41, 209–218. [Google Scholar] [CrossRef]
  14. Yu, J.C.; Ho, W.; Yu, J.; Yip, H.; Wong, P.K.; Zhao, J. Efficient visible-light-induced photocatalytic disinfection on sulfur-doped nanocrystalline titania. Environ. Sci. Technol. 2005, 39, 1175–1179. [Google Scholar] [CrossRef]
  15. Kuo, C.-Y.; Wu, C.-H.; Wu, J.-T.; Chen, Y.-R. Synthesis and characterization of a phosphorus-doped TiO2 immobilized bed for the photodegradation of bisphenol a under UV and sunlight irradiation. React. Kinet. Mech. Catal. 2015, 114, 753–766. [Google Scholar] [CrossRef]
  16. Jiang, H.; Wang, Q.; Li, S.; Li, J.; Wang, Q. Pr, N, and P tri-doped anatase TiO2 nanosheets with enhanced photocatalytic activity under sunlight. Chin. J. Catal. 2014, 35, 1068–1077. [Google Scholar] [CrossRef]
  17. Zhang, D.; Chen, J.; Xiang, Q.; Li, Y.; Liu, M.; Liao, Y. Transition-Metal-Ion (Fe, Co, Cr, Mn, Etc.) doping of TiO2 nanotubes: A general approach. Inorg. Chem. 2019, 58, 12511–12515. [Google Scholar] [CrossRef]
  18. Shen, X.-Z.; Guo, J.; Liu, Z.-C.; Xie, S.-M. Visible-light-driven Titania photocatalyst Co-Doped with nitrogen and Ferrum. Appl. Surf. Sci. 2008, 254, 4726–4731. [Google Scholar] [CrossRef]
  19. Xu, X.; Zhou, X.; Zhang, L.; Xu, L.; Ma, L.; Luo, J.; Li, M.; Zeng, L. Photoredox degradation of different water pollutants (MO, RhB, MB, and Cr(VI)) using Fe–N–S-Tri-Doped TiO2 nanophotocatalyst prepared by novel chemical method. Mater. Res. Bull. 2015, 70, 106–113. [Google Scholar] [CrossRef]
  20. Mancuso, A.; Sacco, O.; Sannino, D.; Pragliola, S.; Vaiano, V. Enhanced visible-light-driven photodegradation of acid orange 7 azo dye in aqueous solution using Fe-N Co-Doped TiO2. Arab. J. Chem. 2020, 13, 8347–8360. [Google Scholar] [CrossRef]
  21. Khaledi Maki, L.; Maleki, A.; Rezaee, R.; Daraei, H.; Yetilmezsoy, K. LED-activated immobilized Fe-Ce-N Tri-Doped TiO2 nanocatalyst on glass bed for photocatalytic degradation organic dye from aqueous solutions. Environ. Technol. Innov. 2019, 15, 100411. [Google Scholar] [CrossRef]
  22. Sánchez-Bayo, F.; Hyne, R.V. Detection and analysis of neonicotinoids in river waters–development of a passive sampler for three commonly used insecticides. Chemosphere 2014, 99, 143–151. [Google Scholar] [CrossRef]
  23. Schmuck, R. Ecotoxicological profile of the insecticide thiacloprid. Pflanzenschutz Nachr.-Bayer-Engl. Ed. 2001, 54, 161–184. [Google Scholar]
  24. Khlyustova, A.; Sirotkin, N.; Kusova, T.; Kraev, A.; Titov, V.; Agafonov, A. Doped TiO2: Effect of doping element on the photocatalytic activity. Mater. Adv. 2020, 1. [Google Scholar] [CrossRef]
  25. Cheng, X.; Yu, X.; Xing, Z. One-step synthesis of Fe–N–S-Tri-Doped TiO2 catalyst and its enhanced visible light photocatalytic activity. Mater. Res. Bull. 2012, 47, 3804–3809. [Google Scholar] [CrossRef]
  26. Xing, M.; Wu, Y.; Zhang, J.; Chen, F. Effect of synergy on the visible light activity of B, N and Fe Co-Doped TiO2 for the degradation of MO. Nanoscale 2010, 2, 1233–1239. [Google Scholar] [CrossRef]
  27. de la Osa, R.A.; Iparragirre, I.; Ortiz, D.; Saiz, J.M. The extended Kubelka–Munk theory and its application to spectroscopy. ChemTexts 2019, 6, 2. [Google Scholar] [CrossRef]
  28. Ricci, P.C.; Carbonaro, C.M.; Stagi, L.; Salis, M.; Casu, A.; Enzo, S.; Delogu, F. Anatase-to-rutile phase transition in TiO2 nanoparticles irradiated by visible light. J. Phys. Chem. C 2013, 117, 7850–7857. [Google Scholar] [CrossRef]
  29. Giannakas, A.E.; Antonopoulou, M.; Daikopoulos, C.; Deligiannakis, Y.; Konstantinou, I. Characterization and catalytic performance of B-Doped, B–N Co-Doped and B–N–F Tri-Doped TiO2 towards simultaneous Cr(VI) reduction and benzoic acid oxidation. Appl. Catal. B Environ. 2016, 184, 44–54. [Google Scholar] [CrossRef]
  30. Adyani, S.M.; Ghorbani, M. A comparative study of physicochemical and photocatalytic Properties of visible light responsive Fe, Gd and P Single and Tri-Doped TiO2 nanomaterials. J. Rare Earths 2018, 36, 72–85. [Google Scholar] [CrossRef]
  31. Akshay, V.R.; Arun, B.; Mandal, G.; Mutta, G.R.; Chanda, A.; Vasundhara, M. Observation of optical Band-Gap narrowing and enhanced magnetic moment in Co-Doped Sol–Gel-Derived anatase TiO2 nanocrystals. J. Phys. Chem. C 2018, 122, 26592–26604. [Google Scholar] [CrossRef]
  32. Ramandi, S.; Entezari, M.; Ghows, N. Sono-synthesis of solar light responsive S–N–C–Tri doped TiO2 Photo-Catalyst under optimized conditions for degradation and mineralization of diclofenac. Ultrason. Sonochem. 2017, 38, 234–245. [Google Scholar] [CrossRef]
  33. Wang, J.A.; Limas-Ballesteros, R.; López, T.; Moreno, A.; Gómez, R.; Novaro, O.; Bokhimi, X. Quantitative determination of titanium lattice defects and solid-state reaction mechanism in iron-doped TiO2 photocatalysts. J. Phys. Chem. B 2001, 105, 9692–9698. [Google Scholar] [CrossRef]
  34. Gaur, L.K.; Kumar, P.; Kushavah, D.; Khiangte, K.R.; Mathpal, M.C.; Agrahari, V.; Gairola, S.P.; Soler, M.A.G.; Swart, H.C.; Agarwal, A. Laser induced phase transformation influenced by co doping in TiO2 nanoparticles. J. Alloys Compd. 2019, 780, 25–34. [Google Scholar] [CrossRef]
  35. Jiang, X.; Zhang, Y.; Jiang, J.; Rong, Y.; Wang, Y.; Wu, Y.; Pan, C. Characterization of oxygen vacancy associates within hydrogenated TiO2: A positron annihilation study. J. Phys. Chem. C 2012, 116, 22619–22624. [Google Scholar] [CrossRef]
  36. Decomposition and Detoxification of the Insecticide Thiacloprid by TiO2-Mediated Photocatalysis: Kinetics, Intermediate Products and Transformation Pathways-Berberidou-2019-Journal of Chemical Technology & Biotechnology-Wiley Online Library. Available online: https://onlinelibrary.wiley.com/doi/full/10.1002/jctb.6034?casa_token=mlM5yFvrjRkAAAAA%3AqjvoJlIhUQ_zQmYIRRpXJG94RegEqrQWiH9QZaKrcgQ3wAgZVLhyxtgjZKsfd_vzqTH8s8Tw6XgHLg (accessed on 2 February 2021).
  37. Zhong, Z.; Li, M.; Fu, J.; Wang, Y.; Muhammad, Y.; Li, S.; Wang, J.; Zhao, Z.; Zhao, Z. Construction of cu-bridged Cu2O/MIL(Fe/Cu) catalyst with enhanced interfacial contact for the synergistic photo-Fenton degradation of thiacloprid. Chem. Eng. J. 2020, 395, 125184. [Google Scholar] [CrossRef]
  38. Banić, N.; Abramović, B.; Krstić, J.; Šojić, D.; Lončarević, D.; Cherkezova-Zheleva, Z.; Guzsvány, V. Photodegradation of thiacloprid using Fe/TiO2 as a heterogeneous photo-Fenton catalyst. Appl. Catal. B Environ. 2011, 107, 363–371. [Google Scholar] [CrossRef]
  39. Banić, N.D.; Abramović, B.F.; Šojić, D.V.; Krstić, J.B.; Finčur, N.L.; Bočković, I.P. Efficiency of neonicotinoids photocatalytic degradation by using annular slurry reactor. Chem. Eng. J. 2016, 286, 184–190. [Google Scholar] [CrossRef]
  40. Rózsa, G.; Kozmér, Z.; Alapi, T.; Schrantz, K.; Takács, E.; Wojnárovits, L. Transformation of Z-thiacloprid by three advanced oxidation processes: Kinetics, intermediates and the role of reactive species. Catal. Today 2017, 284, 187–194. [Google Scholar] [CrossRef] [Green Version]
  41. Abramović, B.F.; Banić, N.D.; Krstić, J.B. Degradation of thiacloprid by ZnO in a laminar falling film slurry photocatalytic reactor. Ind. Eng. Chem. Res. 2013, 52, 5040–5047. [Google Scholar] [CrossRef]
  42. Mendiola-Alvarez, S.; Hernandez-Ramírez, A.; Guzmán Mar, J.; Garza-Tovar, L.L.; Reyes, L. Phosphorous-doped TiO2 nanoparticles: Synthesis, characterization, and visible photocatalytic evaluation on sulfamethazine degradation. Environ. Sci. Pollut. Res. 2019, 26. [Google Scholar] [CrossRef] [PubMed]
  43. Mayoufi, A.; Nsib, M.F.; Ahmed, O.; Houas, A. Synthesis, characterization and photocatalytic performance of W, N, S-Tri-Doped TiO2 under visible light irradiation. Comptes Rendus Chim. 2015, 18, 875–882. [Google Scholar] [CrossRef]
  44. Mancuso, A.; Sacco, O.; Vaiano, V.; Sannino, D.; Pragliola, S.; Venditto, V.; Morante, N. Visible light active Fe-Pr Co-doped TiO2 for water pollutants degradation. Catal. Today 2021. [Google Scholar] [CrossRef]
  45. Freeda, M.; Suresh, G. Structural and luminescent properties of Eu-doped CaAl2O4 nanophosphor by Sol-Gel method. Mater. Today Proc. 2017, 4, 4260–4265. [Google Scholar] [CrossRef]
  46. Ganesh, I.; Gupta, A.K.; Kumar, P.P.; Sekhar, P.S.C.; Radha, K.; Padmanabham, G.; Sundararajan, G. Preparation and characterization of Ni-Doped TiO2 materials for photocurrent and photocatalytic applications. Sci. World J. 2012, 2012, 127326. [Google Scholar] [CrossRef] [PubMed] [Green Version]
Figure 1. (a) UV-vis DRS spectra and (b) band-gap evaluation of all prepared samples.
Catalysts 11 00927 g001
Figure 2. XRD patterns of all prepared samples.
Catalysts 11 00927 g002
Figure 3. Raman spectra of all the prepared samples.
Catalysts 11 00927 g003
Figure 4. Fourier-transform infrared (FTIR) spectra of all prepared samples.
Catalysts 11 00927 g004
Figure 5. PL spectra of all the prepared samples.
Catalysts 11 00927 g005
Figure 6. Photocatalytic degradation of THI under (a) UV-A, (b) visible, and (c) direct solar light irradiation.
Catalysts 11 00927 g006
Table 1. Crystallite size, lattice parameters, specific surface area, and band gap data of all prepared photocatalysts.
SampleCrystallite Size (nm)Lattice Parameter
a = b
(Ǻ)
c
SBET
(m2 g−1)
Ebg
(eV)
TiO2103.748.681073.2
Fe-N-P/TiO283.8010.001052.8
Fe-N-S/TiO293.799.40812.65
Fe-N-Pr/TiO2103.819.92912.73
P-N-S/TiO283.8010.091092.55
Pr-N-S/TiO293.819.86852.5
Table 2. Comparison with the available literature dealing with the photocatalytic degradation of THI.
CatalystCatalyst
Dosage
THI
Concentration
Light SourcePhotocatalytic Degradation Efficiency (%)Reference
Fe-TiO21.67 g L−1~80 mg L−1UV light~45%[38]
ZnO2.0 g L−1~100 mg L−1UV-A light~100%[39]
ZnO2.0 g L−1~100 mg L−1visible light~59%[39]
TiO21.0 g L1~25 mg L−1UV-A light~100%[40]
ZnO2.0 g L−1~100 mg L−1UV light~86%[41]
Ag3PO40.8 g L−1~5 mg L−1visible light~30%[1]
Fe-N-P-TiO20.5 g L−1~0.5 mg L−1UV-A light~64%[this paper]
Fe-N-P-TiO20.5 g L−1~0.5 mg L−1visible light~29%[this paper]
Fe-N-P-TiO20.5 g L−1~0.5 mg L−1solar light~73%[this paper]
Table 3. Apparent kinetic constant for TiO2, Fe-N-P/TiO2, Fe-N-S/TiO2, Fe-N-Pr/TiO2, P-N-S/TiO2, and Pr-N-S/TiO2 samples.
SamplekUV (min−1)kVis (min−1)ksolar (min−1)
TiO21.7 × 10−37.58 × 10−61.8 × 10−3
Fe-N-P/TiO26.0 × 10−32.1 × 10−37.2 × 10−3
Fe-N-S/TiO22.2 × 10−37.88 × 10−43.9 × 10−3
Fe-N-Pr/TiO24.9 × 10−31.5 × 10−35.5 × 10−3
P-N-S/TiO22.5 × 10−31.0 × 10−34.8 × 10−3
Pr-N-S/TiO22.8 × 10−32.02 × 10−42.9 × 10−3
Table 4. List of all prepared photocatalysts, amount of titanium tetraisopropoxide(T), urea (Ur), iron acetylacetonate (F), phosphoric acid (Pac), sodium sulfate (Ss), and praseodymium nitrate hexahydrate (PrN) used for the synthesis and N/Ti, Fe/Ti, P/Ti, S/Ti, and Pr/Ti molar ratio values.
SampleT (mL)Ur (g)F (mg)Pac (μL)Ss (mg)PrN (μL)N/TiFe/TiP/TiS/TiPr/Ti
TiO212.50000000000
Fe-N-P/TiO212.51.22517000.970.00170.0100
Fe-N-S/TiO212.51.22502500.970.001700.0050
Fe-N-Pr/TiO212.51.20008.50.970.0017000.0069
P-N-S/TiO212.51.20172500.9700.010.0050
Pr-N-S/TiO212.51.201708.50.9700.0100.0069
Publisher’s Note: MDPI stays neutral with regard to jurisdictional claims in published maps and institutional affiliations.

