
Enhanced Performance of the OMS-2-Supported CuOx Catalysts for Carbon Monoxide, Ethyl Acetate, and Toluene Oxidation


1
Key Laboratory of Beijing on Regional Air Pollution Control, Department of Environmental Science, School of Environmental and Chemical Engineering, Faculty of Environment and Life Science, Beijing University of Technology, Beijing 100124, China
2
Beijing Key Laboratory for Green Catalysis and Separation, Key Laboratory of Beijing on Regional Air Pollution Control, and Laboratory of Catalysis Chemistry and Nanoscience, Department of Environmental Chemical Engineering, School of Environmental and Chemical Engineering, Faculty of Environment and Life Science, Beijing University of Technology, Beijing 100124, China
*
Authors to whom correspondence should be addressed.
Catalysts 2021, 11(6), 713; https://doi.org/10.3390/catal11060713
Submission received: 12 April 2021
/
Revised: 4 June 2021
/
Accepted: 4 June 2021
/
Published: 7 June 2021
(This article belongs to the Special Issue Catalytic Oxidation of Hydrocarbons)
Abstract
:Different Cu contents (x wt%) were supported on the cryptomelane-type manganese oxide octahedral molecular sieve (OMS-2) (xCu/OMS-2; x = 1, 5, 15, and 20) via a pre-incorporation method. Physicochemical properties of the OMS-2 and xCu/OMS-2 samples were characterized by means of the XRD, FT-IR, SEM, TG/DTG, ICP-OES, XPS, O2-TPD, H2-TPR, and in situ DRIFTS techniques, and their catalytic activities were measured for the oxidation of CO, ethyl acetate, and toluene. The results show that the Cu species were homogeneously dispersed in the tunnel and framework structure of OMS-2. Among all of the samples, 15Cu/OMS-2 sample exhibited the best activities with the T50% of 65, 165, and 240 °C as well as the T90% of 85, 215, and 290 °C for CO, ethyl acetate and toluene oxidation, respectively, which was due to the existence of the Cu species and Mn3+/Mn4+ redox couples, rich oxygen vacancies, good oxygen mobility, low-temperature reducibility, and strong interaction between the Cu species and the OMS-2 support. The reaction mechanisms were also deduced by analyzing the in situ DRIFTS spectra of the 15Cu/OMS-2 sample. The excellent oxygen mobility associated with the electron transfer between Cu species and Mn3+/Mn4+ redox couples might be conducive to the continuous replenishment of active oxygen species and the constantly generated reactant intermediates, thereby increasing the reactant reaction rate.
1. Introduction
Carbon monoxide (CO), ethyl acetate (CH3COOC2H5), and toluene (C6H5CH3) come from a variety of sources (e.g., stationary industries, daily life, and vehicle exhaust emissions) [1], and they give rise to severe pollution on atmospheric environment and are seriously harmful to human health. Therefore, it is a critical requirement to effectively remove these pollutants. Two fundamental elimination strategies are (i) recovery (e.g., absorption, adsorption, condensation, and membrane separation) and (ii) degradation (e.g., catalytic combustion, thermal incineration, biological method, and photochemical catalysis), in which catalytic oxidation has several merits, such as low reaction temperatures, low energy consumption, predominant activity, favorable selectivity, and persistent stability [2].
To date, many noble metals (Pt, Pd, Au, Ag, and Ru) supported on various supports have been extensively investigated [3,4]. The noble metal catalysts exhibit preferable activities towards removal of air pollutants; however, their resource scarcity, expensive cost, high-temperature agglomeration, and poisoning tendency limit their wide applications [5,6]. According to the literature, transition metal oxides have good redox properties due to their unsaturated d orbitals [7]. OMS-2 is a one-dimensional microporous material with the 2 × 2 octahedral [MnO6] chains linked by oxygen atoms at the vertex of octahedron (constituting a unidimensional tunnel of 0.46 nm × 0.46 nm) [8]. Mn possesses various valence states (2+, 3+, 4+, and 7+), thus representing good redox property, whereas OMS-2 exhibits outstanding ion exchange performance. With the unique features of mixed valence and quantities of unlimited interlayers and pore structures, OMS-2 can be modified so that its catalytic activity can be remarkably enhanced by doping a foreign metal [9,10]. The copper content in the earth’s crust is about 0.01% (ranking the 26th), hence copper is abundant and low cost [11]. Taking the rich resource and relatively low cost as well as good catalytic activity into account, we envision that Cu/OMS-2 catalyst would possess a distinctive superiority in the catalytic removal of CO and volatile organic compounds (VOCs).
Nevertheless, there are insufficient research reports on the preparation of the Cu/OMS-2 catalysts and their applications in the oxidation of CO and VOCs. Furthermore, it is rare to conduct the oxidation of CO and VOCs over the catalysts under harsh reaction conditions of (e.g., high pollutant concentrations and high space velocity). In addition, there have been few studies on the catalytic mechanism of ethyl acetate oxidation. Herein, we report a pre-incorporation method to load Cu species on OMS-2. A series of techniques, such as X-ray diffraction (XRD), Fourier transform infrared (FT-IR), scanning electron microscopy (SEM), Thermogravity/differential thermogravity (TG/DTG), inductively coupled plasma-optical emission spectrometer (ICP-OES), X-ray photoelectron spectroscopy (XPS), O2 temperature-programmed desorption (O2-TPD), and H2 temperature-programmed reduction (H2-TPR), were employed to characterize the physicochemical properties of OMS-2 and xCu/OMS-2 samples, and their catalytic activities for the oxidation of CO, ethyl acetate, and toluene were measured under the harsh conditions. In situ diffuse reflectance infrared Fourier transform spectroscopy (in situ DRIFTS) experiments were carried out to study the oxidation behaviors of CO, ethyl acetate, and toluene over the 15Cu/OMS-2 sample. This work can provide new insights into the fundamental understanding of the microscopic catalytic mechanisms of CO, ethyl acetate, and toluene oxidation.
2. Results and Discussion
2.1. Physicochemical Properties of OMS-2 and xCu/OMS-2
2.1.1. Crystal Phase Composition
Figure 1 depicts the XRD patterns of the OMS-2 and xCu/OMS-2 samples. Good-resolution diffraction peaks were observed at 2θ = 12.9°, 18.2°, 28.9°, 37.7°, 42.0°, 49.9°, and 60.5°, corresponding to the (110), (200), (310), (211), (301), (411), and (521) crystal planes of the tetragonal cryptomelane (KMn8O16, JCPDS PDF# 34–168), respectively. With the rise in Cu loading, the diffraction peaks of the supported CuOx samples decreased noticeably in intensity and shifted slightly towards higher diffraction angle (as compared with those of OMS-2), which was due to shrinkage of the framework accompanied by diminution in the lattice parameter. This might be caused by the replacement of the bigger K+ (138 pm in radium) by the smaller Cu species (54–77 pm in radium) in the tunnels of OMS-2 during the preparation process, in which Cu was connected to Mn through O to form a Cu–O–Mn bond. Similar lattice variations have been reported by Li et al. [12] and Nur et al. [13]. These inside Cu ions could favor the formation of a tight structure of manganese oxide octahedral molecular sieve due to the strong interaction between Cu species and MnOx. Similar effects were also observed in the Ag/OMS-2 and Pd/OMS-2 catalysts [14,15]. Furthermore, no diffraction peaks assignable to the Cu or CuOx phases were detected in the xCu/OMS-2 samples, indicating the good dispersion of the Cu species in OMS-2.
2.1.2. Structure
The FT-IR spectra of the OMS-2 and xCu/OMS-2 samples are illustrated in Figure 2. There were vibration absorption bands at 400–800 cm−1 of the typical OMS-2 material. The bands at 709, 581, 520, and 457 cm−1 were the feature of a cryptomelane-type structure, which were related to the vibration signals of the [MnO6] octahedron along with the stretching vibration of the Mn–O bonds [16]. Loading the Cu species led to the peaks at 520 and 457 cm−1 in weaker intensity, as compared with those of OMS-2, which were ascribed to the lattice vibration probably resulting from partial insertion of the Cu ions into the OMS-2 tunnel. It was also observed that the absorption band at 710 cm−1 of the xCu/OMS-2 samples became stronger in intensity and was slightly shifted to a higher wavenumber than that of OMS-2. This might be caused by the formation of a Cu–O–Mn bond connected through the bridging oxygen atoms due to the interaction between Cu and Mn after K+ ions were substituted by the Cu ions, which was in good agreement with the above XRD results. The band at 1623 cm−1 was ascribed to the vibration of water in the tunnel of these samples, indicating the possible existence of hydroxyl groups. The formed hydroxyl groups could be the adsorption sites for some VOCs and would play an important role in promoting VOCs oxidation [17]. As compared with the OMS-2, the vibration absorption band at 1623 cm−1 of the xCu/OMS-2 samples became stronger, indicating an increase in adsorbed water amount of these samples.
2.1.3. Morphology
The SEM images of the OMS-2 and xCu/OMS-2 samples are shown in Figure 3. These samples displayed a uniform morphology with well-defined fibrous fringes and a typical cryptomelane structure. There were no obvious morphological differences between the OMS-2 and xCu/OMS-2 samples, suggesting that the loading of Cu had no destructive effect on the original structure of the OMS-2.
2.1.4. Thermal Stability
The TG/DTG analysis was carried out to explore the thermal stability of these samples, and their profiles are shown in Figure 4. There were four weight losses in the temperature range of 50–850 °C, and their detailed weight losses are summarized in Table 1. The first weight loss in the range of 50–250 °C was ascribable to the removal of the physisorbed and interlayer water [18]. The water content in the 20Cu/OMS-2 sample was 4.54 wt%, while that in the OMS-2 was 1.54 wt%, which fit well with the peak intensity of the adsorbed water at 1623 cm−1 in the FT-IR analysis (Figure 2). That is to say, the OMS-2 prepared by the buffer solution method was hydrophobic and could selectively adsorb VOCs in presence of water vapor. The second weight change at 250–550 °C was possibly due to the chemisorbed oxygen species and surface active lattice oxygen species [19]. The third weight loss from 550 to 700 °C could be attributed to the thermal decomposition of MnO2 to the compound with a lower valence state of Mn and the release of partial lattice oxygen species. As the temperature was higher than 700 °C, the sample started to lose bulk lattice oxygen from the framework structure, and the cryptomelane was decomposed to Mn2O3 or Mn3O4. Obviously, all of these samples contained a large number of lattice oxygen species that would become mobile upon thermal treatment.
In the second stage (250–550 °C) of weight loss relating to the chemisorbed oxygen species and surface active lattice oxygen species, the order of weight loss was 15Cu/OMS-2 (2.21 wt%) > OMS-2 (1.29 wt%) > 5Cu/OMS-2 (0.91 wt%) > 1Cu/OMS-2 (0.86 wt%) > 20Cu/OMS-2 (0.79 wt%), and the 15Cu/OMS-2 sample exhibited the highest weight loss, which meant the most exchangeable oxygen species. The temperatures for releasing skeleton lattice oxygen of the OMS-2 and xCu/OMS-2 samples were 610 and 560–580 °C, respectively. Clearly, the lattice oxygen release and phase transformation were strongly facilitated after doping of the Cu species. The low thermal stability might be owing to the lattice defects caused by the replaced K+ ions for preserving the charge balance and structural stability of OMS-2, in which the quantity and kinds of tunnel cations and ion radium mismatch could give rise to the lattice defects. Hence, it appears that if the Cu species were introduced into the tunnels of OMS-2 and replaced partial K+ ions, the bonds of the Mn–O octahedron would be twisted to decrease the volume of the lattice and create a smaller tetragonal structure, which was in line with the results of XRD and FT-IR investigations. Consequently, the oxygen anions became more activity.
The results suggest that the 15Cu/OMS-2 sample contained more amounts of surface and lattice oxygen species, i.e., exchangeable active oxygen species. The amount of the exchangeable active oxygen species in the range of 250–550 °C might influence the evolution rate of oxygen from manganese oxides and hence the catalytic oxidation activity of the samples.
2.1.5. Component Analysis
The ICP-OES characterization was conducted to determine the actual CuO contents in the OMS-2 and xCu/OMS-2 samples. As shown in Table 2, the CuO contents in 1Cu/OMS-2, 5Cu/OMS-2, 15Cu/OMS-2, and 20Cu/OMS-2 were 0.23, 1.05, 3.37, and 4.58 wt%, respectively. Apparently, the actual CuO contents in all of the samples were lower than their nominal contents, suggesting that some Cu species were lost during the preparation process.
Shown in Figure 5 are the Mn 2p, O 1s, and Cu 2p XPS spectra of the OMS-2 and xCu/OMS-2 samples. There were two peaks at the positions of binding energy (BE) = 642.0 and 654.0 eV (Figure 5A), which were attributed to the Mn 2p3/2 and Mn 2p1/2 signals, respectively. The peak at BE = 642.0 eV could be decomposed into two components at BE = 641.4–641.7 eV (Mn3+) and 643.1–643.9 eV (Mn4+), whereas the peak at BE = 654.0 eV could also be decomposed into two components at BE = 653.1–653.4 eV (Mn3+) and 655.3–655.9 eV (Mn4+). From the atomic ratio summarized in Table 2, the order in Mn3+/Mn4+ ratio was 15Cu/OMS-2 (3.05) > 20Cu/OMS-2 (2.79) > 5Cu/OMS-2 (2.05) > 1Cu/OMS-2 (1.97) > OMS-2 (1.63). Among them, the 15Cu/OMS-2 sample possessed the highest Mn3+/Mn4+ ratio. The sorting results showed that the loading of Cu species would change the Mn3+/Mn4+ distribution in the sample, and a rise in amount of the Mn3+ means an increase in amount of oxygen vacancies in the sample.
Figure 5B shows the O 1s XPS spectra of these samples. The peaks at BE = 528.8–529.2 and 530.2–530.5 eV were attributed to the surface lattice oxygen (Olatt) and adsorbed oxygen (Oads) species, respectively. The amount of Oads was determined by the amount of oxygen vacancies on the sample surface. As shown in Table 2, the Oads/Olatt ratio on the samples was ranked as 15Cu/OMS-2 (0.530) > 20Cu/OMS-2 (0.526) > 5Cu/OMS-2 (0.456) > 1Cu/OMS-2 (0.447) > OMS-2 (0.379). Among them, the Oads/Olatt ratio of the 15Cu/OMS-2 sample was the highest, indicating that there was a higher amount of the surface oxygen vacancies on this sample, which was consistent with the result of Mn 2p XPS analysis.
As shown in the Cu 2p XPS spectra (Figure 5C), the minor peak at BE = 932.7–933.0 eV was assigned to the CuO species, whereas the main peak at BE = 934.3–934.6 eV was due to the isolated Cu2+ species, indicating that the Cu species on the samples existed mainly in the form of Cu2+, and only a small amount of Cu species on the samples existed in the form of CuO.
2.1.6. Oxygen Desorption Behavior
The O2-TPD experiments of the samples were carried out to identify the different oxygen species, in which a cold trap was installed to avoid the effect of H2O before the released gas entered the TCD. Figure 6 illustrates the O2-TPD profiles of the OMS-2 and xCu/OMS-2 samples. Each profile could be divided into three regions: low-temperature (LT, <400 °C), medium-temperature (MT, 400–700 °C), and high-temperature (HT, >700 °C). The LT peak was ascribed to desorption of a small amount of the surface-active oxygen species (i.e., chemically adsorbed oxygen and partial surface lattice oxygen); the MT peak originated from the evolution of the surface lattice oxygen and subsurface lattice oxygen in cryptomelane (converted to Mn2O3), and the HT peak was derived from the evolution of the bulk lattice oxygen in cryptomelane (converted to Mn3O4) [20]. Two independent peaks at MT and HT represented two types of the released oxygen species owing to the weaker chemical bond between Mn3+ and O atoms than that between Mn4+ and O atoms in the framework [21]. Hence, the majority of the oxygen species in each sample could be attributed to the lattice oxygen species.
With the rise in Cu loading, the area of the LT peak increased gradually, indicating that the content of the labile oxygen species on the sample surface increased. It can be explained as that Cu loading caused a more amount of the surface defects, thus providing a more amount of the dissociative adsorption sites for oxygen molecules. Meanwhile, after Cu doping, the area of the MT peak increased, but that of the HT peak decreased, suggesting that a more amount of the lattice oxygen desorption occurred at a lower temperature. The reason was that the OMS-2 doped with Cu contained a more amount of Mn3+ ions, which was confirmed by the formation of weaker Mn3+–O than Mn4+–O, as mentioned above. The enhancement in Mn3+ amount of the sample after Cu doping brought about an increase in amount of the desorbed lattice oxygen species, which led to the larger area of the MT peak. Among all of the samples, the 15Cu/OMS-2 sample showed the largest area, indicative of the highest amounts of the lattice oxygen and Mn3+ species.
It is well known that the lower temperature of oxygen desorption peak means a looser bonding of oxygen with Mn, i.e., a higher mobility of oxygen [22]. The temperature at which lattice oxygen began to desorb of the MT peak increased in the order of 15Cu/OMS-2 (400 °C) < 20Cu/OMS-2 (420 °C) < 1Cu/OMS-2 (470 °C) < 5Cu/OMS-2 (480 °C) < OMS-2 (485 °C). Evidently, the 15Cu/OMS-2 sample exhibited the lowest desorption temperature (400 °C) among all of the samples, at which lattice oxygen began to dissociate. This result demonstrates that after Cu doping, the efficiency of lattice oxygen evolved from the surface and subsurface was enhanced, thus making the 15Cu/OMS-2 sample show the best catalytic performance for the addressed reactions. The highest oxygen mobility might be associated with the formation of oxygen vacancies after Cu doping, i.e., the existence of the Cu species and Mn3+/Mn4+ redox couple promoted the generation of oxygen vacancies [23].
In summary, the produced surface defects, abundant lattice oxygen, rich Mn3+ ions, and enough oxygen vacancies resulted in a higher oxygen desorption rate and the highest oxygen mobility of the 15Cu/OMS-2 sample, and this sample hence shows good catalytic performance for the oxidation of CO, ethyl acetate, and toluene.
2.1.7. Reducibility
The reducibility of the OMS-2 and xCu/OMS-2 samples was evaluated by the H2-TPR technique, and their profiles are illustrated in Figure 7. Each sample displayed three partially overlapped reduction peaks (marked as α, β, and γ), corresponding to a three-step reduction process. For OMS-2, peak α at 320 °C was attributed to the consumption of readily reducible superficial species, which were principally related to the surface labile oxygen species and surface manganese oxide clusters (2MnO2 + H2 → Mn2O3 + H2O) [24]. Peak β at 370 °C was generally associated with the reduction of Mn2O3 to Mn3O4 (3Mn2O3 + H2 → 2Mn3O4 + H2O). Peak γ at the high temperature was assigned to the reduction of Mn3O4 to MnO (Mn3O4 + H2 → 3MnO + H2O) [25]. After Cu doping, all of peaks α, β, and γ moved remarkably towards lower temperatures (as compared with those of the OMS-2 support), signifying a strong metal–support interaction between the Cu species and the OMS-2. Peak α at the low temperature was due to the reduction of Cu2+ to Cu0 as well as MnO2 to Mn2O3 [26]. Meanwhile, the lower reduction temperature of the sample indicates its better reducibility [27]. As for the low-temperature reducibility, the reduction temperature increased in the following order: 15Cu/OMS-2 (190 °C) < 20Cu/OMS-2 (200 °C) < 5Cu/OMS-2 (205 °C) < 1Cu/OMS-2 (220 °C) < OMS-2 (320 °C), which demonstrates that the existence of Cu was beneficial for the promotion effect on the reducibility of OMS-2 through hydrogen spillover. Specifically, the formation of the Cu–O–Mn bond was propitious to the hydrogen spillover from Cu atom to manganese oxide. A better reducibility means a higher oxygen mobility [16]. Therefore, the 15Cu/OMS-2 sample possessed a significantly improved oxygen mobility as compared with the other samples, which was in good agreement with the O2-TPD results.
The peak positions and hydrogen consumption of the samples obtained from the H2-TPR profiles are listed in Table 2. As shown in Table 3, the H2 consumption ratios of peak (α + β) to peak γ for the xCu/OMS-2 samples were equal to 1.46–2.01, while that for the OMS-2 was 2.01. The difference in peak ratio arose from the reduction of the Cu species as well as the successive reduction of MnO2 → Mn2O3 → Mn3O4 → MnO. The peak ratio for the 15Cu/OMS-2 sample was the largest (2.01), indicating that the synergistic effect of Cu and Mn might be the most significant. Total hydrogen consumption (7.25–7.73 mmol/gcat) of the xCu/OMS-2 samples decreased in comparison with that (9.45 mmol/gcat) of the OMS-2, which was probably owing to the fact that the well dispersed Cu species on the OMS-2 surface caused the partial surface to be covered and hindered the reduction of Mn species. The supported Cu species weakened the reduction of the manganese species, further confirming the strong synergistic effect between Cu and OMS-2. Compared with the other samples, the 15Cu/OMS-2 sample displayed the lowest reduction temperature, suggesting the superior low-temperature reducibility and oxygen mobility, which would promote the redox cycles and hence improve the catalytic activity for eliminating CO and VOCs.
2.2. Catalytic Performance
Catalytic activities for the oxidation of CO, ethyl acetate, and toluene over the OMS-2 and xCu/OMS-2 samples are shown in Figure 8. The catalytic activity can be evaluated using the reaction temperatures (T50% and T90%) at which 50% and 90% conversions are achieved, respectively. The OMS-2 showed the lowest catalytic activity, with the T50% and T90% being 135 and 145 °C for CO oxidation, 190 and 250 °C for ethyl acetate oxidation, and 260 and 340 °C for toluene oxidation, respectively. The 15Cu/OMS-2 sample performed the best: the T50% and T90% were 65 and 85 °C for CO oxidation, 165 and 215 °C for ethyl acetate oxidation, and 240 and 290 °C for toluene oxidation, respectively. The catalytic activity for CO, ethyl acetate, and toluene oxidation decreased according to the sequence of 15Cu/OMS-2 > 20Cu/OMS-2 > 5Cu/OMS-2 > 1Cu/OMS-2 > OMS-2. Obviously, doping of Cu significantly decreased the reaction temperature at the same conversion. Moreover, the supported Cu content also had a great influence on the catalytic activity, with the 15Cu/OMS-2 sample performing the best, which was closely related to the active oxygen species, generating oxygen vacancies and low-temperature reducibility.
In order to better compare the catalytic activities of the OMS-2 and xCu/OMS-2 samples for CO, ethyl acetate, and toluene oxidation, we calculate the rcat over the samples at 70, 180, and 260 °C (Table 4), respectively. For CO oxidation, the rcat (2.04 × 10⁻⁶ molCO/(gcat s)) at 70 °C over 15Cu/OMS-2 was much higher than that (3.1 × 10⁻⁷ molCO/(gcat s)) at 100 °C over Pd/CuMnOx[28]. For ethyl acetate oxidation, the rcat (9.82 × 10⁻⁷ molethyl acetate/(gcat s)) over OMS-2 at 180 °C and those (1.25 × 10⁻⁶–1.74 × 10⁻⁶ molethyl acetate/(gcat s)) over xCu/OMS-2 at 180 °C were higher than that (2.30 × 10⁻⁷ molethyl acetate/(gcat s)) over Cu-Ce-Zr prepared by Dou et al. [29]. For toluene oxidation, the rcat (9.82 × 10⁻⁷ moltoluene/(gcat s)) over OMS-2 at 260 °C and those (1.31 × 10⁻⁶–1.85 × 10⁻⁶ moltoluene/(gcat s)) over xCu/OMS-2 at 260 °C were higher than that (4.09 × 10⁻⁷ moltoluene/ (gcat s)) over OM-CuMn0.25 prepared by Aguilera et al. [26]. The rcat over OMS-2 and xCu/OMS-2 for CO, ethyl acetate, and toluene oxidation decreased in the order of 15Cu/OMS-2 > 20Cu/OMS-2 > 5Cu/OMS-2 > 1Cu/OMS-2 > OMS-2, in good accordance with the sequence in catalytic activity, signifying that the 15Cu/OMS-2 sample performed the best.
The conversions of CO at 85 °C, ethyl acetate at 215 °C, and toluene at 290 °C versus time on-stream are illustrated in Figure 9. Apparently, a stable conversion was achieved over the 15Cu/OMS-2 sample for the oxidation of CO, ethyl acetate, and toluene within 50 h of on-stream reaction. No obvious decreases in activity were measured, suggesting that the 15Cu/OMS-2 sample was catalytically durable under the adopted reaction conditions. The good catalytic stability might be associated with the hydrophobicity of the OMS-2 surface, since good hydrophobicity could reduce the adsorption of water generated during organics oxidation on the active sites [30].
2.3. In Situ DRIFTS Spectra and Catalytic Oxidation Mechanism
Figure 10 shows the in situ DRIFTS spectra of the CO (Figure 10A), ethyl acetate (Figure 10B), and toluene (Figure 10C) oxidation over the 15Cu/OMS-2 sample, which provides convenience to identify the reaction intermediates formed during the oxidation processes of the reactants at different temperatures.
2.3.1. CO Oxidation over 15Cu/OMS-2
Figure 10A shows the in situ DRIFTS spectra of CO oxidation at 30, 70, and 100 °C. As revealed in the in situ DRIFTS spectra of CO oxidation at 30 °C, the absorption bands appeared in the ranges of 2176–2113 and 2355–2325 cm−1. The former was assigned to CO adsorption on the active sites, whereas the latter was ascribed to the gaseous and adsorbed CO2. This result indicates that CO began to convert to CO2 at 30 °C [31,32]. When the temperature reached 70 °C, the band of CO (2176–2113 cm−1) became stronger in intensity. Meanwhile, the absorption band of the gaseous and adsorbed CO2 at 2355–2325 cm−1 became obvious. With a further rise in temperature to 100 °C, the band at 2176–2113 cm−1 nearly disappeared, while the band at 2355–2325 cm−1 was preserved, which indicates that CO was almost converted to CO2 at this temperature, in good consistency with the activity evaluation of CO oxidation over the 15Cu/OMS-2 sample (Figure 8A).
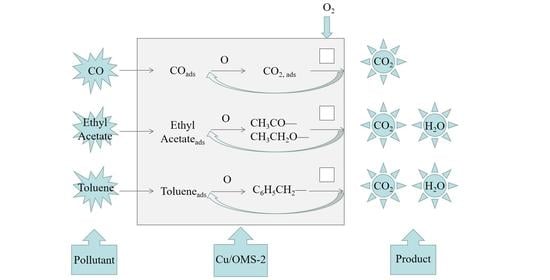
CO oxidation on the 15Cu/OMS-2 sample would follow a Mars–van Krevelen mechanism [15]. Reaction cycles are shown in Figure 11A. Initially, gaseous CO molecules were adsorbed on the sample surface and activated on the active sites of the sample to the active CO species. The active CO species then combined with the reactive oxygen species to generate the adsorbed CO2 and oxygen vacancies. Subsequently, the adsorbed CO2 was released from the sample surface to gaseous CO2. Eventually, the gaseous O2 was adsorbed and activated to generate the active oxygen species, which was supplied to the oxygen vacancies. Based on the above discussion, the number of the active sites and active oxygen species, oxygen mobility, and reducibility of the sample had distinct impacts on the catalytic performance.
2.3.2. Ethyl Acetate Oxidation over 15Cu/OMS-2
Figure 10B shows the in situ DRIFTS spectra of ethyl acetate oxidation at 125, 175, and 225 °C. There were many bands of intermediate species in the range of 1000–2600 cm−1. The band at 1210 cm−1 was representative of the C–O stretching vibration of ethyl acetate, the one at 1243 cm−1 was concerned with the C–O stretching vibration of alcoholates, the one at 1340 cm−1 was due to the CH3 stretching vibration of acetates, the ones at 1458 and 1416 cm−1 were ascribed to the COO− symmetric stretching vibrations of acetates, and the wide ones at 1560–1508 cm−1 was attributed to the overlapping COO− anti-symmetric stretching vibrations of acetates [33]. The C=O of ethyl acetate or aldehyde was relevant to the bands at 1726 and 1689 cm−1 [34]. Asymmetric stretching vibration band corresponding to CO2 appeared at 2360 and 2340 cm−1. The results show that acetate was the main intermediate product. When the temperature reached 175 °C, intensity of the bands at 2000–1200 cm−1 assignable to the ethyl acetate and acetate species decreased significantly as compared with those when the temperature was 125 °C, indicating that oxidation of ethyl acetate to the intermediate species and then to CO2 and H2O increased rapidly with the rise in temperature. When the temperature reached 225 °C, the absorption band of the intermediates almost disappeared, and merely a weak absorption band at 2360–2340 cm−1 of CO2 was retained, demonstrating that ethyl acetate was almost thoroughly oxidized at this temperature, which was in good agreement with the catalytic activity of the 15Cu/OMS-2 sample (Figure 8B).
In general, lattice oxygen participates in the oxidation of VOCs, i.e., catalytic oxidation of VOCs took place via a Mars–van Krevelen mechanism [35]. The possible mechanism of catalytic ethyl acetate oxidation is shown in Figure 11B, in which the oxidation process involved the oxidation of the carboxylate species, since the emblematical adsorption species were observed in the catalytic ethyl acetate oxidation over 15Cu/OMS-2 [36]. As the temperature increased, the intermediate acetate was rapidly oxidized to CO2 and H2O. The specific steps were as follows: Ethyl acetate molecules were adsorbed on the sample surface and activated by the active sites, which caused the production of carboxyl and hydroxyl groups. The produced carboxyl and hydroxyl groups were converted through two ways, in which both carboxyl and hydroxyl groups were eventually converted to acetate. Under the promotion of the exchangeable oxygen species, the intermediate acetate was rapidly converted into CO2 and H2O and detached from the sample surface. Finally, the gaseous O2 was adsorbed and activated into the oxygen species, which attacked the oxygen vacancies and replenish the consumed oxygen species.
2.3.3. Toluene Oxidation over 15Cu/OMS-2
The in situ DRIFTS spectra of toluene oxidation over the 15Cu/OMS-2 sample at different temperatures are shown in Figure 10C. The bands at 1616 and 1513 cm−1 were characteristic aromatic ring vibrations [37], the one at 1520 cm−1 was attributed to the carboxylic acid group. Meanwhile, the band at higher intensity ascribed to the carboxylate species suggests that benzoate was likely to be a key intermediate involved in toluene oxidation. The bands at 1694 and 1645 cm−1 due to the stretching vibration of C=O of aldehyde were also recorded. The band at 1739 cm−1 corresponded to an anhydride species, which was consistent with the findings reported by Bentrup et al. [38]. The bands at 2358 and 2321 cm−1 were ascribed to CO2. As the temperature increased from 250 to 350 °C, intensity of all of the absorption bands was weakened, indicating that the reaction rate of toluene oxidation to CO2 and H2O was accelerated. As revealed in the toluene oxidation at 250 °C, the benzoate species were decomposed on the surface of the 15Cu/OMS-2 sample. When the temperature increased to 300 °C, the bands at 1520 and 1694 cm−1 of the benzoate and aldehyde species were even more difficult to be captured until they disappeared at 350 °C. This result indicates that toluene was completely oxidized at this temperature, which was in good accordance with the temperature of toluene oxidation over the 15Cu/OMS-2 sample (Figure 8C).
A reasonable mechanism for toluene oxidation over 15Cu/OMS-2 was proposed according to the above in situ DRIFTS results, as shown in Figure 11C. The adsorbed toluene molecules could be converted to the benzoate intermediate and further quickly oxidized to CO2 and H2O. In detail, the adsorbed and activated toluene generated C6H5CH2–, which was further dehydrogenated to form C6H5OC– that was finally converted to CO2 and H2O. Hereafter, gaseous oxygen was adsorbed on the surface of 15Cu/OMS-2, dissociated, and eventually refilled the oxygen vacancies created during the oxidation process. In this way, toluene could be oxidized continuously and efficiently.
Cu species, Mn3+/Mn4+, and active oxygen species were involved in the reaction processes. The key to the reaction was the supply of the active oxygen species, and the existence of Cu species and Mn3+/Mn4+ redox couples could promote electron transfer and oxygen mobility. The high oxygen mobility was conducive to the continuous replenishment of oxygen vacancies and the continuous generation of reactant intermediates, thereby increasing the catalytic reaction rate. Catalytic performance of the 15Cu/OMS-2 sample increased with the improved oxygen mobility and low-temperature reducibility, which were in good consistency with the O2-TPD and H2-TPR results. Consequently, redox property of the sample and regeneration ability of the active oxygen species played important roles in the catalytic oxidation of CO and VOCs.
3. Materials and Methods
3.1. Catalyst Preparation
All of the chemicals utilized in this work were analytical in purity and used without further purification. Synthesis of OMS-2 was conducted via a buffer solution method. Briefly, 11 g of Mn(CH3COOH)2·4H2O was dissolved in 40 mL of deionized water (DW), and a buffer solution was prepared by dissolving 5 g of KCH3COOH and 5 mL of CH3COOH in 40 mL of DW, followed by adding it to the above Mn-containing solution. Then, a KMnO4 solution containing 6.5 g of KMnO4 in 150 mL of DW was added dropwise to the above mixed solution. After being refluxed at 100 °C for 24 h simultaneously and stirred vigorously, the obtained product was filtered, washed with DW several times until a neutral pH was reached, dried at 120 °C overnight, and calcined in a muffle furnace at a rate ramp of 2 °C/min from room temperature to 400 °C and maintained at this temperature for 4 h, thus obtaining the OMS-2 support.
The xCu/OMS-2 samples were prepared by the pre-incorporation method. After dissolving 11 g of Mn(CH3COOH)2·4H2O in 40 mL of DW, it was transferred to a 500-mL three-necked flask. Cu(NO3)2·3H2O was added to the buffer solution, which was prepared using 5 g of KCH3COOH and 5 mL of glacial acetic acid dissolved in 40 mL of DW. The above mixed solution was added dropwise to the Mn(CH3COOH)2 aqueous solution. 6.5 g of KMnO4 was dissolved in 150 mL of DW, and the as-prepared KMnO4 solution was slowly added dropwise to a three-necked flask under stirring magnetically. Then the above mixed solution was refluxed at 100 °C for 24 h, filtered with suction, and washed with DW until the filtrate was neutral. The obtained filter residue was dried at 120 °C for 12 h and then calcined in a muffle furnace at 400 °C for 4 h to obtain the Cu/OMS-2 sample. The xCu/OMS-2 samples were prepared by changing the mass of Cu(NO3)2·3H2O to load Cu with mass fractions of 1, 5, 15, and 20 wt%, which were recorded as 1Cu/OMS-2, 5Cu/OMS-2, 15Cu/OMS-2, and 20Cu/OMS-2, respectively.
3.2. Catalyst Characterization
The XRD patterns of the samples were recorded in a Bruker-AXS D8 Advance diffractometer (Bruker, Billerica, MA, America) with radiation (λ = 0.15406 Å) of Cu Kα at a scan rate of 1.2°/min from 2θ = 10° to 80°. The FT-IR spectra of the typical samples were measured in a Perkin-Elmer One FTIR spectrometer (PerkinElmer Inc., Waltham, MA, USA) (400–2000 cm−1, a step of 4 cm−1). Surface morphologies of the samples were observed on a SEM apparatus of Zeiss Supra 55 (Zeiss, Oberkochen, Germany) with the acceleration voltage of 20 kV and the vacuum degree of less than 10−5 Pa. The thermal stability of the samples was investigated using the TG/DTG technique with the sample mass being 10 mg, the temperature range being 30,900 °C, and the heating rate being 10 °C/min. ICP-OES characterization was conducted to determine the actual CuO contents in sample. Using Al Kα excitation source, XPS spectra of the samples were measured on an ESCALAB 250Xi spectrometer (ThermoFisher, Shanghai, China). The C 1s signal of contaminant carbon at BE = 284.6 eV was used to calibrate the Mn 2p and O 1s binding energies of the samples. The O2-TPD profiles of the samples were determined on a chemical adsorption analyzer (Builder PCA-1200, Beijing, China). A He flow (20 mL/min) was used to pretreat 50 mg of the sample at 400 °C for 1 h. After that, the sample was dropped to room temperature, changed to a 10 vol% O2/He (balance) flow of 20 mL/min at 100 °C for 1 h, and then flushed with He (20 mL/min) at room temperature for 1 h. Ultimately, O2 desorption was carried out in a He flow (20 mL/min) by heating at a step of 10 °C/min from 50 to 950 °C. H2-TPR was performed on a chemisorption analyzer. Then, 100 mg of the sample was heated in a 5 vol% H2/Ar (balance) flow of 25 mL/min from room temperature to 900 °C at a rate of 10 °C/min. The in situ DRIFTS spectra of the samples were conducted on a Bruker TENSOR II spectrometer (Bruker, Karlsruhe, Germany) with a reaction chamber. The catalyst sample was packed in spectrometer and heated to 400 °C in a N2 flow of 200 mL/min for 1 h. Moreover, each spectrum was recorded with a resolution of 4 cm−1 (32 accumulated scans).
3.3. Catalytic Evaluation
The catalytic activity evaluation of the samples was performed in a fixed-bed quartz tubular microreactor. To reduce local hot spots, 150 mg of quartz sands (40–60 mesh) was mixed with 100 mg (40–60 mesh) of the sample. (i) For CO oxidation, the reactant mixture was (1.08 vol% CO + air (balance)) with a total flow rate of 50 mL/min, giving rise to a space velocity (SV) of 30,000 mL/(g h). The reaction products were analyzed by an online gas chromatograph (GC-14C, Shimadzu, Shanghai, China) with a thermal conductivity detector (TCD) for CO detection. (ii) For toluene oxidation or ethyl acetate, a concentration of 2000 ppm toluene or ethyl acetate generated by N2 bubbling (8.29 or 2.53 mL/min) of a toluene or ethyl acetate saturator at 30 °C was mixed with the N2 and O2 flows, giving a total flow rate of 200 mL/min and a SV of 120,000 mL/(g h). The reaction organics products were analyzed on an online gas chromatograph (GC-7900, Techcomp, Shanghai, China) with a flame ion detector (FID). The conversions of CO, toluene, and ethyl acetate were calculated according to the equation of (Cin − Cout)/Cin × 100%, where Cin and Cout represent the inlet and outlet concentrations of CO, toluene, or ethyl acetate, respectively.
In order to better compare the catalytic activities of the OMS-2 and xCu/OMS-2 samples for CO, toluene, and ethyl acetate oxidation, we calculated the specific reaction rates (rcat).
where w is catalyst mass, v(B) is the stoichiometric number of reactant B in the total reaction, n(B) is the molar amount of reactant B, and t is time.
rcat = (1/w) × [1/v(B)] × dn(B)/dt,
4. Conclusions
The xCu/OMS-2 samples were prepared via a pre-incorporation route. By means of various characterizations, it was found that the 15Cu/OMS-2 sample possessed improved physicochemical properties, such as the highest ratios of Mn3+/Mn4+ and Oads/Olatt, good oxygen mobility, good low-temperature reducibility, and strong interaction between the Cu species and the OMS-2 support, which was strongly correlated with its excellent catalytic performance: T50% = 65 °C and T90% = 85 °C for CO oxidation, T50% = 165 °C and T90% = 215 °C for ethyl acetate oxidation, and T50% = 240 °C and T90% = 290 °C for toluene oxidation. The redox property and regeneration ability of active oxygen of the 15Cu/OMS-2 sample played important roles in the oxidation of CO, ethyl acetate, and toluene.
Author Contributions
Conceptualization, Q.Y.; methodology, Z.F. and M.C.; software, Z.F. and N.D.; investigation, Z.F.; resources, Q.Y.; data curation, M.C. and N.D.; writing—original draft preparation, Z.F.; writing—review and editing, H.D.; visualization, Z.F. and M.C.; supervision, Q.Y. and H.D.; project administration, Q.Y.; funding acquisition, Q.Y. All authors have read and agreed to the published version of the manuscript.
Funding
This work was supported by the National Natural Science Foundation of China (21277008 and 20777005), the National Key Research and Development Program of China (2017YFC0209905), and the Natural Science Foundation of Beijing (8082008). We also thank Ralph T. Yang (University of Michigan) for his helpful discussion and encouragement.
Data Availability Statement
The data presented in this study are available on request from the corresponding author.
Conflicts of Interest
The authors declare no conflict of interest.
References
- Ghosh, R.; Gardner, J.W.; Guha, P.K. Air pollution monitoring using near room temperature resistive gas sensors: A review. IEEE Trans. Electron. Dev. 2019, 66, 3254–3264. [Google Scholar] [CrossRef]
- Mao, M.; Lv, H.; Li, Y.; Yang, Y.; Zeng, M.; Li, N.; Zhao, X. Metal support interaction in Pt nanoparticles partially confined in the mesopores of microsized mesoporous CeO2 for highly efficient purification of volatile organic compounds. ACS Catal. 2015, 6, 418–427. [Google Scholar] [CrossRef]
- Sanz, O.; Delgado, J.J.; Navarro, P.; Arzamendi, G.; Gandía, L.M.; Montes, M. VOCs combustion catalysed by platinum supported on manganese octahedral molecular sieves. Appl. Catal. B Environ. 2011, 110, 231–237. [Google Scholar] [CrossRef]
- Deng, H.; Kang, S.; Ma, J.; Zhang, C.; He, H. Silver incorporated into cryptomelane-type Manganese oxide boosts the catalytic oxidation of benzene. Appl. Catal. B Environ. 2018, 239, 214–222. [Google Scholar] [CrossRef]
- Zhang, Z.; Jiang, Z.; Shangguan, W. Low-temperature catalysis for VOCs removal in technology and application: A state-of-the-art review. Catal. Today 2016, 264, 270–278. [Google Scholar] [CrossRef]
- He, J.; Chen, S.; Tang, W.; Dang, Y.; Kerns, P.; Miao, R.; Dutta, B.; Gao, P.; Suib, S.L. Microwave-assisted integration of transition metal oxide nanocoatings on manganese oxide nanoarray monoliths for low temperature CO oxidation. Appl. Catal. B Environ. 2019, 255, 117766. [Google Scholar] [CrossRef]
- Tokura, Y.; Nagaosa, N. Orbital physics in transition-metal oxides. Science 2000, 288, 462–468. [Google Scholar] [CrossRef] [Green Version]
- Sithambaram, S.; Nyutu, E.K.; Suib, S.L. OMS-2 catalyzed oxidation of tetralin: A comparative study of microwave and conventional heating under open vessel conditions. Appl. Catal. A Gen. 2008, 348, 214–220. [Google Scholar] [CrossRef]
- Chen, X.; Shen, Y.; Suib, S.L.; O’Young, C.L. Characterization of manganese oxide octahedral molecular sieve (M−OMS-2) materials with different metal cation dopants. Chem. Mater. 2002, 14, 940–948. [Google Scholar] [CrossRef]
- Pisal, D.S.; Yadav, G.D. Single-step hydrogenolysis of furfural to 1,2-pentanediol using a bifunctional Rh/OMS-2 catalyst. ACS Omega 2019, 4, 1201–1214. [Google Scholar] [CrossRef]
- Liu, J.; Ke, L.; Liu, J.; Sun, L.; Yuan, X.; Li, Y.; Xia, D. Enhanced catalytic ozonation towards oxalic acid degradation over novel copper doped manganese oxide octahedral molecular sieves nanorods. J. Hazard. Mater. 2019, 371, 42–52. [Google Scholar] [CrossRef]
- Li, Y.; Fan, Z.; Shi, J.; Liu, Z.; Zhou, J.; Shangguan, W. Modified manganese oxide octahedral molecular sieves M’-OMS-2 (M’ = Co, Ce, Cu) as catalysts in post plasma-catalysis for acetaldehyde degradation. Catal. Today 2015, 256, 178–185. [Google Scholar] [CrossRef]
- Nur, H.; Hayati, F.; Hamdan, H. On the location of different titanium sites in Ti-OMS-2 and their catalytic role in oxidation of styrene. Catal. Commun. 2007, 8, 2007–2011. [Google Scholar] [CrossRef] [Green Version]
- Liu, L.; Song, Y.; Fu, Z.; Ye, Q.; Cheng, S.; Kang, T.; Dai, H. Effect of preparation method on the surface characteristics and activity of the Pd/OMS-2 catalysts for the oxidation of carbon monoxide, toluene, and ethyl acetate. Appl. Surf. Sci. 2017, 396, 599–608. [Google Scholar] [CrossRef]
- Özacar, M.; Poyraz, A.S.; Genuino, H.C.; Kuo, C.; Meng, Y.; Suib, S.L. Influence of silver on the catalytic properties of the cryptomelane and Ag-hollandite types manganese oxides OMS-2 in the low-temperature CO oxidation. Appl. Catal. A Gen. 2013, 462–463, 64–74. [Google Scholar] [CrossRef]
- Sun, M.; Yu, L.; Ye, F.; Diao, G.; Yu, Q.; Hao, Z.; Zheng, Y.; Yuan, L. Transition metal doped cryptomelane-type manganese oxide for low-temperature catalytic combustion of dimethyl ether. Chem. Eng. J. 2013, 220, 320–327. [Google Scholar] [CrossRef]
- Fu, J.; Dong, N.; Ye, Q.; Cheng, S.; Kang, T.; Dai, H. Enhanced performance of the OMS-2 catalyst by Ag loading for the ox-idation of benzene, toluene, and formaldehyde. New J. Chem. 2018, 42, 18117–18127. [Google Scholar] [CrossRef]
- Hou, J.; Li, Y.; Mao, M.; Ren, L.; Zhao, X. Tremendous effect of the morphology of birnessite-type manganese oxide nanostructures on catalytic activity. ACS Appl. Mater. Interfaces 2014, 6, 14981–14987. [Google Scholar] [CrossRef] [PubMed]
- Sun, H.; Chen, S.; Wang, P.; Quan, X. Catalytic oxidation of toluene over manganese oxide octahedral molecular sieves (OMS-2) synthesized by different methods. Chem. Eng. J. 2011, 178, 191–196. [Google Scholar] [CrossRef]
- Li, X.; Ma, J.; Jia, X.; Xia, F.; Huang, Y.; Xu, Y.; Xu, J. Al-doping promoted aerobic amidation of 5-hydroxymethylfurfural to 2,5-furandicarboxamide over cryptomelane. ACS Sustain. Chem. Eng. 2018, 6, 8048–8054. [Google Scholar] [CrossRef]
- Meng, X.; Zhang, J.; Chen, B.; Jing, Z.; Zhao, P. Copper supported on H+-modified manganese oxide octahedral molecular sieves (Cu/H-OMS-2) as a heterogeneous biomimetic catalyst for the synthesis of imidazo[1,2-a]-N-heterocycles. Catal. Sci. Technol. 2016, 6, 890–896. [Google Scholar] [CrossRef]
- Wang, Q.; Chen, L.; Guan, S.; Zhang, X.; Wang, B.; Cao, X.; Yu, Z.; He, Y.; Evans, D.G.; Feng, J.; et al. Ultrathin and vacancy-rich CoAl-layered double hydroxide/graphite oxide catalysts: Promotional effect of cobalt vacancies and oxygen vacancies in alcohol oxidation. ACS Catal. 2018, 8, 3104–3115. [Google Scholar] [CrossRef]
- Zhang, L.; Tu, J.; Lyu, L.; Hu, C. Enhanced catalytic degradation of ciprofloxacin over Ce-doped OMS-2 microspheres. Appl. Catal. B Environ. 2016, 181, 561–569. [Google Scholar] [CrossRef]
- Tian, H.; He, J.; Liu, L.; Wang, D.; Hao, Z.; Ma, C. Highly active manganese oxide catalysts for low-temperature oxidation of formaldehyde. Microporous Mesoporous Mater. 2012, 151, 397–402. [Google Scholar] [CrossRef]
- Liu, X.; Jiang, S.; Li, H.; Yang, J.; Yang, Z.; Zhao, J.; Peng, H.; Shih, K. Elemental mercury oxidation over manganese oxide octahedral molecular sieve catalyst at low flue gas temperature. Chem. Eng. J. 2019, 356, 142–150. [Google Scholar] [CrossRef]
- Aguilera, D.A.; Perez, A.; Molina, R.; Moreno, S. Cu-Mn and Co-Mn catalysts synthesized from hydrotalcites and their use in the oxidation of VOCs. Appl. Catal. B Environ. 2011, 104, 144–150. [Google Scholar] [CrossRef]
- Song, Y.; Liu, L.; Fu, Z.; Ye, Q.; Cheng, S.; Kang, T.; Dai, H. Excellent performance of Cu-Mn/Ti-sepiolite catalysts for low-temperature CO oxidation. Front. Environ. Sci. Eng. 2017, 11, 77–86. [Google Scholar] [CrossRef]
- Huang, Q.; Yan, X.; Li, B.; Xu, X.; Chen, Y.; Zhu, S.; Shen, S. Activity and stability of Pd/MMnOx (M = Co, Ni, Fe and Cu) supported on cordierite as CO oxidation catalysts. J. Ind. Eng. Chem. 2013, 19, 438–443. [Google Scholar] [CrossRef]
- Dou, B.; Zhao, R.; Yan, N.; Zhao, C.; Hao, Q.; Hui, K.S.; Hui, K.N. A facilitated synthesis of hierarchically porous Cu-Ce-Zr catalyst using bacterial cellulose for VOCs oxidation. Mater. Chem. Phys. 2019, 237, 121852. [Google Scholar] [CrossRef]
- Alvarez-Merino, M.A.; Ribeiro, M.F.; Silva, J.M.; Carrasco-Marín, F.; Maldonado-Hódar, F.J. Activated carbon and tungsten oxide supported on activated carbon catalysts for toluene catalytic combustion. Environ. Sci. Technol. 2004, 38, 4664–4670. [Google Scholar] [CrossRef] [PubMed]
- Li, J.; Tang, Y.; Ma, Y.; Zhang, Z.; Tao, F.F.; Qu, Y. In situ formation of isolated bimetallic PtCe Sites of single-dispersed Pt on CeO2 for low-temperature CO oxidation. ACS Appl. Mater. Interfaces 2018, 10, 38134–38140. [Google Scholar] [CrossRef]
- Wang, Y.; Widmann, D.; Lehnert, F.; Gu, D.; Schuth, F.; Behm, R.J. Avoiding self-poisoning: A key feature for the high activity of Au/Mg(OH)2 catalysts in continuous low-temperature CO oxidation. Angew. Chem. Int. Ed. 2017, 56, 9597–9602. [Google Scholar] [CrossRef] [PubMed]
- Liu, X.; Han, Q.; Shi, W.; Zhang, C.; Li, E.; Zhu, T. Catalytic oxidation of ethyl acetate over Ru-Cu bimetallic catalysts: Further insights into reaction mechanism via in situ FTIR and DFT studies. J. Catal. 2019, 369, 482–492. [Google Scholar] [CrossRef]
- Qin, Y.; Liu, X.; Zhu, T.; Zhu, T. Catalytic oxidation of ethyl acetate over silver catalysts supported on CeO2 with different morphologies. Mater. Chem. Phys. 2019, 229, 32–38. [Google Scholar] [CrossRef]
- Genuino, H.C.; Dharmarathna, S.; Njagi, E.C.; Mei, M.C.; Suib, S.L. Gas-phase total oxidation of benzene, toluene, ethylbenzene, and xylenes using shape-selective manganese oxide and copper manganese oxide catalysts. J. Phys. Chem. C 2012, 116, 12066–12078. [Google Scholar] [CrossRef]
- Gandhe, A.R.; Rebello, J.S.; Figueiredo, J.L.; Fernandes, J.B. Manganese oxide OMS-2 as an effective catalyst for total oxidation of ethyl acetate. Appl. Catal. B Environ. 2007, 72, 129–135. [Google Scholar] [CrossRef]
- Sun, H.; Liu, Z.; Chen, S.; Quan, X. The role of lattice oxygen on the activity and selectivity of the OMS-2 catalyst for the total oxidation of toluene. Chem. Eng. J. 2015, 270, 58–65. [Google Scholar] [CrossRef]
- Bentrup, U.; Martin, A.; Lücke, B. Infrared characterization of the surface intermediates in the oxidation of toluene on vanadyl pyrophosphate catalysts. Top. Catal. 2000, 11, 139–145. [Google Scholar] [CrossRef]
Figure 1.
XRD patterns of (a) OMS-2, (b) 1Cu/OMS-2, (c) 5Cu/OMS-2, (d) 15Cu/OMS-2, and (e) 20Cu/OMS-2.
Figure 1.
XRD patterns of (a) OMS-2, (b) 1Cu/OMS-2, (c) 5Cu/OMS-2, (d) 15Cu/OMS-2, and (e) 20Cu/OMS-2.

Figure 2.
FT-IR spectra of (a) OMS-2, (b) 1Cu/OMS-2, (c) 5Cu/OMS-2, (d) 15Cu/OMS-2, and (e) 20Cu/OMS-2.
Figure 2.
FT-IR spectra of (a) OMS-2, (b) 1Cu/OMS-2, (c) 5Cu/OMS-2, (d) 15Cu/OMS-2, and (e) 20Cu/OMS-2.

Figure 3.
SEM images of (a) OMS-2, (b) 1Cu/OMS-2, (c) 5Cu/OMS-2, (d) 15Cu/OMS-2, and (e) 20Cu/OMS-2.
Figure 3.
SEM images of (a) OMS-2, (b) 1Cu/OMS-2, (c) 5Cu/OMS-2, (d) 15Cu/OMS-2, and (e) 20Cu/OMS-2.

Figure 4.
(A) TG and (B) DTG plots of (a) OMS-2, (b) 1Cu/OMS-2, (c) 5Cu/OMS-2, (d) 15Cu/OMS-2, and (e) 20Cu/OMS-2.
Figure 4.
(A) TG and (B) DTG plots of (a) OMS-2, (b) 1Cu/OMS-2, (c) 5Cu/OMS-2, (d) 15Cu/OMS-2, and (e) 20Cu/OMS-2.

Figure 5.
(A) Mn 2p, (B) O 1s, and (C) Cu 2p XPS spectra of (a) OMS-2, (b) 1Cu/OMS-2, (c) 5Cu/OMS-2, (d) 15Cu/OMS-2, and (e) 20Cu/OMS-2.
Figure 5.
(A) Mn 2p, (B) O 1s, and (C) Cu 2p XPS spectra of (a) OMS-2, (b) 1Cu/OMS-2, (c) 5Cu/OMS-2, (d) 15Cu/OMS-2, and (e) 20Cu/OMS-2.

Figure 6.
O2-TPD profiles of (a) OMS-2, (b) 1Cu/OMS-2, (c) 5Cu/OMS-2, (d) 15Cu/OMS-2, and (e) 20Cu/OMS-2.
Figure 6.
O2-TPD profiles of (a) OMS-2, (b) 1Cu/OMS-2, (c) 5Cu/OMS-2, (d) 15Cu/OMS-2, and (e) 20Cu/OMS-2.

Figure 7.
H2-TPR profiles of of (a) OMS-2, (b) 1Cu/OMS-2, (c) 5Cu/OMS-2, (d) 15Cu/OMS-2, and (e) 20Cu/OMS-2.
Figure 7.
H2-TPR profiles of of (a) OMS-2, (b) 1Cu/OMS-2, (c) 5Cu/OMS-2, (d) 15Cu/OMS-2, and (e) 20Cu/OMS-2.

Figure 8.
Catalytic activities for the oxidation of (A) CO (10,000 ppm) at SV = 30,000 mL/(g h), (B) ethyl acetate (2000 ppm) at SV = 120,000 mL/(g h), and (C) toluene (2000 ppm) at SV = 120,000 mL/(g h) over the OMS-2 and xCu/OMS-2 samples.
Figure 8.
Catalytic activities for the oxidation of (A) CO (10,000 ppm) at SV = 30,000 mL/(g h), (B) ethyl acetate (2000 ppm) at SV = 120,000 mL/(g h), and (C) toluene (2000 ppm) at SV = 120,000 mL/(g h) over the OMS-2 and xCu/OMS-2 samples.

Figure 9.
Catalytic stability of the 15Cu/OMS-2 sample in the oxidation of (A) CO at 85 °C, (B) ethyl acetate at 215 °C and (C) toluene at 290 °C.
Figure 9.
Catalytic stability of the 15Cu/OMS-2 sample in the oxidation of (A) CO at 85 °C, (B) ethyl acetate at 215 °C and (C) toluene at 290 °C.

Figure 10.
In situ DRIFTS spectra of the 15Cu/OMS-2 sample after 1 h of (A) CO oxidation at 30, 70, and 100 °C; (B) ethyl acetate oxidation at 125, 175, 225 °C; and (C) toluene oxidation at 250, 300, and 350 °C.
Figure 10.
In situ DRIFTS spectra of the 15Cu/OMS-2 sample after 1 h of (A) CO oxidation at 30, 70, and 100 °C; (B) ethyl acetate oxidation at 125, 175, 225 °C; and (C) toluene oxidation at 250, 300, and 350 °C.

Figure 11.
Proposed catalytic mechanisms of (A) CO, (B) ethyl acetate, and (C) toluene oxidation over the 15Cu/OMS-2 sample.
Figure 11.
Proposed catalytic mechanisms of (A) CO, (B) ethyl acetate, and (C) toluene oxidation over the 15Cu/OMS-2 sample.


Table 1.
Thermal analysis results of the OMS-2 and xCu/OMS-2 samples at different temperatures.
| Samples | Thermal Analysis (Weight Loss wt%) | |||
|---|---|---|---|---|
| 50–250 (°C) | 250–550 (°C) | 550–700 (°C) | 700–850 (°C) | |
| OMS-2 | 1.54 | 1.29 | 3.69 | 3.07 |
| 1Cu/OMS-2 | 2.08 | 0.86 | 3.55 | 2.69 |
| 5Cu/OMS-2 | 3.15 | 0.91 | 3.78 | 3.28 |
| 15Cu/OMS-2 | 3.62 | 2.21 | 3.12 | 2.65 |
| 20Cu/OMS-2 | 4.54 | 0.79 | 2.37 | 2.02 |
Table 2.
CuO contents, surface Mn3+/Mn4+ and Oads/Olatt atomic ratios of the OMS-2 and xCu/OMS-2 samples.
Table 2.
CuO contents, surface Mn3+/Mn4+ and Oads/Olatt atomic ratios of the OMS-2 and xCu/OMS-2 samples.
| Sample | CuO Content (wt%) a | Surface Atomic Ratio b | |
|---|---|---|---|
| Mn3+/Mn4+ | Oads/Olatt | ||
| OMS-2 | 0.00 | 1.63 | 0.379 |
| 1Cu/OMS-2 | 0.23 | 1.97 | 0.447 |
| 5Cu/OMS-2 | 1.05 | 2.05 | 0.456 |
| 15Cu/OMS-2 | 3.37 | 3.05 | 0.530 |
| 20Cu/OMS-2 | 4.58 | 2.79 | 0.526 |
a The data were determined by the ICP-OES technique. b The data were estimated by quantitively analyzing the peaks in the XPS spectra of the samples.
Table 3.
Reduction temperatures and H2 consumption of the OMS-2 and xCu/OMS-2 samples.
| Sample | Temperature (°C) | H2 Consumption (mmol/gcat) | ||||||
|---|---|---|---|---|---|---|---|---|
| α | β | γ | α | β | γ | (α + β)/γ | Total | |
| OMS-2 | 320 | 370 | 420 | 1.46 | 4.85 | 3.14 | 2.01 | 9.45 |
| 1Cu/OMS-2 | 220 | 300 | 350 | 1.32 | 3.54 | 2.87 | 1.69 | 7.73 |
| 5Cu/OMS-2 | 205 | 310 | 345 | 1.10 | 3.20 | 2.95 | 1.46 | 7.25 |
| 15Cu/OMS-2 | 190 | 285 | 330 | 1.56 | 3.51 | 2.52 | 2.01 | 7.59 |
| 20Cu/OMS-2 | 200 | 300 | 340 | 1.63 | 3.20 | 2.55 | 1.89 | 7.38 |
Table 4.
A consumption on specific reaction rates for the oxidation of CO at 70 °C, ethyl acetate at 180 °C, and toluene at 260 °C over the OMS-2 and xCu/OMS-2 samples.
Table 4.
A consumption on specific reaction rates for the oxidation of CO at 70 °C, ethyl acetate at 180 °C, and toluene at 260 °C over the OMS-2 and xCu/OMS-2 samples.
| Catalyst | rcat (molCO/(gcat s)) | rcat (molethyl acetate/(gcat s)) | rcat (moltoluene/(gcat s)) | Reference |
|---|---|---|---|---|
| OMS-2 | 1.36 × 10⁻⁷ | 1.96 × 10⁻⁶ | 1.96 × 10⁻⁶ | This study |
| 1Cu/OMS-2 | 2.73 × 10⁻⁷ | 2.51 × 10⁻⁶ | 2.62 × 10⁻⁶ | This study |
| 5Cu/OMS-2 | 1.09 × 10⁻⁶ | 2.84 × 10⁻⁶ | 2.94 × 10⁻⁶ | This study |
| 15Cu/OMS-2 | 4.09 × 10⁻⁶ | 3.49 × 10⁻⁶ | 3.71 × 10⁻⁶ | This study |
| 20Cu/OMS-2 | 1.77 × 10⁻⁶ | 3.27 × 10⁻⁶ | 3.27 × 10⁻⁶ | This study |
| PdCoMn/Cord | 3.41 × 10⁻⁷ (at 100 °C) | - | - | [28] |
| Cu–Ce–Zr | - | 2.30 × 10⁻⁷ | - | [29] |
| OM-CuMn0.25 | - | - | 4.09 × 10⁻⁷ | [26] |
Publisher’s Note: MDPI stays neutral with regard to jurisdictional claims in published maps and institutional affiliations. |
© 2021 by the authors. Licensee MDPI, Basel, Switzerland. This article is an open access article distributed under the terms and conditions of the Creative Commons Attribution (CC BY) license (https://creativecommons.org/licenses/by/4.0/).
Share and Cite
MDPI and ACS Style
Fu, Z.; Chen, M.; Ye, Q.; Dong, N.; Dai, H. Enhanced Performance of the OMS-2-Supported CuOx Catalysts for Carbon Monoxide, Ethyl Acetate, and Toluene Oxidation. Catalysts 2021, 11, 713. https://doi.org/10.3390/catal11060713
AMA Style
Fu Z, Chen M, Ye Q, Dong N, Dai H. Enhanced Performance of the OMS-2-Supported CuOx Catalysts for Carbon Monoxide, Ethyl Acetate, and Toluene Oxidation. Catalysts. 2021; 11(6):713. https://doi.org/10.3390/catal11060713
Chicago/Turabian StyleFu, Zhidan, Mengyue Chen, Qing Ye, Ning Dong, and Hongxing Dai. 2021. "Enhanced Performance of the OMS-2-Supported CuOx Catalysts for Carbon Monoxide, Ethyl Acetate, and Toluene Oxidation" Catalysts 11, no. 6: 713. https://doi.org/10.3390/catal11060713
Note that from the first issue of 2016, this journal uses article numbers instead of page numbers. See further details here.