Article

Application of Response Surface Methodology for Preparation of ZnAC2/CAC Adsorbents for Hydrogen Sulfide (H2S) Capture

by
Nurul Noramelya Zulkefli
1,
Mohd Shahbudin Masdar
1,2,*,
Wan Nor Roslam Wan Isahak
1,
Siti Nur Hatika Abu Bakar
1,
Hassimi Abu Hasan
1,3 and
Nabilah Mohd Sofian
2
1
Department of Chemical & Process Engineering, Faculty of Engineering & Built Environment, UKM Bangi, Selangor 43600, Malaysia
2
Fuel Cell Institute, UKM Bangi, Selangor 43600, Malaysia
3
Research Centre for Sustainable Process Technology, UKM Bangi, Selangor 43600, Malaysia
*
Author to whom correspondence should be addressed.
Catalysts 2021, 11(5), 545; https://doi.org/10.3390/catal11050545
Submission received: 5 March 2021 / Revised: 14 April 2021 / Accepted: 19 April 2021 / Published: 24 April 2021
(This article belongs to the Special Issue Catalysts and Processes for H2S Conversion to Sulfur)

Abstract

:
Hydrogen sulfide (H2S) should be removed in the early stage of biogas purification as it may affect biogas production and cause environmental and catalyst toxicity. The adsorption of H2S gas by using activated carbon as a catalyst has been explored as a possible technology to remove H2S in the biogas industry. In this study, we investigated the optimal catalytic preparation conditions of the H2S adsorbent by using the RSM methodology and the Box–Behnken experimental design. The H2S catalyst was synthesized by impregnating commercial activated carbon (CAC) with zinc acetate (ZnAc2) with the factors and level for the Box–Behnken Design (BBD): molarity of 0.2–1.0 M ZnAc2 solution, soaked temperature of 30–100 °C, and soaked time of 30–180 min. Two responses including the H2S adsorption capacity and the BET surface area were assessed using two-factor interaction (2FI) models. The interactions were examined by using the analysis of variance (ANOVA). Hence, the optimum point of molarity was 0.22 M ZnAc2 solution, the soaked period was 48.82 min, and the soaked temperature was 95.08 °C obtained from the optimum point with the highest H2S adsorption capacity (2.37 mg H2S/g) and the optimum BET surface area (620.55 m2/g). Additionally, the comparison of the optimized and the non-optimized catalytic adsorbents showed an enhancement in the H2S adsorption capacity of up to 33%.

1. Introduction

Agricultural industries, livestock ranches, and fuel industries generally generate some natural wastewaters and wastewaters that have a tremendous effect on the debate and pollution of water [1]. The anaerobic digestion of natural wastewater and wastewater does not mitigate this degradation; instead, it creates biogas, fertilized solids, and filtered sewage for subsequent beneficial use [2,3,4]. For example, biogas can be efficiently used for heat and energy substitution for gasoline in transport applications [5]. The biogas composition typically consists of roughly 40–75% of methane (CH4), 25–40% of carbon dioxide (CO2), 0.5–2.5% of nitrogen (N2), 10–30 ppm(v) of ammonia (NH3), and 1000–3000 ppm(v) of hydrogen sulfide (H2S) [6,7]. These compositions, however, depend on the differential sources of the organic substrates.
In practice, the elimination of hydrogen sulfide (H2S) in the oil and gas or biogas processing industries remains one of the key obstacles to the sustainable growth of profitable technologies [8]. H2S is toxic at low concentrations (<1 ppm(v)), impacting the production of biogas and has life-threatening effects at higher concentrations (500 ppm(v)) [9,10]; hence, it is imperative to eliminate H2S in the early stages of the purification system [11]. Several methods have been implemented to eliminate H2S, such as the Clauss technique, which is primarily used in the oil and gas industries [12] that typically produce high concentrations of H2S (>10,000 ppm(v)). Several technologies that are commonly used and commercialized for H2S removal include chemical absorption [13], physical adsorption [14], biological treatment [15,16,17,18], and membrane technology [19,20].
The H2S capture via a biological treatment is efficient and cost-effective; however, it needs a large upfront investment as compared to the dry-based processes. Even though this method is an environmentally friendly system, the separation and purification of H2S may be difficult to carry out. In contrast, the liquid-based and membrane techniques for H2S removal are not economically or energetically viable technologies [13]. However, the adsorption technology is the best and superior for H2S removal even at low concentrations and temperatures [21,22,23]. Adsorption is the most commonly used technique for both large-scale and small-scale applications. All of these technologies are summarized and compared with the most relevant and alternative technology for H2S removal in Table 1.
Adsorption techniques [25,26,27] to remove H2S typically involve mesoporous materials (activated carbon, zeolites, and/or silica) that are also widely known as catalysts because of their surface chemistry, high degree of microporosity, and developed surface area (which can exceed 1000 m2/g) [28]. On both the macro and nanoscales, these materials may have crystalline and/or amorphous structures [16], but they can be further changed to adjust their physicochemical properties, thus improving their adsorption ability against the target molecules. As commercial activated carbon (AC) is often impregnated to increase the capacity of the adsorbents to absorb the adsorbates, it is also subjected to surface modification. The improvement was primarily based on increasing the basic surface area and the porous structure of the mesoporous materials by using chemical activation methods.
Impregnated adsorbents such as catalytic adsorbents, widely applied several chemicals based on alkalis (NaOH, KOH, and KI) [29,30,31,32,33], carbonate compounds (Cu), transition metal oxide compounds (Zn, Fe, and Cu), or metal acetic acid compounds (Zn) [14,34] can be used as solid catalysts or be dispersed as small grains on the surface of a supporting material. Selecting the precursors of active components as well as any necessary promoters and stirring them in a solvent is the first step in producing a supported catalyst. In the end, the active metal or precursor from the solvents is dispersed on the adsorbents’ surface. In contrast to raw activated carbon (AC), impregnated adsorbents with both of these chemicals have a higher specific surface area, smaller particle sizes, and increased H2S capability [32]. Despite this, a metal-supported catalyst (ZnAc2/CAC) demonstrates favorable associations between the adsorbent’s capabilities in capturing the adsorbate and develops better surface area. The dispersion of ZnAc2 on the CAC surface normally acts as active sites to capture the adsorbate particles efficiently. Moreover, ZnAc2 leads to an increase in the specific surface area by decreasing the particle size, which results in an increase in the H2S adsorption capacity, as reported on the basis of the ZnO impregnated performance [35]. Impregnation from both chemicals (ZnAc2 and ZnO) enhanced the adsorbent’s capabilities through surface area and adsorption capacities.
For example, a study on the optimization of the CAC performance evaluated the optimal response using certain factors (molarity, time, humidity, temperature, and pH) and responses (adsorption capacity, surface area, selectivity, and percentage utilization). All the information obtained from these factors and responses can be used in an interaction study to determine the proposed optimization. Normally, the interaction parameters (condition variables) can be analyzed using two types of methods, namely univariate and multivariate optimization. Univariates have the slightest remedial effect relative to multivariates because of the capacity of the univariates to rely on one optimization variable; thus, the multivariate approach requires a design that adjusts all levels of variables simultaneously. For expository systems, this phase is crucial and the optimal operating conditions are determined using complex test designs, the Doehlert lattice (DM), central composite design (CCD), and three-level designs such as the Box–Behnken design (BBD) [36,37,38]. The relationship between the explanatory variables and the response variables [39] can be evaluated graphically by using the empirical data sufficient for the optimal area, thereby allowing new models to be developed and identified and the current product designs to be updated [40].
Therefore, in this study, we applied the BBD by using response surface methodology (RSM) to assess the influence of factors with a minimal number of experiments by evaluating and controlling the Zn acetate CAC impregnation. The response to the selected factors determined the H2S adsorption capacity and characterizes the surface morphologies via the BET surface area of the impregnated CAC on the basis of the BBD recommendation.

2. Materials and Methods

2.1. Adsorbent Preparation

Effigen Carbon Sdn. Bhd, Malaysia, supplied granular commercial coconut activated carbon (CAC), which was sieved to obtain a particle size in the range of 3–5 mm. The selected CAC impregnation compound was zinc acetate (ZnC4H6O4), which was purchased from Friendemann Schmidt Chemicals (Malaysia) and used as obtained without prior purification.
The impregnated CAC surface was prepared with 600 mL of distilled water for a 0.2–1.0 M zinc acetate solvent at 30–100 °C. In brief, 350 g of CAC was soaked into the solvent for 30–180 min before the distribution of the zinc acetate compound on the surface. The wet CAC was drained and dried at 120 °C overnight before being used for H2S adsorption testing and is indicated as ZnAc2/CAC. Moreover, the design of experiments (DOE) recommendation was submitted on the basis of the chosen molarity, soaked time, and soaked temperature for the preparation of the adsorbents.

2.2. Characterization

The surface area and the pore structure were analyzed by a Brunauer–Emmett–Teller (BET) surface area analysis using Micrometric ASAP 2010 Version 4.0.0. The surface area was obtained from the measurement of the BET isotherm, while the pore volumes and the standard pore volumes were calculated at P/Po of 0.98 by using the N2 adsorption isotherm. Meanwhile, the micropore volume was calculated using the t-plot method. After degassing for 4 h at 150 °C, the textural properties of the sorbents were determined by N2 adsorption–desorption at 196 °C with Quantachrome Autosorb 1 °C. The exact surface was extracted from the estimation of the BET.
The surface morphology and the chemical structure characterization for the optimized and non-optimized adsorbents were analyzed using the CARL ZEISS EVO MA10 and energy dispersive X-Ray analysis (EDX) with EDAX APOLLO X model. This characterization method was used to visualize the details of the adsorbent properties in terms of the structural morphology and to identify the elemental composition of the materials present on the surfaces of the adsorbent under an accelerating voltage of 10 kV.

2.3. H2S Adsorption Test

In this study, the H2S adsorption test was implemented using a laboratory-scale set-up of a single stainless-steel column (height and diameter of 0.3 m and 0.06 m, respectively), as shown in Figure 1. In brief, 75 g of the impregnated adsorbent (ZnAc2/CAC) was loaded into the adsorber column and fed in with a commercial mixed gas H2S/N2 (5000-ppm(v) H2S with balanced N2). The adsorption test operated at ambient temperature, the flow rate and pressure gauge were mounted at 5.5 L/min and 1 bar. Due to the tolerable range for the gas exposed to the atmosphere and fuel cell devices, the H2S breakthrough gas concentration at the outlet stream was set at 5–10 ppm(v) [41,42,43]. The outlet H2S gas was detected using a customized portable H2S analyzer (model GC310), which directly imported the data into the computer program. Then, the adsorption capacity of H2S for each DOE suggestion was calculated according to the equation reported by Zulkefli et al. [44].

2.4. Regeneration of Adsorbents

The desorption process for the adsorbents was followed by set-up in a previous study by Zulkefli et al. [32]. The spent adsorbents underwent a three-step purging process. In the first step, the spent adsorbents were run through an air blower for 30 min at 150 °C and a flow rate of 100 L/min. Secondly, the same operating parameters were applied to the column at ambient temperature for 30 min. In the final step, the N2 gas was introduced into the stream; it was fed at 5.5 L/min for 30 min to purge out and stabilized the active site on the adsorbent surface before use in the next adsorption operation up to several cycles of adsorption–desorption.

2.5. Control Factors and Level Selection

It is possible to test the effect of quadratic interactions by using a BBD combined with response surface modeling and quadratic programming. This experimental approach used the regression design to show the result as a predictive function of variables with an impartial and limited variance. In this strategy, the graphical profile illustrates the summary of the response surface being examined [45]. The effects of three preparation factors were investigated: (A) ZnAc2 solution molarity (M), (B) soaked time (min), and (C) soaked temperature (°C) on the CAC surface as well as the capture of the H2S gas. Two responses were used, namely the H2S adsorption capacity and the BET surface area, as a reference to the preparation factors.
The typical variables are coded separately as +1, −1, and 0 for the high, low, and center points; therefore, the units of the parameters are not relevant. Real variables (Xi) are coded by direct transformation as follows:
χ i = x i x 0 Δ x           i = 1 , 2 , 3
where χ i is the encoded value of an independent variable, x i is the actual value of an independent variable, x 0 is the actual value of a center point independent variable, and Δ x is the phase shift value of an independent variable [46]. The process factors and factor levels of the adsorbent preparation state are described in Table 2.
The data from the BBD were analyzed by multiple regression to fit the following quadratic polynomial model:
Y = α 0 + i = 1 3 α i x i + i = 1 3 α i i x i 2 + i = 1 2 j = 2 3 α i j x i x j + ε
where Y is the response variables, α 0   is the model constant, α i   represents the linear coefficient, α i i denotes the quadratic coefficient, α i j is the interaction coefficient, and ε is the statistical error. The least-squares method is used to solve this set of Equation (2). BBD is a common experimental design for the technique of response surfaces in statistics and is a type of second-order rotatable or nearly rotatable design based on three-level incomplete factorial designs. Each design is a combination of a two-level (full or fractional) factorial design with an incomplete block design [47].
Both combinations for factorial design are placed through a certain number of factors in each block, while the other factors are held at the central values. The BBD is a good design for this technique because (1) it enables the calculation of the parameters of the quadratic model, (2) there are no runs where all the variables are at either +1 or −1 levels, and (3) the number of experiments (N) needed for the BBD to evolve is defined as follows [48]:
N = 2 k k 1 + C N
where the number of variables is k and the number of center points is CN. On the basis of Equation (3), the runs will be reduced to 17 with 3 major variables and 5 times the repetition in the center point to reduce the magnitude of error (k = 3 and CN = 5). Three conditions were investigated, namely the molarity state, soaked time, and the soaked temperature; hence, 17 runs were executed.

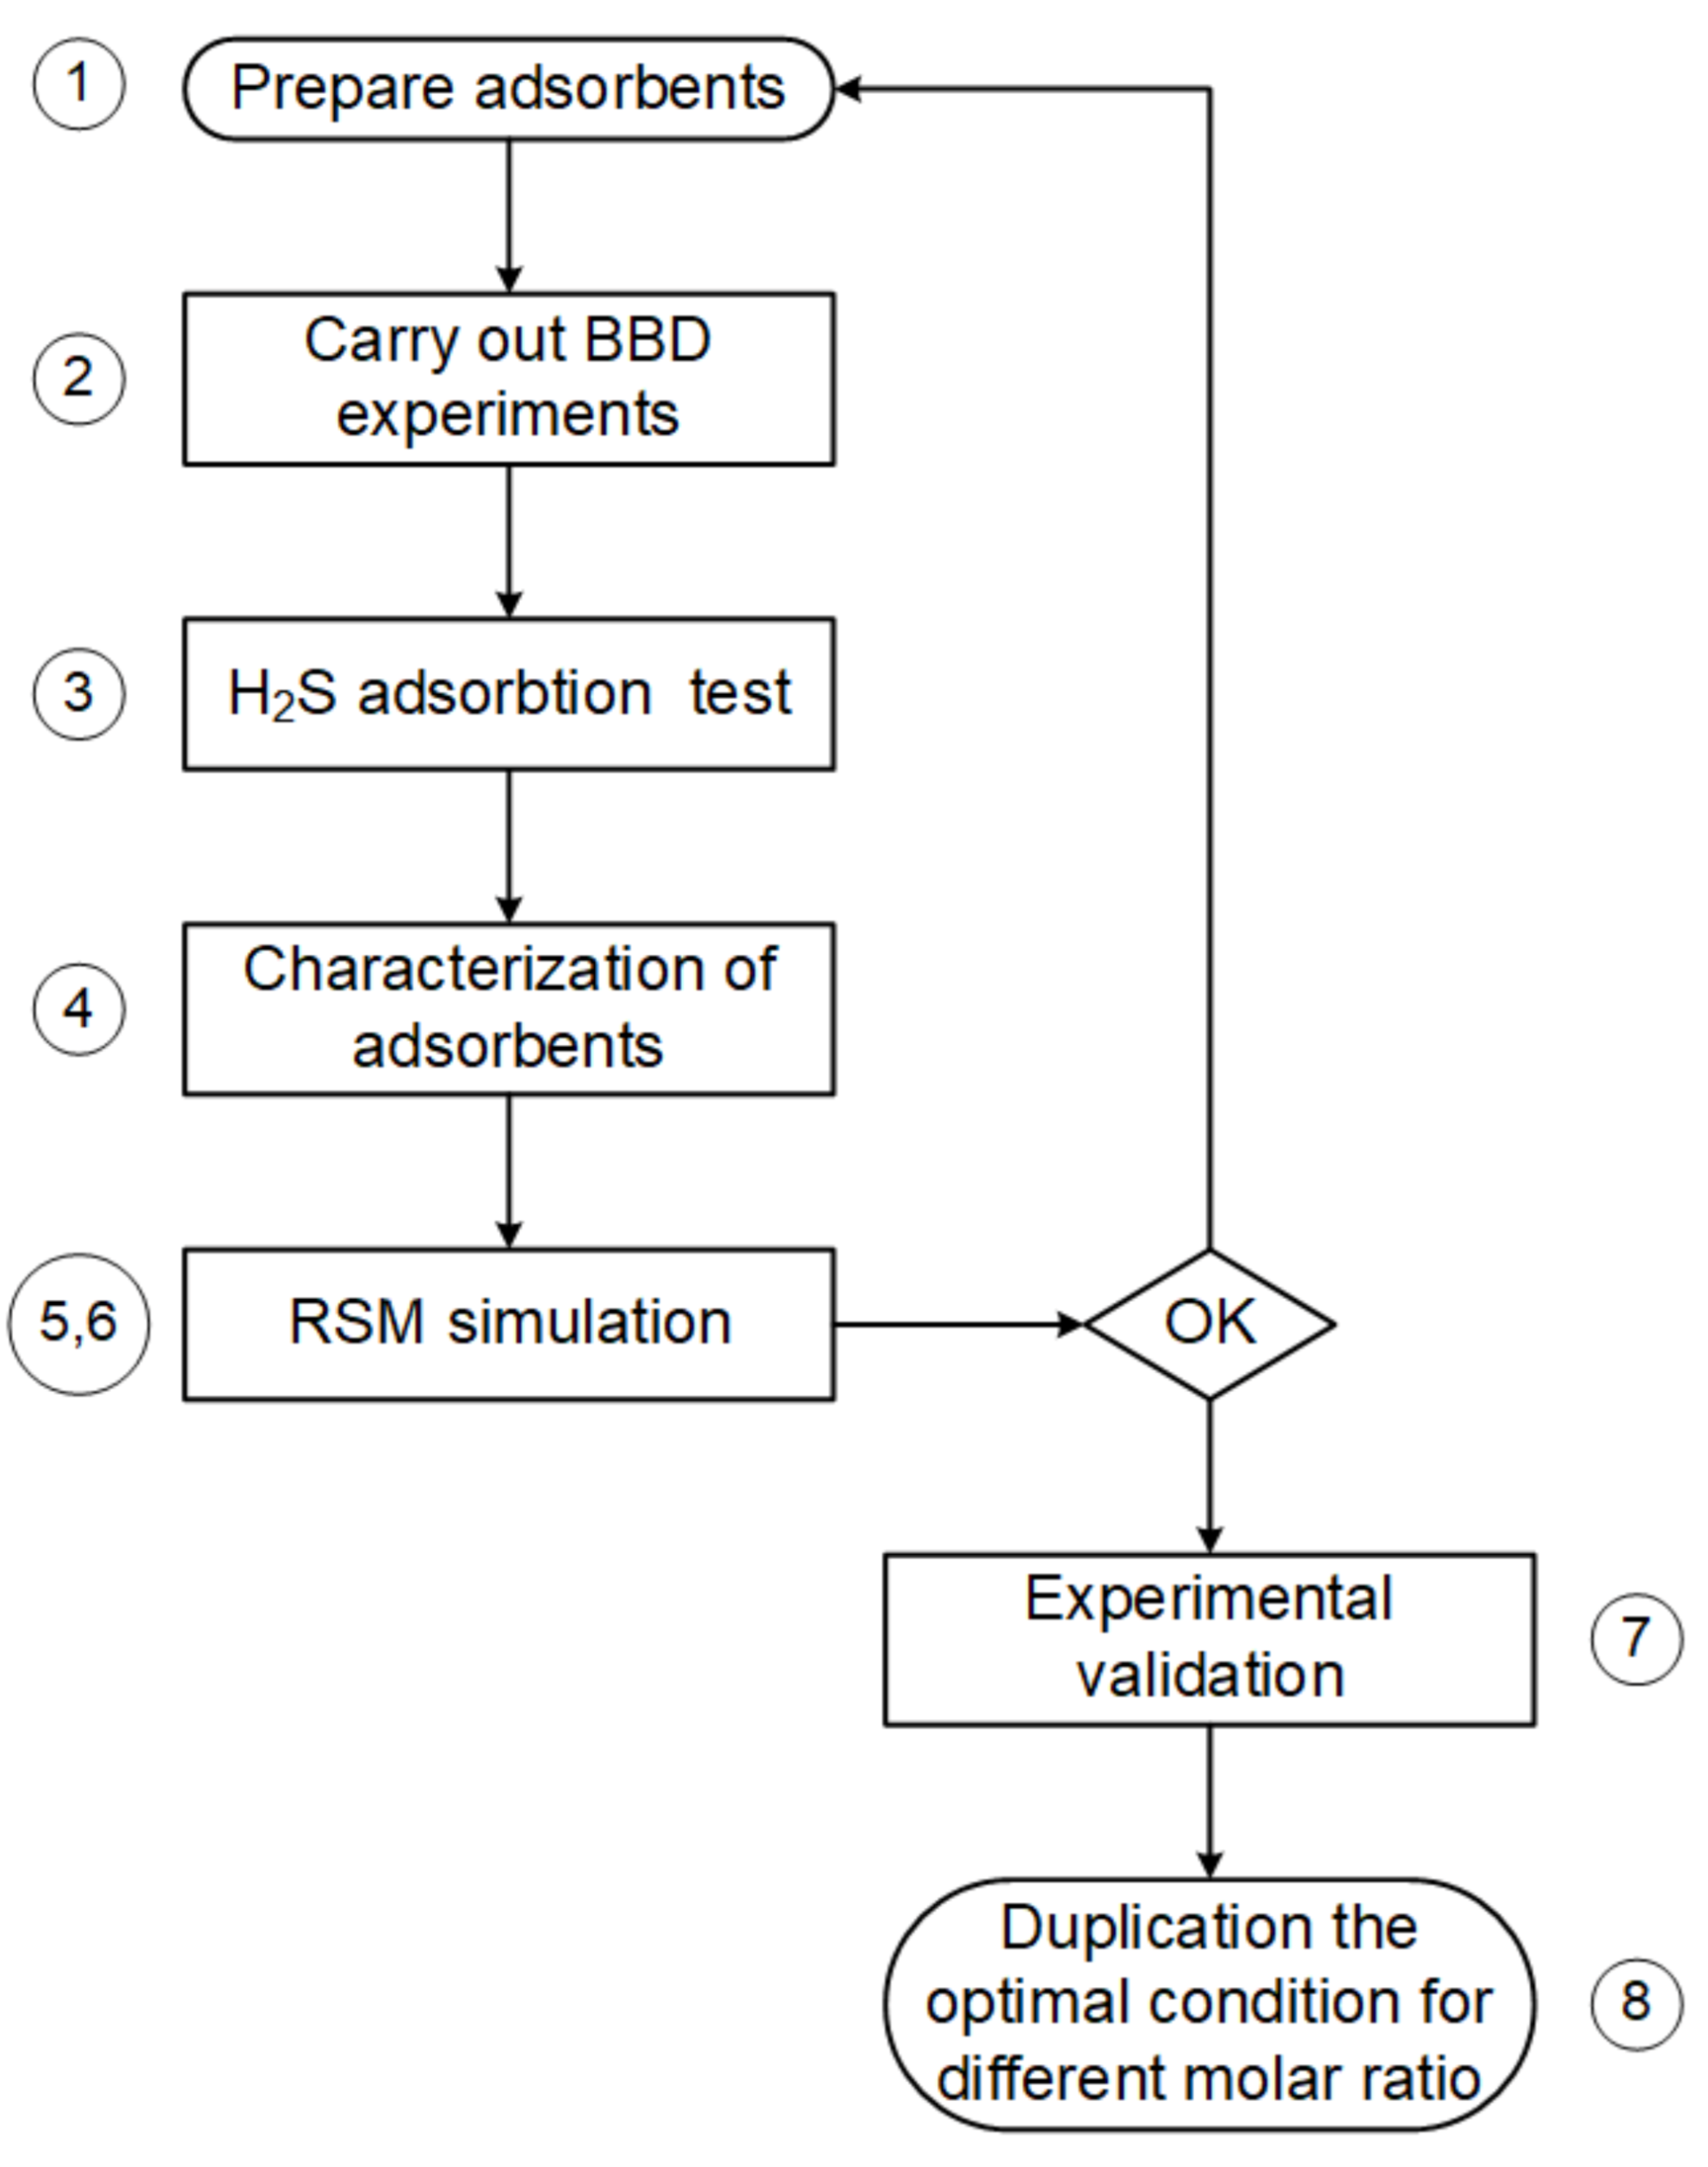
2.6. Steps for Process Parameter Optimization

The steps followed for process optimization are shown in the flow chart in Figure 2. In this optimization, the molarity, soaked period, and the soaked temperature of the adsorbents were entered as the explanatory variables and the optimal adsorption capacity with the BET surface area of the adsorbents as the response variable.
Step 1. CAC impregnated with ZnAc2 as suggested by the design tools.
Step 2. There were 17 run trials conducted, with the BBD matrix consisting of 12 different level combinations of the independent variables as well as three center point runs used to fit a second-order response surface and provide a measure of process stability and inherent variability [49]. The BBD design matrix along with the experimental values of the responses are shown in Table 2 (in terms of the coded factors).
Step 3. The adsorption capacity was calculated using an H2S adsorption test and was determined for each of the 17 runs of the adsorbents.
Step 4. The BET surface was determined for each of the 17 runs.
Step 5. RSM simulation, including second-order regression and analysis of variance (ANOVA), was conducted.
Step 6. The optimal conditions for the different molarities were traced on the basis of the contour and the surface plots of the RSM simulation.
Step 7. The simulation and experimental results were verified.
Step 8. The standard parameter conditions were duplicated for different molar ratios and impregnated materials.

3. Results and Discussion

3.1. Box–Behnken Model Evaluation

Based on Equation (3), with three main factors and five replications at the center point to reduce the magnitude of error (k = 3 and Co = 5), the runs were limited to 17, as detailed in Table 3. The obtained breakthrough curves for the three soaked periods, i.e., 30, 105, and 180 min, are presented in Figure 3a–c, respectively. The breakthrough curves are shown in three figures because of the large number of runs and for an easier understanding and interpretation of the obtained results. Thus, differences between the relative concentrations of the H2S curves of the runs could be understood more easily. To decide about the adequacy of the model for the H2S adsorption capacity, three different tests, namely the sequential model sum of squares, lack of fit test, and model summary statistics, were carried out in the present study. The data of the H2S adsorption capacity in this research were subjected to a regression analysis to estimate the effect of the process variables.
The results shown in Table 3 can be compared with those of a previous study by Zulkefli et al. [32]. On the basis of [32], the adsorption capacity and the BET surface area were obtained at 1.83 mg H2S/g and 656.75 m2/g, respectively, at 0.2 M of ZnAc2, soaked temperature of 65 °C, and soaked period of 30 min. Under similar conditions, the obtained values in this study were slightly different at 1.75 mg H2S/g and 692.65 m2/g for the adsorption capacity and the BET surface area, respectively, which was probably because of the differences in the preparation process. The decrease in the BET surface area in the adsorbent was caused by the blocking of some micropores with the chemical compound of ZnAc2. This characterization of the pore structure influenced the adsorption profiles [50,51]. In contrast, the data in Table 3 show similar trends to those reported by Nakamura et al. [52]. The BET surface area decreased with an increase in the ZnAc2 molarity, even though the BET surface area was slightly different for both cases because of the differences in the preparation conditions.

3.2. ANOVA

The results were analyzed using the analysis of variance (ANOVA), a regression model, coefficient of determination (R2), adjusted R2, coefficient of variation (CV), and statistical–diagnostic and response plots. The analysis of variance (ANOVA) test is a robust and common statistical method in different applications. The ANOVA provides a statistical procedure that determines whether the means of several groups are equal or not. The Fisher’s variance ratio, F-value, is used to test the significance of the model, individual variables, and their interactions [53,54]. Mean square (MSS) is the sum of squares divided by the degrees of freedom, for each source. The F-value is defined as MSSvariable/MSSresidual and shows the relative contribution of the sample variance to the residual variance [55]. If the ratio deviates increasingly from 1, the samples are not from the same population, with more confidence.
The results of the ANOVA based on experimental data are shown in Figure 4 and Table 4. The model summary statistics showed that the excluding cubic model was aliased and the 2FI model was found to have the maximum adjusted R2 values. Therefore, the 2FI model was chosen for further analysis.
Next, the ANOVA of the adsorption capacity of H2S is summarized in Table 5. If the calculated value of F is greater than that in the F table at a specified probability level, a statistically significant factor or interaction is obtained [56,57]. The F is defined as F = MSF/MSE, where MSF and MSE are the mean square of factors (interactions) and the mean square of errors, respectively. The ANOVA test revealed that the factors A, B, and C, and the interactions A × C and B × C proved to have a statistically significant effect on the H2S adsorption capacity. The F value is an indication of the level of significance. A higher F denotes a more significant effect on the response.
We can compare the F-value from the calculations with the F-value obtained from the F-distribution table with the degree of freedom (DF) from the model and the error to discern the significance and the adequacy of the model [48]. An effect is statistically significant if the calculated F-value for the effect is greater than the F-value extracted from the table at the desired probability level. On the basis of the calculated p-value (prob > F), all the three factors, namely molarity, soaked period, and soaked temperature, and their interaction effects were found to be significant (Table 4). The regression equation obtained after the variance analysis yielded the level of the H2S adsorption capacity. It included a linear relationship between all the main effects and the response. The final quadratic polynomial equations in terms of the coded and the actual variables are presented as follows:
Adsorption   capacity ,   Q coded = 1.50 0.40 x A + 0.16 x B + 0.11 x C + 0.13 x A x B 0.45 x A x C 0.34 x B x C
Adsorption   capacity ,   Q actual = 0.21 + 0.65 x A + 0.008 x B + 0.04 x C + 0.004 x A x B 0.03 x A x C 0.00013 x B x C
As seen in statistical studies, the values of prob > F below 0.05 signify that the model terms are significant. In this case, as shown in Table 5, models B and AC were significant with the value of prob > F of 0.05 and 0.03, respectively. The Fisher’s F-value and the probability value of the regression model were found to be 1.34 and 0.32, respectively. This implied that the terms in the model had a significant effect on the response. The tabular F-value with the degree of freedom, DFmodel = 6 and DFerror = 10, respectively, at the significance level of 0.05 (F0.05,(6,10) = 3.22) was higher than the calculated F-value (F0.05,(6,10) = 1.34), implied that most of the variation in the response could not be explained by the regression equation.
Then, the coefficient of determination, R2, indicated the overall predictive capability of the model. From Table 6, the R2 value of the model was determined to be 0.45. Therefore, we assumed that 45% of the total variations in the response can be explained by the model. However, this value of R2 did not necessarily imply that the regression model was a suitable one. A negative prediction R2 was defined as a better predictor of the H2S adsorption capacity response for the current model. In this case, an adequate R2 value of 4.40 was more than 4 as the ratio desirability, which indicated that the model navigated the design space. As was observed, the adjusted R2 was close to R2, emphasizing the high significance of the model. Another method to describe the variation of a model is to calculate the coefficient of variation (CV). While the values presented in Table 5 are not logically significant for the H2S adsorption capacity, the low value of the coefficient of variation (C.V.% = 40.14) might reflect the fact that this model could have high reliability and good fitness.
The response to the BET surface area also suggested the use of the 2FI model for further analysis through the ANOVA study based on the highest value obtained for the adjusted R2 (0.35). Meanwhile, the F value obtained was an indication of the model significance level. As presented in Table 7, the 2FI model had the highest F value (2.65) of the considered models. Moreover, the highest values of the adjusted R2 and the predicted R2 could be a reason for the suggestion of the use of the 2FI model for further analysis.
Based on the calculated p-value (prob > F), all the three factors and their interaction effects were found to be significant, as presented in Table 8. The regression equation obtained after the variance analysis provided the level for the BET surface area response. It also included a linear relationship between all the main effects and the response. The factors A, B, and C, and the interactions A × C and B × C proved to have statistically significant effects on the BET surface area. The final quadratic polynomial equations of the coded and the actual variables are presented in the equation below:
BET   surface   area   ( coded ) = 677.94 + 20.41 x A 73.97 x B 36.22 x C 11.63 x A x B + 115.38 x A x C 60.50 x B x C
BET   surface   area   ( actual ) = 957.86 443.97 x A + 0.74 x B 3.56 x C 0.39 x A x B + 8.24 x A x C 0.02 x B x C
The Fisher’s F-value and the very low probability value of the regression model were found to be 2.44 and 0.10, respectively. This implied that the terms in the model had a significant effect on the response. The tabular F-value with a degree of freedom, DFmodel = 6 and DFerror = 10, respectively, at the significance level of 0.05 (F0.05,(6,10) = 3.22) was higher than the calculated F-value (F0.05,(6,10) = 2.44), indicating that the variation in the response was not significant.
As shown in Table 9, the R2 value obtained was 0.59, which could be assumed to be 59% of the total variation in the BET surface area response. The coefficient of variation (CV) indicated a lower value than that of the H2S adsorption capacity response, which is 13.68% and had the highest chance for reliability and good fit of the model. The value of prediction R2 = 0.21 was in reasonable agreement with the adjusted R2 = 0.35. The adequate precision normally measures the signal-to-noise ratio. As shown in Table 9, the adequate precision marked at 5.10 and the ratios were more than 4, which indicated that the model was adequate for navigating the design space.

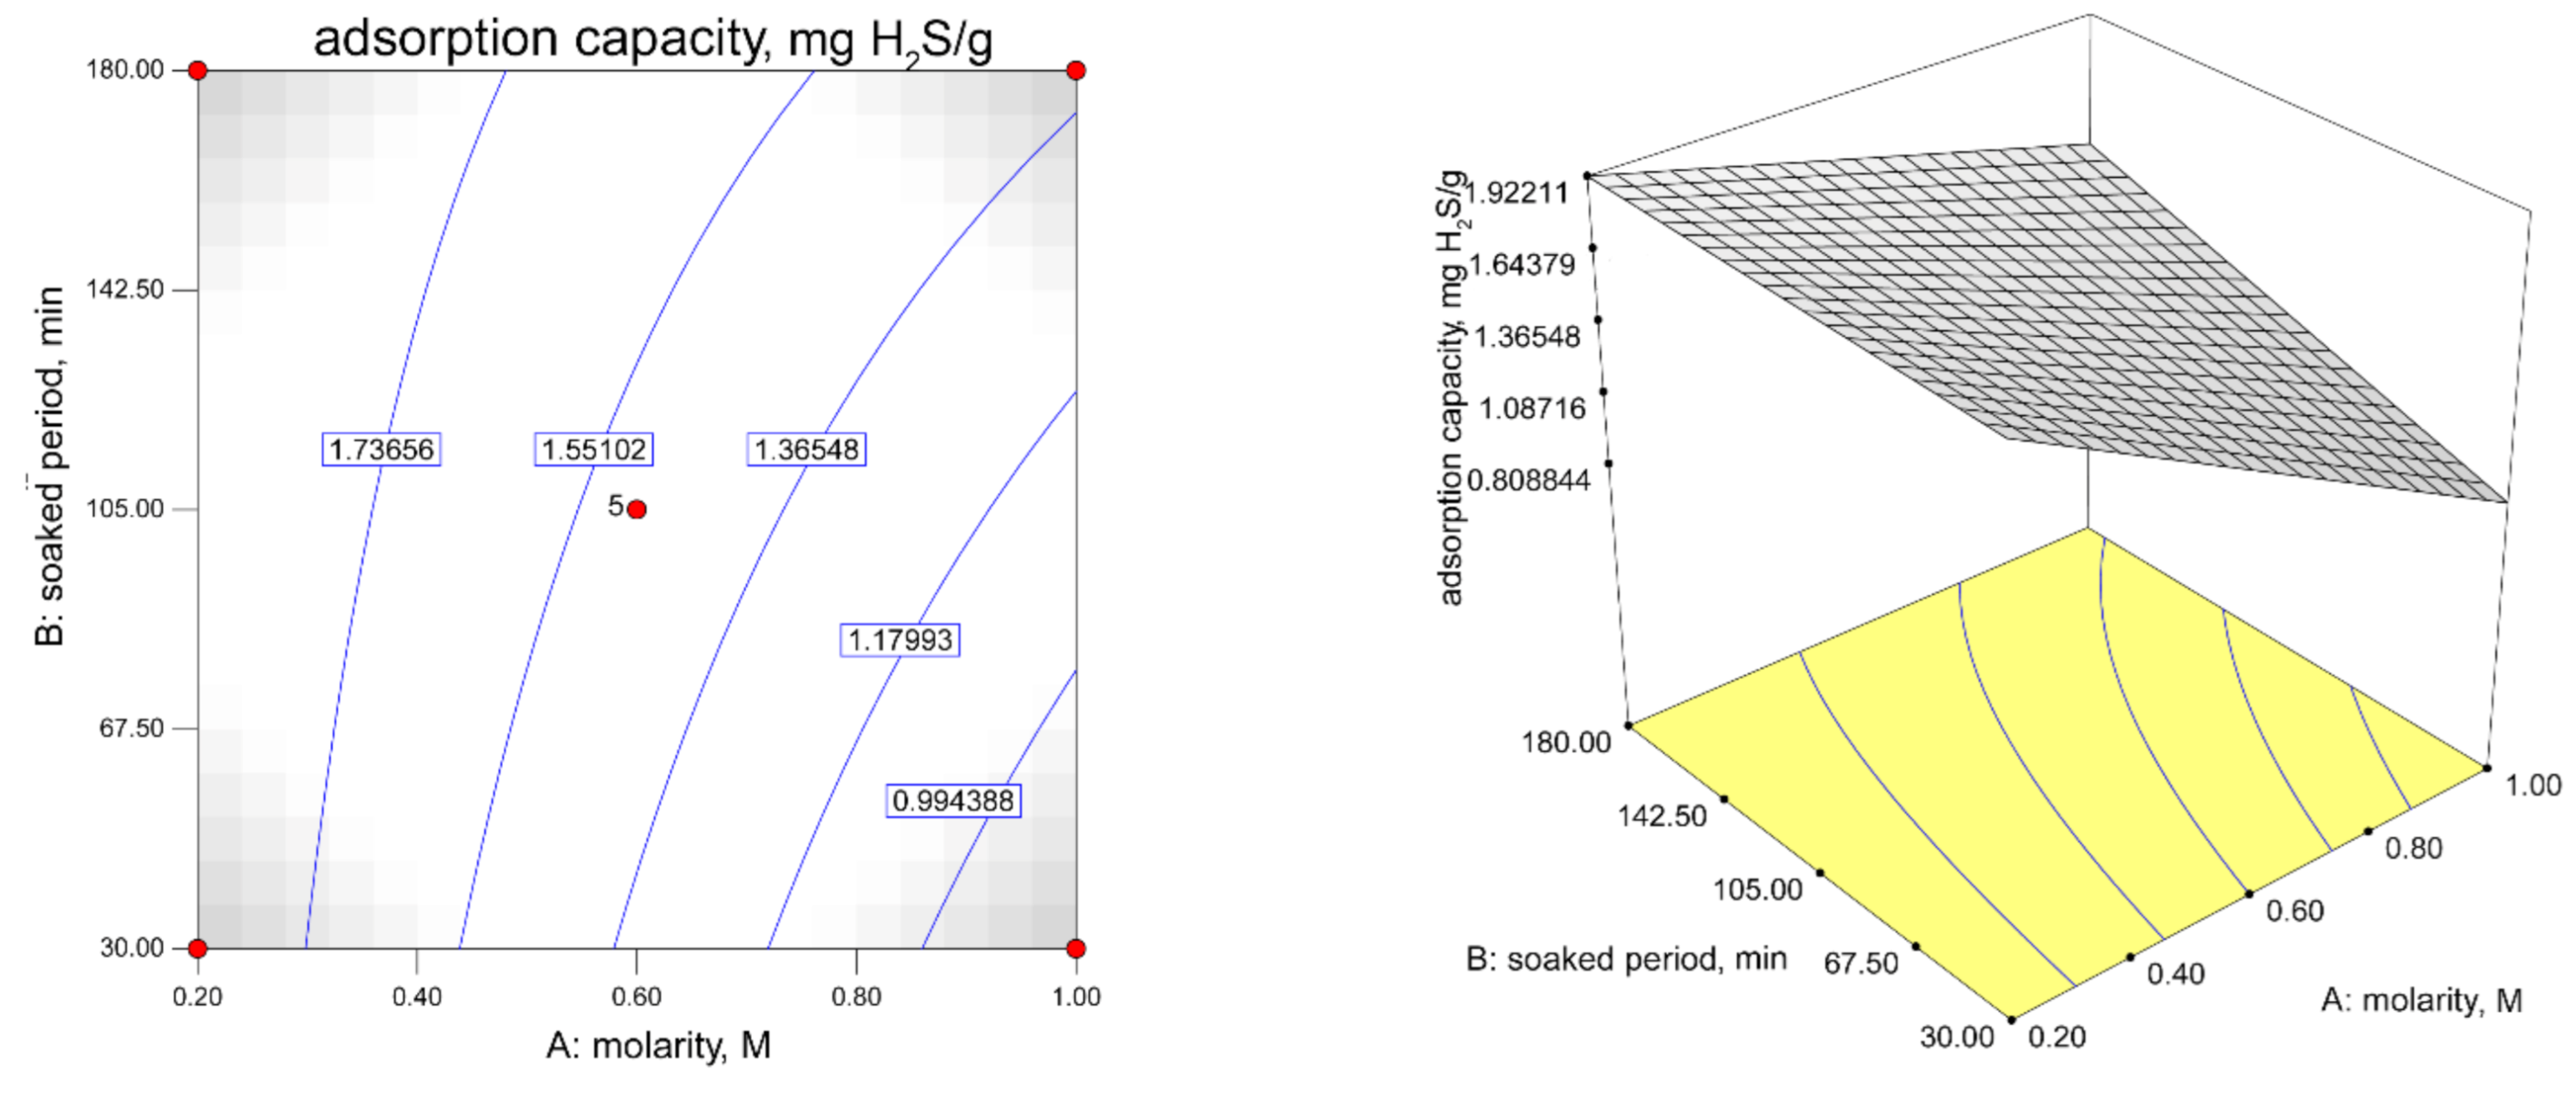
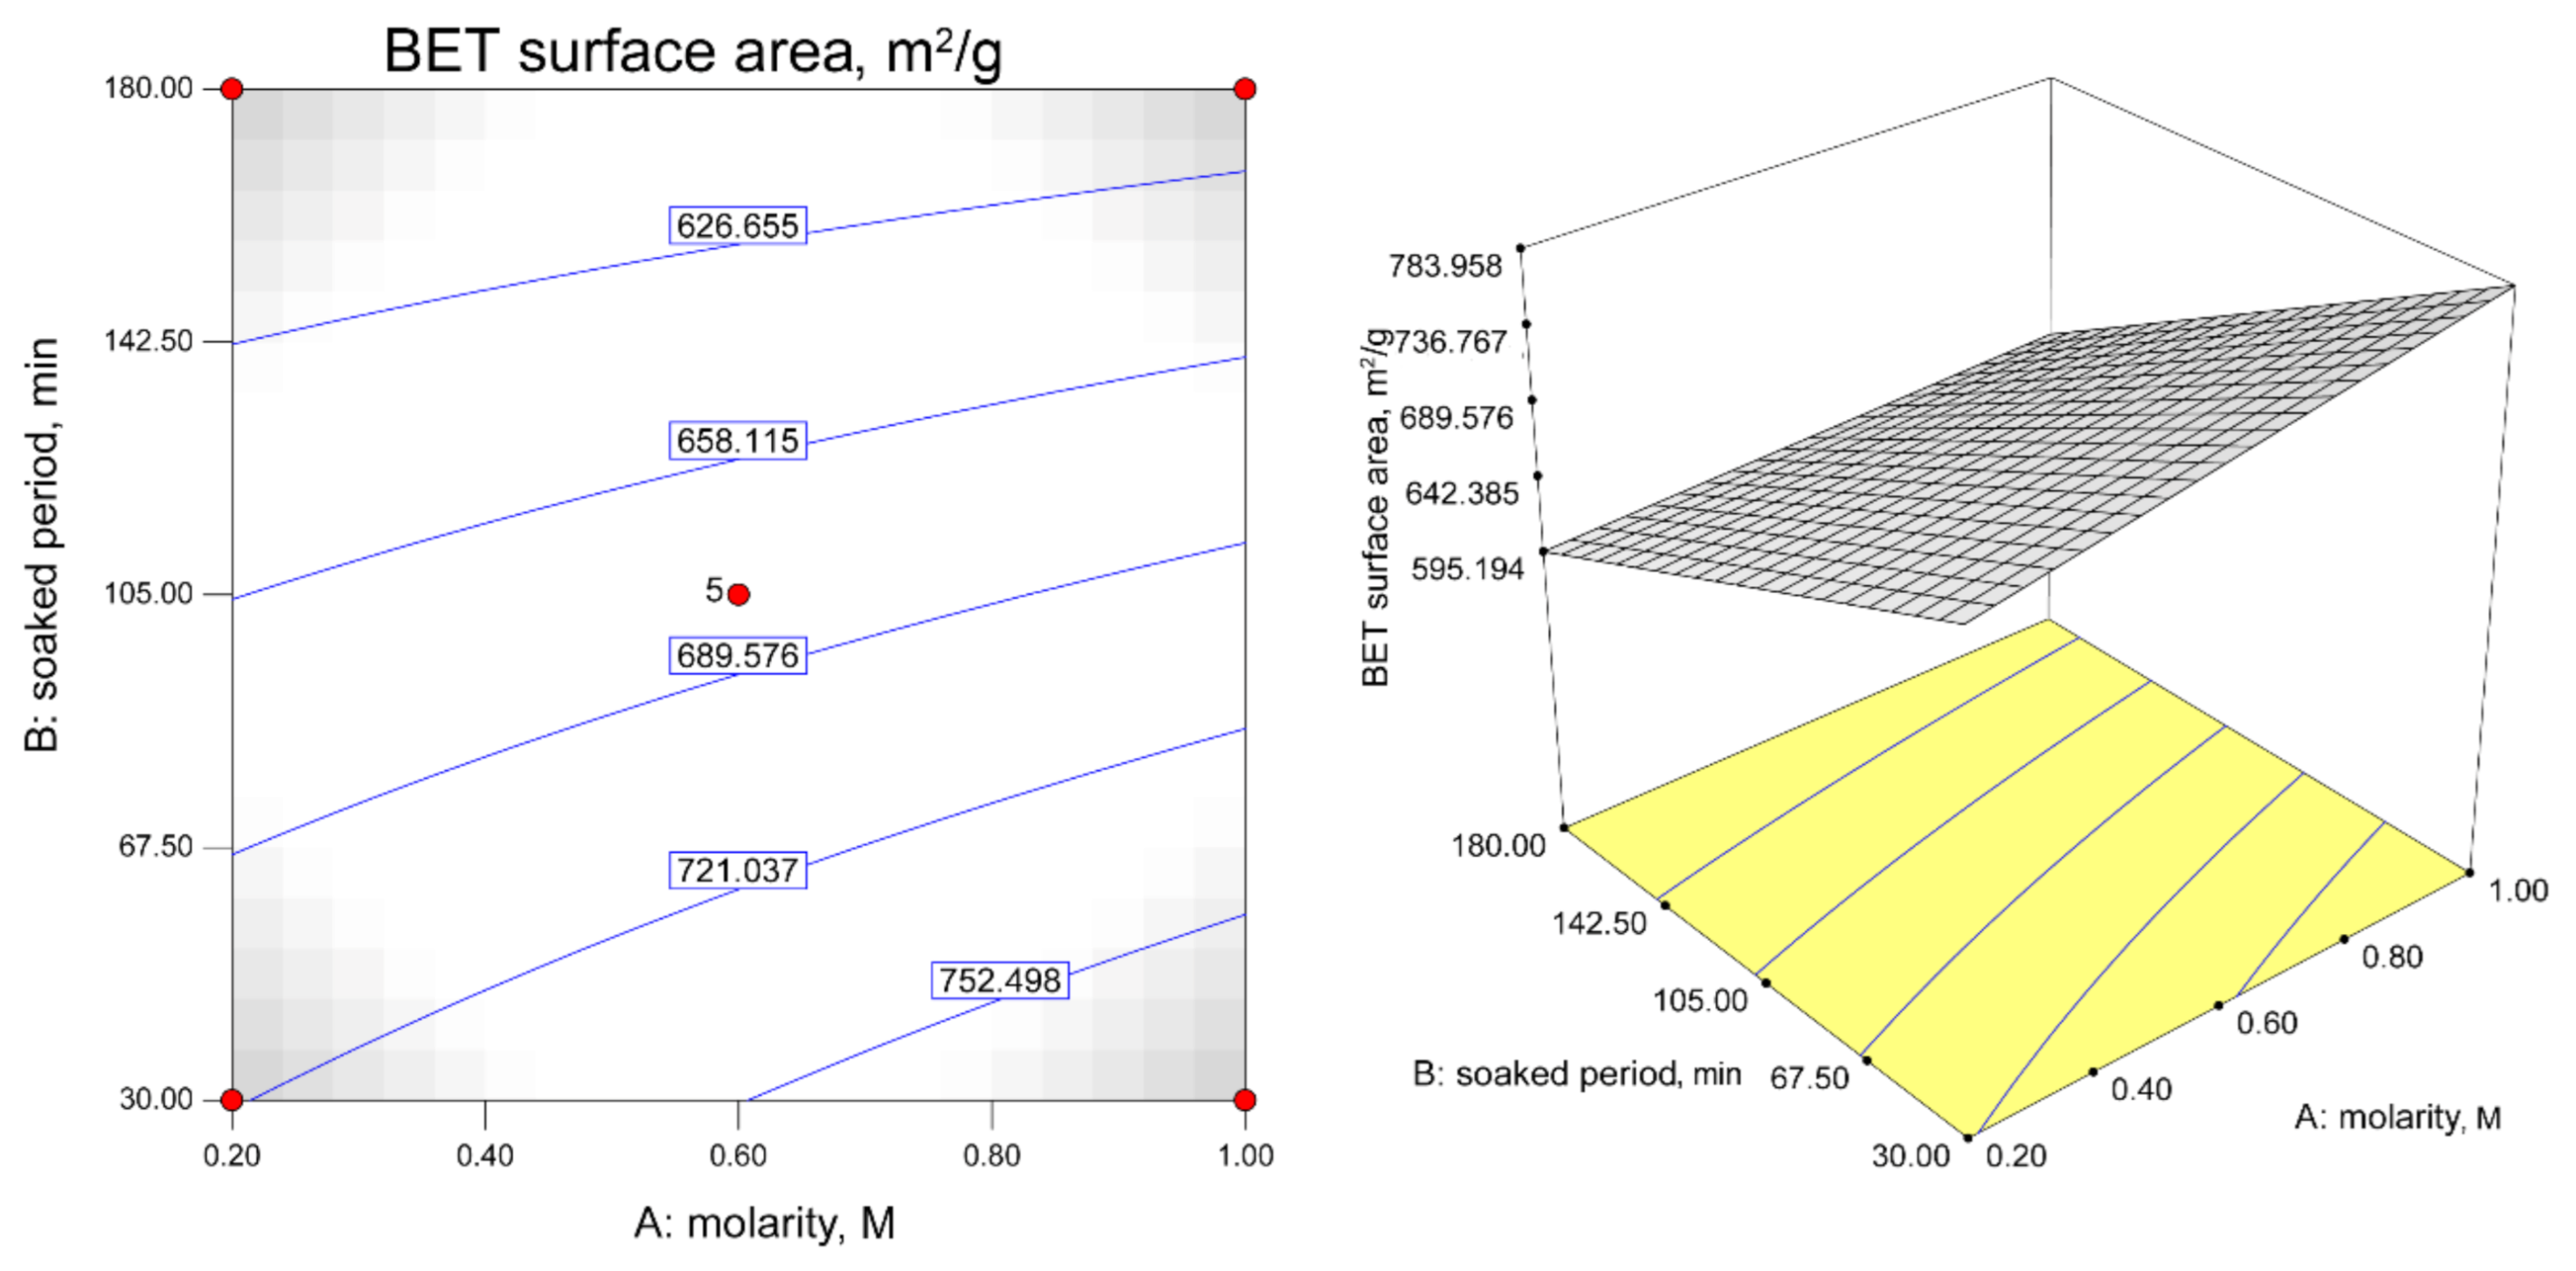
3.3. Contour Plots for H2S Adsorption Capacity and BET Surface Area Responses

Response surface plots and contour plots are useful for the model equation image and perceiving the nature of the response surface. These plots are also useful in the study of the effect of process variables on the H2S adsorption capacity and the BET surface area in a wider range of preparation conditions of the adsorbents. Furthermore, they can be used for designing the optimum conditions for adsorbent synthesis. Equations (5) and (7) were used to construct the contour plots for the H2S adsorption capacity and the BET surface area against the molarity, soaked period, and soaked temperature, as shown in Figure 5 and Figure 6. They depict the interaction of three main factors by keeping the other at its central level for two types of responses based on the refitted Equations (4) and (5) with the experimental data.
As shown in Figure 6, the constant soaked temperature shows the increments of the H2S adsorption capacity with an increase in the ZnAc2 molarity and the soaked period. The steepness of the increase in the H2S adsorption capacity ranged from 0.2 M to 1.0 M for the soaked period of 30 min to 180 min. Figure 6 shows the effect of the interaction of the factors with the constant soaked temperature on the BET surface area. The decreases in the molarity with the lowest soaked period resulted in the highest BET surface area of 721.04 m2/g, while at the lowest molarity (0.2 M) and a higher soaked period (>142.50 min), there was a reduction in the BET surface area.
Figure 7 presents the normal residual probability plot from the least squares fit, with both the predicted and the experimental data relatively similar to the straight line of 45° and the remaining points obeying the normal pattern of distribution. Hence, there was a high correlation and adequacy of the proposed model to predict the optimal conditions for preparing a highly efficient H2S adsorbent.

3.4. Optimization and Validation

The key goal of the optimization process was to identify the variable values at which the adsorption capacity of the H2S and the BET surface area were optimal. Consequently, the Behnken configuration box was used to evaluate the best operating mode. Figure 8 displays the proposed model, showing that the highest adsorption capacity was 2.52 mg H2S/g and the BET surface area was 620.55 m2/g at the optimum molarity of 0.22 M, soaked time of 48.82 min, and soaked temperature of 95.08 °C. The desirability factor was 1.0, as shown in Figure 9, which reflected the most favorable or perfect response value [58].
For a comparison that quantified the acceptability of the model, an experimental study on H2S adsorption was performed using the suggested optimum parameter conditions. The catalytic adsorbents were prepared using 350 g of CAC with a 0.22-M ZnAc2 solution by soaking the CAC for up to 49 min at 95 °C. The experimental and theoretical verification was carried out using two responses, namely the H2S adsorption capacity and the BET surface area, as shown in Figure 10.
The experimental data were collected through the synthesis of adsorbents based on the optimum parameter conditions as suggested at the end of BBD results. As a result, the adsorption capacity for H2S was 2.12 mg H2S/ g, whereas the theoretical data suggested a capacity of 2.52 mg H2S/g. Moreover, the experimental BET surface area was 649.56 m2/g, and the theoretical BET surface area was 620.55 m2/g. Then, the relative error between the experimental and the theoretical values was approximately 16.2% for the adsorption capacity and 4.7% for the BET surface area. Therefore, the results obtained were in the range of acceptance, as the adsorption capacity and BET surface area were closer at the optimum condition of the variable for both the experimental and the theoretical data.

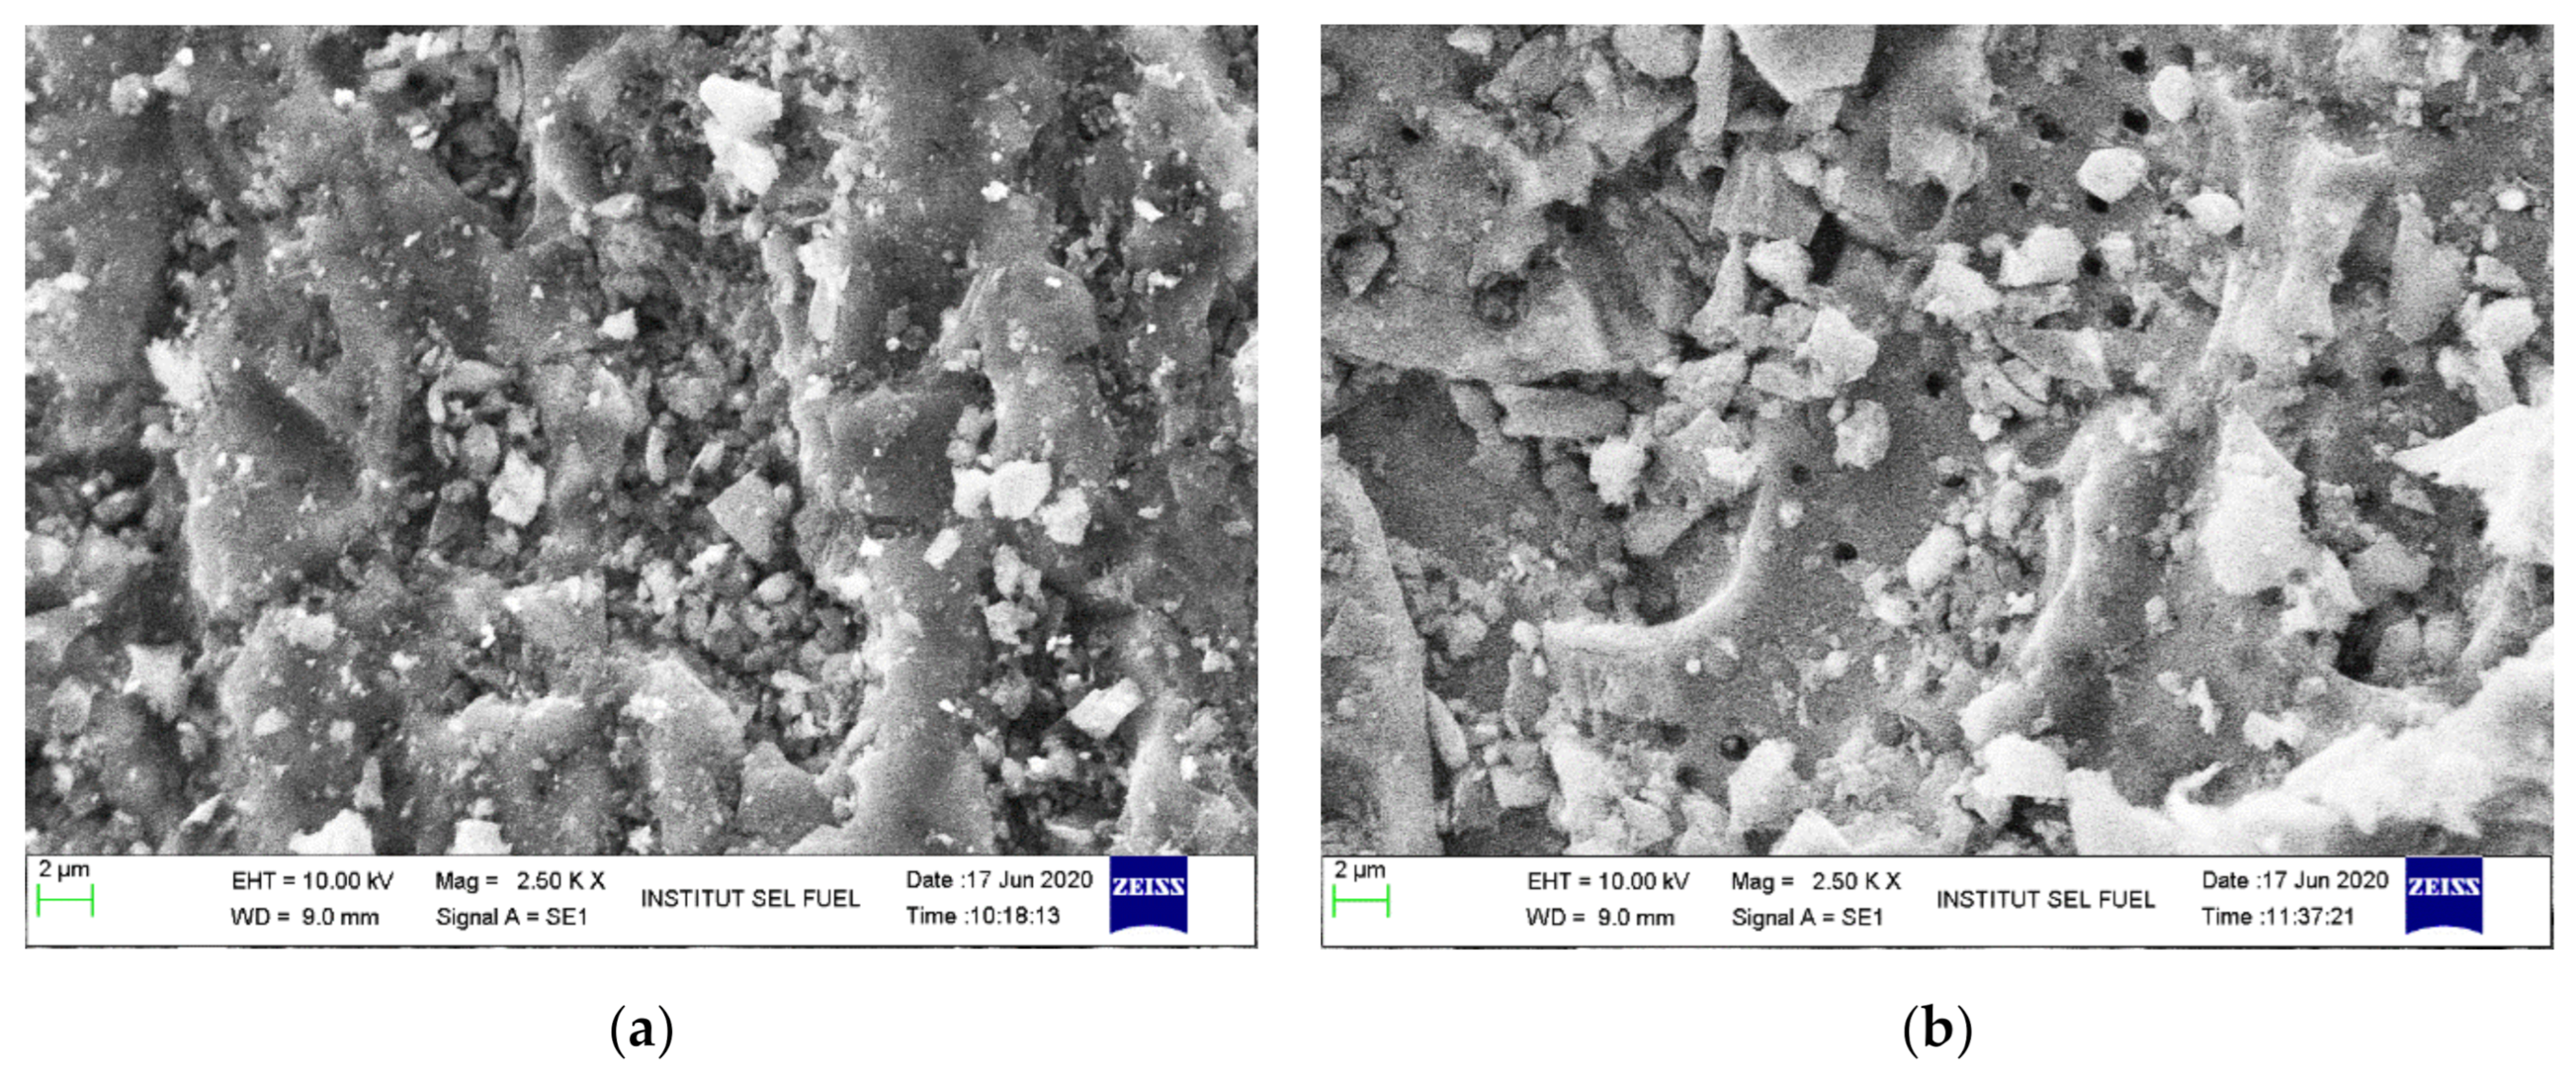
3.5. Adsorbent Characterization

Figure 11 presents the SEM images for the exhausted adsorbents for two types of adsorbents, namely the optimized (ZnAc2/CAC_O (E)) and the non-optimized (ZnAc2/CAC_N (E)) adsorbents. The optimized adsorbents were prepared under the optimum conditions from the Box–Behnken model suggestion. While the non-optimized adsorbents were prepared using a 0.2 M ZnAc2 solution with a soaked period of 30 min at 65 °C. Both sample syntheses were tested with a commercial mixed gas up to the exhausted point and analyzed. Next, the samples were assessed to visualize the details of the adsorbent properties in terms of the structural morphology images and the percentage of the elemental composition material presence on the adsorbent surface prepared.
Table 10 indicates the weight percentage (wt. percentage) of the element composition in a particular region of the optimized and non-optimized adsorbents for fresh (F), exhausted (E) and after desorption (D) compared to that fresh CAC (without impregnation). The EDX analysis was conducted on elements C, Ca, Na, K, Zn, O, and S (Table 10). The C content was different because of the composition of the volume of chemicals coated on a particular adsorbent surface. The presence of the Ca, Na, and K elements in the ZnAc2/CAC adsorbents normally observed on the activated carbon as similar data was obtained in a previous study by Zulkefli et al. [32] and Moradi et al. [48]. Meanwhile, the difference of concentration between ZnAc2 for optimized and non-optimized adsorbents were 0.22 M and 0.2 M, respectively, which is about 10% difference. For soaked time and soaked temperature, the difference was about 18.8 min and 30 °C, respectively. Based on these optimized conditions for optimized adsorbent, the Zn element increased about 80%. As a result, the ZnAc2/CAC_O (E) had a slightly higher S element by about 50% compared to that ZnAc2/CAC_N (E) at exhausted adsorbent as shown in Table 10. This could be due to the presence of higher Zn which can help to improve the interaction between adsorbent and H2S, and hence more H2S can be adsorbed than the non-optimized adsorbents.
In the case of the exhausted adsorbents, the adsorbents were purged through the process of the desorption of air and N2 gas, revealing the presence of sulfur (S) in the EDX analysis. The S element appeared on the surface for both optimized and non-optimized adsorbent as the H2S adsorb during adsorption process. Similar findings were reported by Isik-Gulsac et al. [59] because of the inclusion of the S element on the surface of the adsorbents. Based on Table 10, it indicated the increment of S element from the fresh (F) to the exhausted (E) adsorbents. After the desorption process, the S element decreased to almost similar composition with the fresh adsorbent as indicated the physisorption occurred during the adsorption process.
Meanwhile, based on Table 10, the higher presence of the element composition of O on the adsorbent was obtained for optimized adsorbent which could be due to the increment of molarity of ZnAc2. Based on Rodriguez et al., the composition of O normally had electrostatic interactions between the dipole of H2S, and the ionic field generated by the charges in O might play a secondary role in accelerating and improving the adsorption process [60]. Hence, it would enhance the capability of the adsorbent to adsorb the H2S gas as shown in the higher S element for optimized adsorbent in Table 10. Moreover, the presence of moisture and oxygen might affect the adsorption capacity of the activated carbons, and numerous studies have investigated their impact on the H2S uptake. The presence of oxygen also increased the breakthrough time of H2S adsorption for the latter adsorbents [61,62,63].
As shown in Table 11, the analysis of the BET surface area was conducted for the ZnAc2/CAC_O and ZnAc2/CAC_N adsorbents. In order to determine the specific surface area and the pore size distribution, an analysis was carried out of the N2 adsorption/desorption for the fresh and the exhausted samples denoted as ZnAc2/CAC_O (F), ZnAc2/CAC_N (F), ZnAc2/CAC_O (E), and ZnAc2/CAC_N (E). The surface area was calculated using a BET isotherm calculation, while the pore volume and the average pore volume were calculated at P/Po of 0.98 through the N2 adsorption isotherm. The pores included all the micropore, mesopore, and macropore volumes.
Upon the adsorption–desorption of H2S, the BET surface area was influenced by the impregnation of ZnAc2 as chemical compound in CAC and the presence of H2S and its elements on the adsorbent which cause pores blocking by the H2S components as previously observed [32]. The optimized adsorbents (ZnAc2/CAC_O) showed a slightly lower BET surface area than the non-optimized adsorbents (ZnAc2/CAC_N) because of the different parameter conditions for the prepared catalytic adsorbents. It is suggested the decrease in the BET surface area could be due to the increase of ZnAc2 molarity used, hence blocking of some micropores on the adsorbent as mentioned previously. The exhausted adsorbents also showed a decrease in the BET surface area, total pore volume, volume ratio, and pore size, as a result of the interaction of H2S with adsorbents which cause a blocking of the pores.

3.6. Performance of Adsorption–Desorption Cycle

The performance of the adsorbents was investigated through the adsorption degradation in the adsorption–desorption regeneration cycle. As ZnAc2 composited as a catalyst on the adsorbents’ surfaces was synthesis and observed the adsorption capacity performance through adsorption–desorption regeneration cycle. The adsorption capacity was calculated using the adsorption breakthrough time with the concentration change known as the mass transfer zone through downwards within the bed till further away from the inlet stream.
The H2S adsorption capacity was compared between the optimized and the non-optimized adsorbents in order to observe the adsorbents’ performance, as illustrated in Table 12 and Figure 12. Thus, the optimized adsorbents (ZnAc2/CAC_O) showed excellent performance based on the adsorption capacity, which was higher than that of the non-optimized adsorbents (ZnAc2/CAC_N) with an adsorption capacity difference of 49.3%. However, the performance of the optimized and the non-optimized adsorbents exhibited a degradation of up to 16% and 23% in the adsorption capacity throughout the regeneration cycle.
In actual operation, the impregnation of activated carbon could involve physisorption and chemisorption which are both important for accelerating the adsorption process through physical forces or to catalyze the oxidation. Since the chemisorption probably can happen during the adsorption process, the degradation of the adsorbent could occur [64]. However, in this study, the adsorbent can still be regenerated in several adsorption–desorption cycles as shown in the capability of the adsorbent to adsorb the H2S in the following cycles as shown in Figure 12. As discussed in a previous study, the presence of S elements throughout H2S adsorption–desorption cycle can effectively remove the S elements on the adsorbent’s surface up to 98% [30]. In this study, based on previous EDX analysis as shown in Table 10, after the desorption process, the S element decreased to almost similar composition with the fresh adsorbent as indicated the physisorption occurred during adsorption process as mentioned previously. However, there are slightly remaining S elements (as compared to the fresh adsorbent) which could be due to insufficient desorption process, i.e., non-optimized conditions for the desorption process, and probably due to complex mechanisms that happen during H2S adsorption-desorption process. Hence, it probably could lead to a degradation of the H2S adsorption capabilities for the following cycle of adsorption–desorption [62] as shown in Table 12 and Figure 12.
However, the degradation was low in each cycle, and the H2S adsorption capacity could be enhanced by using a different desorption method in future works. Therefore, as proven by the previous characterization study, the performance of the optimized adsorbents improved the capabilities of the adsorbents as compared to the non-optimized adsorbents.

4. Conclusions

The performance of catalytic adsorbents for H2S captured using the adsorption technique was examined through the impregnation of ZnAc2 on the activated carbon surfaces. The optimization was carried out using RSM and the Box–Behnken experimental design to determine the optimum conditions for the adsorbent synthesis. Several factors and levels were evaluated, including the ZnAc2 molarity, soaked period, and soaked temperature, along with the response of the H2S adsorption capacity and the BET surface area. From the statistical analysis, the optimum points for ZnAc2 molarity, soaked period, and soaked temperature were obtained as 0.22 M, 48.82 min, and 95.08 °C, respectively. Furthermore, the optimized adsorbents (ZnAc2/CAC_O) improved the adsorbent efficiency by up to 49% of the adsorption capacity as compared to the non-optimized adsorbents (ZnAc2/CAC_N). The optimized ZnAc2 as the active catalyst dispersed onto the microporous materials of the activated carbon and improve the interaction of H2S on adsorbent during the adsorption process. It was observed that the S element increase with the exhausted adsorbent from fresh adsorbent and the S element of optimized adsorbent was higher compared to that non-optimized. Based on the adsorption–desorption cycle, it was revealed the adsorbent slightly degraded by referring the calculated H2S adsorption capacity up to 16% and 23% for optimized and non-optimized adsorbents, respectively throughout the cycles. It is suggested the degradation could be due to insufficient desorption process, i.e., non-optimized conditions, and probably due to complex mechanisms that happen during the adsorption–desorption process. Hence, comprehensive studies are required in the future to analyze the adsorbent degradation by optimizing the conditions of the desorption process and analyze the mechanism of adsorption-desorption of H2S on the adsorbent.

Author Contributions

For research articles with several authors, the following statements should be used Conceptualization, N.N.Z. and M.S.M.; methodology, N.N.Z. and M.S.M.; software, N.N.Z. and S.N.H.A.B.; validation, M.S.M., H.A.H., and W.N.R.W.I.; formal analysis, N.N.Z., M.S.M. and N.M.S.; investigation N.N.Z.; resources, N.N.Z. and M.S.M.; data curation, N.N.Z. and M.S.M.; writing—original draft preparation, N.N.Z.; writing—review and editing, M.S.M., H.A.H., and W.N.R.W.I.; visualization, N.N.Z. and M.S.M.; supervision, M.S.M., H.A.H., and W.N.R.W.I.; project administration, M.S.M.; funding acquisition, M.S.M. All authors have read and agreed to the published version of the manuscript.

Funding

This research was funded by Ministry of Higher Education, Malaysia, grant number FRGS/1/2020/TK0/UKM/02/4 and Universiti Kebangsaan Malaysia, grant numbers GUP-2018-042 & PP-FKAB-2021.

Institutional Review Board Statement

Not applicable.

Informed Consent Statement

Not applicable.

Data Availability Statement

All relevant data are contained in the present manuscript. Other inherent data are available on request from the corresponding author.

Acknowledgments

This research was supported by the Ministry of Higher Education, Malaysia under research code FRGS/1/2020/TK0/UKM/02/4 and Universiti Kebangsaan Malaysia under research code GUP-2018-042 & PP-FKAB-2021.

Conflicts of Interest

The authors declare no conflict of interest.

Nomenclature List

χ i Encoded value of an independent variable
x i Actual value of an independent variable
x 0 Actual value of a center point’s independent variable
Δ x Phase shift value of an independent variable
YResponse variable
α 0 Model constant
α i Linear coefficient
α i i Quadratic coefficient
α i j Interaction coefficient
ε Statistical error
NNumber of runs
kNumber of variables
CNNumber of center points
MSSMean square
MSFMean square of factors (interactions)
MSEMean square of errors
AMolarity
BSoaked period
CSoaked temperature
QAdsorption capacity, mg H2S/g
R2Coefficient of determination
DFDegree of freedom
ProbProbability
PRESSPredicted residual error sum of squares
C.VCoefficient variation
F-valueFisher’s variance ratio
Prob > FProbability value
COutlet concentration
COInlet concentration
BETBrunauer–Emmett–Teller
SEMScanning electron microscopy
EDXEnergy dispersive X-ray analysis
CACCommercial coconut activated carbon
ACActivated carbon

References

  1. Sitthikhankaew, R.; Chadwick, D.; Assabumrungrat, S.; Laosiripojana, N. Effect of KI and KOH Impregnations over Activated Carbon on H2S Adsorption Performance at Low and High Temperatures. Sep. Sci. Technol. 2014, 49, 354–366. [Google Scholar] [CrossRef]
  2. Cornejo, C.; Wilkie, A.C. Greenhouse gas emissions and biogas potential from livestock in Ecuador. Energy Sustain. Dev. 2010, 14, 256–266. [Google Scholar] [CrossRef]
  3. Wongsapai, W.; Thienburanathum, P.; Rerkkriengkrai, P. Biogas situation and development in Thai Swine Farm. Renew. Energy Power Qual. J. 2008, 1, 222–226. [Google Scholar] [CrossRef]
  4. Tippayawong, N.; Promwungkwa, A.; Rerkkriangkrai, P. Long-term operation of a small biogas/diesel dual-fuel engine for on-farm electricity generation. Biosyst. Eng. 2007, 98, 26–32. [Google Scholar] [CrossRef]
  5. Tippayawong, N.; Thanompongchart, P. Biogas quality upgrade by simultaneous removal of CO2 and H2S in a packed column reactor. Energy 2010, 35, 4531–4535. [Google Scholar] [CrossRef]
  6. Arthur, R.; Baidoo, M.F.; Antwi, E. Biogas as a potential renewable energy source: A Ghanaian case study. Renew. Energy 2011, 36, 1510–1516. [Google Scholar] [CrossRef]
  7. Angelidaki, I.; Ellegaard, L.; Ahring, B.K. Applications of The Anaerobic Digestion Process. Adv. Biochem. Eng. BioTechnol. 2003, 82, 1–33. [Google Scholar]
  8. Balsamo, M.; Cimino, S.; de Falco, G.; Erto, A.; Lisi, L. ZnO-CuO Supported on Activated Carbon for H2S Removal at Room Temperature. Chem. Eng. J. 2016, 304, 399–407. [Google Scholar] [CrossRef]
  9. Siriwardane, I.W.; Udangawa, R.; de Silva, R.M.; Kumarasinghe, A.R.; Acres, R.G.; Hettiarachchi, A.; de Silva, K.M.N. Synthesis and Characterization of Nano Magnesium Oxide Impregnated Granular Activated Carbon Composite for H2S Removal Applications. Mater. Des. 2017, 136, 127–136. [Google Scholar] [CrossRef]
  10. Crisci, A.G.D.; Moniri, A.; Xu, Y. Hydrogen from hydrogen sulfide: Towards a more sustainable hydrogen economy. Int. J. Hydrog. Energy 2019, 44, 1299–1327. [Google Scholar] [CrossRef]
  11. Zulkefli, N.N.; Masdar, M.S.; Jahim, J.; Harianto, E.H. Overview of H2S Removal Technologies from Biogas Production. Int. J. Appl. Eng. Res. 2016, 11, 10060–10066. [Google Scholar]
  12. Palma, V.; Vaiano, V.; Barba, D.; Colozzi, M.; Palo, E.; Barbato, L.; Cortese, S. H2S Oxidative Decomposition for The Sim-ultaneous Production of Sulphur and Hydrogen. Chem. Eng. Trans. 2016, 52, 1201–1206. [Google Scholar]
  13. Bandosz, T.J. On the Adsorption/Oxidation of Hydrogen Sulfide on Activated Carbons at Ambient Temperatures. J. Colloid Interface Sci. 2002, 246, 1–20. [Google Scholar] [CrossRef]
  14. Sisani, E.; Cinti, G.; Discepoli, G.; Penchini, D.; Desideri, U.; Marmottini, F. Adsorptive Removal of H2S In Biogas Conditions for High Temperature Fuel Cell Systems. Int. J. Hydrog. Energy 2014, 39, 21753–21766. [Google Scholar] [CrossRef]
  15. Mescia, D.; Hernández, S.; Conoci, A.; Russo, N. MSW landfill biogas desulfurization. Int. J. Hydrog. Energy 2011, 36, 7884–7890. [Google Scholar] [CrossRef]
  16. Bamdad, H.; Hawboldt, K.; MacQuarrie, S. A review on common adsorbents for acid gases removal: Focus on biochar. Renew. Sustain. Energy Rev. 2018, 81, 1705–1720. [Google Scholar] [CrossRef]
  17. Khabazipour, M.; Mansoor, A. Removal of Hydrogen Sulfide from Gas Streams Using Porous Materials: A Review. Ind. Eng. Chem. Res. 2019, 58, 22133–22164. [Google Scholar] [CrossRef]
  18. Sing, K.S.W.; Rouquerol, J.; Rouquerol, F. Adsorption by Powders and Porous Solids; Academic Press: San Diego, CA, USA, 1998. [Google Scholar]
  19. Galuszka, J.; Iaquaniello, G.; Ciambelli, P.; Palma, V.; Brancaccio, E. Membrane-Assisted Catalytic Cracking of Hydrogen Sulphide (H2S). In Membrane Reactors for Hydrogen Production Processes; Springer: London, UK, 2011; pp. 161–182. [Google Scholar]
  20. Basile, A.; De Falco, M.; Centi, G.; Iaquaniello, G. Membrane Reactor Engineering: Applications for a Greener Process Industry; John Wiley & Sons: Hoboken, NJ, USA, 2016; p. 344. [Google Scholar]
  21. Papurello, D.; Tomasi, L.; Silvestri, S.; Santarelli, M. Evaluation of the Wheeler-Jonas parameters for biogas trace compounds removal with activated carbons. Fuel Process. Technol. 2016, 152, 93–101. [Google Scholar] [CrossRef]
  22. Pelaez-Samaniego, M.R.; Perez, J.F.; Ayiania, M.; Garcia-Perez, T. Chars from wood gasification for removing H2S from biogas. Biomass Bioenergy 2020, 142, 105754. [Google Scholar] [CrossRef]
  23. Surra, E.; Nogueira, M.C.; Bernardo, M.; Lapa, N.; Esteves, I.; Fonseca, I. New adsorbents from maize cob wastes and anaerobic digestate for H2S removal from biogas. Waste Manag. 2019, 94, 136–145. [Google Scholar] [CrossRef]
  24. Shah, M.S.; Tsapatsis, M.; Siepmann, J.I. Hydrogen Sulfide Capture: From Absorption in Polar Liquids to Oxide, Zeolite, and Metal–Organic Framework Adsorbents and Membranes. Chem. Rev. 2017, 117, 9755–9803. [Google Scholar] [CrossRef] [PubMed]
  25. Ozekmekci, M.; Salkic, G.; Fellah, M.F. Use of zeolites for the removal of H2S: A mini-review. Fuel Process. Technol. 2015, 139, 49–60. [Google Scholar] [CrossRef]
  26. Kerr, G.T.; Johnson, G.C. Catalytic Oxidation of Hydrogen Sulfide to Sulfur Over A Crystalline Aluminosilicate. J. Phys. Chem. 1960, 64, 381–382. [Google Scholar] [CrossRef]
  27. Steijns, M.; Derks, F.; Verloop, A.; Mars, P. ChemInform Abstract: The Mechanism of the Catalytic Oxidation of Hydrogen Sulfide. II. Kinetics and Mechanism of Hydrogen Sulfide Oxidation Catalyzed by Sulfur. Chem. Inf. 1976, 7, 87–95. [Google Scholar] [CrossRef]
  28. Bashkova, S.; Baker, F.S.; Wu, X.; Armstrong, T.R.; Schwartz, V. Activated carbon catalyst for selective oxidation of hydrogen sulphide: On the influence of pore structure, surface characteristics, and catalytically-active nitrogen. Carbon 2007, 45, 1354–1363. [Google Scholar] [CrossRef]
  29. Micoli, L.; Bagnasco, G.; Turco, M. H2S removal from biogas for fuelling MCFCs: New adsorbing materials. Int. J. Hydrog. Energy 2014, 39, 1783–1787. [Google Scholar] [CrossRef]
  30. Phooratsamee, W.; Hussaro, K.; Teekasap, S.; Hirunlabh, J. Increasing Adsorption of Activated Carbon from Palm Oil Shell for Adsorb H2S From Biogas Production by Impregnation. Am. J. Environ. Sci. 2014, 10, 431–445. [Google Scholar] [CrossRef] [Green Version]
  31. Yusuf, N.Y.M.; Masdar, M.S.; Isahak, W.N.R.W.; Nordin, D.; Husaini, T.; Majlan, E.H.; Wu, S.Y.; Rejab, S.A.M.; Lye, C.C. Impregnated carbon–ionic liquid as innovative adsorbent for H2/CO2 separation from biohydrogen. Int. J. Hydrog. Energy 2019, 44, 3414–3424. [Google Scholar] [CrossRef]
  32. Zulkefli, N.N.; Masdar, M.S.; Isahak, W.N.R.W.; Jahim, J.M.; Rejab, S.A.M.; Lye, C.C. Removal of hydrogen sulfide from a biogas mimic by using impregnated activated carbon adsorbent. PLoS ONE 2019, 14, e0211713. [Google Scholar] [CrossRef] [Green Version]
  33. Sidek, M.Z.; Cheah, Y.J.; Zulkefli, N.N.; Yusuf, N.M.; Isahak, W.N.R.W.; Sitanggang, R.; Masdar, M.S. Effect of impregnated activated carbon on carbon dioxide adsorption performance for biohydrogen purification. Mater. Res. Express 2018, 6, 015510. [Google Scholar] [CrossRef]
  34. Feng, Y.; Dou, J.; Tahmasebi, A.; Xu, J.; Li, X.; Yu, J.; Yin, F. Regeneration of Fe–Zn–Cu Sorbents Supported on Activated Lignite Char for the Desulfurization of Coke Oven Gas. Energy Fuels 2015, 29, 7124–7134. [Google Scholar] [CrossRef]
  35. Georgiadis, A.G.; Charisiou, N.D.; Goula, M.A. Removal of hydrogen sulfide from various industrial gases: A review of the most promising adsorbing materials. Catalysts 2020, 10, 521. [Google Scholar] [CrossRef]
  36. Hunter, G.B.J.; Hunter, J.S. Statistics for Experimenters; John Wiley and Sons: New York, NY, USA, 2005. [Google Scholar]
  37. Bruns, R.E.; Scarminio, I.S.; Neto, B.B. Statistical Design—Chemometrics; Elsevier: Amsterdam, The Netherlands, 2006. [Google Scholar]
  38. Massart, D.L.; Vandeginste, B.G.M.; Buydens, L.M.C.; de Jong, S.; Lewi, P.J.; Smeyers-Verbeke, J. Handbook of Chemometrics and Qualimetrics: Part A; Elsevier: Amsterdam, The Netherlands, 1977. [Google Scholar]
  39. Tong, L.-I.; Chang, Y.-C.; Lin, S.-H. Determining the optimal re-sampling strategy for a classification model with imbalanced data using design of experiments and response surface methodologies. Expert Syst. Appl. 2011, 38, 4222–4227. [Google Scholar] [CrossRef]
  40. Myers, R.H.; Montgomery, D.C. Response Surface Methodology: Process and Product Optimization Using Designed Experiments, 2nd ed.; John Wiley & Sons, Inc: Hoboken, NJ, USA, 2002. [Google Scholar]
  41. Papurello, D.; Iafrate, C.; Lanzini, A.; Santarelli, M. Trace compounds impact on SOFC performance: Experimental and modelling approach. Appl. Energy 2017, 208, 637–654. [Google Scholar] [CrossRef]
  42. Kupecki, J.; Papurello, D.; Lanzini, A.; Naumovich, Y.; Motylinski, K.; Blesznowski, M.; Santarelli, M. Numerical model of planar anode supported solid oxide fuel cell fed with fuel containing H2S operated in direct internal reforming mode (DIR-SOFC). Appl. Energy 2018, 230, 1573–1584. [Google Scholar] [CrossRef]
  43. Papurello, D.; Lanzini, A. SOFC single cells fed by biogas: Experimental tests with trace contaminants. Waste Manag. 2018, 72, 306–312. [Google Scholar] [CrossRef]
  44. Zulkefli, N.N.; Khaia, T.Z.; Nadaraja, S.; Venugopal, N.R.; Yusri, N.A.M.; Sofian, N.M.; Masdar, M.S. Capabilities dual chemical mixture (DCM) adsorbents through metal anchoring in H2S captured. Solid State Technol. 2020, 63, 181–191. [Google Scholar]
  45. Baş, D.; Boyacı, I.H. Modeling and optimization I: Usability of response surface methodology. J. Food Eng. 2007, 78, 836–845. [Google Scholar] [CrossRef]
  46. Sharma, P.; Singh, L.; Dilbaghi, N. Optimization of process variables for decolorization of Disperse Yellow 211 by Bacillus subtilis using Box–Behnken design. J. Hazard. Mater. 2009, 164, 1024–1029. [Google Scholar] [CrossRef]
  47. Wu, L.; Yick, K.-L.; Ng, S.-P.; Yip, J. Application of the Box–Behnken design to the optimization of process parameters in foam cup molding. Expert Syst. Appl. 2012, 39, 8059–8065. [Google Scholar] [CrossRef]
  48. Moradi, M.; Daryan, J.T.; Mohamadalizadeh, A. Response surface modeling of H2S conversion by catalytic oxidation reaction over catalysts based on SiC nanoparticles using Box−Behnken experimental design. Fuel Process. Technol. 2013, 109, 163–171. [Google Scholar] [CrossRef]
  49. Dong, C.H.; Xie, X.Q.; Wang, X.L.; Zhan, Y.; Yao, Y.J. Application of Box-Behnken design in optimisation for polysaccharides extraction from cultured mycelium of Cordyceps sinensis. Food Bioprod. Process. 2009, 87, 139–144. [Google Scholar] [CrossRef]
  50. Sidek, M.Z.; Masdar, M.S.; Nik Dir, N.M.H.; Amran, N.F.A.; Ajit Sing, S.K.D.; Wong, W.L. Integrasi Sistem Penulenan Biohidrogen dan Aplikasi Sel Fuel. J. Kejuruter. 2018, 1, 41–48. [Google Scholar]
  51. Arifina, R.A.; Hasana, H.A.; Kamarudina, N.H.N.; Ismailb, N.I. Synthesis of Mesoporous Silica for Ammonia Adsorption in Aqueous Solution. J. Kejuruter. 2018, 1, 59–64. [Google Scholar] [CrossRef]
  52. Nakamura, T.; Kawasaki, N.; Hirata, M.; Oida, Y.; Tanada, S. Adsorption of Hydrogen Sulfide by Zinc-Containing Activated carbon. Toxicol. Environ. Chem. 2002, 82, 93–98. [Google Scholar] [CrossRef]
  53. Bazrafshan, E.; Al-Musawi, T.J.; Silva, M.F.; Panahi, A.H.; Havangi, M.; Mostafapur, F.K. Photocatalytic degradation of catechol using ZnO nanoparticles as catalyst: Optimizing the experimental parameters using the Box-Behnken statistical methodology and kinetic studies. Microchem. J. 2019, 147, 643–653. [Google Scholar] [CrossRef]
  54. Pimenta, C.D.; Silva, M.B.; de Morais Campos, R.L.; de Campos, W.R., Jr. Desirability and design of experiments applied to the optimization of the reduction of decarburization of the process heat treatment for steel wire SAE 51B35. Am. J. Theor. Appl. Stat. 2018, 7, 35–44. [Google Scholar] [CrossRef] [Green Version]
  55. Feng, W.; Kwon, S.; Borguet, E.; Vidic, R. Adsorption of Hydrogen Sulfide onto Activated Carbon Fibers: Effect of Pore Structure and Surface Chemistry. Environ. Sci. Technol. 2005, 39, 9744–9749. [Google Scholar] [CrossRef]
  56. Keyvanloo, K.; Towfighi, J.; Sadrameli, S.; Mohamadalizadeh, A. Investigating the effect of key factors, their interactions and optimization of naphtha steam cracking by statistical design of experiments. J. Anal. Appl. Pyrolysis 2010, 87, 224–230. [Google Scholar] [CrossRef]
  57. Sen, R.; Swaminathan, T. Response surface modeling and optimization to elucidate and analyze the effects of inoculum age and size on surfactin production. Biochem. Eng. J. 2004, 21, 141–148. [Google Scholar] [CrossRef]
  58. Mohamadalizadeh, A.; Towfighi, J.; Rashidi, A.; Manteghian, M.; Mohajeri, A.; Arasteh, R. Nanoclays as nano adsorbent for oxidation of H2S into elemental sulfur. Korean J. Chem. Eng. 2011, 28, 1221–1226. [Google Scholar] [CrossRef]
  59. Isik-Gulsac, I. Investigation of Impregnated Activated Carbon Properties Used in Hydrogen Sulfide Fine Removal. Braz. J. Chem. Eng. 2016, 33, 1021–1030. [Google Scholar] [CrossRef]
  60. Rodriguez, J.A.; Jirsak, T.; Chaturvedi, S. Reaction of H2S with MgO(100) and Cu/MgO(100) surfaces: Band-gap size and chemical reactivity. J. Chem. Phys. 1999, 111, 8077–8087. [Google Scholar] [CrossRef]
  61. Preece, D.A.; Montgomery, D.C. Design and Analysis of Experiments. Int. Stat. Rev. 1978, 46, 120. [Google Scholar] [CrossRef] [Green Version]
  62. Primavera, A.; Trovarelli, A.; Andreussi, P.; Dolcetti, G. The effect of water in the low-temperature catalytic oxidation of hydrogen sulfide to sulfur over activated carbon. Appl. Catal. A Gen. 1998, 173, 185–192. [Google Scholar] [CrossRef]
  63. Bagreev, A.; Bandosz, T.J. H2S adsorption/oxidation on unmodified activated carbons: Importance of prehumidification. Carbon 2001, 39, 2303–2311. [Google Scholar] [CrossRef]
  64. Vinodhini, V.; Das, N. Packed bed column studies on Cr (VI) removal from tannery wastewater by neem sawdust. Desalination 2010, 264, 9–14. [Google Scholar] [CrossRef]
Figure 1. H2S adsorption system [32]: (a) schematic diagram and (b) experimental H2S adsorption test set-up.
Catalysts 11 00545 g001
Figure 2. Process optimization.
Catalysts 11 00545 g002
Figure 3. Breakthrough curve of H2S versus ZnAc2 molarity for a constant soaked time: (a) 30 min, (b) 105 min, and (c) 180 min.
Catalysts 11 00545 g003
Figure 4. Design matrix evaluation for response surface of 2FI model.
Catalysts 11 00545 g004
Figure 5. Contour plot describing the adsorption capacity response in soaked temperature function of ZnAc2 molarity and soaked period (Soaked temperature: 65 °C).
Catalysts 11 00545 g005
Figure 6. Contour plot describing the BET surface area response in soaked temperature function of molarity and soaked period (soaked temperature: 65 °C).
Catalysts 11 00545 g006
Figure 7. Normal probability plot: (a) adsorption capacity and (b) BET surface area response.
Catalysts 11 00545 g007
Figure 8. Optimum conditions according to the BBD statistical method.
Catalysts 11 00545 g008
Figure 9. Individual and combined desirability functions.
Catalysts 11 00545 g009
Figure 10. (a) Experimental plot for H2S adsorption and (b) 3D contour plot for optimum theoretical condition for H2S adsorption study.
Catalysts 11 00545 g010
Figure 11. SEM analysis of exhausted ZnAc2/CAC adsorbent: (a) ZnAc2/CAC_O (E) and (b) ZnAc2/CAC_N (E) at 2.5 k × (10 μm).
Catalysts 11 00545 g011
Figure 12. Regeneration adsorption–desorption curve for (a) optimized adsorbent and (b) non-optimized adsorbent.
Catalysts 11 00545 g012
Table 1. Summary of different H2S removal technologies.
H2S Removal TechnologiesStrength Weakness Comments
Clauss process [10]
-
Very well-known process.
-
Cost is minimal since existing units are available.
-
Tail gas treatment is challenging.
-
Mainly used in refineries, natural gas processing plants, or syngas plants that require high H2S concentration.
-
Most matured process for H2S purification.
Adsorption [14]
-
Widely used mesoporous materials utilized as adsorbents are low-cost raw materials.
-
Materials have high surface area and porosity, which leads to optimum adsorption capacity.
-
Normally impregnated with selective chemicals to enhance the adsorbent capability.
-
Only selective chemicals capable of capturing H2S gas are used.
-
Sulfur bound on the mesoporous materials degraded the adsorption performance.
-
Solid adsorbent should be highly selective and have high capacity of H2S adsorption.
-
Widely used for low H2S concentration.
Absorption
(liquid solution) [24]
-
Process based on alkanolamines is matured and has been perfected over the last several decades.
-
Depends on the interaction strength of the gas molecules and solvents.
-
High regeneration cost required and inefficient.
-
Could cause secondary pollution.
-
Developing H2S selective alkanolamines is a big challenge to overcome the liquid absorbents.
-
Current study focuses on ionic liquid to improve the absorption performance.
Biological
[15,16,17,18]
-
Alternative to very costly industrial methods.
-
Environmentally friendly.
-
Requires highly sensitive of biological process to operate effectively.
-
Process system requires a special procedure.
-
Purification and separation studies are challenging.
-
New research study for H2S purification with high improvement potential.
Membrane
[19,20]
-
Rarely found membrane technologies used for H2S separation.
-
In term of CO2 separation, the membrane technology is more economical.
-
Presence of H2S gas increases the separation cost.
-
Selective membranes exhibit no significant difference in permeability.
-
Hybrid process involving membrane or chemical absorption or adsorption can lead towards an overall better economical process.
Table 2. Process factors and factor levels of the adsorbent preparation state.
FactorsLevel
−10+1
AMolarity (M)0.20.61.0
BSoaked period (min)30105180
CSoaked temperature (°C)3065100
Table 3. Box–Behnken and experimental data of responses’ adsorption capacity and BET surface area.
No. of RunZnAc2 Molarity, M
(A)
Soaked Period, min
(B)
Soaked Temperature, °C
(C)
Adsorption Capacity, mg H2S/g (Y1)BET Surface Area, m2/g
(Y2)
10.20105.0030.001.81842.74
21.00105.0030.002.03584.01
30.60105.0065.000.47544.52
40.6030.0030.000.67765.23
51.00105.00100.000.56757.80
60.2030.0065.001.75692.65
70.60105.0065.001.84737.64
81.00180.0065.001.47698.38
91.0030.0065.000.58825.52
100.6030.00100.02.37198.31
110.60180.0030.001.36694.21
120.60105.0065.001.48726.12
130.20180.0065.002.11612.05
140.60105.0065.002.23473.72
150.60180.00100.001.70485.28
160.20105.00100.002.14555.00
170.60105.0065.000.89731.88
Table 4. Adequacy of model for adsorption capacity response.
SourceSum of SquaresDFMean SquareF ValueProb > F
Mean38.14138.14 Suggested
Linear1.5630.521.360.30
2FI1.3530.451.250.34Suggested
Quadratic0.1530.050.100.96
Cubic1.4730.490.980.49Aliased
Residual2.0040.50
Total44.66172.63
lack of fit
Linear2.9790.330.660.72
2FI1.6260.2670.540.76Suggested
Quadratic1.4730.490.980.49
Cubic00 Aliased
Pure error2.0040.50
SourceStandard DeviationR2Adjusted R2Predicted R2PRESS
Linear0.620.240.06−0.298.41
2FI0.600.450.11−0.5810.29Suggested
Quadratic0.700.47−0.21−3.0826.64
Cubic0.710.69−0.22 +Aliased
Table 5. Analysis of variance (ANOVA) of adsorption capacity response.
SourceSum of SquaresDFMean SquareF-ValueF-Value from Table (p = 0.05)Prob > F
Model2.9160.491.343.220.32Not significant
A1.2611.263.484.960.09
B0.2010.200.574.960.47
C0.09910.0990.274.960.61
AB0.07010.0700.194.960.67
AC0.8210.822.264.960.16
BC0.4610.461.294.960.28
Residual3.61100.360.542.980.76
Lack of fit1.6260.27 Not significant
Pure error2.0040.50
Cor total6.5316
Table 6. Model reliability analysis of adsorption capacity response.
SourceResult
Standard deviation0.60
Mean1.50
Coefficient variation (%), C.V40.14
PRESS10.29
R20.45
Adjusted R20.11
Prediction R2−0.58
Adequate precision4.40
Table 7. Adequacy of the model for BET surface area response.
SourceSum of SquaresDFMean SquareF-ValueProb > F
Mean7,813,33117,813,331
Linear57,607.09319,202.361.620.23
2FI68,436.96322,812.322.650.11Suggested
Quadratic10,032.7133344.2360.310.82
Cubic13,827.2234609.0730.300.83Aliased
Residual62,118.94415,529.74
Total8,025,35417472,079.7
Lack-of-Fit Tests
SourceSquaresDFSquareValueProb > F
Linear92,296.88910,255.210.660360.7227
2FI23,859.9363976.6540.2560670.9323Suggested
Quadratic13,827.2234609.0730.296790.8270
Cubic00 Aliased
Pure error62,118.94415,529.74
SourceStandard DeviationR2Adjusted R2Predicted R2PRESS
Linear108.990.270.10−0.21257,363.7
2FI92.720.590.350.21167,922.1Suggested
Quadratic104.160.640.18−0.50318,296.4
Cubic124.620.71-0.17 +Aliased
Table 8. Analysis of variance (ANOVA) of BET surface area responses.
Source Sum of SquaresDFMean SquareF-ValueF-Value from Table
(p = 0.05)
Prob > F
Model1.3 × 10562.1 × 1042.443.220.10Not significant
A3.3 × 10313.3 × 1030.394.960.55
B4.3 × 10414.4 × 1045.094.960.05
C1.0 × 10411.0 × 1041.224.960.30
AB541.251541.250.064.960.81
AC5.3 × 10415.3 × 1046.194.960.03
BC1.5 × 10411.5 × 1041.704.960.22
Residual8.6 × 104108.6 × 103 2.98
Lack of fit2.4 × 10464.0 × 1030.26 0.93Not significant
Pure error6.2 × 10441.6 × 104
Cor total2.1 × 10516
Table 9. Model reliability analysis of adsorption capacity response.
SourceResult
Standard deviation92.72
Mean677.94
Coefficient variation (%)13.68
PRESS16800
R20.59
Adjusted R20.35
Prediction R20.21
Adequate precision5.10
Table 10. Semi-quantitative chemical analysis of selected points in weight percent through EDX analysis.
AdsorbentsCCaNaKZnOS
CAC (F)81.413.870.256.930.216.350.98
ZnAc2/CAC_O (F)85.750.750.020.437.725.140.19
ZnAc2/CAC_O (E)79.040.490.000.625.148.566.15
ZnAc2/CAC_O (D)87.210.630.000.396.015.530.23
ZnAc2/CAC_N (F)89.240.880.000.385.283.980.24
ZnAc2/CAC_N (E)86.040.370.000.522.844.815.42
ZnAc2/CAC_N (D)89.660.670.000.244.974.160.30
Table 11. Porous properties for regeneration of optimized and non-optimized adsorbents.
AdsorbentsBET Surface Area,
m2/g
Total Pore Volume,
m3/g (×10−7)
Vmicro/Vtotal (%)Pore Size,
Å
ZnAc2/CAC_O (F)713.813.490.7819.33
ZnAc2/CAC_O (E)649.562.920.7418.04
ZnAc2/CAC_N (F)717.413.480.7719.26
ZnAc2/CAC_N (E)656.752.940.7417.93
Table 12. Comparison of adsorption capacity in regeneration of adsorption–desorption H2S.
CycleAdsorption Capacity, mg H2S/g ZnAc2/CAC_OAdsorption Capacity, mg H2S/g ZnAc2/CAC_N
12.121.42
21.891.16
31.781.09
Publisher’s Note: MDPI stays neutral with regard to jurisdictional claims in published maps and institutional affiliations.

