1. Introduction
Industrial development is the main cause of the increase of pollution in water [
1]. Although these polluted effluents undergo various physical, chemical, and biological treatments [
2], some pollutants are not degraded and unfortunately return to the ecosystem [
3].
Advanced oxidation processes (AOPs) are among the most efficient processes for the total mineralization of organic compounds [
4,
5,
6]. The interest of AOPs lies in their ability to degrade almost all organic molecules, e.g., by reacting with the double bonds (-C=C-) and attacking the aromatic rings, major constituents of refractory pollutants. Photocatalysis is a promising advanced oxidation process in view of its ability to degrade a great number of organic molecules, low cost, and versatile application in the field of pollution control [
5,
7].
Indeed, the principle of photocatalysis for pollution abatement is to oxidize target molecules, leading to CO
2 and H
2O only in case of total degradation. Semiconductors are typically used as photocatalysts due to their physico-chemical characteristics in the presence of light. Indeed, photons with sufficient photon energy can promote an electron from the semiconductor’s valence band to its conduction band. These photogenerated species migrate at the surface of the photocatalysts and can do redox reactions with the surrounding medium. In water, this leads to the production of hydroxyl radicals ·OH, the most powerful oxidizing species, and the formation of the superoxide radical O
2−·. This process is persistent as long as light is available [
3,
5,
8].
Several successful semiconductors for this application are described in literature, including ZnO, WO
3, ZnS, CdS, Fe
2O
3, and TiO
2 [
3]. Titanium dioxide is the ninth most abundant component on earth and is used in various fields of applications such as food packaging (UV protection of food), in sunscreens, in orthopedic implants, but also in photocatalysis for the production of various self-cleaning coatings, the removal of impurities, and the depollution of water and air [
9,
10].
Anatase TiO
2, its most photoactive phase, activation requires photons with an energy greater or equal to the 3.2 eV band gap of TiO
2. This energy is equivalent to the energy of a photon with a wavelength of 388 nm, corresponding to the ultraviolet range [
11]. TiO
2 presents some advantages over other semiconductors. Besides its non-toxic and chemical stability aspect, it has good corrosion resistance, and is also relatively inexpensive. TiO
2 has a high photocatalytic activity and chemical stability under ultraviolet light (<388 nm). On the other hand, titania’s large band gap only allows to harvest UV light, representing only about 5% of the solar spectrum [
12]. Another disadvantage of TiO
2 is the strong recombination rate of the photo-generated electron–hole (e
−/h
+) species.
The development of photocatalysts with a high and stable activity under visible light (>400 nm) should allow to use a larger part of the solar spectrum, even under low-intensity indoor lighting [
8,
13]. To reach these goals, modifications of TiO
2 were envisaged with the incorporation of metallic or non-metallic atoms. The list of doping elements in literature is long and includes transition metal ions such as Zr [
14], Cu [
15], Co [
16], Ni [
17], Cr [
18], Mn [
19], Mo [
20], Nb [
21], V [
22], Fe [
23], Ru [
24], Au [
25], Ag [
26], and Pt [
11], or non-metallic ions such as N [
27], S [
28], C [
29], B [
30], P [
31], I [
32], and F [
33]. The combination with other semiconductors, having a lower band gap energy, was also studied [
34], as well as the sensitization of TiO
2 with organic or organometallic dyes [
35].
The production of TiO
2 materials can be carried out by several methods such as mechanochemical techniques, precipitation, aerosol powder coating, hydrothermal methods, crystallization, and sol–gel methods [
36]. The sol–gel process has several advantages, as it offers simplicity of implementation, cost effectiveness, high purity, and careful control of the chemical composition [
36,
37,
38].
The first work on the doping of TiO
2 with a non-metallic element, and more precisely nitrogen, was carried out in 1986 by Sato et al. [
39], who obtained N-doped powders with better oxidation of carbon monoxide and ethane compared to the commercial Evonik P25. Then, in 2001, Morikawa et al. [
40] reported that nitrogen doping reduced the band gap of TiO
2 and improved the absorption of visible light, due to a modification of the band structure by substitution of the
2p states of N in the TiO
2 lattice mixed with the O
2p states. Indeed, nitrogen can be easily introduced into the TiO
2 structure due to its atomic size comparable to that of oxygen, its low ionization energy, and its high stability [
27].
Transition metal modification can also extend the spectral response of TiO
2 in the visible light region by inducing electronic transitions between the
d-electrons of the transition metal ions and the conduction band of TiO
2 [
11]. This activity is also related to the formation of a new energy level produced in the TiO
2 band gap by dispersing metal nanoparticles in the TiO
2 lattice. This modification also improves the photoactivity due to electron trapping on delocalized metallic dopant, reducing e
−/h
+ recombination rate during irradiation [
11]. TiO
2 N-doping proved to be a promising method to increase its photoactivity, but the photocatalytic efficiency of N-doped TiO
2 was limited due to the strongly localized N
2p states at the top of the valence band, which can act as traps, and rapid recombination for the excited electrons [
12,
40]. Therefore, the simultaneous use of a metal and non-metal as co-doping elements may be an effective alternative for improving photocatalytic activity [
12].
Co-doping of TiO
2 with zirconium and nitrogen simultaneously has been reported in only a limited number of papers compared to other doping elements [
12,
41,
42,
43,
44]. This work is a contribution to complement the development of co-doped TiO
2 powders, more active in the visible range but also more efficient in the UV range.
In this study, TiO
2 powders were doped with two nitrogen precursors (urea and triethylamine) and with a zirconium source. The photocatalysts were prepared by an aqueous sol–gel method, combining and optimizing two methods developed previously in Mahy et al. [
14,
27]. Emphasis was placed on the development of a green process by using water as solvent and no calcination step to crystallize the titania. The conditions were optimized by fixing the N/Ti ratio for both urea and triethylamine to the best ratio in terms of photoactivity, and by varying the zirconium source fractions (0.7, 1.4, 2, or 2.8 mol%). Subsequently, the samples were characterized by X-ray diffraction (XRD), nitrogen adsorption–desorption measurements, diffuse reflectance UV–Visible spectroscopy (DR-UV-Vis), X-ray photoelectron spectroscopy (XPS), transmission electron microscopy (TEM), Fourier transform infrared spectroscopy (FTIR), thermogravimetric analysis (TG), Photoluminescence (PL), and by inductively coupled plasma–atomic emission spectroscopy (ICP–AES).
The last part of this study is devoted to testing the photocatalytic activity of those doped samples for the degradation of a model solution of p-nitrophenol (PNP, C6H5NO3) under UV–visible and visible light. The aims are to show the influence of N/Zr co-doping on the photocatalytic activity and to identify the best doping ratios. The commercial Evonik P25 photocatalyst will be used as reference for benchmarking the obtained performances.
2. Results
Concerning the notation of samples used in this study, samples doped with urea are designated TiO
2/Ux, where x is the molar ratio between titanium dioxide and urea. In this work, x is chosen equal to 4, following Mahy et al. [
27]. Samples doped with triethylamine are designated TiO
2/Ny, where y is the molar ratio between titanium dioxide and triethylamine. In this work, y is chosen equal to 42, following Mahy et al. [
27]. For samples doped with zirconium (IV) tertbutoxide, they are denoted by TiO
2/Zrz, where z is the molar percentage of Zr and is equal to 0.7, 1.4, 2, and 2.8 mol%. The samples co-doped with urea and zirconium are denoted TiO
2/U4/Zrz and those co-doped with triethylamine and zirconium are denoted TiO
2/N42/Zrz.
2.1. Crystallographic Properties of Samples
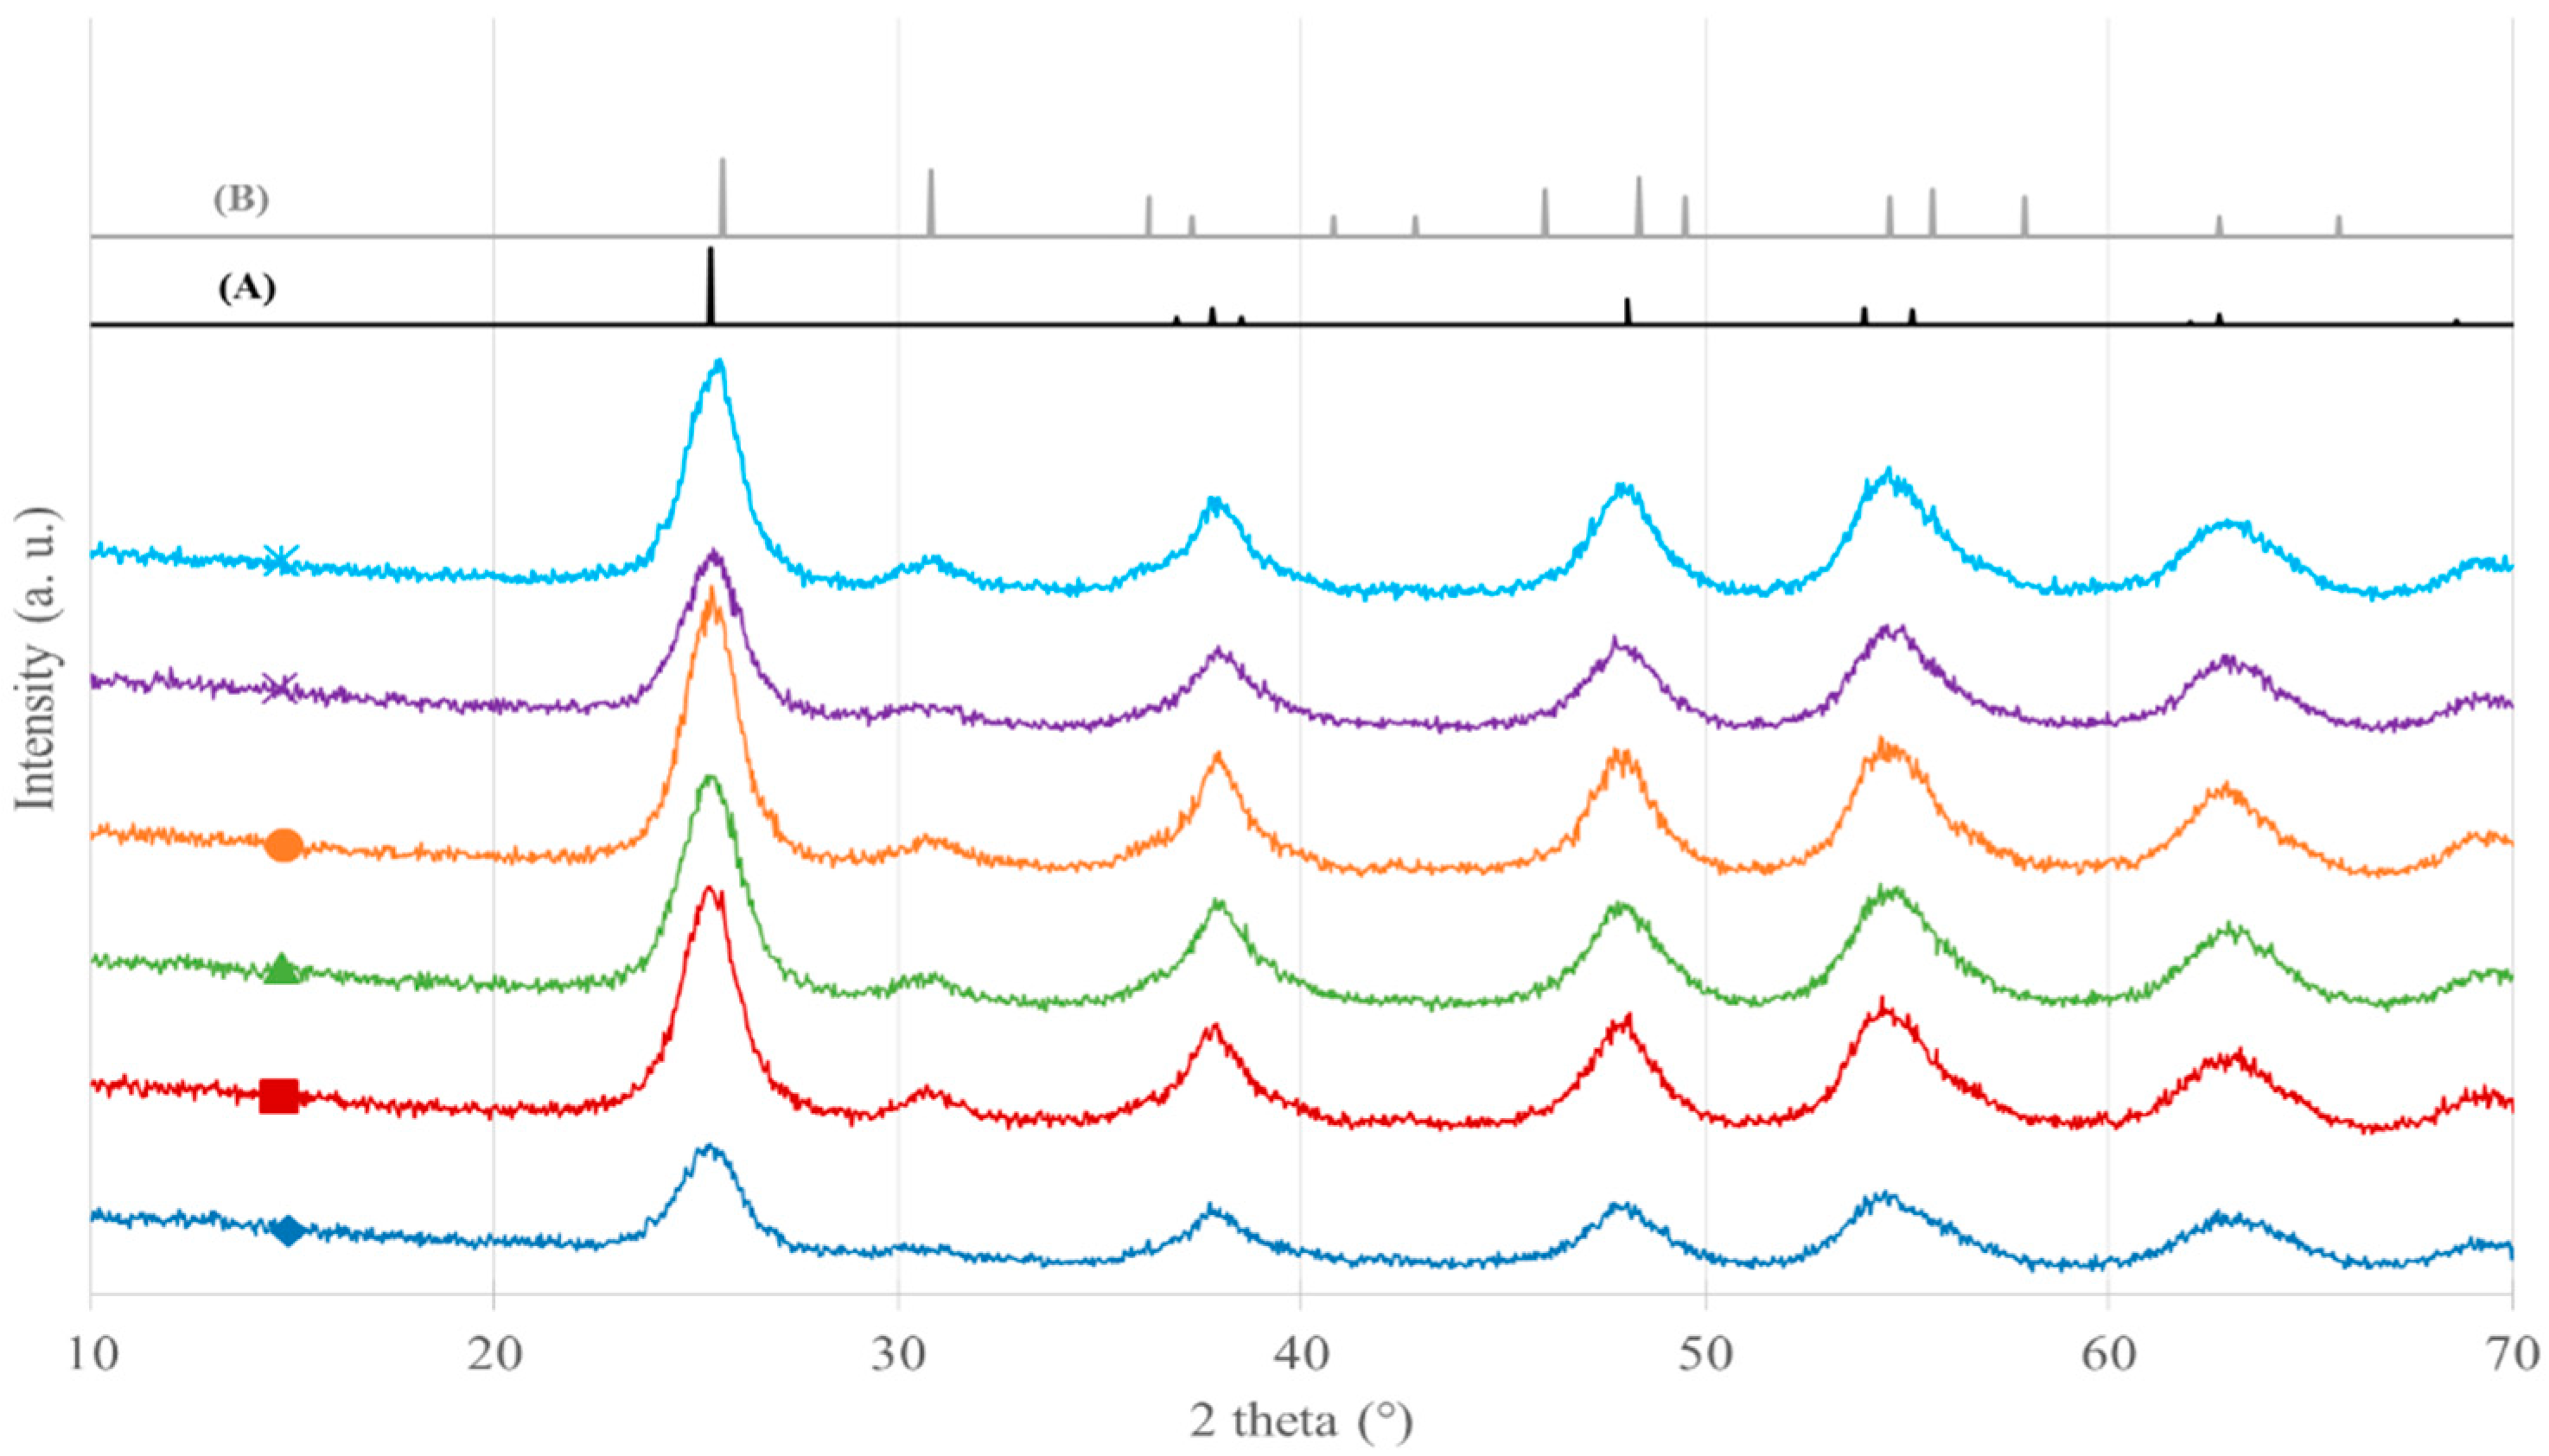
Figure 1 shows the XRD patterns of pure TiO
2 and selected N/Zr-doped and co-doped TiO
2 samples; reference patterns for the anatase and brookite TiO
2 phases are also presented.
These powders, prepared by precipitation-peptization, are similar in crystallographic structure with the identified presence of the anatase, brookite, and amorphous phases. The other samples (not shown) have similar patterns. The crystallographic fractions shown in
Table 1 were obtained by Rietveld refinement of the scale factors with the TOPAS software using a CaF
2 internal standard.
The highest content of the anatase phase (around 40%,
Table 1) is observed for the TiO
2 samples co-doped with urea and zirconium tert-butoxide and for the TiO
2/N42/Zr0.7 sample. The brookite phase is more present (around 30%,
Table 1) in urea/Zr co-doped powders compared to other samples. The amorphous fraction of TiO
2 ranges between 30% and 60%. Zirconium doping seems to increase the amorphous fraction of TiO
2, both in doped Zr/TiO
2 samples and in co-doped N/Zr/TiO
2 samples. Thus, the crystallization of amorphous TiO
2 into anatase and brookite structures is less favored with a higher zirconium loading, as reported by other authors [
41]. It is also observed in
Table 2 that the TiO
2 crystallite sizes,
dXRD, slowly increase from 4 to 6 nm with increasing zirconium content, as already observed by Mahy et al. [
14].
2.2. Composition of Samples
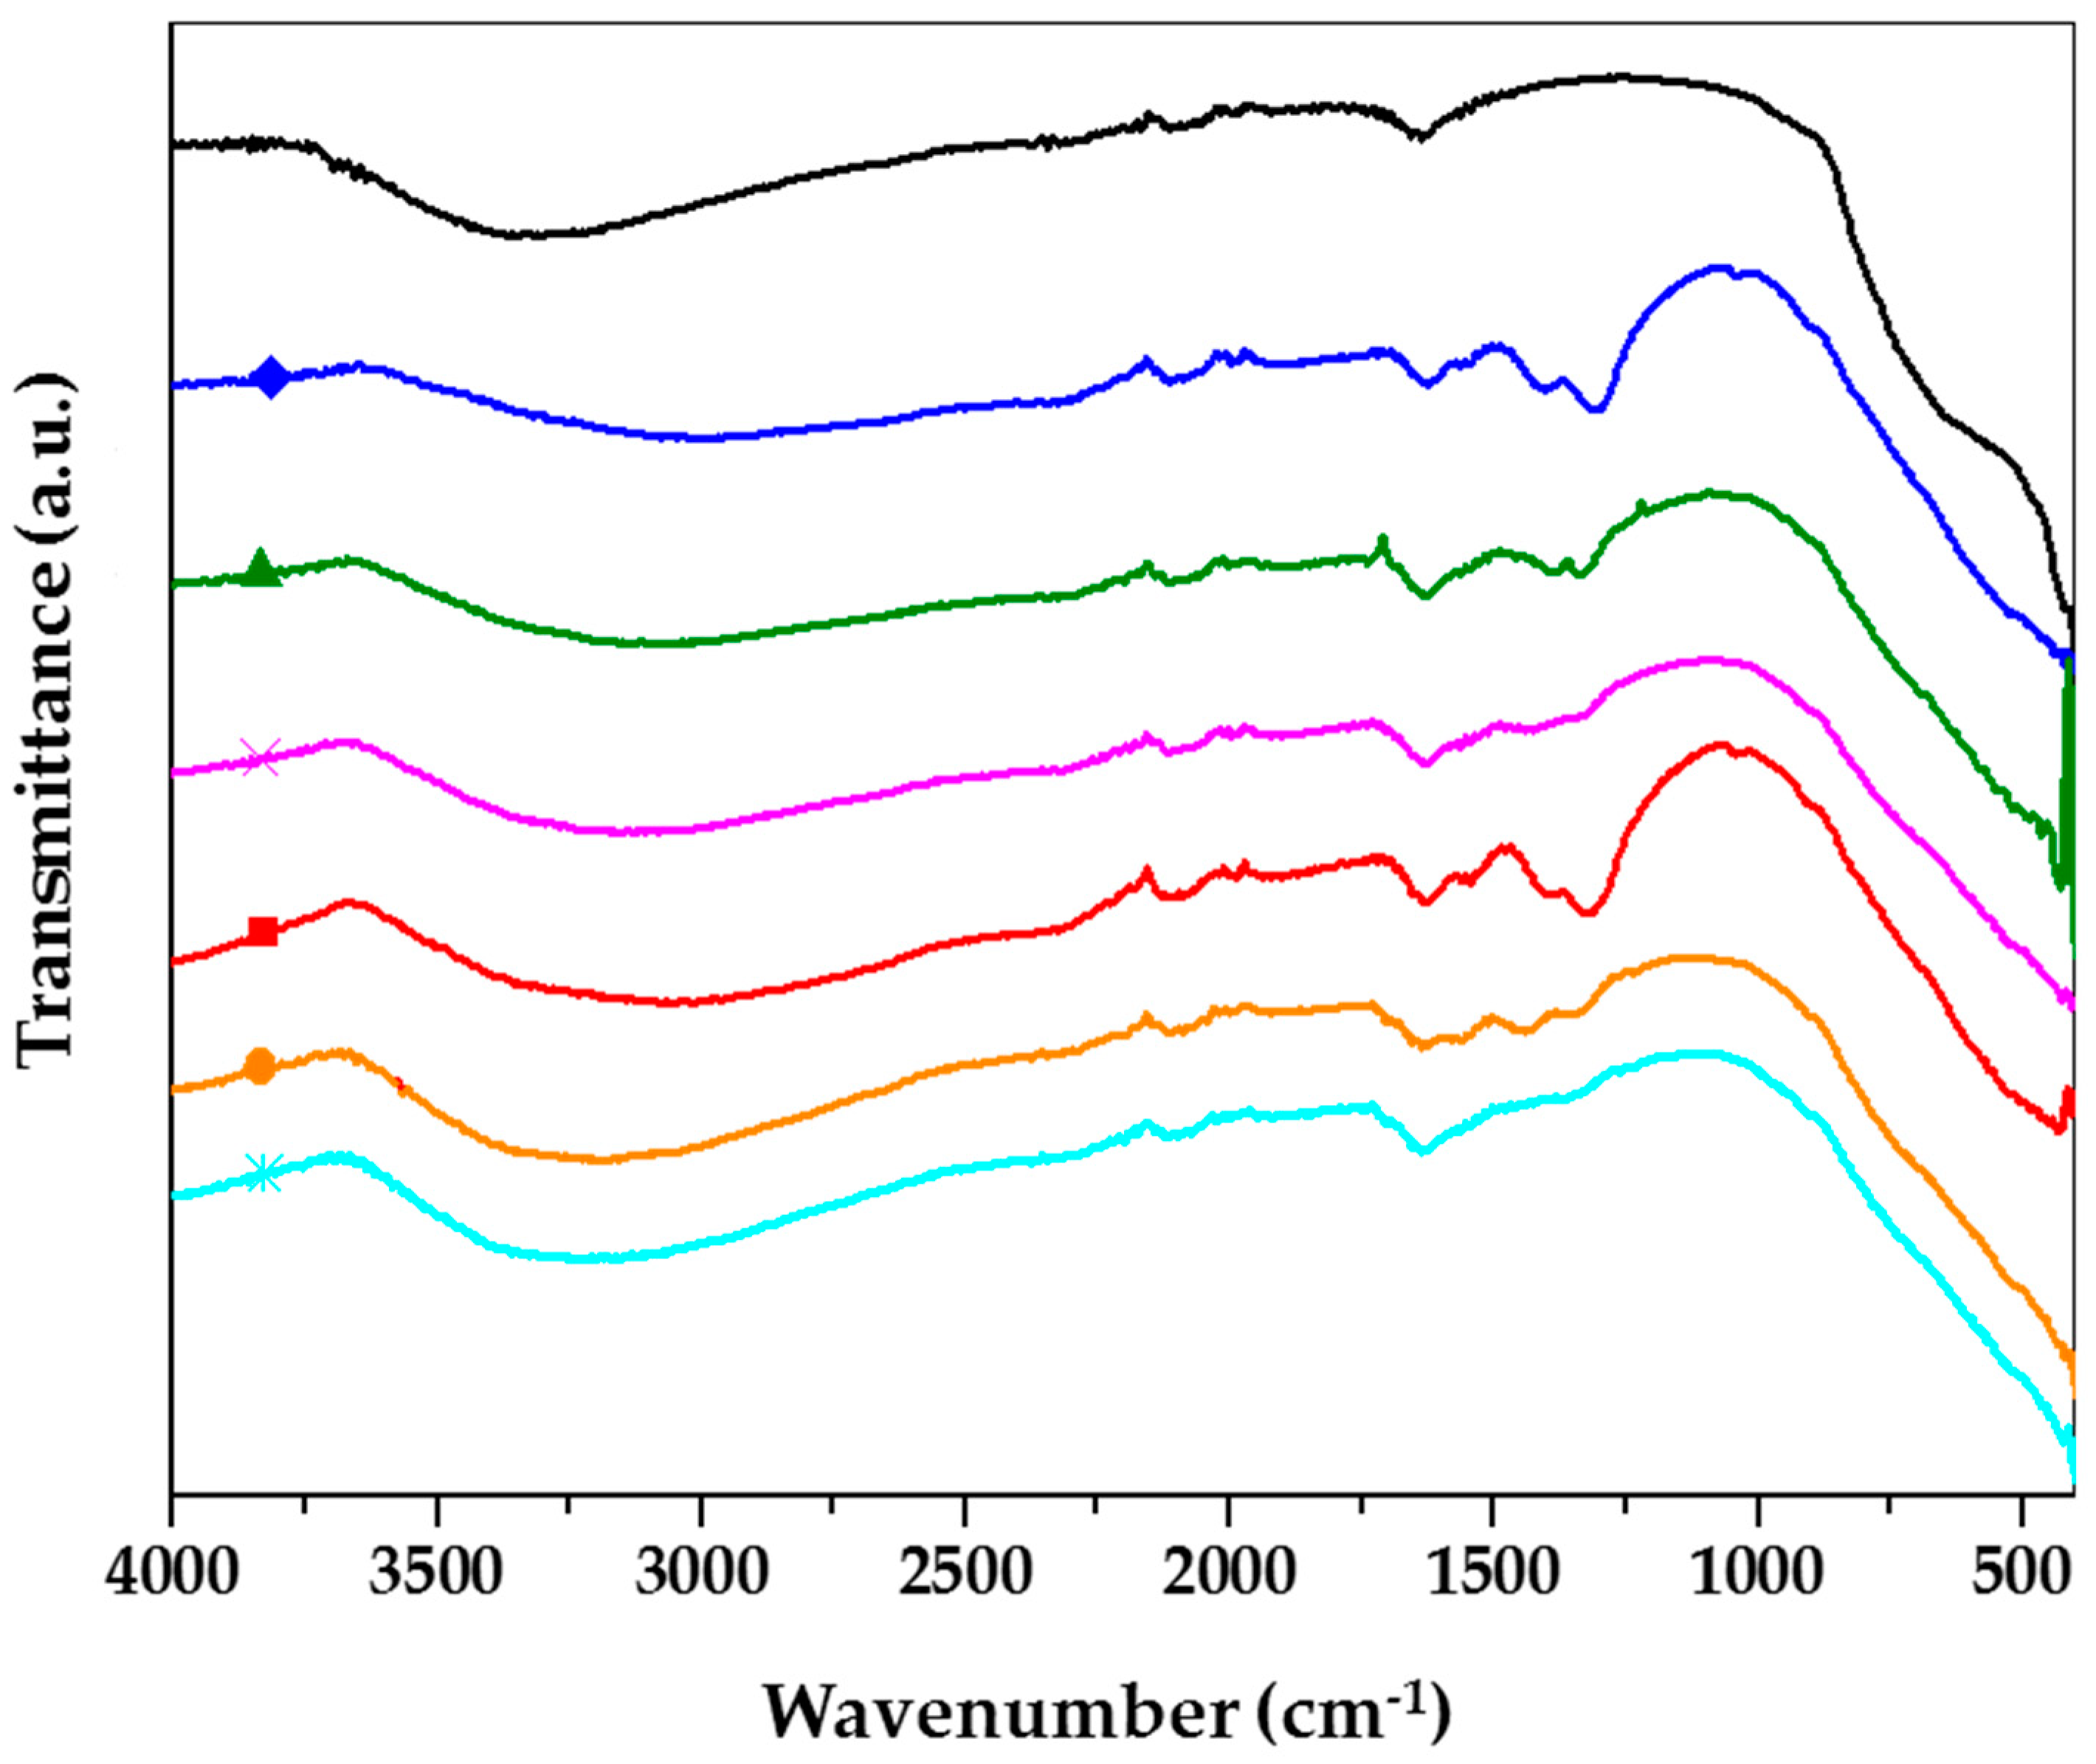
The Fourier transform infrared (FTIR) spectra of sample P25, pure TiO
2, TiO
2/U4, TiO
2/N42, TiO
2/U4/Zr2.8, and TiO
2/N42/Zr2.8 are shown in
Figure 2. Generally, the spectra of aqueous samples are similar between each other, and few peaks are also similar to the commercial P25.
The strong broadband at 3200 cm
−1 as well as small peak at 1631 cm
−1 are due to vibrations of the –OH groups from the water adsorbed in the samples, as well as Ti-OH and Zr-OH groups in the Zr-doped samples. No additional peaks were observed for the Zr doping peaks, promoting efficient dispersion of zirconium [
45].
The peak intensity in TiO2/U4/Zr2.8 and TiO2/N42/Zr2.8 powders relating to –OH groups are higher than those of pure TiO2, indicating that nitrogen and zirconium doping increases the surface hydroxyl groups thus enhancing the photocatalytic activity.
The spectra undoubtedly reveal the presence of synthetic residues in addition to TiO2.
For pure TiO
2 and TiO
2/Zr2.8 samples, the doublet peaks located at 1553 cm
−1 and 1315 cm
−1 would seem to be attributed to nitrates [
46,
47,
48], as well as the peak located at 1049 cm
−1 which returns to the free NO
3− ions [
49,
50]. In fact, pure and single Zr-doped samples (prepared in the presence of HNO
3 during the synthesis) often contain residues of NO
3- species [
49], which is explained because these powders are not rinsed at the end of the synthesis, unlike the powders doped with nitrogen. It is observed that the intensity of these two peaks at 1553 cm
−1 and 1315 cm
−1 decreases with the doping in nitrogen source, explained by the washing of the powders when doped with urea or triethylamine as explained in the
Section 3.5, as well as the disappearance of the peak at 1049 cm
−1.
The other doped samples have similar spectra.
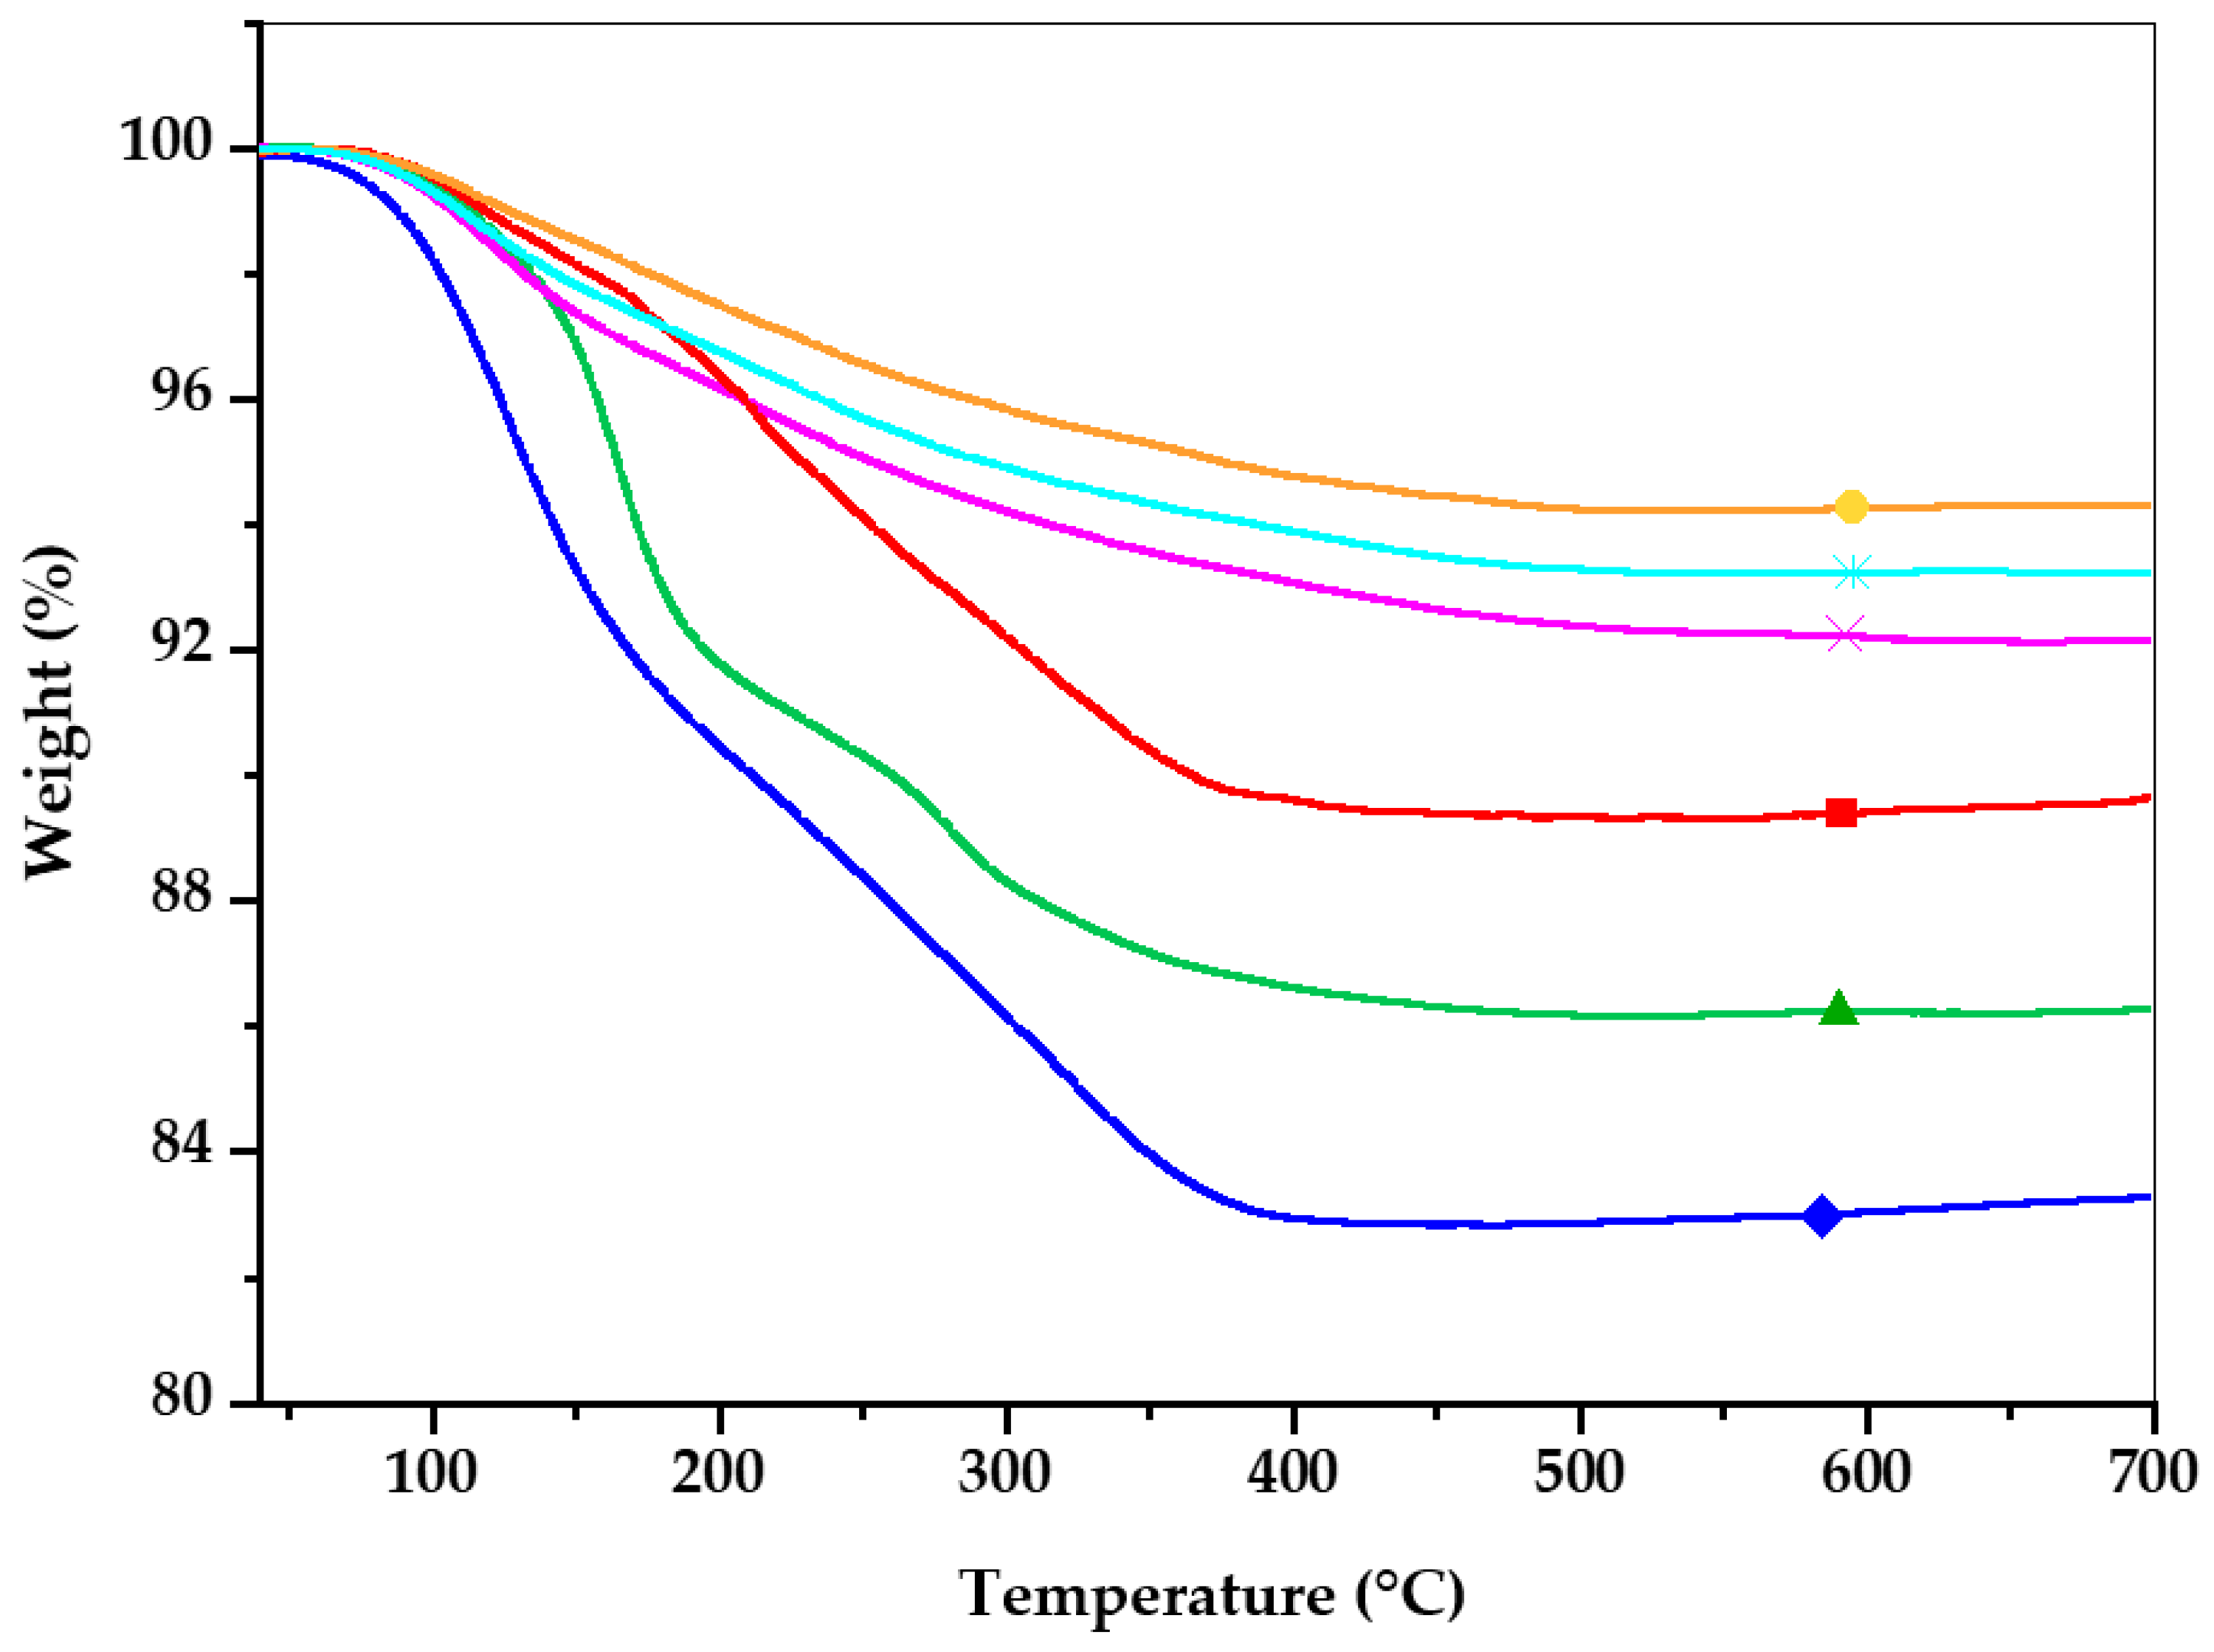
The thermogravimetric analysis for the pure TiO
2, TiO
2/U4, TiO
2/N42, TiO
2/U4/Zr2.8, and TiO
2/N42/Zr2.8 samples is shown in
Figure 3. The weight loss is comprised between 4 and 18%; the highest is reached with the pure TiO
2 sample. Indeed, this sample was not washed after synthesis. The losses occur between 100 °C and 400 °C. After 400 °C, no weight loss is observed.
2.3. Textural Properties of Samples
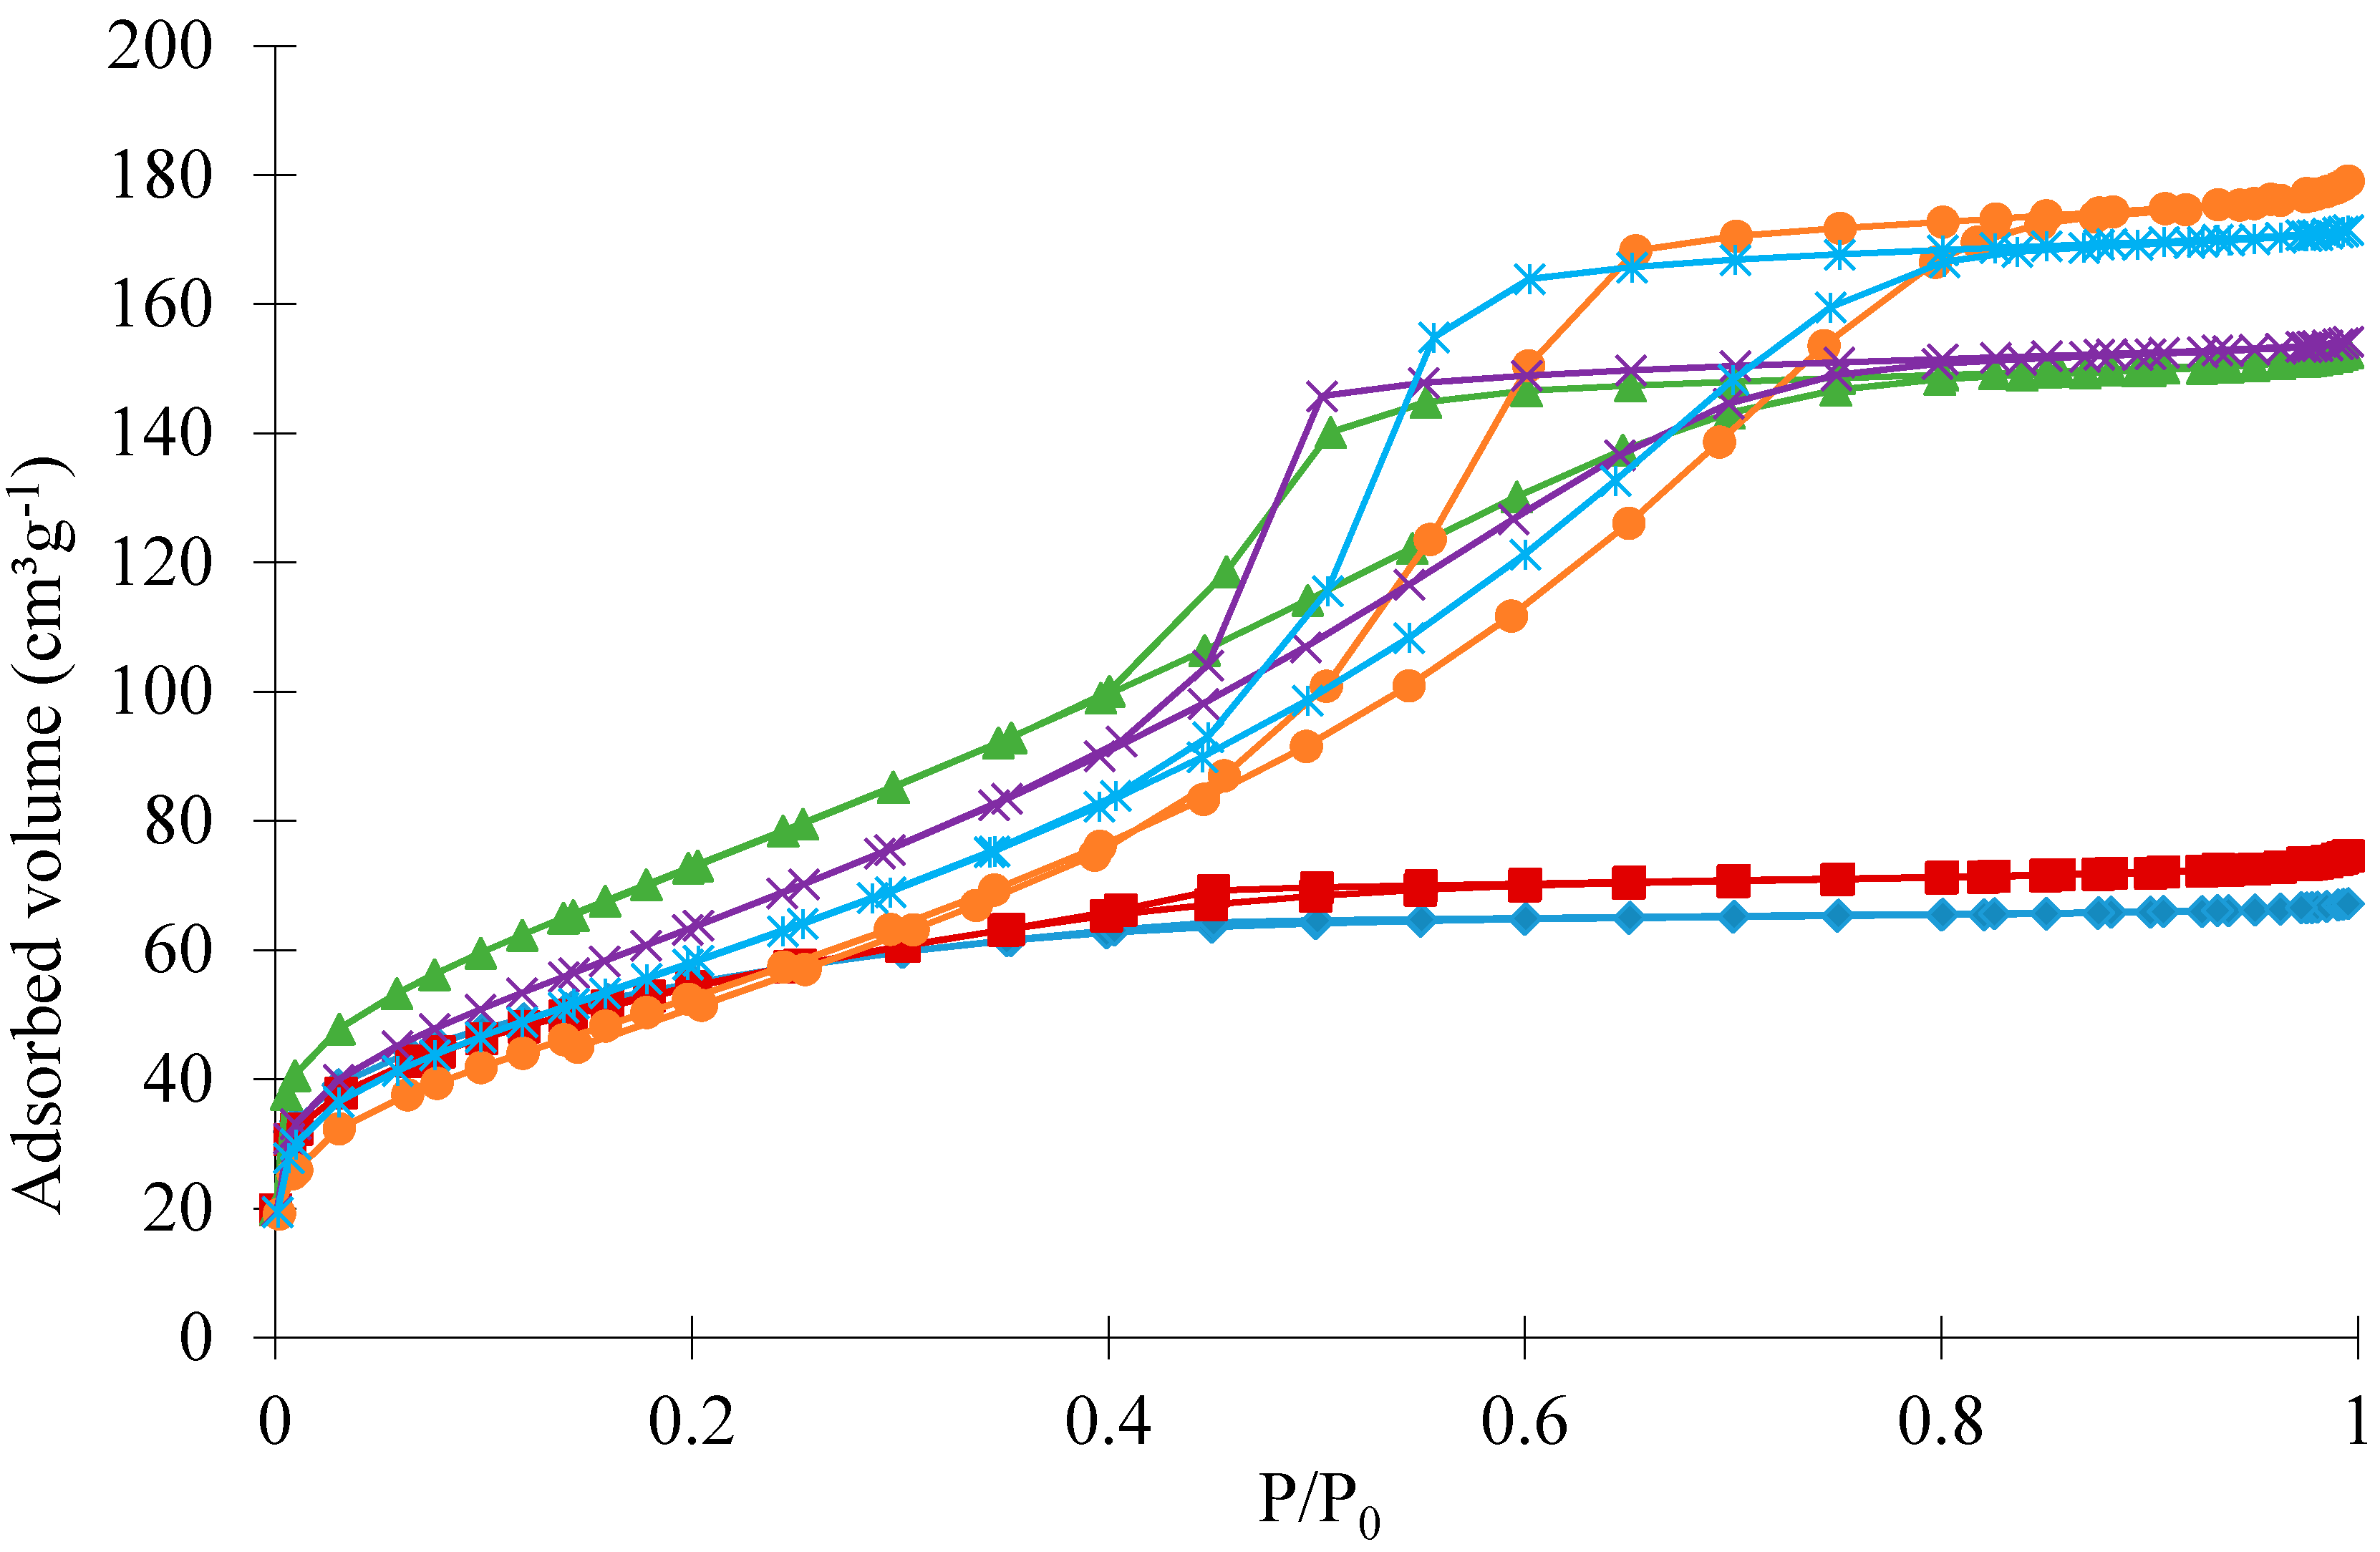
Figure 4 shows the nitrogen adsorption-desorption isotherms for N/Zr doped and co-doped TiO
2 powders, with the corresponding pure TiO
2 sample as a reference.
For the pure TiO
2 sample and all samples only doped with Zr (TiO
2/Zr0.7, TiO
2/Zr1.4, TiO
2/Zr2 and TiO
2/Zr2.8), the isotherms are similar: a strong increase in adsorbed volume at low pressure, followed by a plateau, corresponding to a microporous solid (type I isotherm from the BDDT classification) [
14,
51]. The values of the specific surface area,
SBET, and microporous volume,
VDR, are similar for all samples, between 195 and 210 m
2 g
−1 for
SBET and equal to 0.11 cm
3 g
−1 for
VDR (
Table 2). Furthermore, the
VDR and
Vp (specific liquid volume adsorbed at saturation pressure of nitrogen) values are similar, a specific characteristic of microporous materials [
51]. These textural properties are typical of TiO
2 samples doped with zirconium and prepared with the peptization-precipitation method [
14]. This is due to the spherical shape of the nanoparticles in between which small voids (<2 nm) lie [
14]. It is possible to see on TEM micrographs (see next section,
Figure 5C) these small TiO
2 nanoparticles.
When nitrogen is incorporated inside the framework of TiO
2 (samples TiO
2/U4, TiO
2/U4/Zr2.8, TiO
2/N42, and TiO
2/N42/Zr2.8), the nitrogen adsorption–desorption isotherms evolve towards a mixture of the Type I to the Type IV [
51]: (i) at low relative pressure, a sharp increase of the adsorbed volume is followed by a plateau which corresponds to type I isotherm, which is characteristic of microporous adsorbents; (ii) for relative pressure
p/
p0 comprised between 0.4 and 0.8, a triangular hysteresis appears and is followed by a plateau, which is characteristic of mesoporous adsorbents. Furthermore, this type of hysteresis is characteristic of samples consisting of agglomerates (a few tens of nm), these agglomerates being themselves composed of elementary spherical TiO
2 particles. Finally, for samples doped with nitrogen and co-doped with nitrogen and zirconium,
Vp values are higher than
VDR values (
Table 2), meaning that these samples have a microporous volume and a mesoporous volume. In
Figure 5A–D (TEM micrographs, see next section), it is possible to see that higher aggregates of TiO
2, nonexistent in
Figure 5C.
From the specific surface area,
SBET, it is possible to estimate the elementary TiO
2 particle size,
dBET, with Equation (2) (see
Section 3.7) by assuming elementary spherical and non-porous TiO
2 nanoparticles. The order of magnitude of
dBET is close to
dXRD values and
dTEM values (
Table 2).
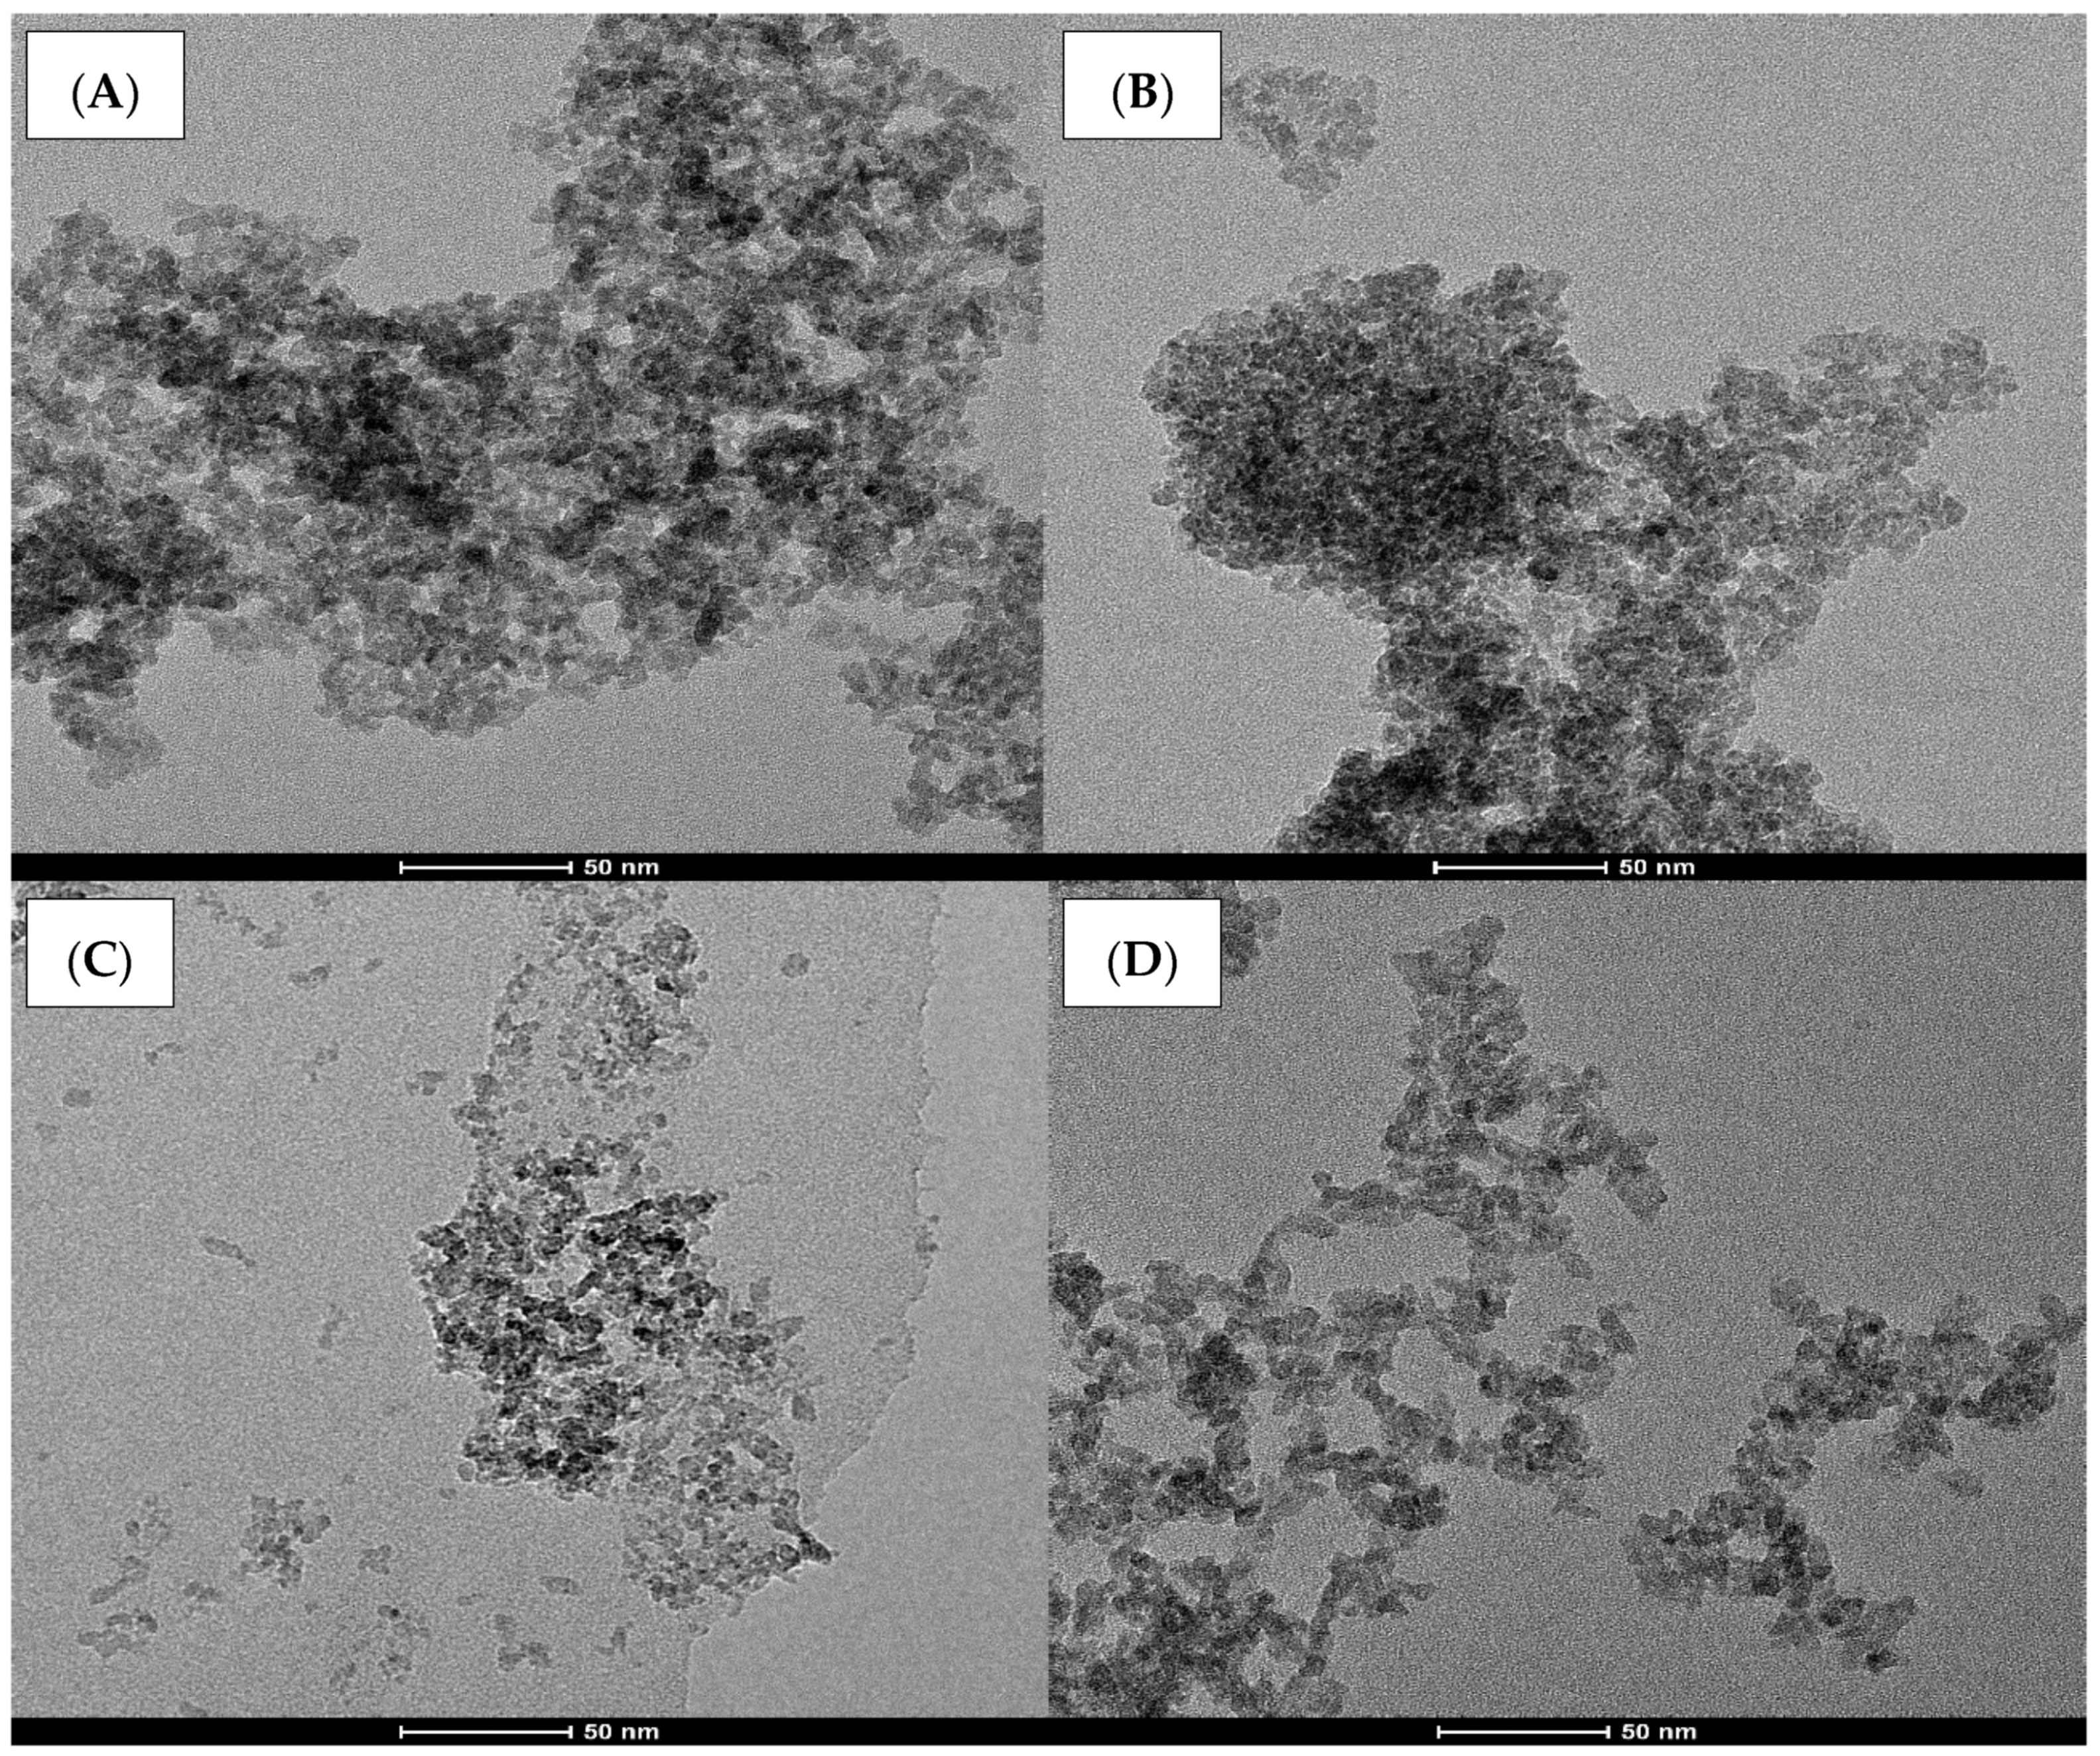
2.4. Morphology of Samples
The morphology of the N/Zr doped and co-doped TiO
2 samples was visualized with a transmission electron microscope and is shown for four samples in
Figure 5. The sample TiO
2/Zr2.8 (
Figure 5C) presents a spherical shape and uniform distribution of the elementary TiO
2 nanoparticles. For the other samples (
Figure 5A–D), higher aggregates (a few tens of nm) of TiO
2 particles are observed, these agglomerates being themselves composed of elementary spherical TiO
2 particles.
The size of elementary TiO
2 nanoparticles have been evaluated from TEM images on a series of fifty titania particles (
Table 2). For all samples, the particle size range is similar to those found by XRD,
dXRD, and from nitrogen adsorption–desorption isotherms,
dBET (
Table 2) [
27].
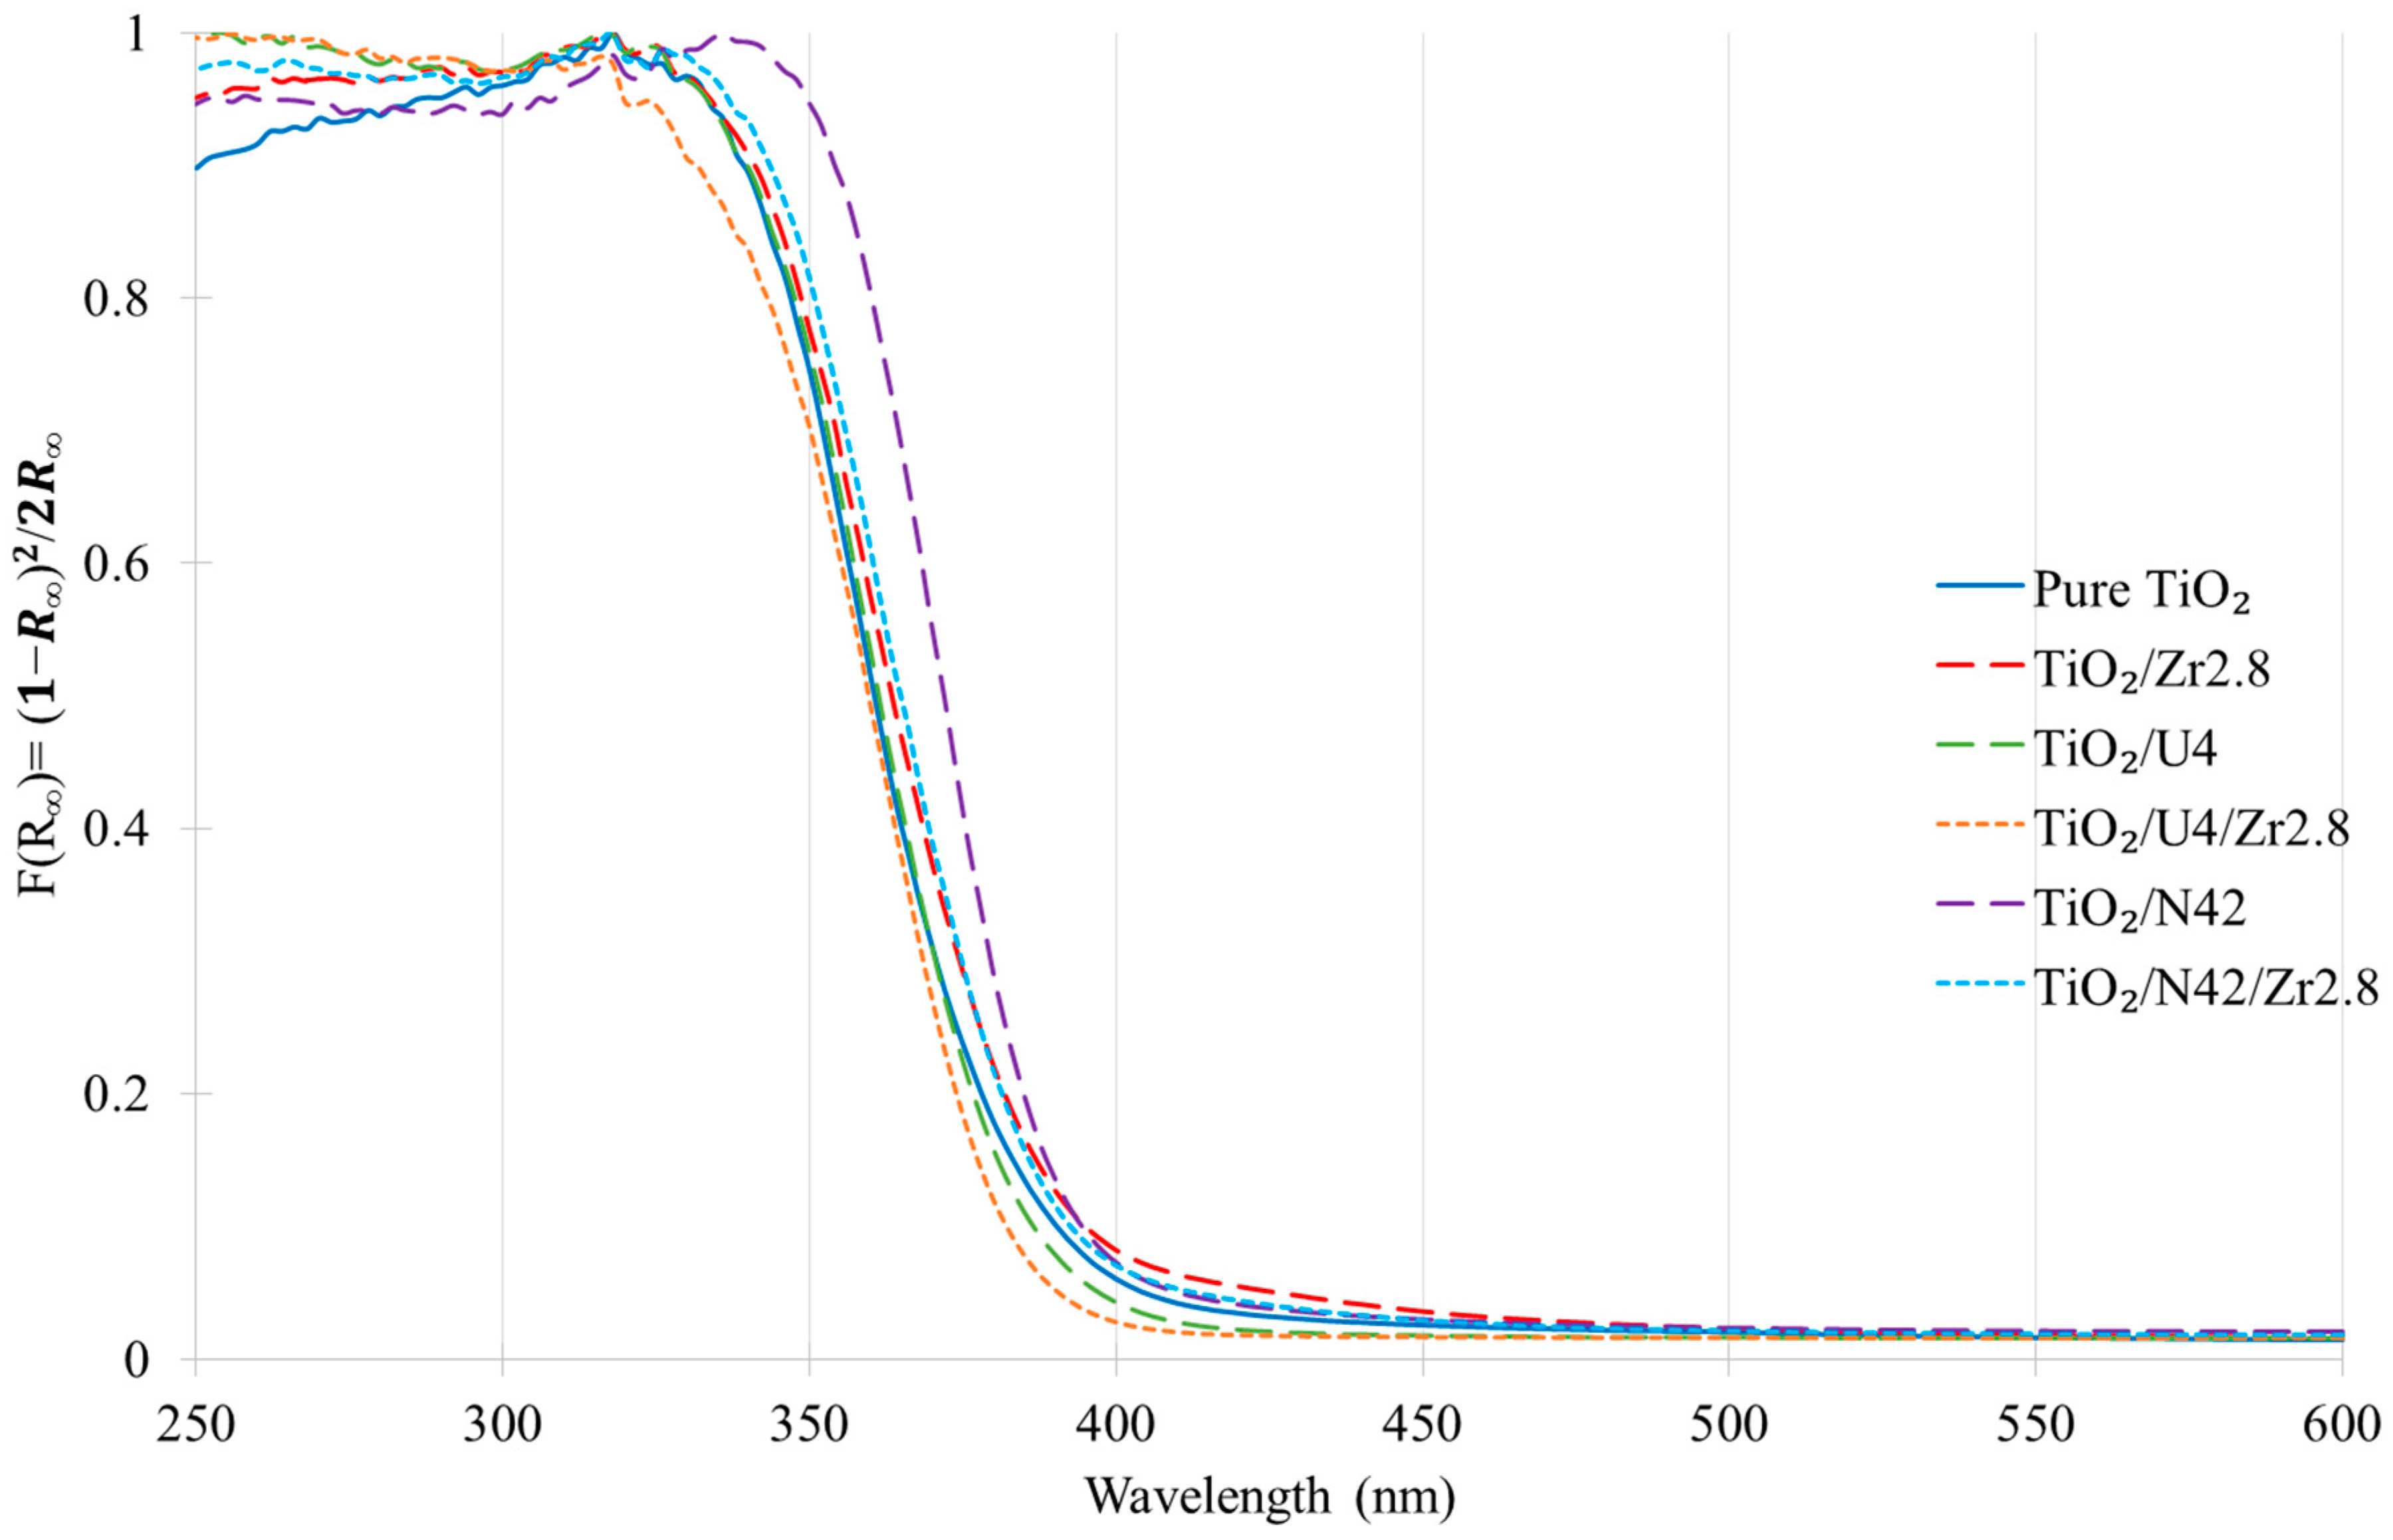
2.5. Optical Properties of Samples
The normalized Kubelka–Munk function is shown in
Figure 6 for pure TiO
2, TiO
2/Zr2.8, TiO
2/U4/Zr2.8, and TiO
2/N42/Zr2.8 samples.
The pure TiO
2 spectrum presents absorption around 365 nm. TiO
2/N42 sample presents a shift towards visible region compared to pure TiO
2, which can be explained by the insertion of N as already observed by Mahy et al. [
27] using this synthesis method.
The other samples show absorption spectra close to the pure TiO
2. Nevertheless, the obtained spectra were all very slightly shifted to the visible range (
Figure 6) and show slightly lower band gap values than pure TiO
2 (
Table 2), especially if it is compared to commercial Evonik P25 photocatalyst. Indeed, N-doping occurred with aqueous sol–gel synthesis using HNO
3 as peptizing agent [
14,
27] even for pure TiO
2 (see
Section 3.5), with as a consequence a positive effect on visible light activation.
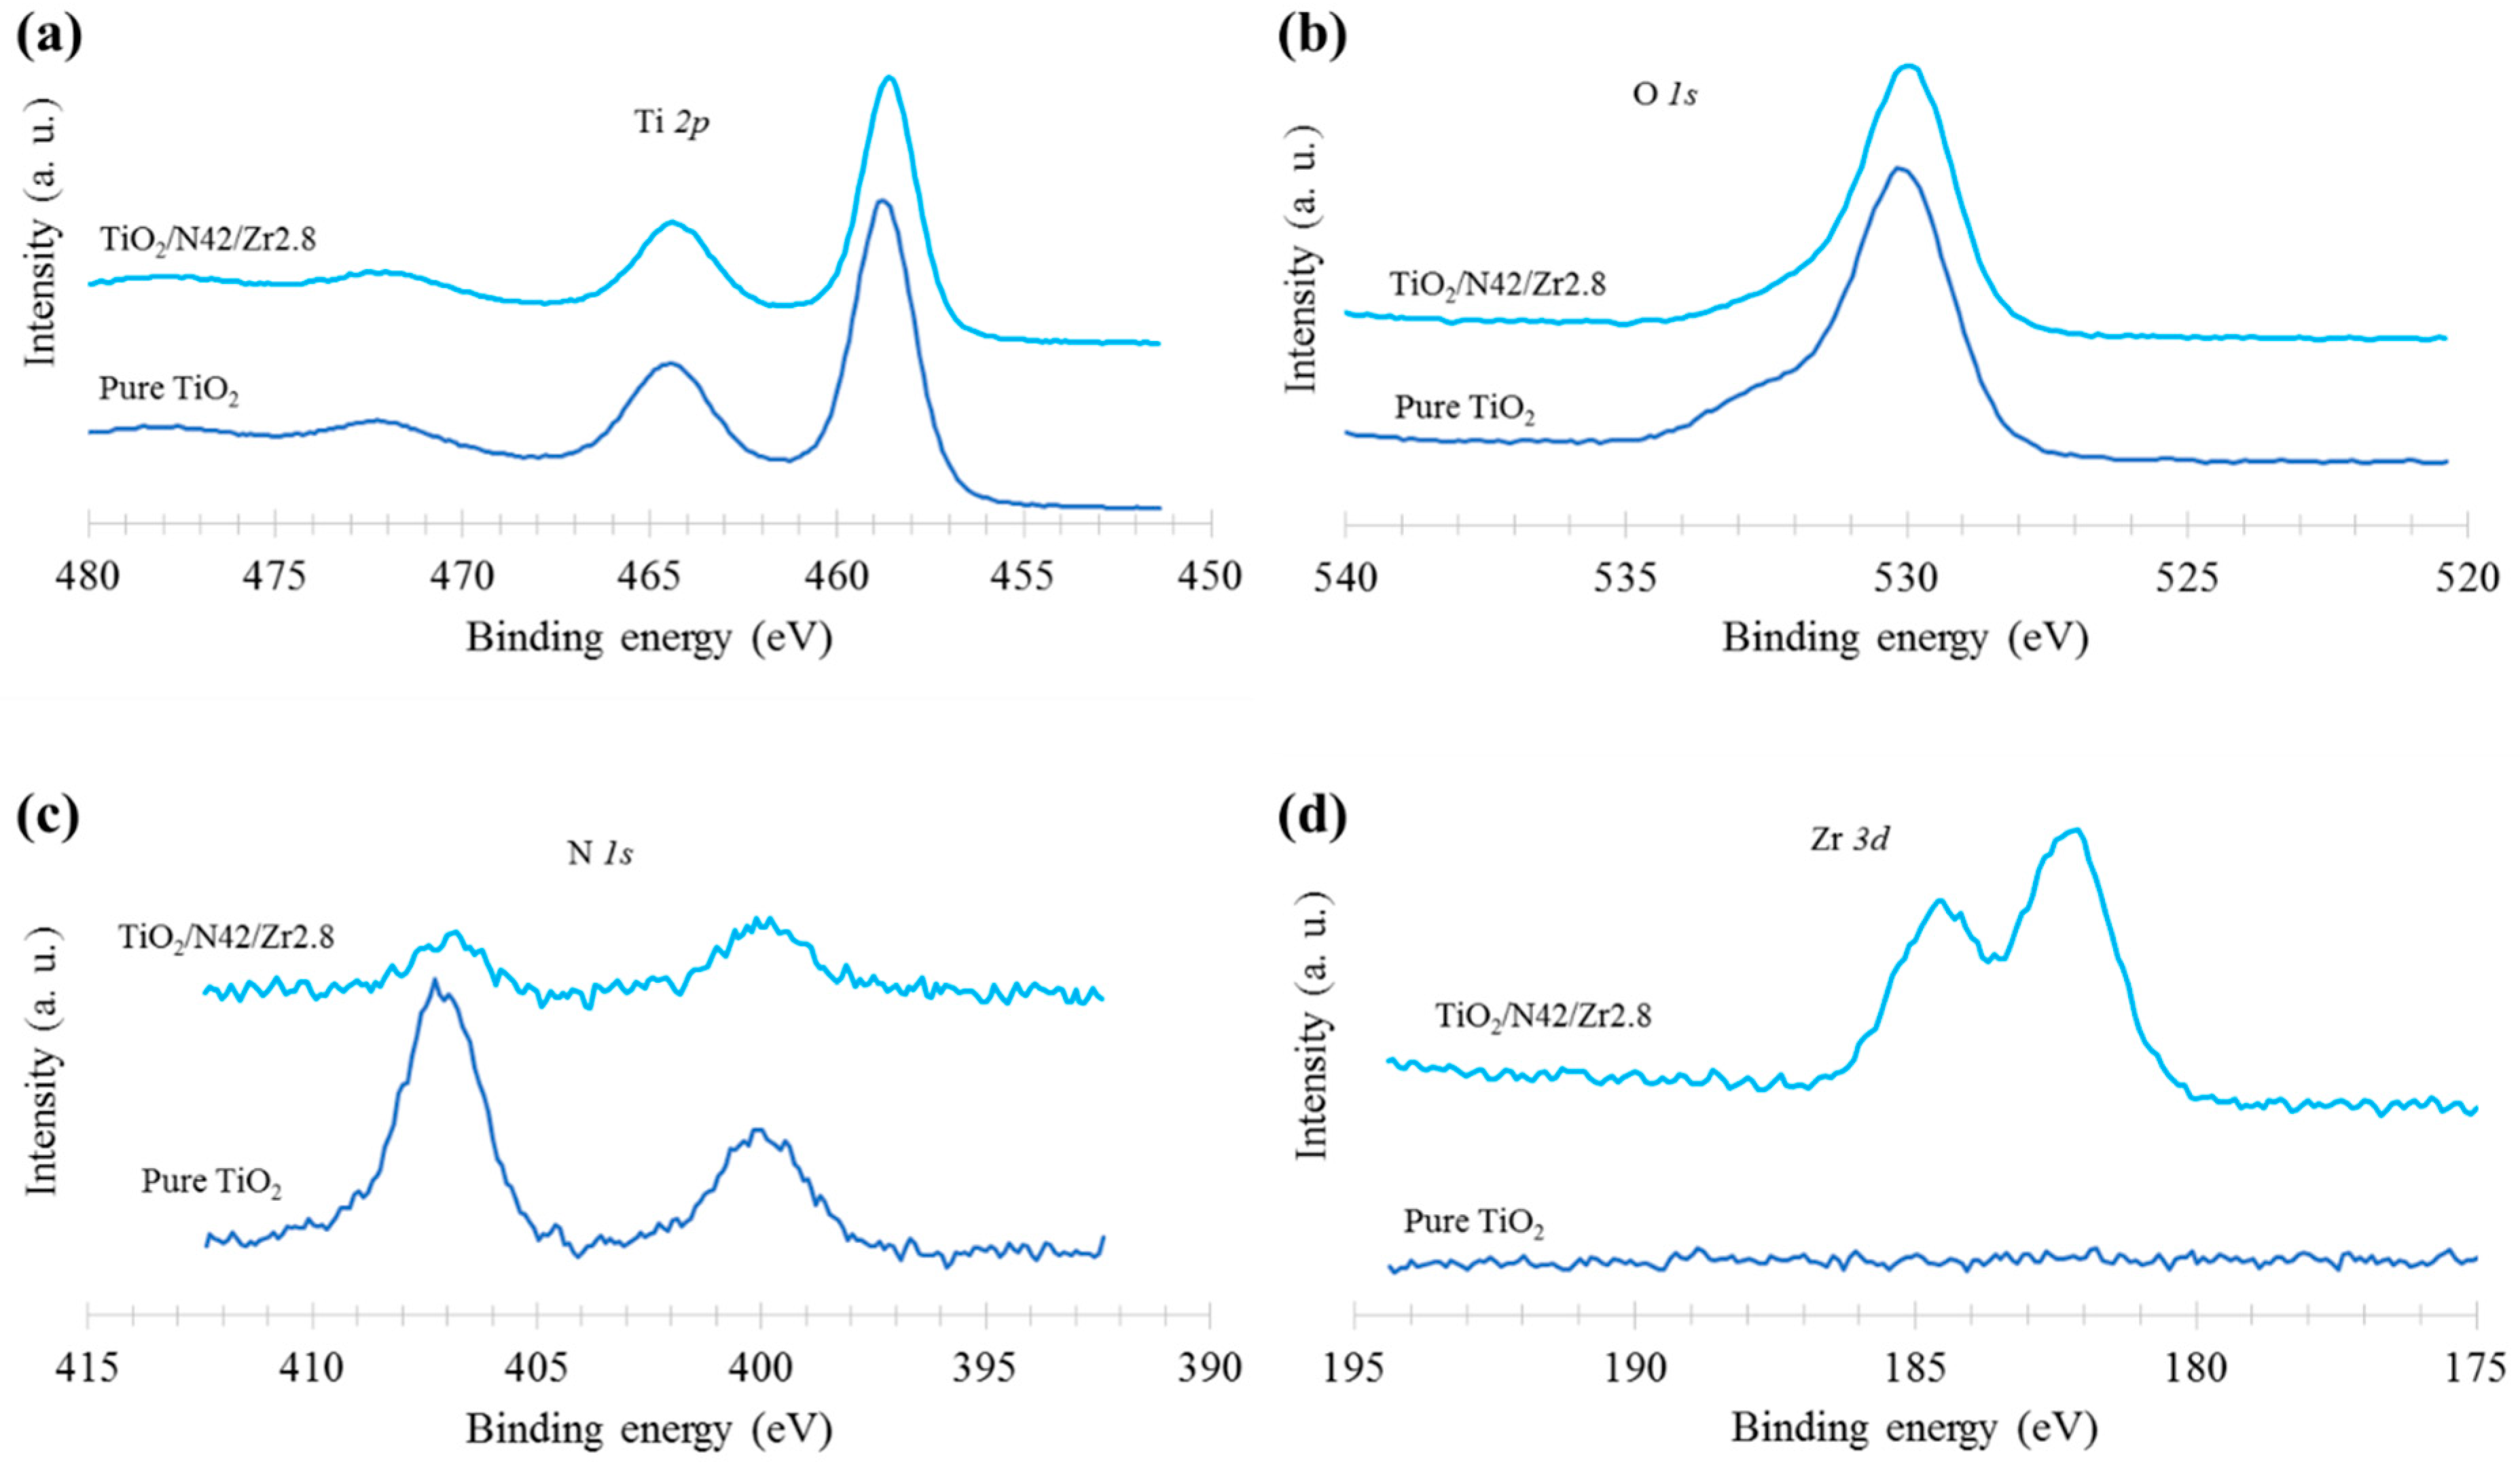
2.6. XPS Analysis
Ti
2p, O
1s, N
1s, and Zr
3d XPS spectra are shown in
Figure 7 for pure TiO
2 and TiO
2/N42/Zr2.8 samples shown as examples. Indeed, all the samples present similar XPS spectra.
On the Ti
2p spectra (
Figure 7a), for both samples, the Ti
2p1/2 and Ti
2p3/2 peaks are observed at 464.2 eV and 458.5 eV, respectively. They correspond to Ti
4+ species [
27,
52,
53] and therefore the expected TiO
2 [
14]. In
Figure 7b, the peak at 530.1 eV is linked to Ti-O bonds and is present for both samples [
14,
54]. In the same figure, a shoulder is present above 530 eV, but this information is hard to exploit because of the presence of foreign oxygen from carbonaceous contamination [
14].
For the N
1s spectra (
Figure 7c), two peaks are observed for both samples, at 400 eV and at 406.8 eV. The N
1s peak at 400.1 eV is linked to interstitial Ti-O-N bonds [
55,
56]. These bonds help absorption of visible light [
14]. This is coherent with the diffuse reflectance measurements (
Figure 6) where the spectra of the samples are shifted towards visible compared to the Evonik P25. The other peak (406.8 eV) is probably due to nitrates originating from residual HNO
3 from the synthesis as explained in [
14,
27].
For the Zr
3d spectrum of TiO
2/N42/Zr2.8 sample (
Figure 7d), peaks are visible at 182.0 eV and 184.6 eV that correspond to Zr
3d3/2 and Zr
3d5/2 electronic states [
14,
53,
57,
58]. They confirm the presence of ZrO
2. Hybrid TiO
2-ZrO
2 nanoparticles could be present, as shown in [
14,
53,
54,
59]. Indeed, TEM images do not highlight different morphologies between pure and Zr-(co)-doped TiO
2 samples, increasing the likeliness of a TiO
2-ZrO
2 mixed structure [
14].
The atomic ratios N/Ti and Zr/Ti estimated from XPS measurements for some samples are presented in
Table 3. The variation of the N/Ti ratio is low across the tested samples, so that similar amounts of nitrogen are present, at least at the surface. This corroborates the absorption spectra shown in
Table 2 and
Figure 6, in which the similarity between the samples is obvious. Nevertheless, the photoactivity of the samples with N doping (
Figure 8 and
Figure 9) increases with the doping, showing that the samples are different. It may be possible that the repartition of nitrogen is not homogeneous along the samples and, as previously observed [
60,
61], that some nitrogen signals are not detected by XPS as it is a surface analysis.
The Zr/Ti ratio increases with the Zr doping percentage, as expected. This ratio was also obtained from ICP-AES results (
Table 1). The values match each other relatively well, despite slightly lower values for the ICP results. Indeed, it seems that less ZrO
2 is present in the bulk of the samples, as previously observed with this type of synthesis [
14]. It may be assumed that the titanium (IV) tetraisopropoxide (TTIP-TiO
2 precursor) is more reactive than the zirconium tert-butoxide (ZrO
2 precursor) in the conditions of the synthesis, leading to higher proportions of ZrO
2 on the surface.
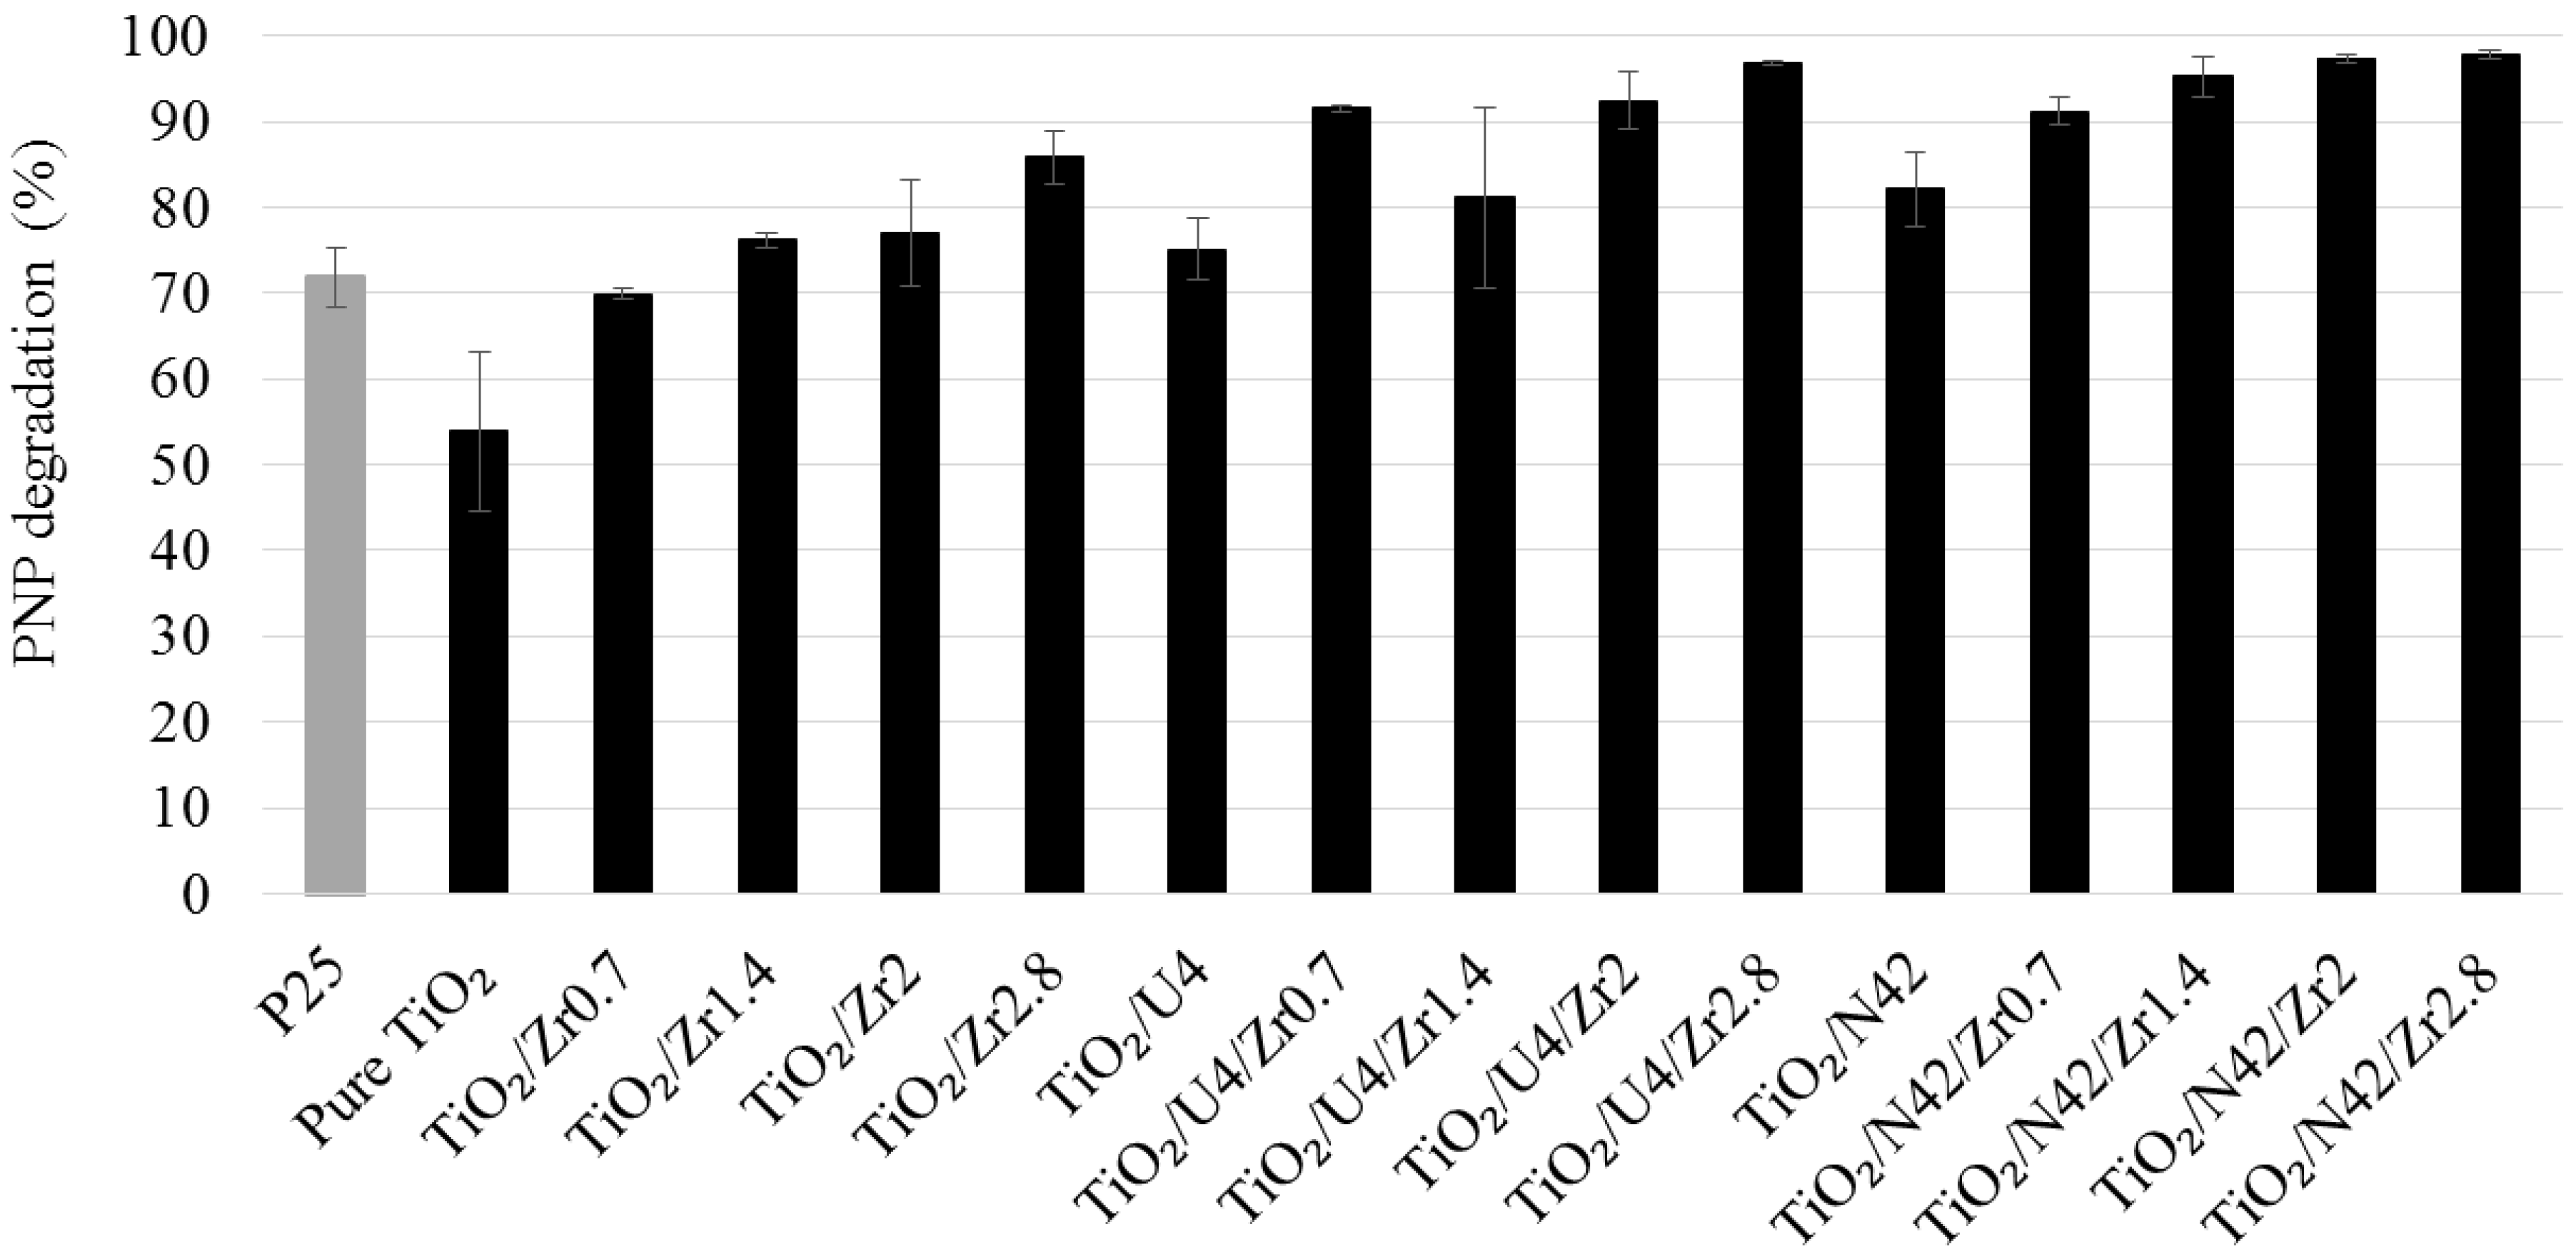
2.7. Photocatalytic Activity
2.7.1. Experiments under UV–Visible Light
For all samples,
Figure 8 shows the photocatalytic degradation of PNP under UV/visible light after 8 h of illumination. In the dark, no adsorption of PNP on the samples occurred, as observed in previous studies [
14,
27,
61]. All doped and co-doped samples showed a higher degradation efficiency than pure TiO
2 sample. The degradation efficiency of PNP increases with increasing Zr content in the sample: from 68% for the TiO
2/Zr0.7 sample, to 84% for the TiO
2/Zr2.8 sample. PNP degradation percentage also increases with increasing Zr content in the TiO
2/U4/Zr series, starting from 90% for TiO
2/U4/Zr0.7 sample to 96% for the highest doping (TiO
2/U4/ Zr2.8 sample). For the TiO
2/N42/Zr series, the yield also increases from 90% for TiO
2/N42/Zr0.7 sample to 96% for TiO
2/N42/Zr2.8 sample.
The increase in performance under UV–visible light with Zr/N co-doping can be linked to the modification in crystallinity between pure, doped, and co-doped samples (
Table 1) due to the introduction of dopants. Indeed, the distribution between anatase, brookite, and amorphous phase changes with the introduction of dopant. This difference in phase distribution can lead to compositions where a synergetic effect can enhance the photoactivity as for Evonik P25 commercial catalyst [
27]. Moreover, it was also shown that the formation of a mixed oxide TiO
2-ZrO
2 could increase the lifetime of “e
−h
+” pairs [
14]. In this study, the XPS spectra show the formation of ZrO
2 at the surface of the TiO
2 lattice (
Figure 7d). When the Zr-doped TiO
2 photocatalysts are illuminated with UV/visible light, some photogenerated charges (“e
−h
+” pairs) can be delocalized on the ZrO
2, increasing the lifetime of the pair [
14].
As the photocatalysts are illuminated by UV light, the N doping has a slight influence on the PNP degradation activity. However, the co-doped N/Zr TiO2 photocatalysts present higher values for PNP degradation (80–98%) than the commercial Evonik P25 (70%).
2.7.2. Experiments under Visible Light
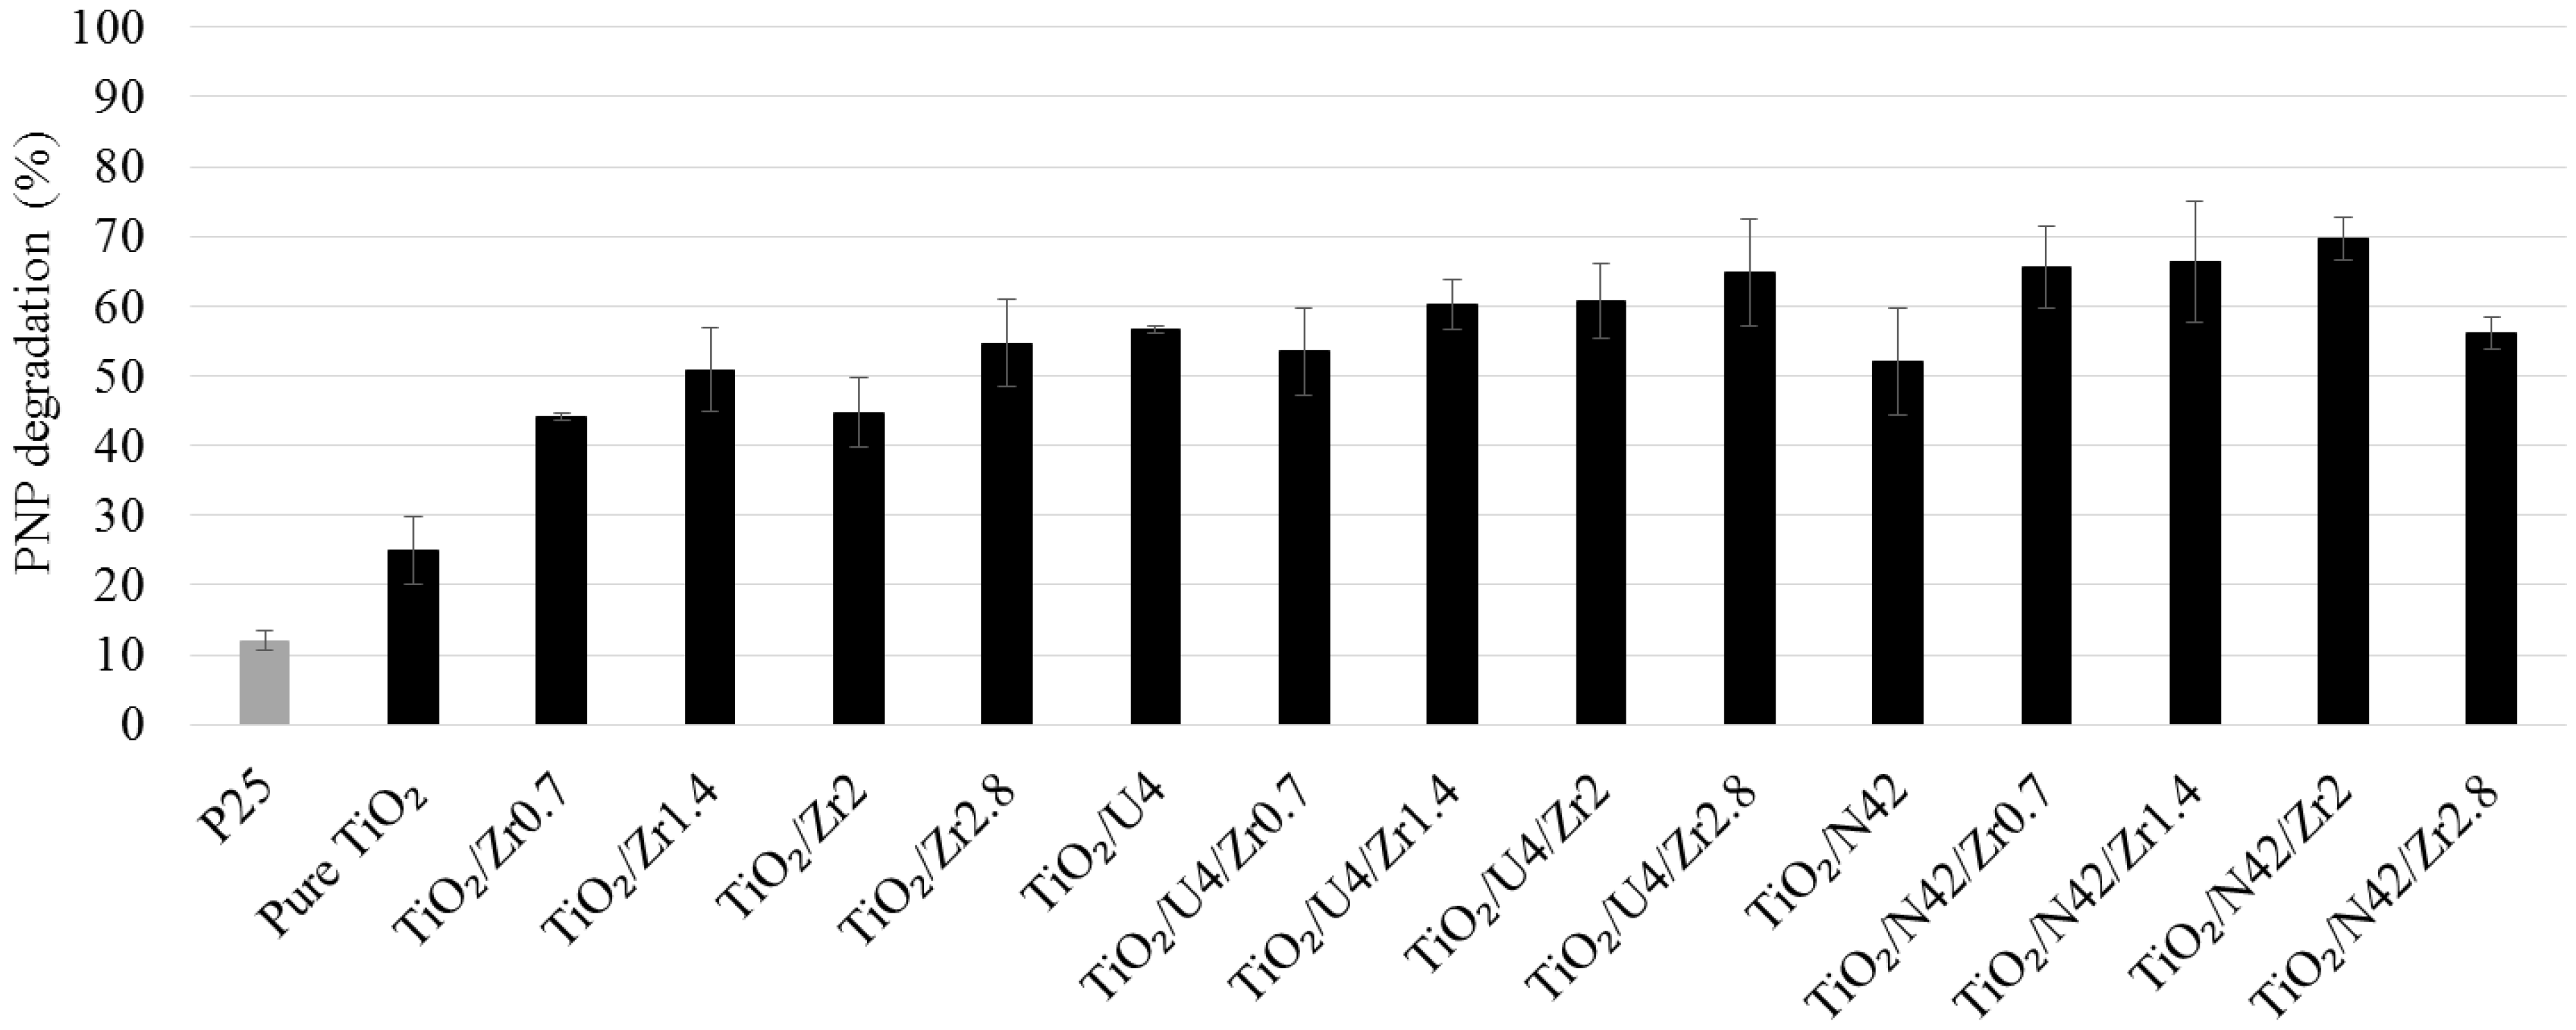
Figure 9 shows the photocatalytic activity of the samples after 24 h of illumination under visible light (>400 nm). The commercial Evonik P25 photocatalysts shows only 10% of PNP degradation against 25% for pure TiO
2 sample. TiO
2 samples doped with urea (TiO
2/U4 sample) and triethylamine (TiO
2/N42 sample) present a PNP degradation of 56% and 52%, respectively. As all aqueous sol–gel samples are doped with nitrogen (
Figure 7), this doping leads to an increased visible light absorption compared to Evonik P25 sample (
Figure 6), and so a higher photoactivity under illumination by visible light. Similarly, the degradation for Zr single doping increases from 44% for TiO
2/Zr0.7 sample to 54% for TiO
2/Zr2.8 samples. Indeed, as for UV/visible experiments, the Zr-doping can modifiy the crystallinity of the samples to produce synergetic compositions with higher photoefficiencies, and the formation of TiO
2-ZrO
2 mixed oxide can enhance the charge separation and so, the photoefficiency.
The best photocatalytic activities for PNP degradation are obtained with the co-doped samples. Indeed, TiO2/U4/Zr0.7 sample gives a PNP degradation of 52%, while it increases up to 64% for TiO2/U4/Zr2.8 sample. Similarly, TiO2/N42/Zr0.7 sample presents a photocatalytic activity of 64%, and this activity reaches 68% for TiO2/N42/Zr2 sample.
Therefore, the doping of TiO
2 with Zr and N atoms could be used to increase the photocatalytic activity of TiO
2 in the visible range [
41]. Indeed, the sensitivity to visible light of N/Zr/TiO
2 powders is caused by (i) N-doping from urea and triethylamine precursors by forming an intermediate energy level, and by (ii) Zr-doping, which increases the lifetime of “e
−h
+” pairs.
Concerning N-doping, when the interstitial nitrogen doping model is assumed, the nitrogen atoms are bonded to one or more oxygen atoms and are thus in any of the oxidation states corresponding to either NO
−, NO
2−, or NO
3−. The uncoupled electrons are distributed around the N and O atoms in these moieties. As a result, the incorporation of nitrogen into the TiO
2 lattice leads to the formation of a new energy state, i.e., the N
2p band above the O
2p valence band, which shifts the optical absorption of TiO
2 to the visible light region [
43]. Furthermore, in this work, in addition to the N-doping from urea and triethylamine precursor, the activity under visible light for pure TiO
2 is probably due to the N-doping with the use of nitric acid for synthesis as shown in [
14,
27]. A ligand to metal charge transfer complex between the organic moieties and Ti(IV) ions cannot be excluded and could account for the improvement of photocatalytic properties of TiO
2/U4 samples [
62].
In this study, Zr-doping is useful to improve the lifetime of electrons and holes produced by photoactivation [
43]. Indeed, Zr
4+ sites trap electrons more efficiently than Ti
4+ sites, and the presence of vacant oxygen sites facilitates the transport of charge carriers to the reactive surface sites [
41]. In addition, the valence band of TiO
2 is more stabilized with a Zr
4+ doping because Zr
4+ is more electropositive than Ti
4+ [
43].
The three precursors used in this work (urea, triethylamine, and zirconium tert-butoxide) show that the photocatalysts obtained at low temperatures, appear to be efficient photocatalysts under visible light and may offer promising prospects for the clean-up of water pollution and the degradation of organic pollutants.
2.7.3. Recyclability under Visible Light
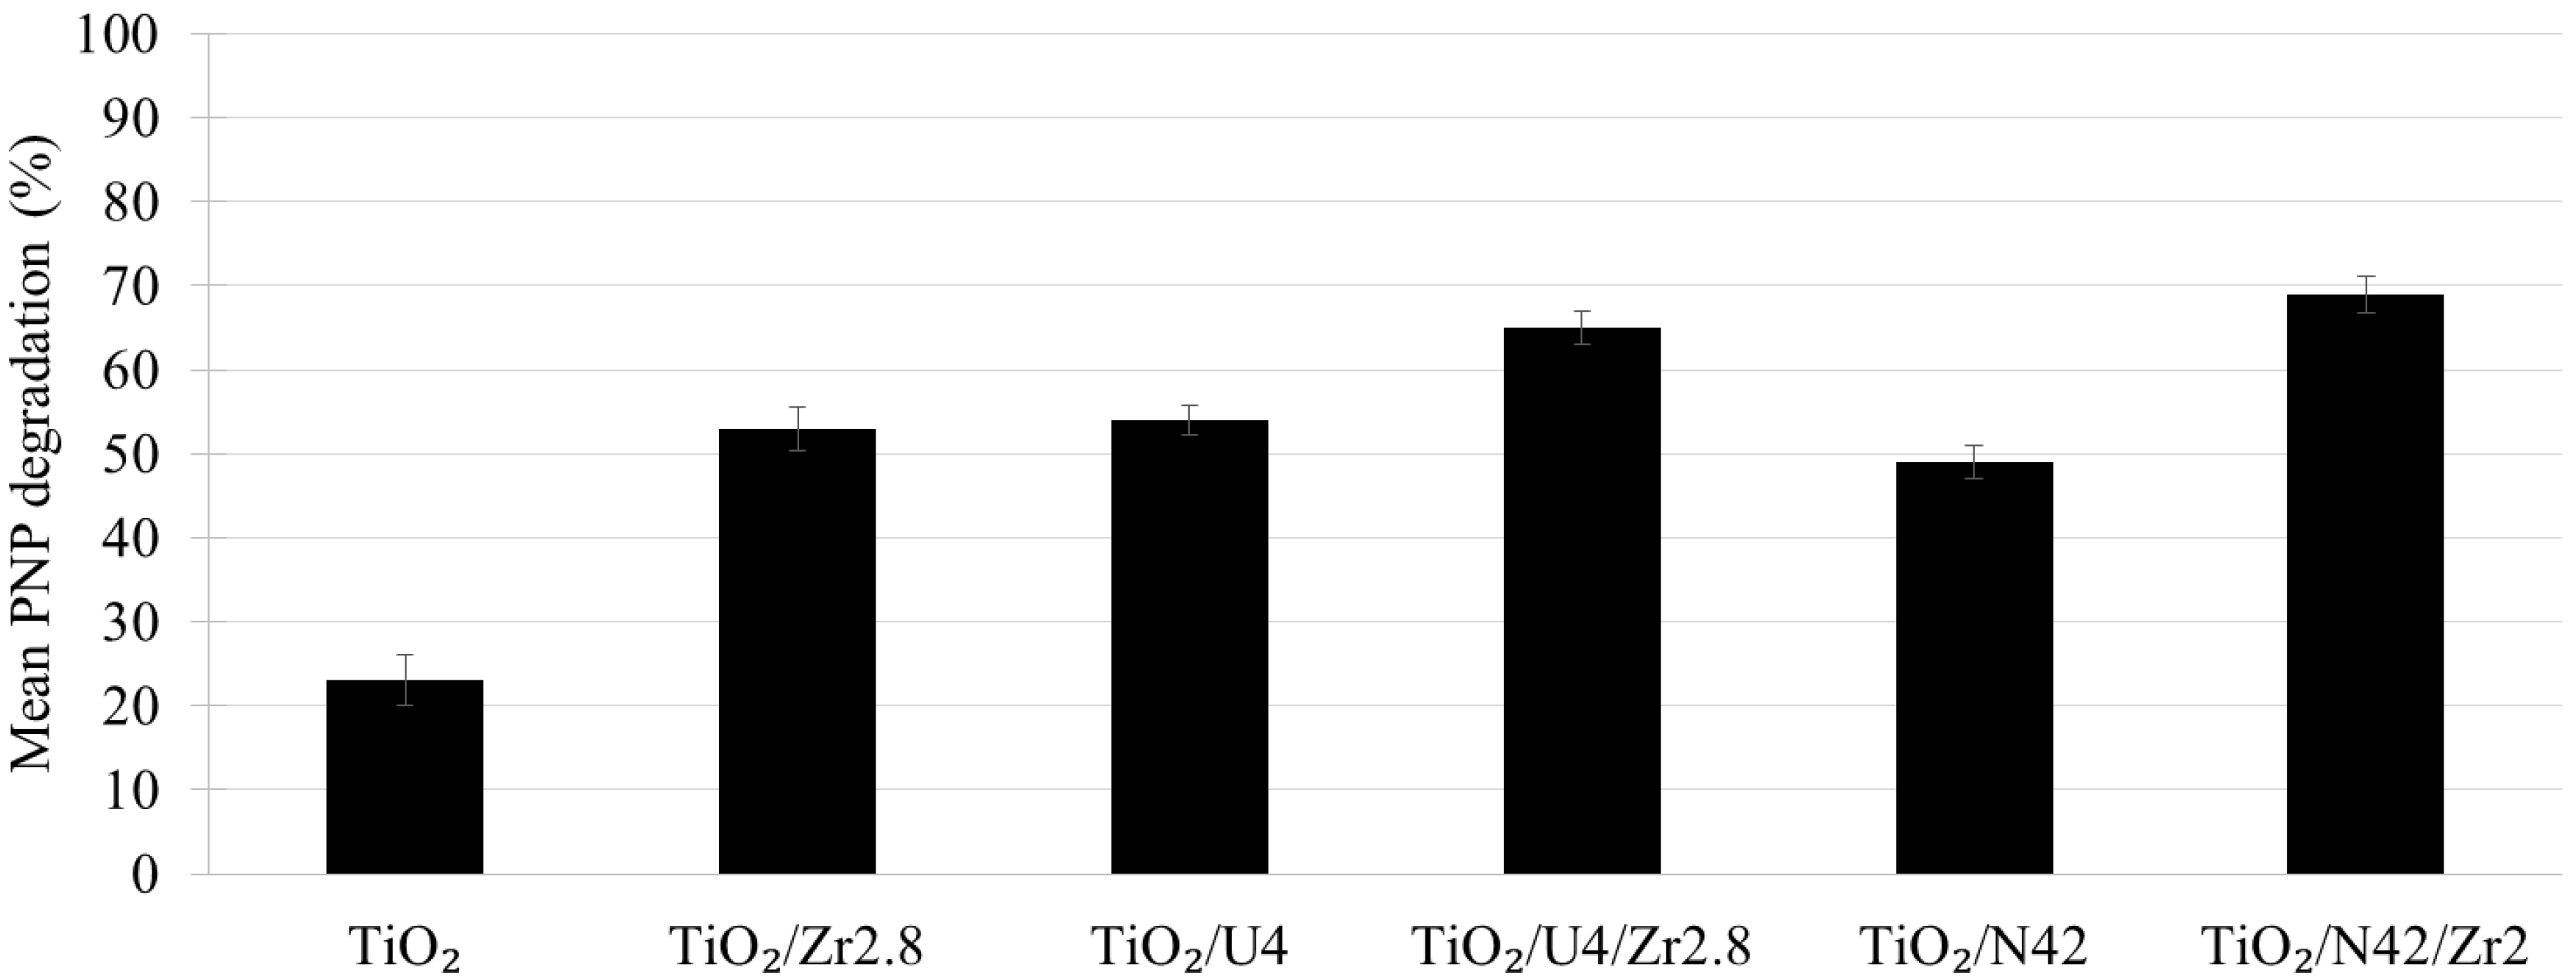
The recyclability under visible light was evaluated for six samples: pure TiO
2, TiO
2/Zr2.8, TiO
2/U4, TiO
2/U4/Zr2.8, TiO
2/N42, and TiO
2/N42/Zr2. The samples with the best photoactivity from each series were chosen. The mean activity after 3 recycling cycles (96 h of illumination) is represented on
Figure 10. The stability of the activity is maintained for all samples as already observed previously with titania made by aqueous sol–gel process.
2.8. Photoluminescence Study
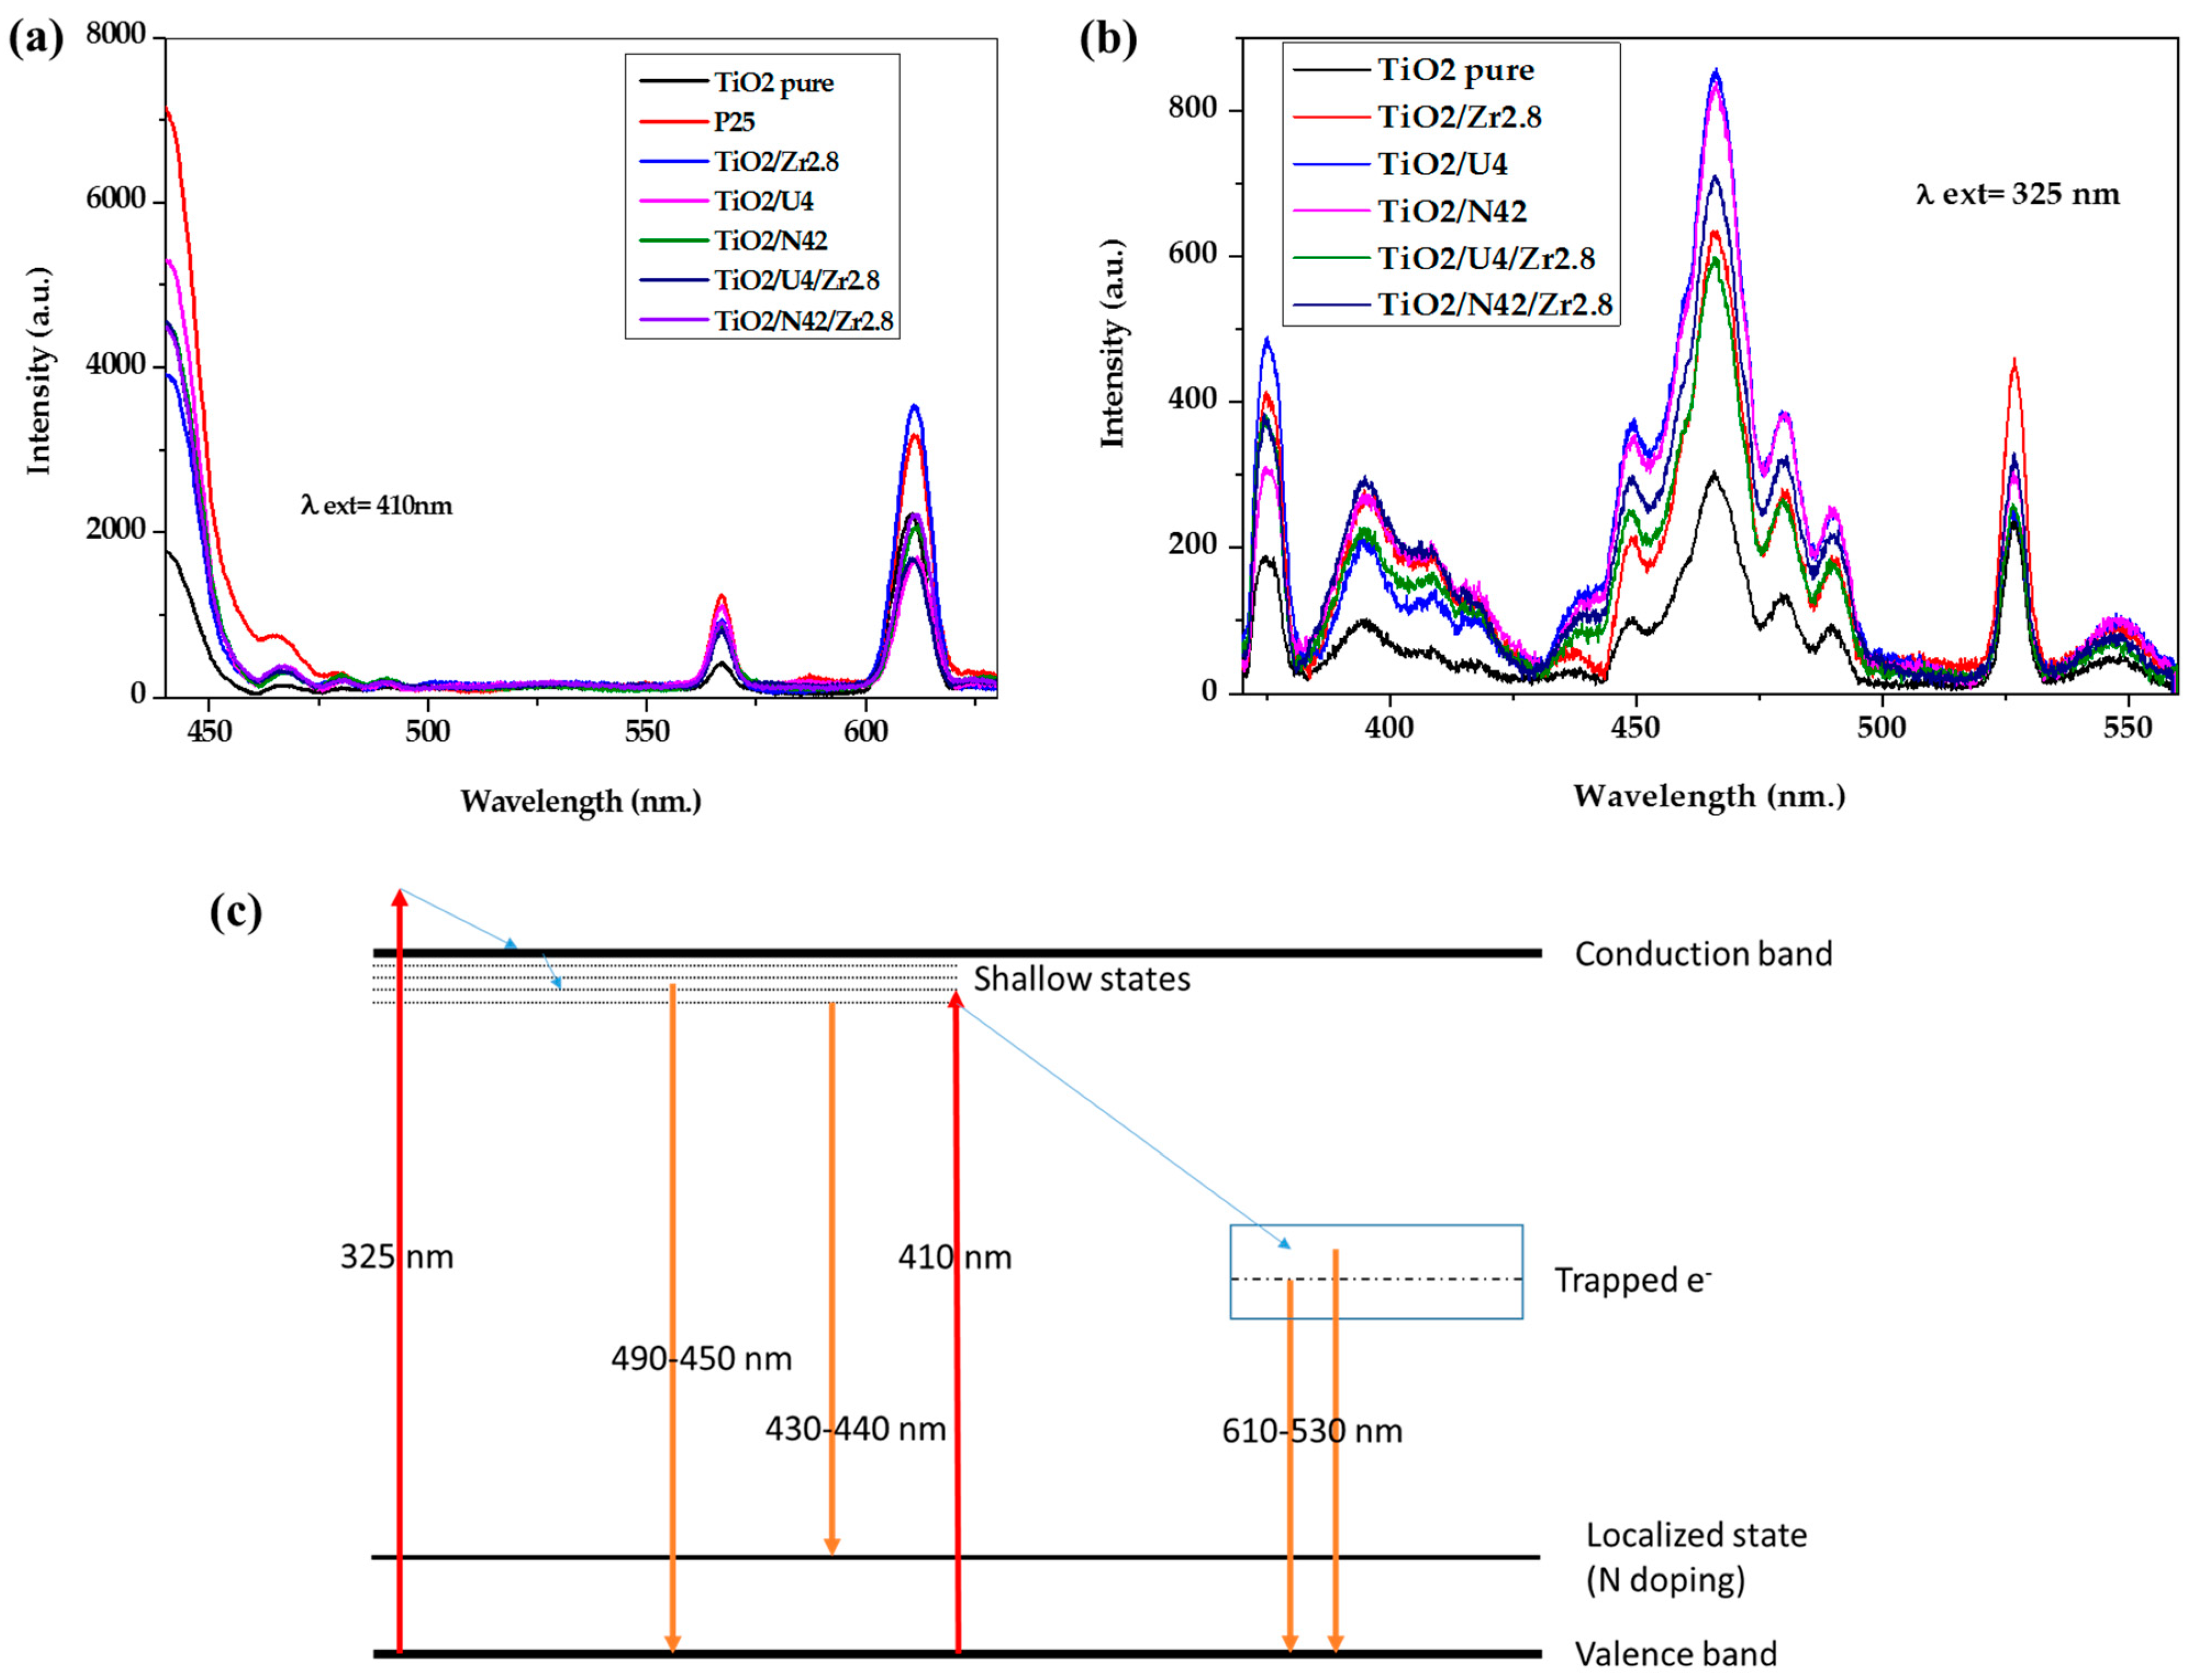
Photoluminescence (PL) spectra are represented on
Figure 11 for the six samples representative of this study and for the commercial Evonik P25. The spectra were obtained after an excitation at 325 nm and 410 nm.
At 410 nm (
Figure 11a), the excitation of 3.02 eV is mostly below TiO
2’s band gap. The peaks at 610 nm and 570 nm correspond to relaxation of trapped electrons to the valence band [
63]. The oxygen vacancies are responsible for this trapping process [
64]. Comparing the pure and Zr-doped sample shows that a lot of those vacancies are created by the dopant.
When the sample is excited at 325 nm (
Figure 11b), the energy is sufficient to clear the band gap. The numerous peaks between 450 and 500 nm should correspond to relaxation of electrons in shallow states [
63]. Finally, the shoulder at around 440 nm is present only for N-doped samples, indicating that a different localized energy state exists. The energy corresponding to 440 nm, i.e., 2.82 eV, indicates that this state is a few tenths of eV above the valence band.
Figure 11c represents the different possible electronic transitions in TiO
2 samples
The role of Zr in the increase of photocatalytic activity could be to trap the electrons, thus increasing the lifetime of holes. The same phenomenon explains why the peaks between 450 nm and 490 nm decrease in height when doped with Zr: the e− traps decrease the number of electrons available in the shallow states between the conduction band, responsible for these peaks. On the other hand, doping with nitrogen decreases the band gap. The number of vacancies is reduced by the use of urea, but is unchanged in TiO2/N42 samples compared to pure TiO2. This could explain why the TiO2/N42 samples perform slightly better than the TiO2/U4 ones. However, the difference is too small to draw a definitive conclusion of the difference between those mechanisms.
3. Materials and Methods
3.1. Pure TiO2 Synthesis
The TiO2 powder is prepared by the sol–gel method, in which 250 mL of deionized water acidified with nitric acid (HNO3, 65%, Merck, Darmstadt, Germany) at pH of 1 is introduced into a flask stirred at 700 rpm in a bath thermostatically controlled at 80 °C. 36.08 mL of titanium (IV) tetraisopropoxide (TTIP, >97%, Sigma-Aldrich, St. Louis, MO, USA), is added to 15.1 mL of isopropanol (IsoP, 99.5%, Acros, Hull, Belgium) at 25 °C and stirred for 30 min, then the TTIP-IsoP mixture is added dropwise to the thermostatically controlled flask, and left under stirring for 24 h in the closed flask. After this reaction time, the obtained sol is dried in ambient air; the obtained powder is crushed and used as such for further processing.
3.2. Urea-TiO2 Powder Synthesis
The urea-doped powder is prepared using the same method as pure TiO
2 synthesis except that a mass (proportional to the desired molar concentration) of urea (NH
2-C(O)-NH
2 98%, Sigma-Aldrich, St. Louis, MO, USA) is also included in the 250 mL of deionized water under stirring before acidifying to
pH of 1. The molar ratio between TTIP and urea is equal to 4. It corresponds to the TiO
2/U4 sample described by Mahy et al. in [
27].
3.3. Triethylamine-TiO2 Doped Powder Synthesis
The powder doped with triethylamine is prepared with the same method as pure TiO
2 synthesis except that, once the sol is obtained after 24 h of stirring, 699 mL of triethylamine is added (in excess) to the pure TiO
2 suspension. The whole mixture is then left under magnetic stirring for 24 h. The samples containing triethylamine are denoted with “N42”, corresponding to the molar ratio between triethylamine and TTIP [
27].
3.4. Zr-TiO2 Powder Syntheses
The powders doped with the zirconium precursor are prepared using also the same method as pure TiO2 synthesis except that a mass (proportional to the desired molar concentration) of zirconium tert-butoxide (98%, Sigma Aldrich, St. Louis, MO, USA) is also added in the TTIP-isopropanol mixture. After 24 h of stirring in the thermostatically controlled flask, the samples are dried in the same way as the pure TiO2 powder. Four Zr-doping molar percentages are studied: 0.7, 1.4, 2, and 2.8 mol%. The samples are designated as TiO2/ZrX, where X is the amount of dopant.
3.5. Urea/Zr/TiO2 Co-Doped Powder Synthesis
The co-doping of TiO
2 with urea and the zirconium precursor is done by a combination of the two doping methods applied by Mahy et al. [
14,
27]. Urea (28.4 g) is introduced into 250 mL of distilled water then acidified with HNO
3 to a pH of 1. At the same time, the calculated quantity of zirconium tert-butoxide (98%, Sigma Aldrich, St. Louis, MO, USA) is added to the TTiP-Isop mixture and left under stirring for 30 min until homogeneous mixing. At the end, the solution containing Isop-TTIP-Zr is added to the deionized urea water, followed by 24 h of stirring at 80 °C and 700 rpm. A white sol is obtained and dried in ambient air until a white powder is recovered. This powder is crushed then dried for 1 h under vacuum at 100 mbar, then rinsed with distilled water and centrifuged for 15 min. This rinsing is repeated 3 times and the obtained pellets are finally dried under vacuum at 100 °C and 100 mbar. The molar ratio between TTIP and urea is equal to 4 [
27], and the zirconium precursor molar percentages are varied between 0.7, 1.4, 2, and 2.8 mol%.
3.6. Triethylamine/Zr/TiO2 Co-Doped Powder Synthesis
The co-doping of TiO
2 with triethylamine and the zirconium precursor is done by a combination of the two doping methods applied by Mahy et al. [
14,
27]. Like the urea co-doping, the triethylamine co-doping is adapted by saturating each sol of the zirconium precursor (0.7, 1.4, 2, and 2.8 mol%) with triethylamine as described above. The molar ratio between triethylamine and TTIP is equal to 42 [
27]. The rinsing and drying is done in the same way as the urea/Zr/TiO
2 powder.
3.7. Material Characterization
The sample composition is determined by inductively coupled plasma-atomic emission spectroscopy (ICP-AES), equipped with an ICAP 6500 THERMO Scientific device (Waltham, MA, USA).). The analysis protocol is fully detailed in [
14].
The crystallographic properties are studied through X-ray diffraction (XRD) patterns from 10° to 70° with a Bruker D8 Twin-Twin powder diffractometer using Cu-Kα radiation (Bruker, Billerica, MA, USA). The Scherrer formula (Equation (1)) is used to determine the size of TiO
2 crystallites,
dXRD:
where
dXRD is the crystallite size (nm),
B is the total width of the peak at half its maximum value after correction for instrumental broadening (rad),
λ is the X-ray wavelength (0.154 nm), and
θ is the Bragg angle (rad).
The TOPAS software [
65] was used to fit the diffractograms in order to estimate the percentages of crystalline phases. The structure parameters for the anatase and brookite phases were taken from the PDF 04-007-0701 and 04-007-0758 references (ICCD PDF4+ database), and the fundamental parameters approach [
65] was used to model the instrumental contribution to the reflection profiles. The amount of amorphous TiO
2 was estimated through the same procedure using an internal standard of CaF
2 (calcium fluoride, Sigma-Aldrich, anhydrous powder, 99.99% trace metals).
The textural properties of the samples are characterized by nitrogen adsorption–desorption isotherms in an ASAP 2420 multi-sampler device from Micromeritics. From these isotherms, the microporous volume is calculated using Dubinin–Radushkevich theory (
VDR) [
51]. The specific surface area is evaluated using the theory of Brunauer, Emmett, and Teller (
SBET) [
51]. The mean particle size,
dBET, can be estimated from the
SBET values by assuming spherical and non-porous nanoparticles of anatase TiO
2 using the following formula [
66]:
where
ρanatase is the apparent density of anatase TiO
2 estimated as 3.89 g cm
−3.
X-ray photoelectron spectra are obtained with a SSI-X-probe (SSX-100/206) spectrometer equipped with a monochromatized microfocused Al X-ray source (1486.6 eV), operating at 10 kV and 20 mA. Samples are placed in the analysis chamber where the residual pressure was about 10
−8 Pa. The following sequence of spectra is recorded: survey spectrum, C
1s, O
1s, N
1s, Ti
2p, Zr
3d, and again C
1s to check the stability of charge compensation with time and absence of degradation of the samples [
14].
The C- (C, H) component of the carbon C
1s peak is fixed at 284.8 eV to calibrate the scale in binding energy. Three other components of the carbon peak (C-(O, N), C=O or O-C-O, and O-C=O) have been resolved, notably to determine the amount of oxygen involved in the carbon contamination [
14]. Data processing is carried out with the CasaXPS program (Casa Software Ltd., Teignmouth, UK). The spectra are decomposed using the Gaussian and Lorentzian function product model (least squares fitting) after subtraction of a nonlinear Shirley baseline [
14,
67].
The optical properties of the sample are evaluated using diffuse reflection spectroscopy measurements in the 250–600 nm region with a Perkin Elmer Lambda 1050 S UV/VIS/NIR spectrophotometer, equipped with a spectralon coated integrating sphere (150 mm InGaAs Int. Sphere from PerkinElmer. Waltham, MA, USA) and using Al
2O
3 as reference. UV–Vis spectra, recorded in diffuse reflectance mode (
R sample), are transformed using Kubelka–Munk function [
27,
68,
69] to produce a signal, normalized for comparison between samples, and thus to calculate the band gap (direct and indirect ones). The details of this processing method are described in more details in [
27,
66].
Transmission electron microscopy (TEM) images were obtained with a FEI TEM-LaB6 TECNAI G2 microscope with a tungsten filament electron gun operating at 200 kV. The powders are dispersed in deionized water and sonicated for 15 min. Then, a drop of the dispersion is placed on a copper grid (Formvar/Carbon 200 Mesh Cu from Agar Scientific, Essex, UK) for observation.
The photoluminescence measurements were performed at room temperature using Shimadzu RF-6000 fluorimeter equipped with xenon excitation source. All emission spectra are obtained with a good spectral resolution of the detector.
Fourier Transform Infrared Spectroscopy (FTIR) was carried out using a 630 Cary infrared spectrometer (400 to 4000 cm−1, Agilent, Santa Clara, CA, USA) in order to characterize the surface functional groups of the powders.
Thermogravimetric analyses were performed on a thermal analyzer SETARAM LabSysEvo1600 (KEP Technologies, Mougins, France) until 700 °C under air.
3.8. Photocatalytic Experiments
The photocatalytic activity of powders is evaluated by following the degradation of
p-nitrophenol (PNP) after 8 h under UV–visible light and after 24 h under visible light, in triplicate, in an aqueous medium. For each test, the degradation percentage of PNP, (
DPNPi), is given by Equation (3) [
27]:
where [
PNP]
i represents the residual concentration of PNP at time
t = i h and [
PNP]
0 represents the initial concentration of PNP at time
t = 0 h [
14].
The experimental set-up is described in a previous study [
14,
27]. The
DPNP8 is evaluated after 8 h under UV/visible light, thanks to a halogen lamp with a continuous spectrum from 300 to 800 nm (300 W, 220 V) measured with a Mini-Spectrometer TMUV/Vis C10082MD from Hamamatsu [
14]. The PNP degradation (
DPNP24) under visible light is evaluated after 24 h with the same halogen lamp covered by an UV filter that removes wavelengths shorter than 390 nm [
14]. The residual concentration of PNP is measured by UV/Vis spectroscopy (GENESYS 10S UV–Vis from Thermo Scientific, Waltham, MA, USA) at 318 nm [
14]. For each tested catalyst, three flasks containing the catalytic powder are exposed to light to calculate the PNP degradation, and one is kept in the dark to evaluate PNP adsorption on the sample. In each flask, the initial concentrations of catalyst (if present) and PNP are equal to 1 g/L and 10
−4 M, respectively [
14]. The volume of each flask is equal to 10 mL, and the flasks are agitated by a magnetic stirrer. Experiments are conducted in test tubes closed with a sealing cap. These tubes are placed in a cylindrical glass reactor with the halogen lamp in the center. The reactor is maintained at constant temperature (20 °C) by a cooling system with recirculating water. The lamp is also cooled by a similar system. Aluminum foil covers the outer wall of the reactor to prevent any interaction with the room lighting [
11,
14].
To test the stability and recyclability of the photoactivity of samples, photocatalytic recycling tests under visible light are made on six samples: pure TiO
2, TiO
2/Zr2.8, TiO
2/U4, TiO
2/U4/Zr2.8, TiO
2/N42, and TiO
2/N42/Zr2. The same protocol as explained in the above paragraph is performed on these catalysts [
11]. After this, the samples are recovered by centrifugation (10,000 rpm for 1 h) followed by drying at 120 °C for 24 h [
11]. A second and third cycle of photocatalytic tests as described above are applied to the reused catalysts. So, each tested catalyst undergoes four catalytic tests, and a mean PNP degradation on the three recycling tests is then calculated [
11].
4. Conclusions
In this work, an aqueous sol–gel process was successfully applied to produce Zr/N single doped and co-doped TiO2 photocatalysts at low temperature without any calcination step. The N/Ti molar ratio was set at 4 for urea and 42 for triethylamine. Different molar ratios were tested for Zr (0.7, 1.4, 2 and 2.8 mol%). Pure TiO2 was also synthesized by the same aqueous sol–gel process for comparison. The photocatalyst Evonik P25 was also used as a reference commercial material.
Physico-chemical characterizations confirmed that in all the synthesized powders, anatase-brookite TiO2 nanoparticles were present. The TiO2 particle diameters estimated by three different techniques (XRD, BET, and TEM) were consistent and in the same range (~4–6 nm). From TEM micrographs, all TiO2-based samples were composed of spheroidal nanoparticles arranged in agglomerates. Furthermore, all the samples synthesized by peptization were micro-mesoporous, with specific surface area values reaching 280 m2/g.
The results of the XPS and ICP analyses showed that TiO2 was successfully doped with nitrogen and zirconia. Indeed, the incorporation of nitrogen in TiO2 materials with the presence of Ti-O-N bonds was observed, which allowed the absorption of light in the visible range and the enhancement of photoactivity in this wavelength range. The photocatalytic activity of TiO2 was also improved by Zr-doping through the formation of TiO2-ZrO2 mixed oxide materials, which increased the lifetime of the photogenerated charges. In this way, all the samples of this work showed a higher photocatalytic efficiency for p-nitrophenol degradation compared to pure TiO2 and commercial Evonik P25.
The highest PNP degradation percentages were obtained with co-doped samples: under UV/visible light, the best sample (TiO2/N42/Zr2.8) reached 96% of PNP degradation after 8 h of irradiation, and under visible light, 68% of PNP degradation was reached with the best sample (TiO2/N42/Zr2) after 24 h of illumination. These results confirmed the positive influence of the N and Zr dopants on the shift of TiO2 photoactivity towards the visible region. Finally, it should be noted that these N/Zr single doped and co-doped TiO2 samples were prepared with an environmentally friendly synthesis. Indeed, water was used as solvent, the synthesis of photocatalysts was done at ambient temperature and pressure, and no calcination step was required to obtain the crystallization of TiO2. This study proposes very efficient photocatalysts under visible light offering promising prospects for the clean-up of water pollution and the degradation of organic pollutants.


 ,
, 


