
Low Temperature Water-Gas Shift: Enhancing Stability through Optimizing Rb Loading on Pt/ZrO2
by
 ,
,
Caleb Daniel Watson
1 ,
,
Michela Martinelli
2, 
Donald Charles Cronauer
3,
A. Jeremy Kropf
3 and
Gary Jacobs
1,4,* 
1
Department of Biomedical Engineering and Chemical Engineering, University of Texas at San Antonio, One UTSA Circle, San Antonio, TX 78249, USA
2
University of Kentucky Center for Applied Energy Research, 2540 Research Park Drive, Lexington, KY 40511, USA
3
Argonne National Laboratory, Argonne, IL 60439, USA
4
Department of Mechanical Engineering, University of Texas at San Antonio, One UTSA Circle, San Antonio, TX 78249, USA
*
Author to whom correspondence should be addressed.
Catalysts 2021, 11(2), 210; https://doi.org/10.3390/catal11020210
Submission received: 16 December 2020
/
Revised: 1 February 2021
/
Accepted: 2 February 2021
/
Published: 5 February 2021
(This article belongs to the Special Issue Catalysts for Water-Gas Shift Reaction)
Abstract
:Recent studies have shown that appropriate levels of alkali promotion can significantly improve the rate of low-temperature water gas shift (LT-WGS) on a range of catalysts. At sufficient loadings, the alkali metal can weaken the formate C–H bond and promote formate dehydrogenation, which is the proposed rate determining step in the formate associative mechanism. In a continuation of these studies, the effect of Rb promotion on Pt/ZrO2 is examined herein. Pt/ZrO2 catalysts were prepared with several different Rb loadings and characterized using temperature programmed reduction mass spectrometry (TPR-MS), temperature programmed desorption (TPD), diffuse reflectance infrared Fourier transform spectroscopy (DRIFTS), an X-ray absorption near edge spectroscopy (XANES) difference procedure, extended X-ray absorption fine structure spectroscopy (EXAFS) fitting, TPR-EXAFS/XANES, and reactor testing. At loadings of 2.79% Rb or higher, a significant shift was seen in the formate ν(CH) band. The results showed that a Rb loading of 4.65%, significantly improves the rate of formate decomposition in the presence of steam via weakening the formate C–H bond. However, excessive rubidium loading led to the increase in stability of a second intermediate, carbonate and inhibited hydrogen transfer reactions on Pt through surface blocking and accelerated agglomeration during catalyst activation. Optimal catalytic performance was achieved with loadings in the range of 0.55–0.93% Rb, where the catalyst maintained high activity and exhibited higher stability in comparison with the unpromoted catalyst.
1. Introduction
Pure hydrogen sources are necessary for many industrial processes, such as Fischer–Tropsch synthesis, hydrogenolysis, and the Haber process. Among the methods used to produce hydrogen, water-gas shift (WGS) is very attractive, as it simultaneously reacts with excess or unwanted CO. The reaction is reversible and mildly exothermic, so it is typically employed in two stages. First, WGS is performed at high temperatures to take advantage of kinetically superior rates; however, at these high temperatures, the conversion is equilibrium limited. Thus, the second stage is carried out at low temperatures (LT-WGS) with a highly active catalyst to achieve higher CO conversion. Polymer electrolyte membrane fuel cells (PEMFCs) are a heavily researched topic and an important technology for the future of renewable energy and portable power, as they have the potential to cleanly and efficiently provide electrical energy from hydrogen [1,2,3,4,5,6]. However, these PEMFCs are very susceptible to poisoning by CO, which is a product or byproduct of many hydrogen production reactions (e.g., steam reforming of hydrocarbons or alcohols). Thus, water-gas shift is typically employed in the fuel processor, where it is crucial to achieve high CO conversion. This high conversion can be achieved via the use of a highly active catalyst in the low-temperature stage. Typical commercial catalysts are composed of CuO, ZnO, and Al2O3; however, this formulation is not suitable for portable power applications as it is pyrophoric, requires lengthy activation procedures, and must be used in large quantities to achieve the necessary activity.
To find a suitably active catalyst, many groups have turned to formulations consisting of a noble metal (e.g., Au, Pt, Pd) supported on a partially reducible oxide (PRO) (e.g., CeO2, ZrO2, CeαZr1-αO2, TiO2, HfO2, ThO2) [7,8,9]. The metal promotes reduction of the support surface and allows for the dissociative adsorption of water at low temperatures, and these systems tend to be rather stable [10]. For these formulations and others, the nature of the mechanism for LT-WGS is not agreed upon and is still debated in the open literature. Typically, one of two mechanistic explanations are provided: (1) a support-mediated redox mechanism, wherein the support is reduced by CO and subsequently oxidized by H2O, or (2) a reactant-promoted associative mechanism, where the key intermediate is either a formate or carboxyl species. Interestingly, different mechanisms have been reported for nearly identical formulations in some cases (e.g., Pt supported on ceria-zirconia mixed oxides) [11,12]. In a recent review, Palma et al. summarize the mechanisms proposed for many Pt-based catalysts in the recent literature [13]. In the review, the authors note that an associative mechanism was reported for all the alkali promoted Pt-based catalyst formulations investigated.
In the formate associative mechanism, the catalyst surface is activated through the formation of bridging hydroxyl groups, which are associated with oxygen vacancies on the support surface. These OH groups can be formed through one of two pathways, which are demonstrated in Figure 1 for Pt/ZrO2: (1) hydrogen adsorbed to metal nanoparticles spills over to oxygen on the support surface, or (2) Pt catalyzes the formation of oxygen vacancies on the support surface, followed by the dissociative adsorption of H2O. In either case, the formation of bridging OH groups reduces surface Zr4+ to Zr3+. These groups react with CO to form adsorbed formate, which is rather stable in the absence of steam; however, co-adsorbed water facilitates the forward decomposition of formate. This is consistent with the work of Shido and Iwasawa for Rh/CeO2, where co-adsorbed water plays an important role in the transition state [14]. During steam decomposition, Pt facilitates formate dehydrogenation, which leads to the formation of a carbonate species [15,16]. This carbonate intermediate decomposes, resulting in the formation of an oxygen vacancy at which another water molecule dissociates, completing the catalytic cycle. Alternatively, density functional theory (DFT) and microkinetic modeling have been used to propose carboxyl species as the active intermediates of the associative mechanism for several relevant catalysts, including Rh/ZrO2 [17], Pt/CeO2 (111) [18], Pt/ZrO2 [19], and Au/CeO2 (110) [20].
In the redox mechanism, CO adsorbs onto Pt nanoparticles and subsequent spillover leads to CO2 formation via the removal of a support oxygen. This creates an oxygen vacancy, which is subsequently filled by oxygen from steam, creating H2 and completing the catalytic cycle. This differs from the associative mechanism in that the oxidation state of surface zirconia cycles between the +3 and +4 oxidation states; activated zirconia remains as Zr3+ in the associative mechanism. On relevant catalyst systems, DFT and microkinetic studies have been used to support the redox mechanism for Au/TiO2 [21], while operando studies have been used to support the redox mechanism for Au/CeO2 [22,23]. Additionally, by using steady state isotopic transient kinetic analysis (SSITKA), DRIFTS, and mass spectrometry (MS) techniques, Kalamaras et al. have proposed that the redox mechanism is dominant for Pt/TiO2 [24] and Pt/CeO2 [25]. Furthermore, the group proposed that for Pt/CexZr1-xO2 [12], the reaction mechanism switches from redox to a combined redox and associative formate mechanism as the temperature is changed from 200 °C to 300 °C. This result is particularly intriguing as multiple authors have proposed that the redox mechanism is likely to be more prevalent at high temperatures [26,27,28,29]. Additionally, it is important to note that the aforementioned experimental studies have been conducted with a CO/H2O feed, while under typical fuel processer conditions, there is also a high concentration of H2 present [12,22,23,24,25]. Furthermore, recent work by Vecchietti et al. has shown that reaction between H2O and oxygen vacancies is fast [30], meaning that water activation is not the rate-limiting step of WGS, which has been proposed for the redox mechanism [21,22,24,25,31]. The work also emphasized the importance of monodentate formate as a key reaction intermediate [30]. Although more mechanistic studies need to be conducted at relevant conditions for LT-WGS, the formate mechanism has been shown to be consistent in explaining the effect of alkali promoters for WGS [32,33,34,35,36,37].
In 2005, researchers from Honda R&D Americas and Symyx Technologies reported the results of combinatorial works which screened more than 250,000 formulations [38]. Among the notable results was the remarkable improvement in activity and selectivity caused by sodium promotion of Pt/ZrO2. This work led to multiple studies where Honda, in collaboration with The University of Kentucky’s Center for Applied Energy Research (UK-CAER), showed that the addition of Li, Na, or K significantly improved the rate of formate decomposition in steam [32,33]. These works showed that the alkali promotion considerably weakens the C–H bond of formate and, through isotopic studies, suggested that the scission of this bond was the rate limiting step for LT-WGS.
In fact, numerous papers have described the promotional effects of alkali metals on WGS catalysts [32,33,34,36,37,39,40,41,42,43,44,45,46], including alkali promotion through electrochemical methods [47]. The promotional effect is commonly attributed to the electronic nature of the alkali promoter [32,33,36,37,40,42,46] or an increase in basicity of the catalyst surface [41,43]. Regarding an electronic effect, it is possible that the alkali may interact with adsorbed intermediates via the electrostatic force, or by charge transfer [48]. While many alkali metals have been used as promoters for WGS catalysts, these studies primarily focused on the use of Na or K as promoters, with relatively few studies discussing the effects of Rb.
Recently, Rb has been studied on supported Pt catalysts. Evin et al. studied alkali promoters (Li, Na, K, Rb, or Cs) in both low-loading amounts (equimolar to 0.5% Na) and high-loading amounts (equimolar to 2.5% Na) on Pt/CeO2 [36,37]. The group found that alkali promotion is an optimization problem. Increasing alkalinity was suggested to lead to a weakening of the formate C–H bond, accelerating the rate of formate dehydrogenation; however, increased alkalinity also leads to an increase in the stability of the second intermediate, carbonate. The greatest improvements in CO conversion were observed for the catalysts doped with low amounts of Li, Na, or K. At these loadings, the negative effects were minimal, and formate dehydrogenation was accelerated via weakening of the C–H bond.
Despite Rb being a less successful alkali promoter relative to Na or K in some studies, in this contribution, we seek to elucidate the effect of Rb promotion on Pt/ZrO2 during LT-WGS. 2%Pt/ZrO2 was doped with several Rb loadings (0.33%, 0.55%, 0.74%, 0.93%, 1.86%, 2.79%, 3.72%, 4.65%, 5.58% or 9.29%) to determine the optimal Rb loading. The authors hope to shed light on the nature of the promotional effect caused by Rb, to discuss whether evidence is in support of a formate mechanism, and to compare Rb to the previously studied alkali promoters.
2. Results and Discussion
2.1. Catalyst Characterization
Table 1 provides the Brunauer-Emmett-Teller (BET) surface area, Barrett-Joyner-Halenda (BJH) pore volume, and average pore diameter for the catalysts studied, and pore diameter distributions are provided in Figure 2. If Pt nanoparticles do not contribute significantly to the surface area, the addition of platinum would be expected to lower the catalyst surface area from 95.4 m2/g to 93.5 m2/g. However, Pt addition decreased the surface area to 89.7 m2/g, indicating that some pore blocking did occur. The addition of Rb generally further decreased the surface area, which decreased to 58.2 m2/g for the 9.29%Rb-2%Pt/ZrO2 catalyst. Similarly, this decrease in surface area is larger than would be expected if Rb increased the mass of the catalyst without contributing to surface area. This suggests that Rb also contributes to pore blocking. Pore volume generally decreased with increasing Rb loading, whereas the average pore diameter experienced little change.
Temperature programmed reduction (TPR) profiles in hydrogen for several catalysts are presented in Figure 3. For the related Pt/CeO2 system, Jacobs et al. found that Pt facilitates surface carbonate decomposition during activation while forming bridging hydroxyl groups [15]. As the Rb loading increased, the TPR profiles show increased thermal conductivity detector (TCD) signal intensity, which suggests an increase in the amount of surface carbonate prior to reduction. This effect can be explained by the fact that alkali promotion increases the basicity of the catalyst surface; CO2 is an acid anhydride, meaning that prior to activation, Rb causes more adsorbed CO2 (i.e., carbonate) to be present on the catalyst surface. The MS signals for H2, CO, and CO2 during TPR are presented in Figure 4. These results suggest that carbonate is likely decomposing through Pt-catalyzed decarbonylation, which is confirmed by the loss of carbonate seen in DRIFTS experiments, shown in Figure 5. When carbonates decompose during catalyst activation, the magnitude of the DRIFTS Pt-CO band first grows, then declines. CO2 temperature programmed desorption (TPD) profiles are shown in Figure 6. As the loading of Rb increases, CO2 desorbs at higher temperatures, which can be attributed to two effects. Firstly, with increasing loading, the catalyst becomes increasingly basic, meaning CO2 adsorbs more strongly to the catalyst surface. Secondly, Rb loading covers Pt surface sites, inhibiting Pt-catalyzed CO2 removal.
2.2. X-ray Absorption Spectroscopy
The EXAFS fittings for the Pt0 foil, the unpromoted catalyst, and the rubidium-promoted catalysts are shown in Table 2 and Figure 7. Referring to the work or Jentys [49] or Marinkovic et al. [50], the size of Pt clusters can be estimated. From these methods, the EXAFS data shows that platinum particle diameter, assuming an approximately spherical morphology, increases as a function of Rb loading from approximately 0.8 nm for the unpromoted 2%Pt/ZrO2 to 2.0 nm for 9.29%Rb-2%Pt/ZrO2. This increase in particle size leads to a decrease in dispersion (the percentage of Pt atoms exposed to the surface) from 94% for the unpromoted catalyst to 56% for the catalyst promoted with 9.29% Rb. Thus, one factor complicating an elucidation of the alkali electronic effect on catalyst activity is the fact that Rb promoter alters the interaction of Pt species with ZrO2, accelerating Pt agglomeration during reduction.
To gain an insight into whether Rb promotion leads to charge transfer from Rb to Pt, the Pt L-3 XANES spectra can be analyzed. However, the white line intensity is also affected by the size of Pt particles, so the difference between the L-3 XANES and L-2 XANES can be studied to remove this effect. Figure 8 shows the L-3 and L-2 XANES spectra as well as their difference. If Rb promotion causes charge transfer from Rb to Pt, then the Pt L3–L2 XANES difference should decrease in magnitude as a function of Rb loading. However, this trend is not observed, indicating that rubidium is likely not transferring charge density to platinum. Despite this, it is still suggested that Rb and Pt are in direct contact, which can be seen through the TPR-XANES and TPR-EXAFS shown in Figure 9 and Figure 10, respectively. The TPR-XANES and TPR-EXAFS reveal that as the loading of Rb increases, the reduction of PtO is hindered, which is likely the result of covering by Rb.
2.3. Transmission Electron Microscopy
Scanning transmission microscopy with energy-dispersive X-ray spectroscopy (STEM-EDX) images for 0.93%Rb-2%Pt/ZrO2 (Figure 11, top) show that both platinum and rubidium were well dispersed, with all clusters observed to be below 2 nm. By increasing the rubidium loading to 9.29%, STEM-EDX images (Figure 11, bottom) show rubidium was well dispersed, whereas platinum particles tended to form agglomerates of several Pt domains. Some agglomerates were on the order of 5–6 nm, while the domains were typically below 2 nm. These results are consistent with the EXAFS fittings, which showed a higher Pt-Pt coordination number at 9.29%Rb loading as compared to 0.93%Rb loading. The spatial distribution of Pt and Rb also suggests that, especially in the case of 9.29%Rb, that there is a strong possibility of contact between the two elements. The denser Rb distribution (displayed in green) from elemental mapping is consistent with the higher loading of Rb for the 9.29%Rb sample.
2.4. DRIFTS Studies
Vibrational bands for relevant species were assigned in Table 3 based on our prior work [32,33] and those of Binet et al. [51] for related CeO2 catalysts. During LT-WGS, a formate intermediate is formed from the reaction between CO and bridging OH groups associated with Osupport vacancies. The formate ν(CH) band is shown in Figure 12 for the studied catalysts. At loadings of 0.93% Rb or less, only a small shift (3–4 cm−1) in the ν(CH) band is seen compared to the reference catalyst. However, at loadings of 3.72% Rb or greater, a remarkable redshift is observed (up to 114 cm−1). This implies that the alkali promoter causes a weakening of the formate C–H bond. According to the formate mechanism, the scission of the formate C–H bond is the rate determining step during LT-WGS. If this mechanism is occurring, then the weakening of the formate C–H bond should accelerate the rate of formate decomposition. Figure 13 shows the formate ν(CH) band during transient LT-WGS. The rate of formate decomposition increases as a function of loading until a maximum is reached at 4.65% Rb. For higher loadings, the decomposition rate decreases. Additionally, formate species were stable in the absence of water, consistent with the reactant-promoted formate mechanism proposed by Shido and Iwasawa [14].
Figure 14 and Figure 15 show the response of the Pt-CO bands during DRIFTS. Table 4 compares the relative magnitude of the Pt-CO DRIFTS band with the Pt dispersion. For high rubidium loadings (e.g., 5.58%Rb and 9.29%Rb), the Pt-CO DRIFTS band magnitude decreases much more quickly than dispersion, indicating that Rb contributes to covering the Pt surface at high loadings. At low loadings, a greater fraction of alkali is sacrificed to the support. There is less alkali near the metal–support interface to interact with formate species, so less promotional effect on formate decomposition is obtained. For intermediate loadings (e.g., 4.65% Rb), rubidium is present near the interface between the support and Pt nanoparticles, allowing it to have a greater promotional effect on the formate intermediate via weakening the formate C–H bond. At the same time, there is still a considerable fraction of surface area available on Pt sites to assist in formate dehydrogenation. The catalysts loaded with 9.29% Rb shows almost negligible amounts of the Pt-CO band, which indicates that the alkali is virtually completely covering the surface of the platinum nanoparticles at this loading. This effect compounds with the decreasing Pt0 surface area associated with the decrease in dispersion at high Rb loading. This inhibits the ability of Pt to participate in H2 transfer reactions, which decelerates the rate of formate decomposition. This effect is illustrated in Figure 16. Similar observations were made by Jacobs and coworkers for M/CeO2 (M = Pt or Au) catalysts, where it was found that the metal facilitated formate decomposition at active sites near the metal/support interface [15,16]. Figure 17 shows DRIFTS spectra of gas-phase CO2, which is produced from the forward decomposition of formate. CO2 production stops when formate has decomposed, even when considerable Pt-CO bands are present. This is consistent with the associative formate mechanism which involves formate as an intermediate. In contrast, the redox mechanism proposes Pt-CO as an intermediate.
DRIFTS spectra before and after formate decomposition in steam are shown in Figure 18. For all catalysts except 9.29%Rb-2%Pt/ZrO2, formate decomposes completely, as seen through the loss of ν(CH) at 2800–2900 cm−1, ν(OCO)sy at 1250–1450 cm−1, and ν(OCO)asy at 1500–1700 cm−1. Additionally, catalysts loaded with 1.86%Rb or greater show complete loss of the Pt-CO band at 1800–2100 cm−1. After formate decomposition, the CO2 precursor, adsorbed carbonate, persists with similar ν(OCO) bands to those of formate. Carbonate is formed through platinum-catalyzed formate decomposition near the metal–support interface in the associative mechanism.
Hydrogen formation during formate decomposition with co-adsorbed H2O is shown in the TPD-MS profiles of Figure 19. The peak temperature of H2 production gradually shifts to lower temperatures with increasing Rb loading until it reaches a minimum at 4.65% Rb. Higher loadings show a higher peak temperature for H2 evolution. These results again show that the catalyst loaded with 4.65% Rb accelerated formate decomposition to the greatest extent.
2.5. Reactor Testing
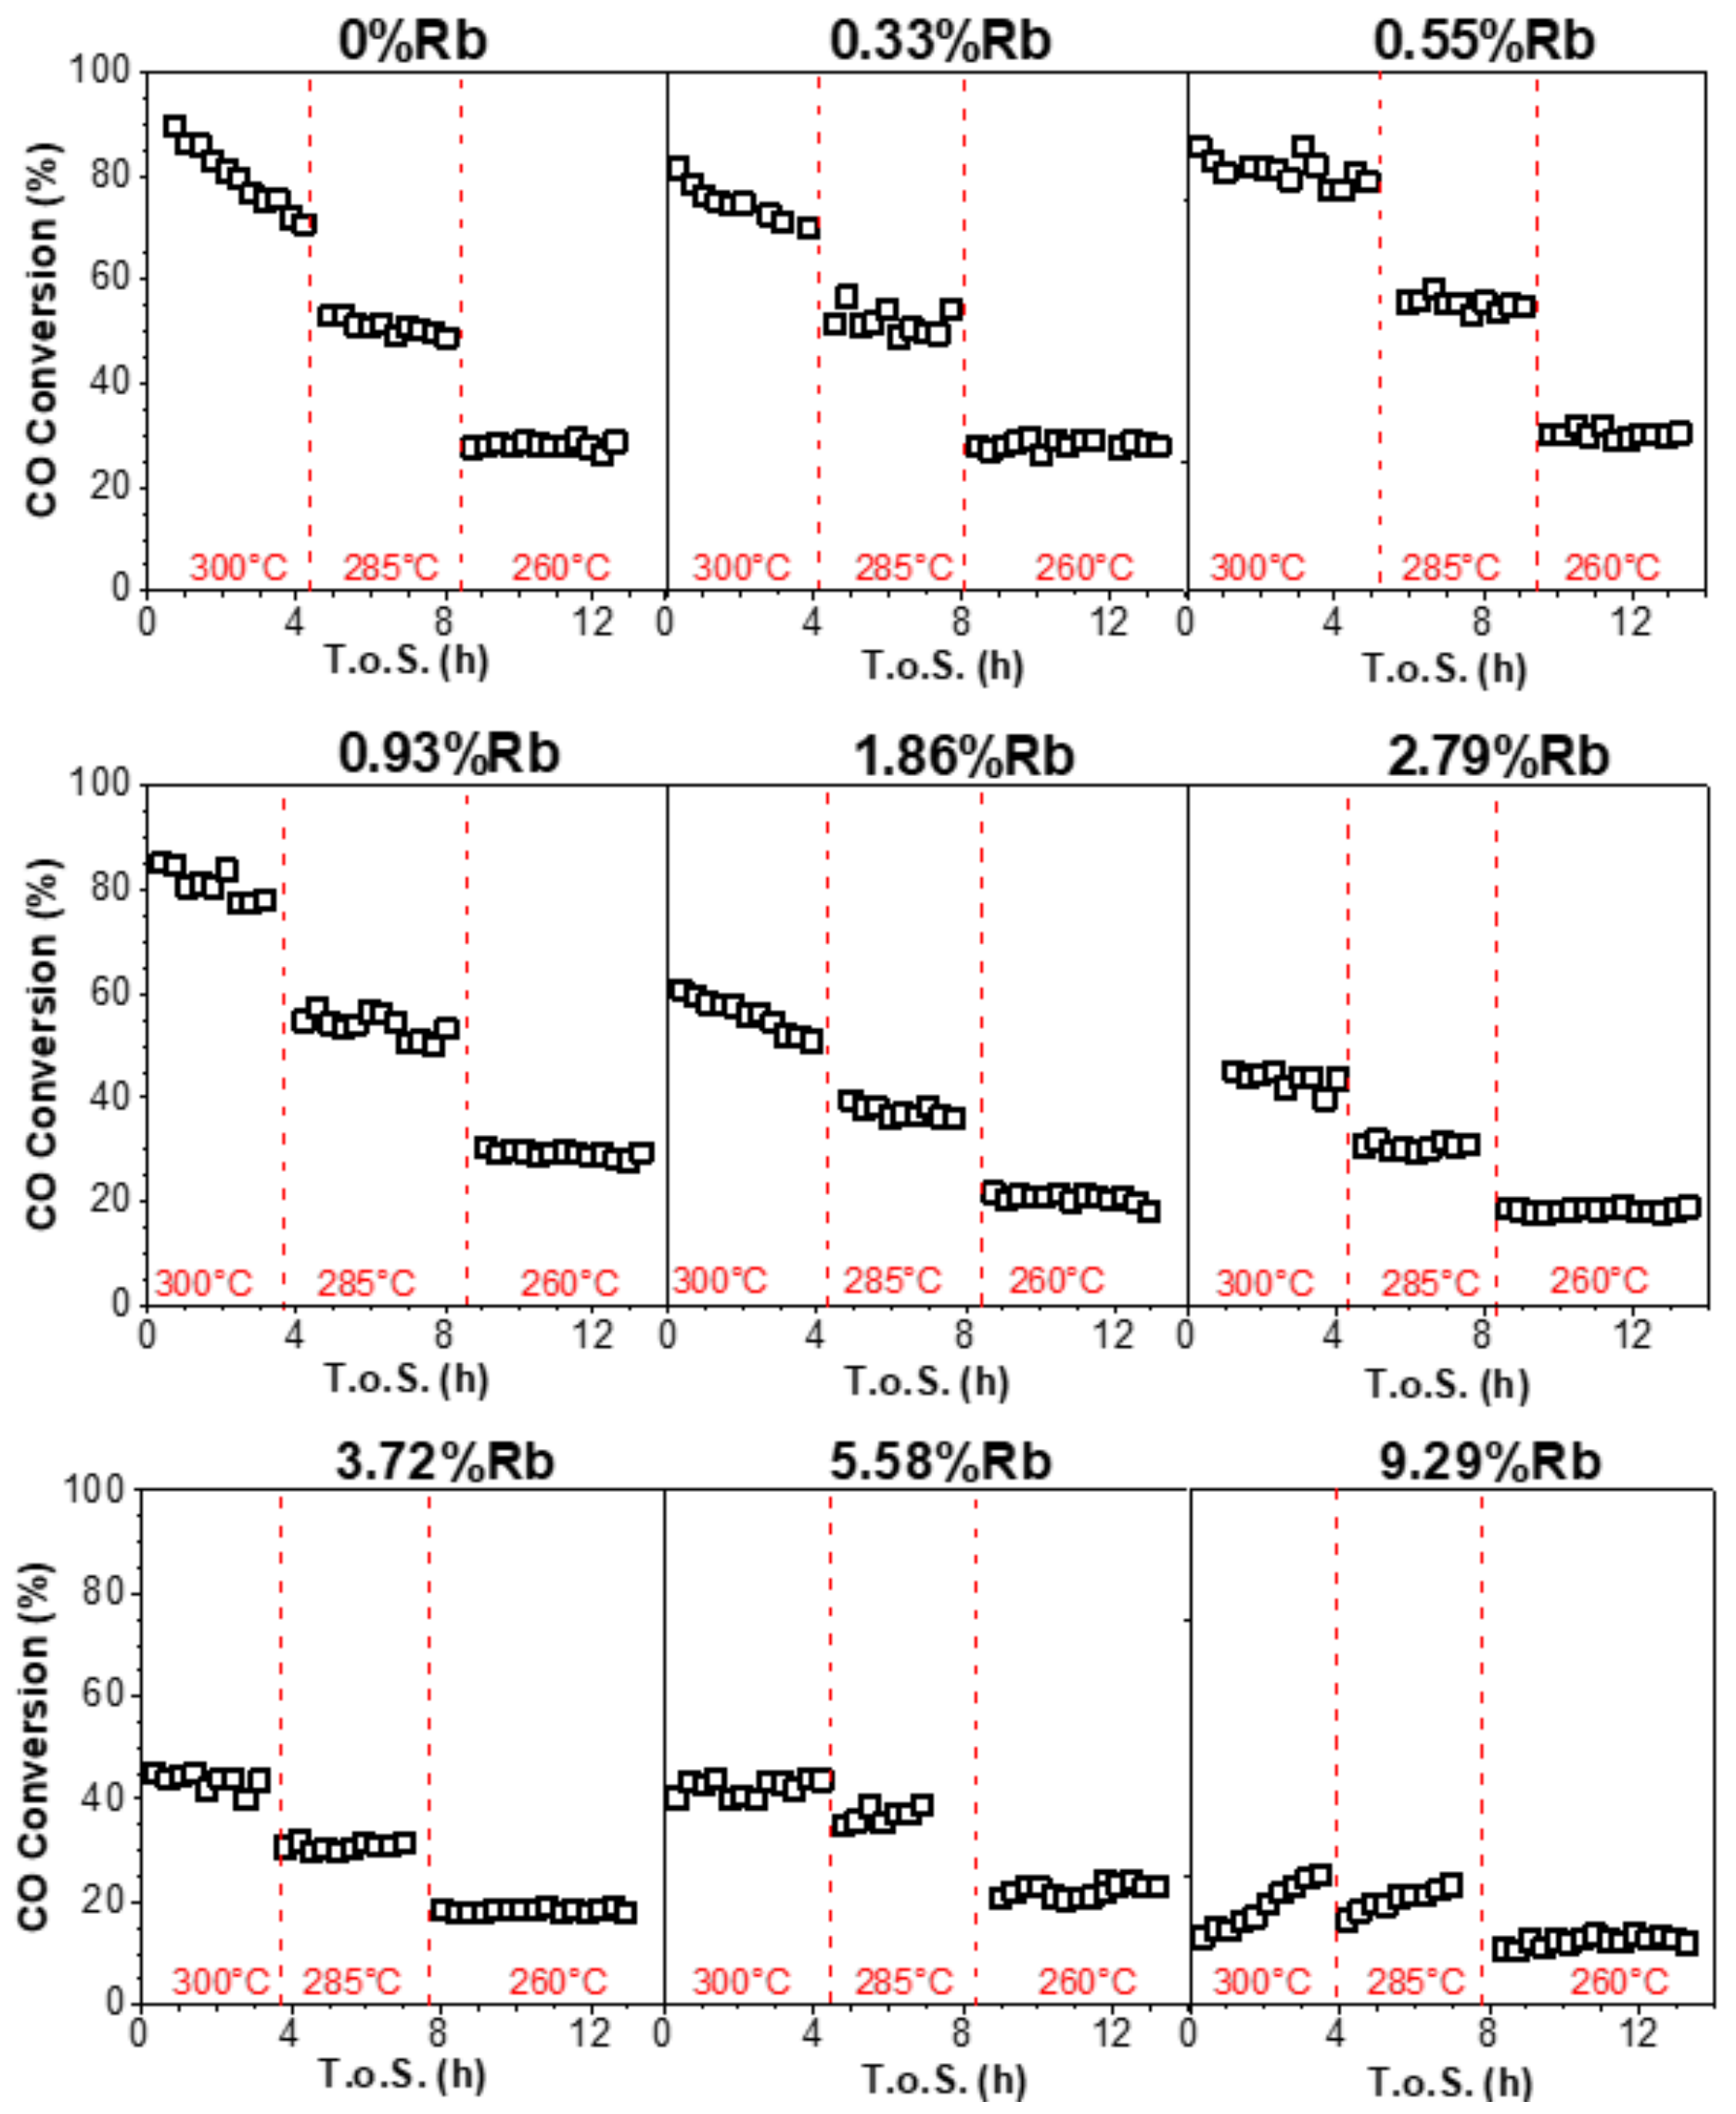
Figure 20 shows the CO conversion vs. time on stream during LT-WGS for the prepared catalysts. All promoted catalysts begin with lower conversion than the reference catalyst. However, after the break-in period, the catalysts promoted with 0.93%Rb or less show better stability and activity, especially at 300 °C. These results point to an optimal loading in the range of 0.55–0.93% Rb. At higher loadings of Rb, the catalysts show lower activity than the reference catalyst. This likely indicates that CO2 desorption becomes the limiting factor; even though the rate of formate decomposition is the most rapid at 4.65%Rb, this level of Rb loading apparently stabilizes intermediate carbonate, which prevents the completion of the catalytic cycle during WGS. Here, the CO2 TPD results provide an important indication of carbonate stability. The formate C-H bond scission has been suggested to be the rate determining step of LT-WGS [14]. As mentioned, even at low loadings, rubidium promotion redshifted the formate ν(CH) band, indicating a weakening of the formate C–H bond. This accelerated the rate of formate decomposition in steam, which was seen through DRIFTS and TPD-MS. This suggests that the high activity observed with the 0.55% and 0.93% Rb catalysts (after the break-in period) was in part due to the higher formate decomposition rate. However, the discrepancy between the formate decomposition rate and activity at higher loadings is likely due to excessive alkalinity which stabilized the second intermediate, carbonate.
These results have potential implications for related reactions, such as ethanol steam reforming (ESR) and methanol steam reforming (MSR). During ESR, alkali were previously shown to weaken the C–C bond in the acetate intermediate, analogous to the C-H formate bond during WGS [52]. This weakening promoted forward decomposition of acetate to adsorbed carbonate and methane, increasing the overall H2 selectivity of the reaction (assuming downstream steam reforming of methane). Since the nature of the alkali’s promotional (and potentially inhibiting) effects are likely to be similar in each reaction, it is likely that the catalyst loaded with 0.55% to 0.93% Rb could benefit ESR.
2.6. Alkali Comparison
In previous works, the loadings of Na and K were optimized for the same Pt/ZrO2 catalyst used in this work [34,53]. Comparing the results of this work with these previous studies sheds light onto some very interesting trends involving the alkali, which are summarized in Table 5. It was observed that promotion with larger alkali at high loading levels led to a greater shift in the ν(CH) band of formate when compared with the reference (unpromoted) catalyst. As this shift is caused by an electronic effect, it is likely that the electronegativity of the alkali plays a critical role in the degree of this shift. Moving down the alkali group, the alkali become increasingly electropositive (i.e., less electronegative), meaning the alkali have a greater tendency to donate electron density. This increase in electropositivity (which is especially prominent between Na and K), leads to the alkali having a stronger electronic effect on intermediate formate which weakens the formate C–H bond, redshifting the corresponding ν(CH) to a greater extent.
To compare the efficacies of each alkali at the optimal loading, the TPD-MS profiles of formate in co-adsorbed water can be compared. In previous studies with Na promoted catalyst [53] or K promoted catalyst [34], these profiles showed much more prominent shoulders at low temperature, with relative magnitudes of Na > K > Rb. These low-temperature peaks/shoulders occurred at similar temperatures, and the relative magnitudes suggest that Na is the most successful promoter for formate decomposition of the three alkali metals on 2%Pt/ZrO2. A possible explanation for this trend is that larger alkali, despite weakening the ν(CH) or formate to a greater extent, cause more Pt agglomeration than Na. For a given Pt loading, the total perimeter of Pt available to ZrO2 should be inversely proportional to the square of the average diameter of Pt clusters. Thus, Pt agglomeration can have a large negative impact on the periphery of Pt in contact with the active support, hindering H-transfer from formate. By comparing CO conversion data for Na, K, and Rb promoted catalysts, it is clear that Na promotion achieves the highest activity boost of the three alkali metal promoters, followed by K and Rb (the latter following the initial decline period). This is likely due to two effects: despite improved formate C-H bond weakening, the larger alkali promoted Pt agglomeration to a greater extent during catalyst activation, and larger alkali tended to more strongly stabilize the second intermediate in the pathway, the carbonate species. Similar results were previously observed by Evin et al. [37] for a Pt/CeO2 catalyst doped with different alkali metals.
3. Materials and Methods
3.1. Catalyst Preparation
Various rubidium loadings (0.33%, 0.55%, 0.74%, 0.93%, 1.86%, 2.79%, 3.72%, 4.65%, 5.58% or 9.29% by weight) on 2%Pt/ZrO2 were prepared by incipient wetness impregnation (IWI). First, monoclinic phase zirconia (63–125 μm) was impregnated with 2% Pt using aqueous Pt(NH3)4(NO3)2 via IWI. After calcination, the catalyst was divided into several portions and was promoted by the appropriate amount of aqueous RbNO3 via IWI. Impregnations were followed by drying and subsequent calcining at 350 °C for four hours using a muffle furnace.
3.2. Characterization
3.2.1. BET Surface Area
Prior to testing, catalysts were degassed under vacuum at 160 °C until the ambient pressure was less than 6.7 Pa. Following, the catalyst was cooled to cryogenic temperatures under vacuum, and a Micrometrics 3-Flex system (Micrometrics, Norcross, GA, USA) was used to measure pore size and surface area via the BJH and BET methods respectively.
3.2.2. Temperature Programmed Reduction/Mass Spectrometry
Temperature programmed reduction (TPR) profiles of the catalysts were obtained using a Zeton-Altamira AMI-300R instrument (Altamira Instruments, Pittsburgh, PA, USA) in conjunction with a mass spectrometer from Hiden Analytical. For each catalyst, 10% H2/He was flowed while increasing the temperature from 50 to 1000 °C at 10 °C/min.
3.2.3. Temperature Programmed Desorption
TPD experiments were conducted on a Zeton-Altimira AMI-300 (Altamira Instruments, Pittsburgh, PA, USA). Catalysts were reduced at 300 °C using a reducing gas of 33% H2/He flowing at 30 cm3/min. After reduction, the catalyst was cooled to 225 °C under hydrogen flow. Next, 50 cm3/min He was bubbled through water and flowed through the system for 15 min. Subsequently, the catalyst was exposed to the same reducing gas for 15 min, followed by a purge of 50 cm3/min He. This procedure allowed for the formation of bridging OH at oxygen vacancy sites on the catalyst surface. After pretreatment, formate and Pt-CO species formed on the catalyst surface as 4%CO/He flowed at 25 cm3/min. The catalyst was cooled to 50 °C, and co-adsorbed water was added to the catalyst surface by again bubbling 50 cm3/min He for 15 min. The system was then slowly heated to 400 °C to allow for reaction between the steam and formate.
3.2.4. EXAFS
The Materials Research Collaborative Access Team (MR-CAT) beamline at the Advanced Photon Source in Argonne National Laboratory was used to conduct in-situ H2-EXAFS experiments. Incident energies were selected via a Si (1 1 1) monochromator in conjunction with a Rh-coated mirror to remove non-fundamental harmonics of the beam energy. Jacoby describes an experimental setup similar to that used in this work [55]. In situ TPR was conducted on six samples simultaneously using a multi-sample holder (3 mm i.d. channels) made of stainless steel. Self-supporting wafers were loaded into each channel using roughly 6 mg of catalyst, an amount optimized for the Pt LIII edge on a ZrO2 support. The multi-sample holder was placed inside a clamshell furnace mounted on the positioning table. The quartz tube is outfitted with Kapton view ports and ports for gas and a thermocouple. Samples were aligned with the beam with 20 μm precision for repeat scans. After positioning, the quartz tube was purged with 100 mL/min He for at least 5 min. Afterward, 100 mL/min pure hydrogen was flowed, and the temperature was increased to 350 °C at a rate of 1.0 °C/min. Spectra at the Pt L-3 edge were taken in transmission made with Pt0 foil serving as a reference for energy calibration. EXAFS spectra were analyzed using WinXAS [56]. Fitting of EXAFS Spectra was carried out with WinXAS [56], Atoms [57], FEFF [58] and FEFFIT [58] using spectra from the end of the TPR (after the temperature had been ramped to 350 °C and subsequently cooled in flowing H2). Fittings were performed from 3 Å−1 to 14 Å−1 in k space. The inner Pt-Pt coordination shell was isolated by applying a Hanning window of the Fourier-transformed spectra and subsequently performing the inverse Fourier transform. Fittings were performed from 1.7 Å to 3.2 Å in R space.
3.2.5. DRIFTS
A Nicolet iS-10 FTIR (Fourier transform infrared, Waltham, MA, USA) spectrometer was used to conduct transient LT-WGS DRIFTS experiments. To reduce the catalyst, 1:1 H2:He was flowed at 300 °C for one hour. Following reduction, the temperature was reduced to 225 °C in H2, and 75 cm3/min He was bubbled through water and flowed through the system for 8 min. Next, 100 cm3/min hydrogen was flowed for 15 min, followed by a purge in 100 cm3/min of helium. As in TPD experiments, this pretreatment allowed for the formation of bridging OH at oxygen vacancy sites on the catalyst surface. After pretreatment, formate and Pt-CO species formed on the catalyst surface as 4%CO/He flowed at 50 cm3/min. Subsequently, an additional 8 min scan was taken in CO. Helium was bubbled through a water bath at 31 °C, and the saturated vapor (4.4% H2O/He) was flowed across the catalyst at 75 cm3/min. This steam promoted formate decomposition into H2 and adsorbed carbonate, which further decomposed to CO2.
3.2.6. Transmission Electron Microscopy
Transmission electron microscopy (TEM) and scanning transmission microscopy (STEM) were performed with a FEI Talos F200X instrument (ThermoFischer Scientific, Waltham, MA, USA) equipped with BF, DF2, DF4, and high-angle annular dark-field imaging (HAADF) detectors. The imaging was collected with a field-emission gun using an accelerating voltage of 200 kV and a high speed Ceta 16M camera. The elemental distributions were determined via super energy-dispersive X-ray spectroscopy (EDX). Velox software was used for data processing. Prior to the analysis, the samples were pretreated in hydrogen at 350 °C for 1 h, cooled to ambient temperature and passivated with a mixture of 1% O2 in nitrogen. Then the reduced samples were dispersed in ethanol, sonicated for 30 min, and then a droplet of the suspension was added to a carbon-coated copper grid (300 mesh) and dried in air overnight.
3.2.7. Reaction Testing
CO conversion during WGS was investigated using a fixed bed plug flow reactor (1.13 cm i.d.). Prior to testing, catalyst samples were sieved to 63–106 µm and diluted by a factor of 4 with silica (60–80 µm). One gram of the diluted catalyst was used for each run. Catalysts were pretreated by flowing 100 cm3/min H2 for 1 h while the temperature was raised to 350 °C at 5 °C/min. After pretreatment, reactions were conducted at atmospheric pressure, 265–300 °C, and a space velocity of 167,638 Ncc/h-gcat. The feed was composed of yCO = 0.029, yH2O = 0.0261, yH2 = 0.299, yHe = 0.368, and the balance nitrogen. After passing through a vapor-liquid separator at 0 °C, the effluent gas was analyzed with an SRI 8610 gas chromatograph (GC) equipped with a molecular sieve column and a silica column. Along with a TCD, the SRI 8610 GC (SRI Instruments, Torrance, CA, USA) is equipped with a methanizer and flame ionization detector, increasing sensitivity to CO and CO2.
4. Conclusions
In this work, the effect of Rb loading on Pt/ZrO2 was studied, and it was found that loadings in the range of 0.55–0.93%Rb were optimal for LT-WGS. The effects of Rb at different loadings are complex. Although Rb loading led to decreased surface area and pore volume, it also led to a significant redshift in the ν(CH) band of formate (~110 cm−1 lower than the unpromoted catalyst at high loading amounts), observed through DRIFTS. This indicates a significant weakening of the formate C–H bond, facilitating its scission, which is the proposed rate limiting step in a formate associative mechanism. This led to a significant improvement in the rate of formate decomposition in the presence of steam, as observed through DRIFTS and TPD. At low loadings, more Rb was present on the support, and only small quantities were located at the metal–support interface, which is the proposed reaction zone. This was shown through DRIFTS where lower loadings of alkali caused only a small shift in the formate ν(CH) band. At excessive loadings, the surface of the Pt nanoparticles became largely blocked, inhibiting its role in dehydrogenation. Also, despite being in direct contact with Pt nanoparticles, no evidence for direct charge transfer from Rb to Pt was observed using the L3–L2 XANES difference procedure. Additionally, as shown in TPD-MS studies of adsorbed CO2, these higher loadings stabilized intermediate carbonate species, hindering their desorption and thus, obstructing the completion of the catalytic cycle. EXAFS results also showed that Rb tended to agglomerate Pt during activation of the catalyst, which was confirmed by STEM-EDX. These factors combined detrimentally impacted CO conversion. However, addition of Rb in the optimal range of 0.55–0.93% Rb improved catalyst performance over the unpromoted catalyst by maintaining high activity and significantly improving stability.
Author Contributions
Conceptualization, catalyst preparation, catalyst characterization, formal analysis, writing, G.J. Catalyst preparation, catalyst characterization, formal analysis, writing. C.D.W. Reaction testing, characterization, formal analysis, conceptualization, writing, M.M. Catalyst preparation, supervision, resources, D.C.C. Catalyst characterization, data curation, resources, supervision, A.J.K. All authors have read and agreed to the published version of the manuscript.
Funding
C.D.W. would like to acknowledge support from the Undergraduate NSF Research Program, supported by the National Science Foundation through grant award #1832388.
Data Availability Statement
Not applicable.
Acknowledgments
Argonne’s research was supported in part by the U.S. Department of Energy (DOE), Office of Fossil Energy, National Energy Technology Laboratory (NETL). Advanced photon source was supported by the U.S. Department of Energy, Office of Science, Office of Basic Energy Sciences, under contract number DE-AC02-06CH11357. MRCAT operations are supported by the Department of Energy and the MRCAT member institutions. CAER research was supported by the Commonwealth of Kentucky. Gary Jacobs would like to thank UTSA and the State of Texas for financial support through startup funds.
Conflicts of Interest
The authors declare no conflict of interest.
References
- Wang, Y.; Chen, K.S.; Mishler, J.; Cho, S.C.; Adroher, X.C. A review of polymer electrolyte membrane fuel cells: Technology, applications, and needs on fundamental research. Appl. Energy 2011, 88, 981–1007. [Google Scholar] [CrossRef]
- Li, Y.; Xiong, D.; Liu, Y.; Liu, M.; Liu, J.; Liang, C.; Li, C.; Xu, J. Correlation between electrochemical performance degradation and catalyst structural parameters on polymer electrolyte membrane fuel cell. Nanotechnol. Rev. 2019, 8, 493–502. [Google Scholar] [CrossRef]
- Dias, F.G.D.A.; Veiga, A.G.; Andreopoulou, A.K.; Kallitsis, J.K.; Rocco, M.L.M. Spectroscopic Study of Reinforced Cross-Linked Polymeric Membranes for Fuel Cell Application. ACS Omega 2020, 5, 15901–15910. [Google Scholar] [CrossRef] [PubMed]
- Mishra, A.; Prasad, R. A Review on Preferential Oxidation of Carbon Monoxide in Hydrogen Rich Gases. Bull. Chem. React. Eng. Catal. 2011, 6, 1–14. [Google Scholar] [CrossRef]
- Garbis, P.; Kern, C.; Jess, A. Kinetics and Reactor Design Aspects of Selective Methanation of CO over a Ru/γ-Al2O3 Catalyst in CO2/H2 Rich Gases. Energies 2019, 12, 469. [Google Scholar] [CrossRef]
- Aliaga, F.; Iglesias, I.; Tejeda, R.; Laborde, M. Hydrogen Production from Bioethanol: Behavior of a Carbon Oxide Preferential Oxidation Catalyst. Chem. Eng. Technol. 2017, 40, 1702–1712. [Google Scholar] [CrossRef]
- Jacobs, G.; Davis, B.H. Low temperature water-gas shift catalysts. In Catalysis; Royal Society of Chemistry: Cambridge, UK, 2007; pp. 122–285. [Google Scholar]
- Ratnasamy, C.; Wagner, J.P. Water Gas Shift Catalysis. Catal. Rev. 2009, 51, 325–440. [Google Scholar] [CrossRef]
- Ribeiro, M.C.; Jacobs, G.; Linganiso, L.; Azzam, K.G.; Graham, U.M.; Davis, B.H. Low Temperature Water Gas Shift: Evaluation of Pt/HfO2 and Correlation between Reaction Mechanism and Periodic Trends in Tetravalent (Ti, Zr, Hf, Ce, Th) Metal Oxides. ACS Catal. 2011, 1, 1375–1383. [Google Scholar] [CrossRef]
- Jacobs, G.; Davis, B.H. Surface interfaces in low temperature water-gas shift: The metal oxide synergy, the assistance of co-adsorbed water, and alkali doping. Int. J. Hydrog. Energy 2010, 35, 3522–3536. [Google Scholar] [CrossRef]
- Vignatti, C.I.; Avila, M.S.; Apesteguía, C.R.; Garetto, T.F. Study of the water-gas shift reaction over Pt supported on CeO2–ZrO2 mixed oxides. Catal. Today 2011, 171, 297–303. [Google Scholar] [CrossRef]
- Kalamaras, C.M.; Dionysiou, D.D.; Efstathiou, A.M. Mechanistic Studies of the Water–Gas Shift Reaction over Pt/CexZr1–xO2 Catalysts: The Effect of Pt Particle Size and Zr Dopant. ACS Catal. 2012, 2, 2729–2742. [Google Scholar] [CrossRef]
- Palma, V.; Ruocco, C.; Cortese, M.; Renda, S.; Meloni, E.; Festa, G.; Martino, M. Platinum Based Catalysts in the Water Gas Shift Reaction: Recent Advances. Metals 2020, 10, 866. [Google Scholar] [CrossRef]
- Shido, T.; Iwasawa, Y. Reactant-Promoted Reaction Mechanism for Water-Gas Shift Reaction on Rh-Doped CeO2. J. Catal. 1993, 141, 71–81. [Google Scholar] [CrossRef]
- Jacobs, G.; Graham, U.M.; Chenu, E.; Patterson, P.M.; Dozier, A.; Davis, B.H. Low-temperature water–gas shift: Impact of Pt promoter loading on the partial reduction of ceria and consequences for catalyst design. J. Catal. 2005, 229, 499–512. [Google Scholar] [CrossRef]
- Jacobs, G.; Ricote, S.; Graham, U.M.; Patterson, P.M.; Davis, B.H. Low temperature water gas shift: Type and loading of metal impacts forward decomposition of pseudo-stabilized formate over metal/ceria catalysts. Catal. Today 2005, 106, 259–264. [Google Scholar] [CrossRef]
- Kauppinen, M.M.; Melander, M.M.; Bazhenov, A.S.; Honkala, K. Unraveling the Role of the Rh–ZrO2 Interface in the Water–Gas-Shift Reaction via a First-Principles Microkinetic Study. ACS Catal. 2018, 8, 11633–11647. [Google Scholar] [CrossRef]
- Aranifard, S.; Ammal, S.C.; Heyden, A. On the Importance of the Associative Carboxyl Mechanism for the Water-Gas Shift Reaction at Pt/CeO2 Interface Sites. J. Phys. Chem. C 2014, 118, 6314–6323. [Google Scholar] [CrossRef]
- Wang, Y.-X.; Wang, G.-C. A systematic theoretical study of the water gas shift reaction on the Pt/ZrO2 interface and Pt(111) face: Key role of a potassium additive. Catal. Sci. Technol. 2020, 10, 876–892. [Google Scholar] [CrossRef]
- Song, W.; Hensen, E.J.M. Mechanistic Aspects of the Water–Gas Shift Reaction on Isolated and Clustered Au Atoms on CeO2(110): A Density Functional Theory Study. ACS Catal. 2014, 4, 1885–1892. [Google Scholar] [CrossRef]
- Sun, K.; Kohyama, M.; Tanaka, S.; Takeda, S. Reaction Mechanism of the Low-Temperature Water–Gas Shift Reaction on Au/TiO2 Catalysts. J. Phys. Chem. C 2017, 121, 12178–12187. [Google Scholar] [CrossRef]
- Ziemba, M.; Ganduglia-Pirovano, V.; Hess, C. Insight into the mechanism of the water-gas shift reaction over Au/CeO2 catalysts using combined operando spectroscopies. Faraday Discuss. 2020. [Google Scholar] [CrossRef]
- Schilling, C.; Hess, C. Elucidating the Role of Support Oxygen in the Water–Gas Shift Reaction over Ceria-Supported Gold Catalysts Using Operando Spectroscopy. ACS Catal. 2019, 9, 1159–1171. [Google Scholar] [CrossRef]
- Kalamaras, C.M.; Panagiotopoulou, P.; Kondarides, D.I.; Efstathiou, A.M. Kinetic and mechanistic studies of the water–gas shift reaction on Pt/TiO2 catalyst. J. Catal. 2009, 264, 117–129. [Google Scholar] [CrossRef]
- Kalamaras, C.M.; Americanou, S.; Efstathiou, A.M. “Redox” vs. “associative formate with –OH group regeneration” WGS reaction mechanism on Pt/CeO2: Effect of platinum particle size. J. Catal. 2011, 279, 287–300. [Google Scholar] [CrossRef]
- Salcedo, A.; Irigoyen, B. Unraveling the Origin of Ceria Activity in Water–Gas Shift by First-Principles Microkinetic Modeling. J. Phys. Chem. C 2020, 124, 7823–7834. [Google Scholar] [CrossRef]
- Petallidou, K.C.; Polychronopoulou, K.; Boghosian, S.; Garcia-Rodriguez, S.; Efstathiou, A.M. Water–Gas Shift Reaction on Pt/Ce1–xTixO2−δ: The Effect of Ce/Ti Ratio. J. Phys. Chem. C 2013, 117, 25467–25477. [Google Scholar] [CrossRef]
- Burch, R. Gold catalysts for pure hydrogen production in the water–gas shift reaction: Activity, structure and reaction mechanism. Phys. Chem. Chem. Phys. 2006, 8, 5483–5500. [Google Scholar] [CrossRef]
- Vovchok, D.; Guild, C.J.; Llorca, J.; Palomino, R.M.; Waluyo, I.; Rodriguez, J.A.; Suib, S.L.; Senanayake, S.D. Structural and chemical state of doped and impregnated mesoporous Ni/CeO2 catalysts for the water-gas shift. Appl. Catal. Gen. 2018, 567, 1–11. [Google Scholar] [CrossRef]
- Vecchietti, J.; Bonivardi, A.; Xu, W.; Stacchiola, D.; Delgado, J.J.; Calatayud, M.; Collins, S.E. Understanding the Role of Oxygen Vacancies in the Water Gas Shift Reaction on Ceria-Supported Platinum Catalysts. ACS Catal. 2014, 4, 2088–2096. [Google Scholar] [CrossRef]
- Fonseca, A.A.; Fisher, J.M.; Ozkaya, D.; Shannon, M.D.; Thompsett, D. Ceria-zirconia supported Au as highly active low temperature Water-gas shift catalysts. Top. Catal. 2007, 44, 223–235. [Google Scholar] [CrossRef]
- Pigos, J.M.; Brooks, C.J.; Jacobs, G.; Davis, B.H. Low temperature water-gas shift: Characterization of Pt-based ZrO2 catalyst promoted with Na discovered by combinatorial methods. Appl. Catal. Gen. 2007, 319, 47–57. [Google Scholar] [CrossRef]
- Pigos, J.M.; Brooks, C.J.; Jacobs, G.; Davis, B.H. Low temperature water–gas shift: The effect of alkali doping on the CH bond of formate over Pt/ZrO2 catalysts. Appl. Catal. Gen. 2007, 328, 14–26. [Google Scholar] [CrossRef]
- Watson, C.D.; Martinelli, M.; Cronauer, D.C.; Kropf, A.J.; Marshall, C.L.; Jacobs, G. Low temperature water-gas shift: Optimization of K loading on Pt/m-ZrO2 for enhancing CO conversion. Appl. Catal. Gen. 2020, 598, 117572. [Google Scholar] [CrossRef]
- Jacobs, G.; Davis, B.; Pigos, J.; Brooks, C. Low-temperature water-gas shift: Assessing formates as potential intermediates over Pt/ZrO2 and na-doped Pt/ZrO2 catalysts employing the SSITKA-DRIFTS technique. In Advances in Fischer-Tropsch Synthesis, Catalysts and Catalysis; Davis, B.H., Occelli, M.L., Eds.; CRC Press: Boca Raton, FL, USA, 2009; pp. 365–394. [Google Scholar]
- Evin, H.N.; Jacobs, G.; Ruiz-Martinez, J.; Graham, U.M.; Dozier, A.; Thomas, G.; Davis, B.H. Low Temperature Water–Gas Shift/Methanol Steam Reforming: Alkali Doping to Facilitate the Scission of Formate and Methoxy C–H Bonds over Pt/ceria Catalyst. Catal. Lett. 2008, 122, 9–19. [Google Scholar] [CrossRef]
- Evin, H.N.; Jacobs, G.; Ruiz-Martinez, J.; Thomas, G.A.; Davis, B.H. Low Temperature Water–Gas Shift: Alkali Doping to Facilitate Formate C–H Bond Cleaving over Pt/Ceria Catalysts—An Optimization Problem. Catal. Lett. 2008, 120, 166–178. [Google Scholar] [CrossRef]
- Brooks, C.; Cypes, S.; Grasselli, R.K.; Hagemeyer, A.; Hogan, Z.; Lesik, A.; Streukens, G.; Volpe, A.F.; Turner, H.W.; Weinberg, W.H.; et al. High throughput discovery of CO oxidation/VOC combustion and water–gas shift catalysts for industrial multi-component streams. Top. Catal. 2006, 38, 195–209. [Google Scholar] [CrossRef]
- Figueiredo, R.T.; Santos, M.S.; Andrade, H.M.C.; Fierro, J.L.G. Effect of alkali cations on the CuZnOAl2O3 low temperature water gas-shift catalyst. Catal. Today 2011, 172, 166–170. [Google Scholar] [CrossRef]
- Gao, P.; Graham, U.M.; Shafer, W.D.; Linganiso, L.Z.; Jacobs, G.; Davis, B.H. Nanostructure and kinetic isotope effect of alkali-doped Pt/silica catalysts for water-gas shift and steam-assisted formic acid decomposition. Catal. Today 2016, 272, 42–48. [Google Scholar] [CrossRef]
- Komarov, Y.M.; Il’in, A.A.; Smirnov, N.N.; Il’in, A.P.; Babaikin, D.B. Effect of alkali metal oxides on the selectivity of carbon monoxide conversion to give hydrogen on copper-containing catalysts. Russ. J. Appl. Chem. 2013, 86, 27–31. [Google Scholar] [CrossRef]
- Gnanamani, M.K.; Jacobs, G.; Shafer, W.D.; Sparks, D.E.; Hopps, S.; Thomas, G.A.; Davis, B.H. Low Temperature Water–Gas Shift Reaction Over Alkali Metal Promoted Cobalt Carbide Catalysts. Top. Catal. 2014, 57, 612–618. [Google Scholar] [CrossRef]
- Kusche, M.; Bustillo, K.; Agel, F.; Wasserscheid, P. Highly Effective Pt-Based Water–Gas Shift Catalysts by Surface Modification with Alkali Hydroxide Salts. ChemCatChem 2015, 7, 766–775. [Google Scholar] [CrossRef] [PubMed]
- Yu, Q.; Li, Y.; Zou, X.; Zhuo, H.; Yao, Y.; Suo, Z. Effect of Alkali Metal Promoters on Water-Gas Shift Activity over Au-Pt/CeO2 Catalyst: Effect of Alkali Metal Promoters on Water-Gas Shift Activity over Au-Pt/CeO2 Catalyst. Chin. J. Catal. Chin. Version 2010, 31, 671–676. [Google Scholar] [CrossRef]
- Panagiotopoulou, P.; Kondarides, D.I. Effects of alkali promotion of TiO2 on the chemisorptive properties and water–gas shift activity of supported noble metal catalysts. J. Catal. 2009, 267, 57–66. [Google Scholar] [CrossRef]
- Zhu, X.; Shen, M.; Lobban, L.L.; Mallinson, R.G. Structural effects of Na promotion for high water gas shift activity on Pt–Na/TiO2. J. Catal. 2011, 278, 123–132. [Google Scholar] [CrossRef]
- González-Cobos, J.; Valverde, J.L.; De Lucas-Consuegra, A. Electrochemical vs. chemical promotion in the H2 production catalytic reactions. Int. J. Hydrog. Energy 2017, 42, 13712–13723. [Google Scholar] [CrossRef]
- Menacherry, P.V.; Haller, G.L. The effect of water on the infrared spectra of CO adsorbed on Pt/K L-zeolite. Catal. Lett. 1997, 44, 135–144. [Google Scholar] [CrossRef]
- Jentys, A. Estimation of mean size and shape of small metal particles by EXAFS. Phys. Chem. Chem. Phys. 1999, 1, 4059–4063. [Google Scholar] [CrossRef]
- Marinković, N.S.; Sasaki, K.; Adžić, R.R. Nanoparticle size evaluation of catalysts by EXAFS: Advantages and limitations. Zaštita Materijala 2016, 57, 101–109. [Google Scholar] [CrossRef]
- Binet, C.; Daturi, M.; Lavalley, J.-C. IR study of polycrystalline ceria properties in oxidised and reduced states. Catal. Today 1999, 50, 207–225. [Google Scholar] [CrossRef]
- Martinelli, M.; Watson, C.D.; Jacobs, G. Sodium doping of Pt/m-ZrO2 promotes C–C scission and decarboxylation during ethanol steam reforming. Int. J. Hydrog. Energy 2020, 45, 18490–18501. [Google Scholar] [CrossRef]
- Martinelli, M.; Alhraki, N.; Castro, J.D.; Matamoros, M.E.; Jacobs, G. 6-Water-gas shift: Effect of Na loading on Pt/m-zirconia catalysts for low-temperature shift for the production and purification of hydrogen. In New Dimensions in Production and Utilization of Hydrogen; Nanda, S., Vo, D.-V.N., Nguyen-Tri, P., Eds.; Elsevier: Amsterdam, The Netherlands, 2020; pp. 143–160. ISBN 978-0-12-819553-6. [Google Scholar]
- Allen, L.C. Electronegativity is the average one-electron energy of the valence-shell electrons in ground-state free atoms. J. Am. Chem. Soc. 1989, 111, 9003–9014. [Google Scholar] [CrossRef]
- Jacoby, M. X-ray Absorption Spectroscopy. Chem. Eng. News Arch. 2001, 79, 33–38. [Google Scholar] [CrossRef]
- Ressler, T. WinXAS: A Program for X-ray Absorption Spectroscopy Data Analysis under MS-Windows. J. Synchrotron Radiat. 1998, 5, 118–122. [Google Scholar] [CrossRef]
- Ravel, B. IUCr ATOMS: Crystallography for the X-ray Absorption Spectroscopist. Available online: https://scripts.iucr.org/cgi-bin/paper?hf5152 (accessed on 22 November 2020).
- Newville, M.; Ravel, B.; Haskel, D.; Rehr, J.J.; Stern, E.A.; Yacoby, Y. Analysis of multiple-scattering XAFS data using theoretical standards. Phys. B Condens. Matter 1995, 208–209, 154–156. [Google Scholar] [CrossRef]
Figure 1.
(Top) Reactant-promoted associative mechanism involving formates and carbonates; and (Bottom) Support-mediated redox mechanism.
Figure 1.
(Top) Reactant-promoted associative mechanism involving formates and carbonates; and (Bottom) Support-mediated redox mechanism.

Figure 2.
Pore size distribution (PSD) at different rubidium loadings.
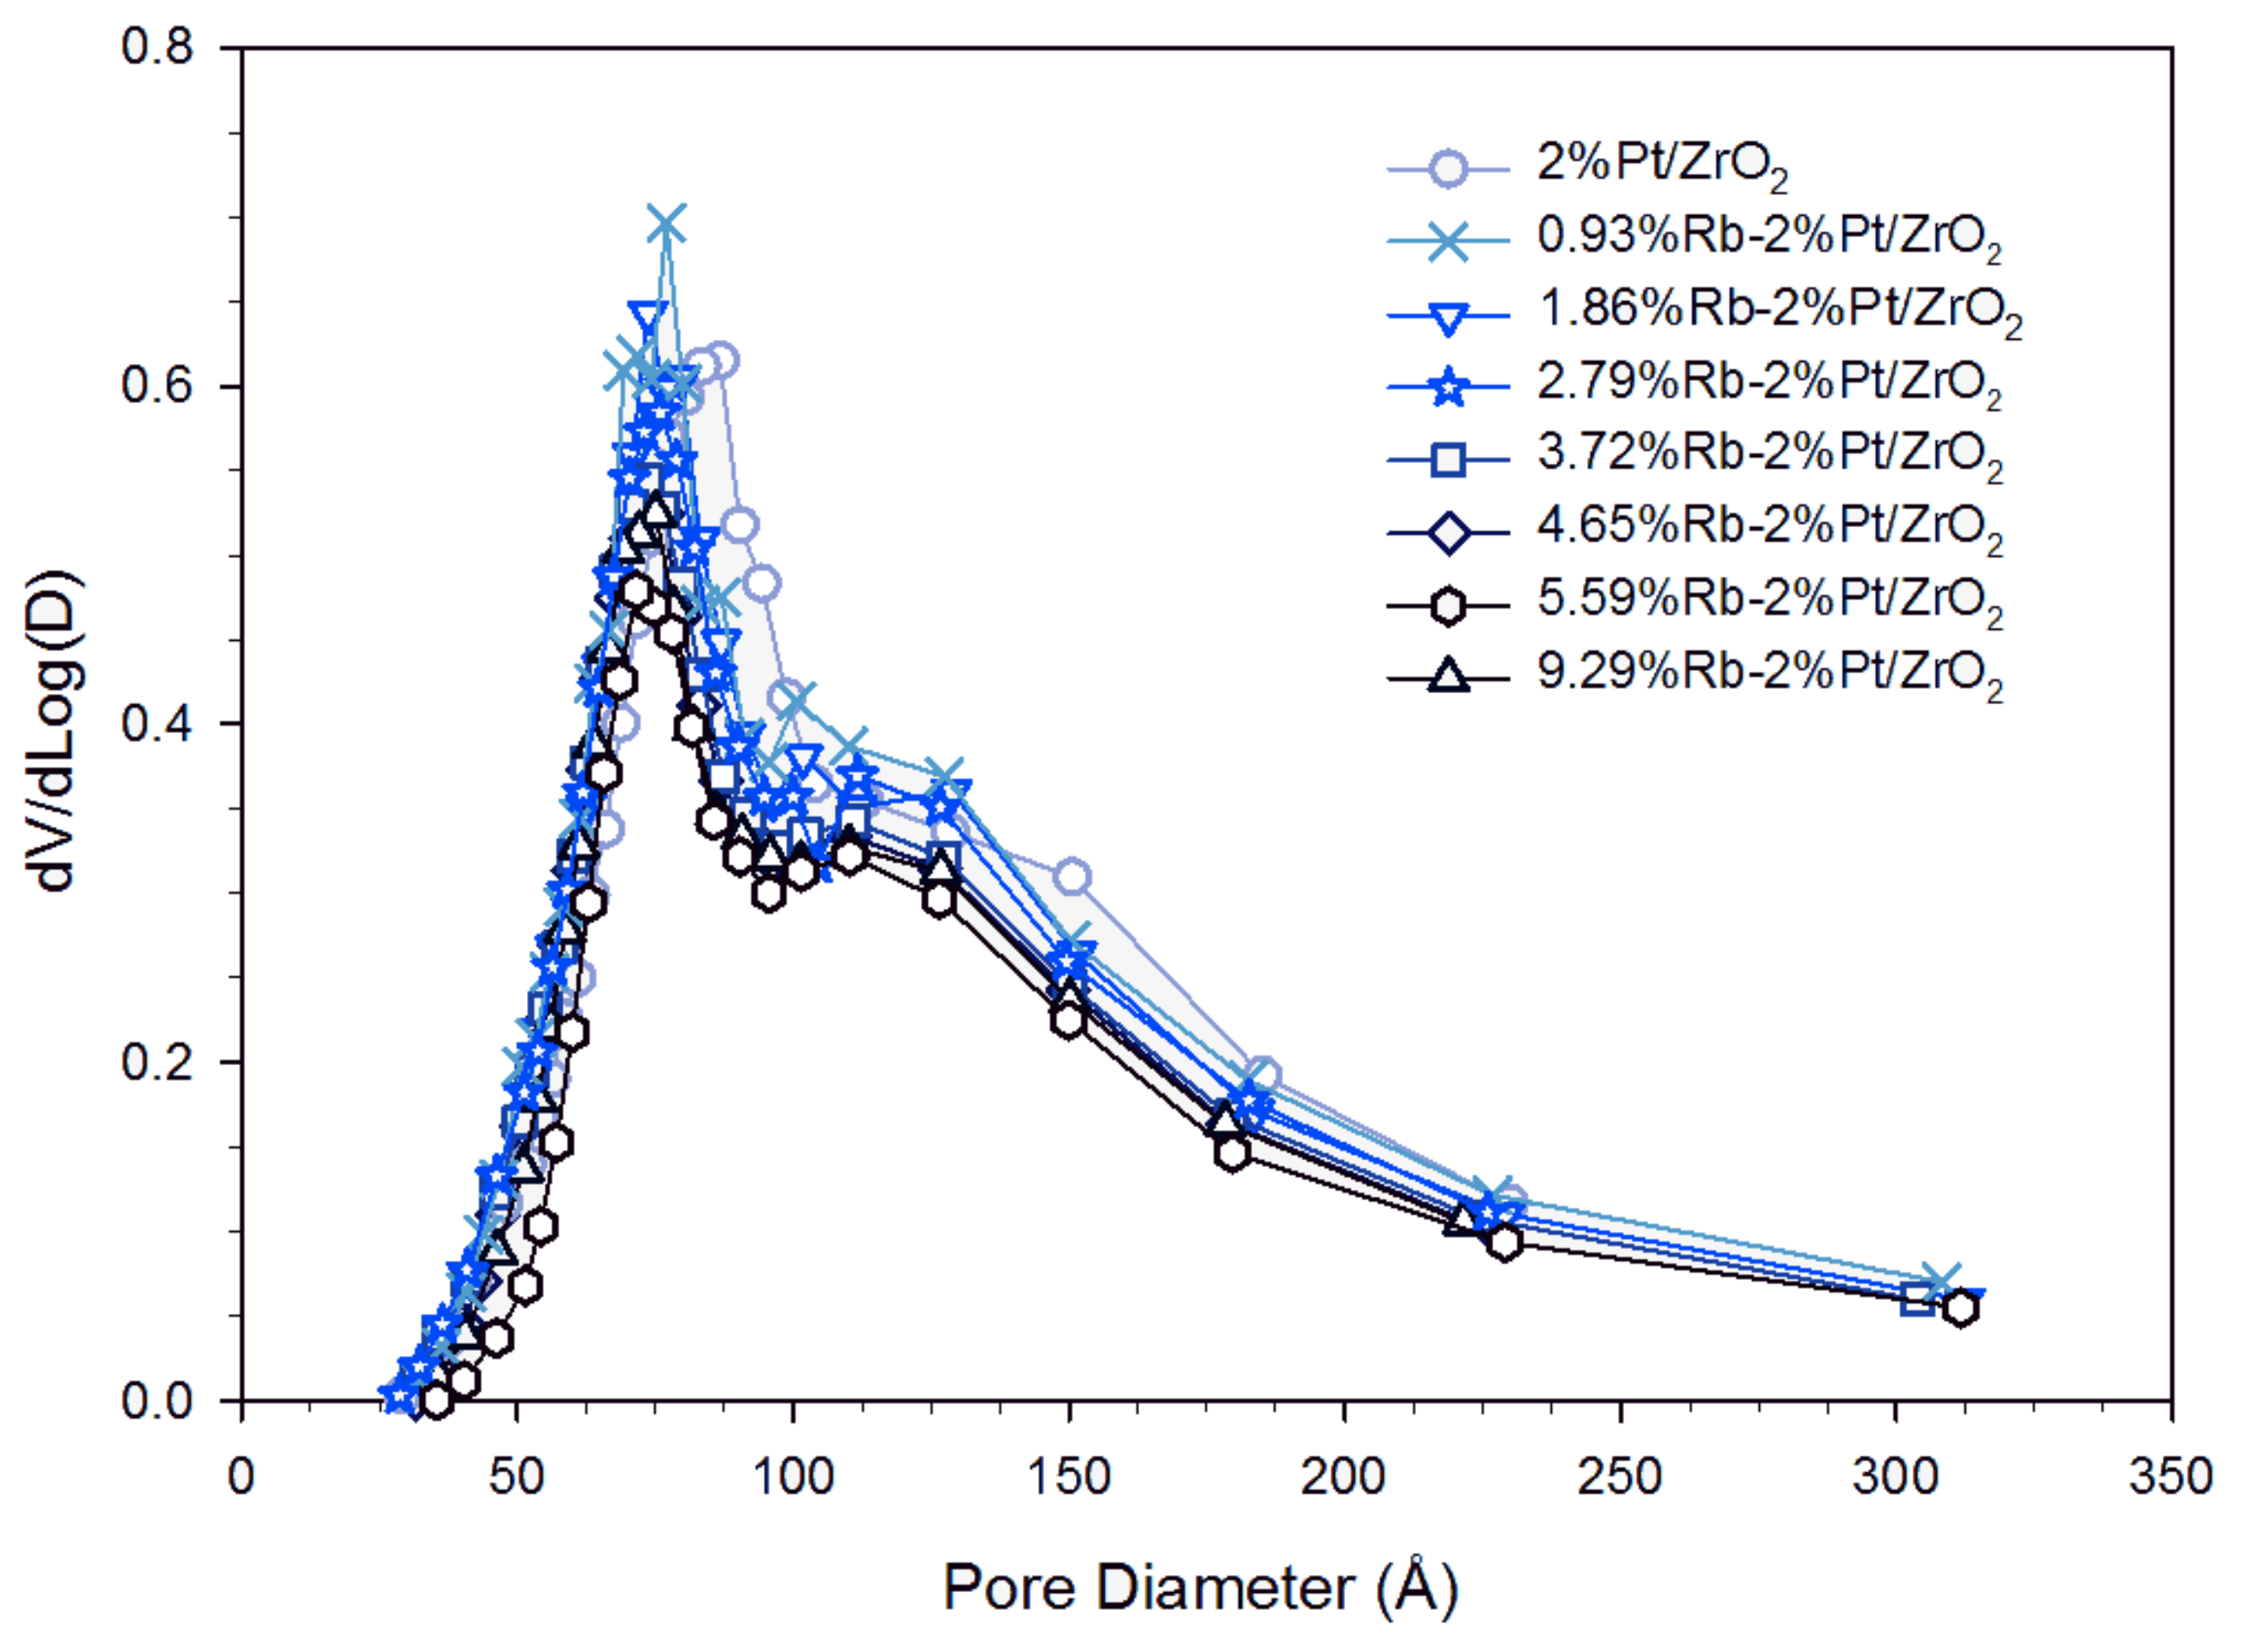
Figure 3.
Temperature programmed reduction (TPR) profiles of (a) 2%Pt/ZrO2, and the same doped with (b) 0.55%Rb, (c) 1.86%Rb, (d) 2.79%Rb, (e) 4.65%Rb, and (f) 9.29%Rb.
Figure 3.
Temperature programmed reduction (TPR) profiles of (a) 2%Pt/ZrO2, and the same doped with (b) 0.55%Rb, (c) 1.86%Rb, (d) 2.79%Rb, (e) 4.65%Rb, and (f) 9.29%Rb.
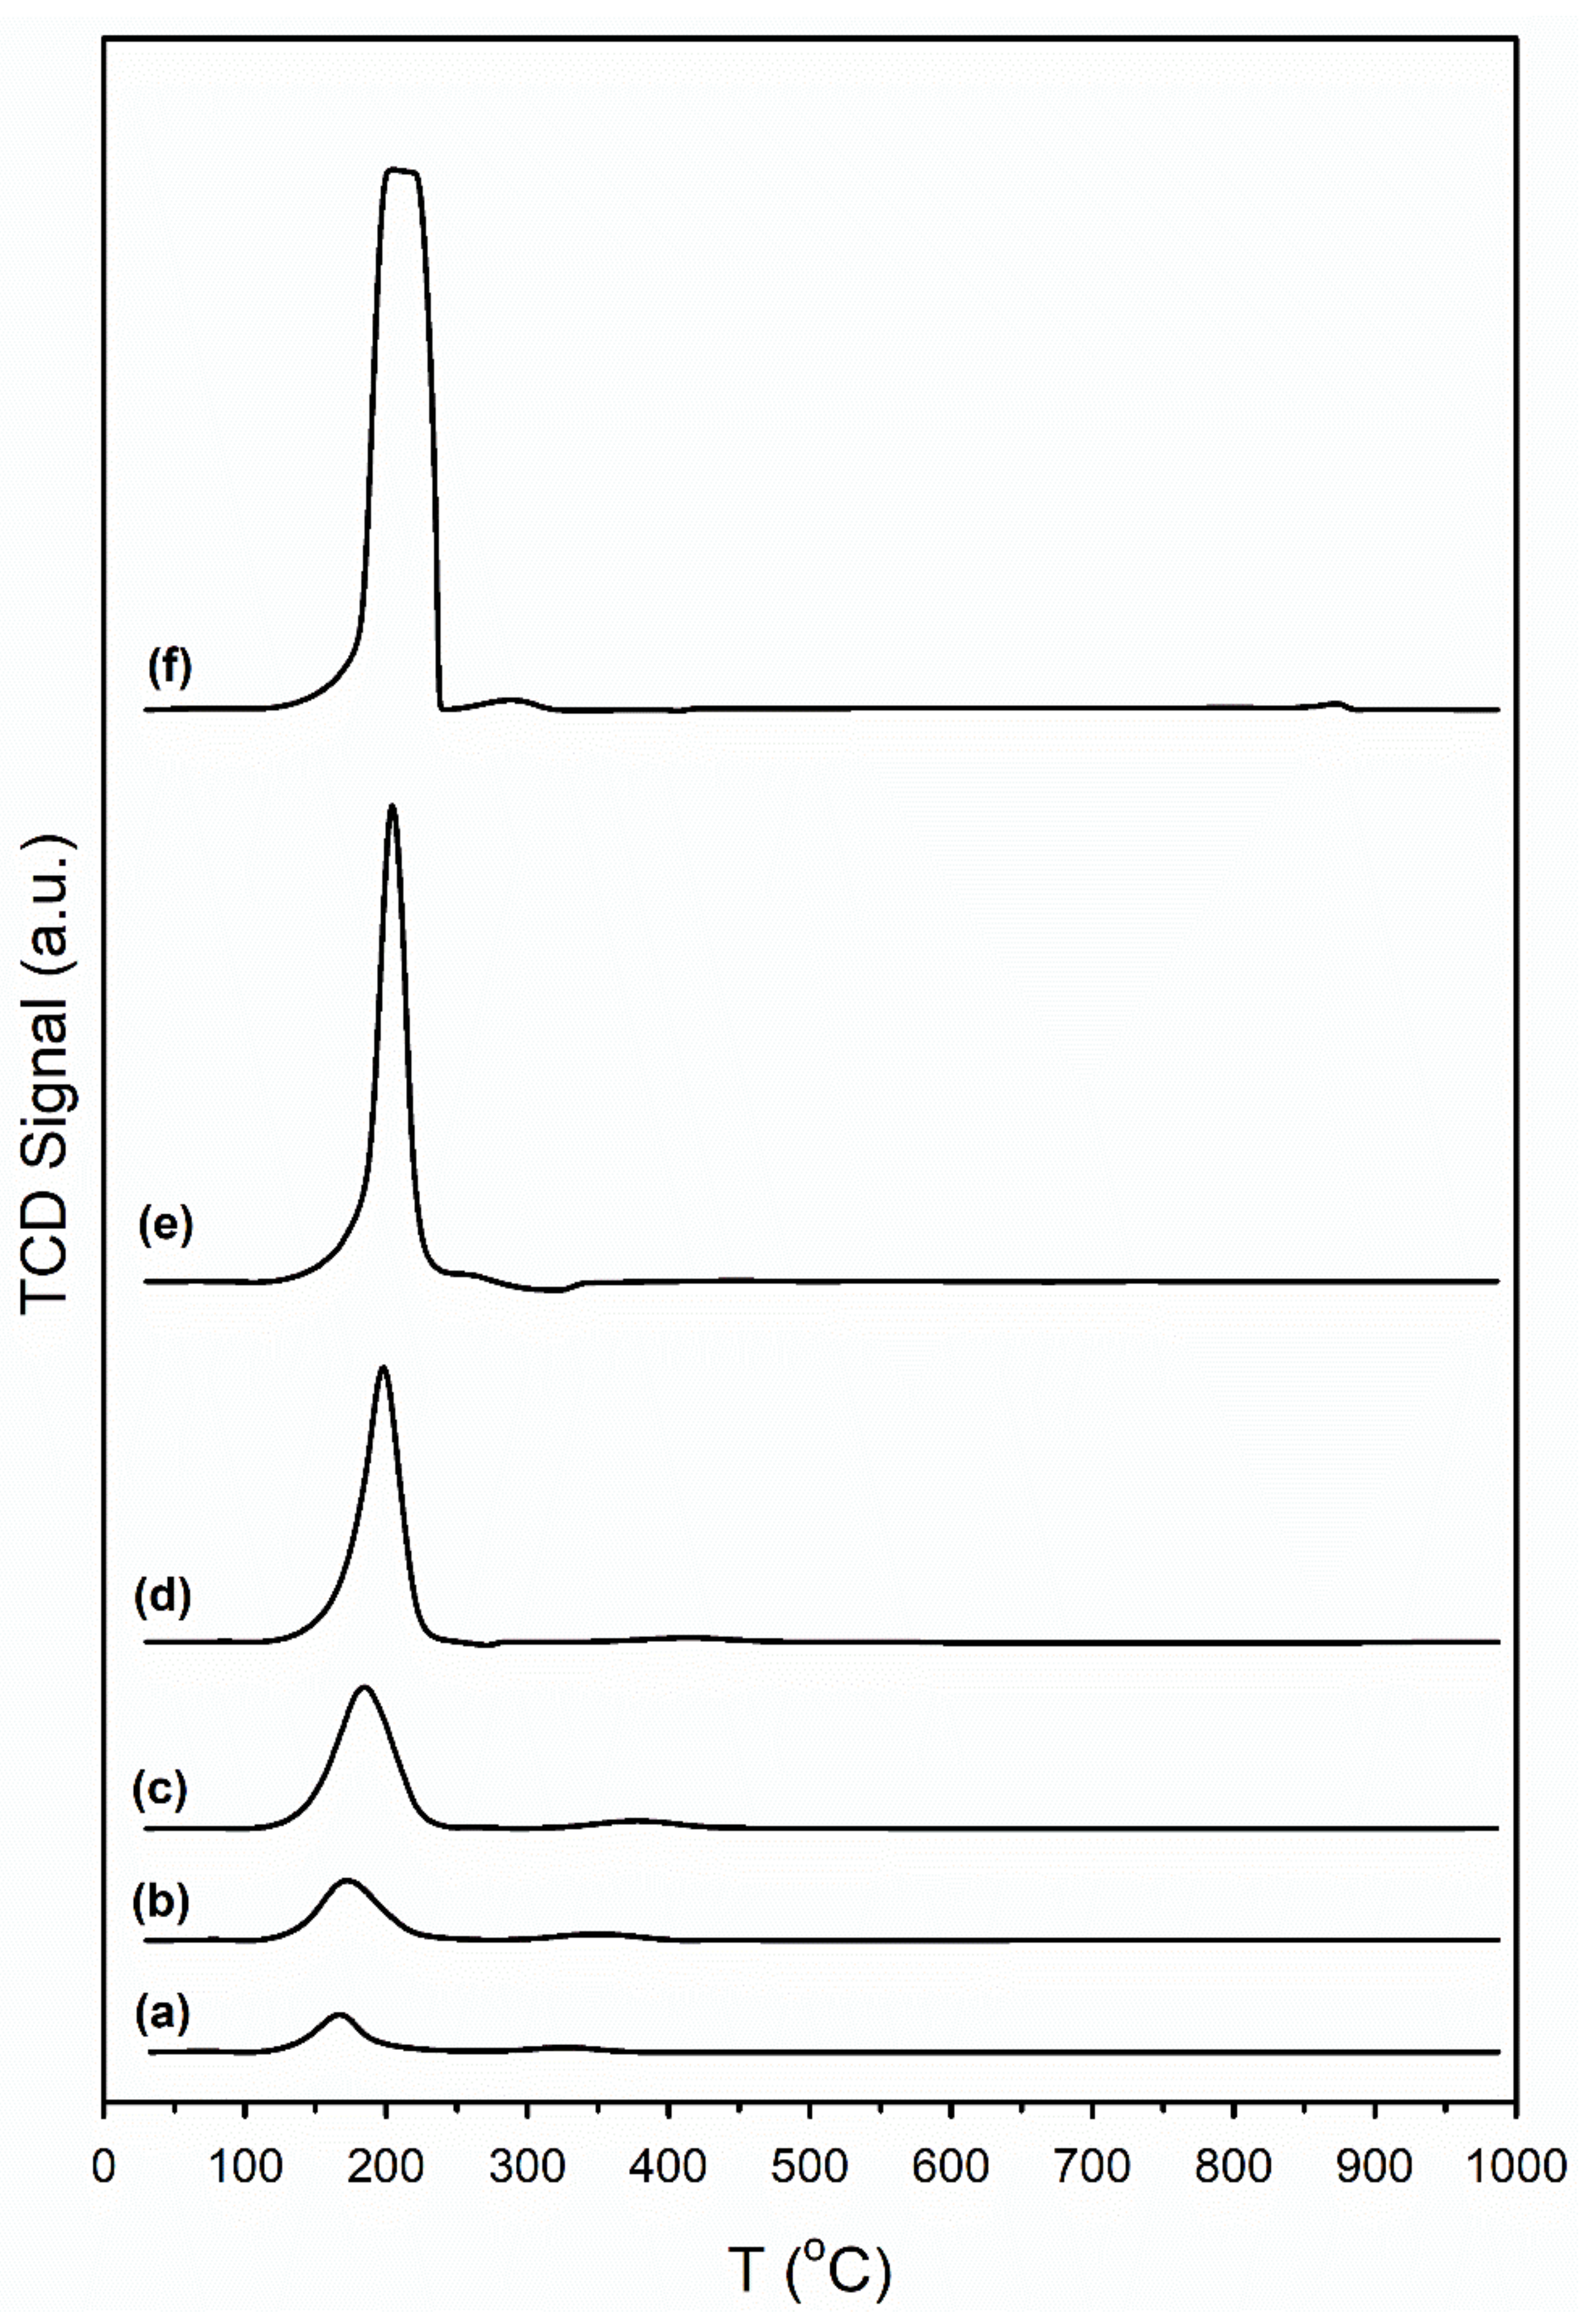
Figure 4.
TCD signal (black) and MS signals of (red) H2, (blue) CO, and (green) CO2 during temperature programmed reduction in 10%H2/Ar for (a) 2%Pt/ZrO2, and the same doped with (b) 0.55%Rb, (c) 1.86%Rb (d) 2.79%Rb, (e) 4.65%Rb, and (f) 9.29%Rb.
Figure 4.
TCD signal (black) and MS signals of (red) H2, (blue) CO, and (green) CO2 during temperature programmed reduction in 10%H2/Ar for (a) 2%Pt/ZrO2, and the same doped with (b) 0.55%Rb, (c) 1.86%Rb (d) 2.79%Rb, (e) 4.65%Rb, and (f) 9.29%Rb.
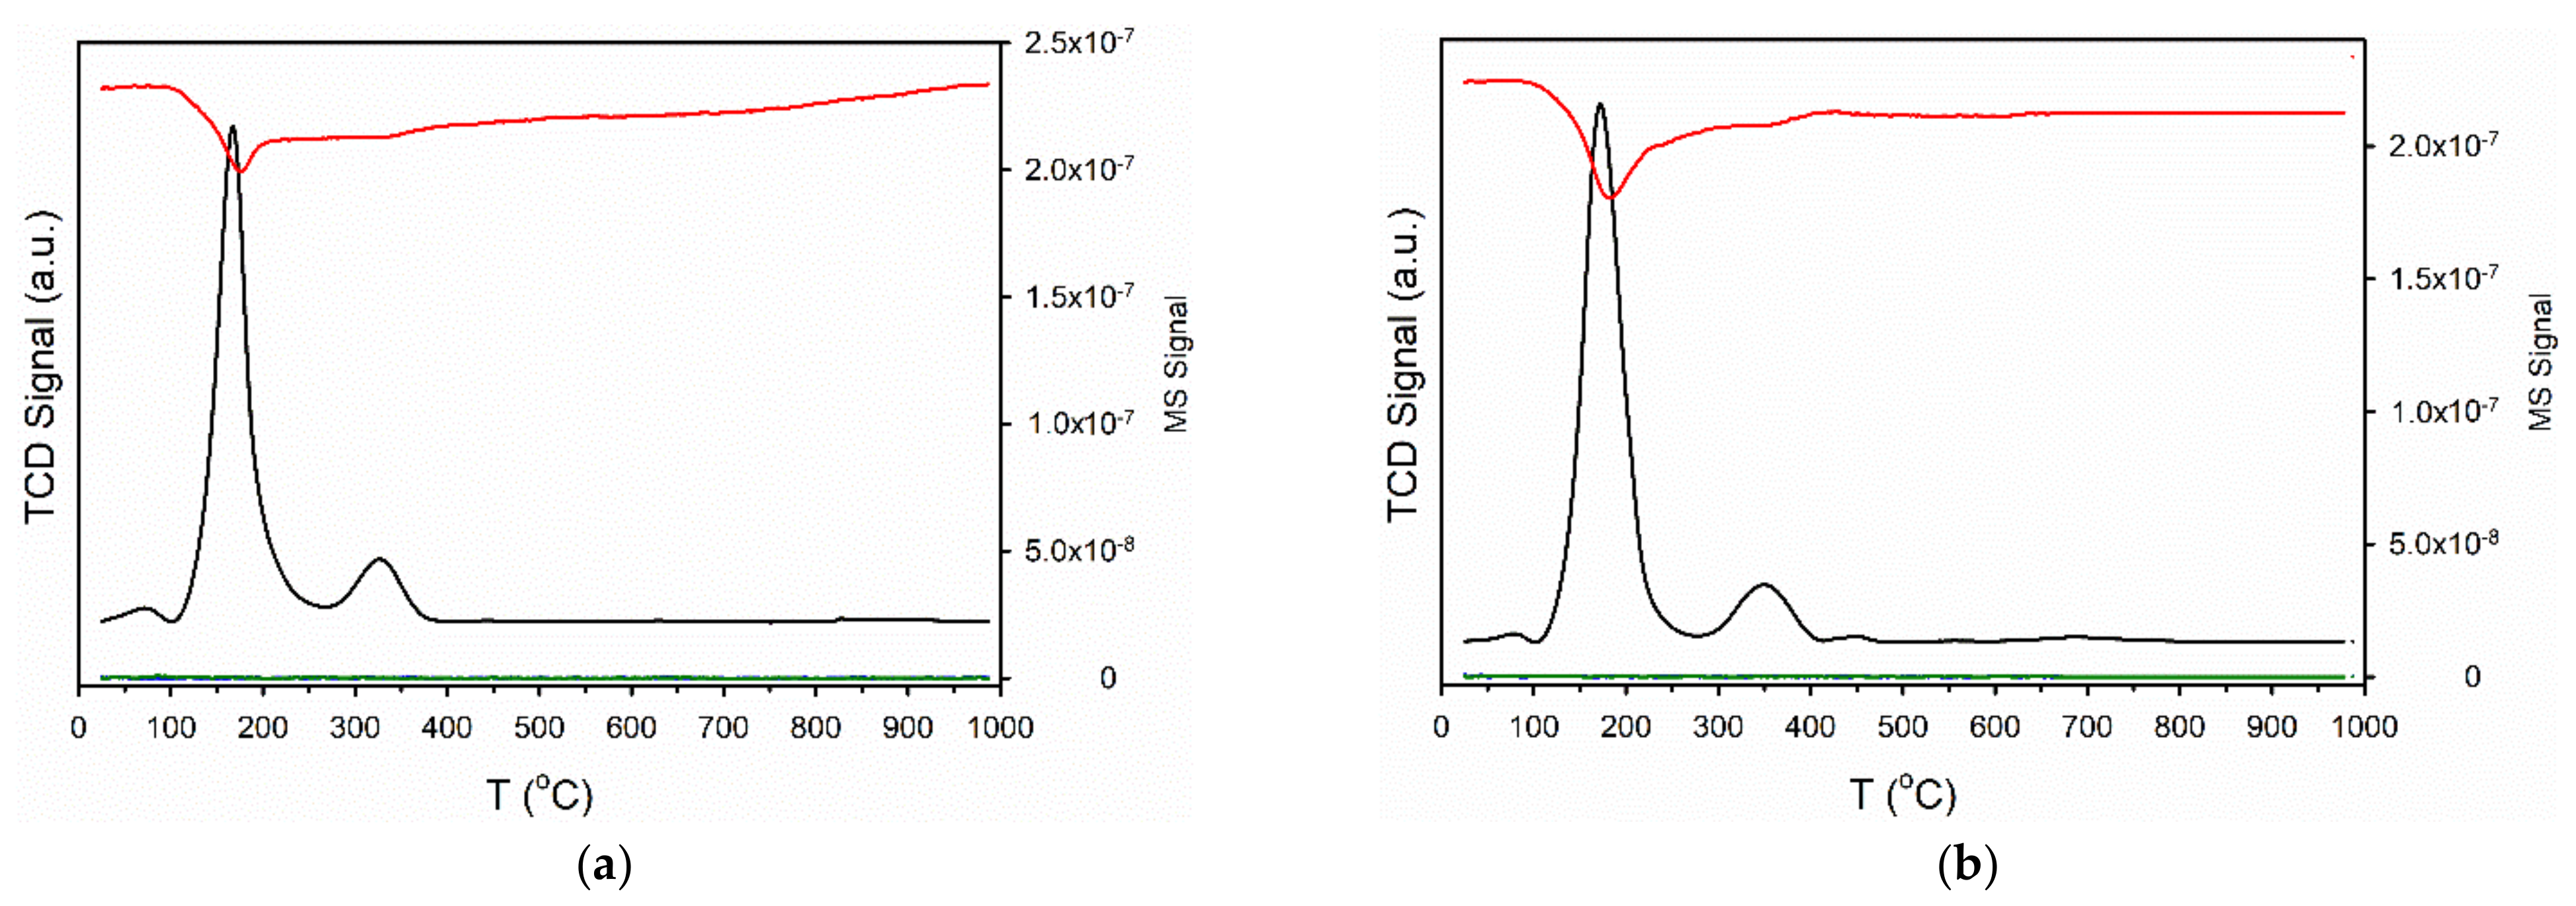
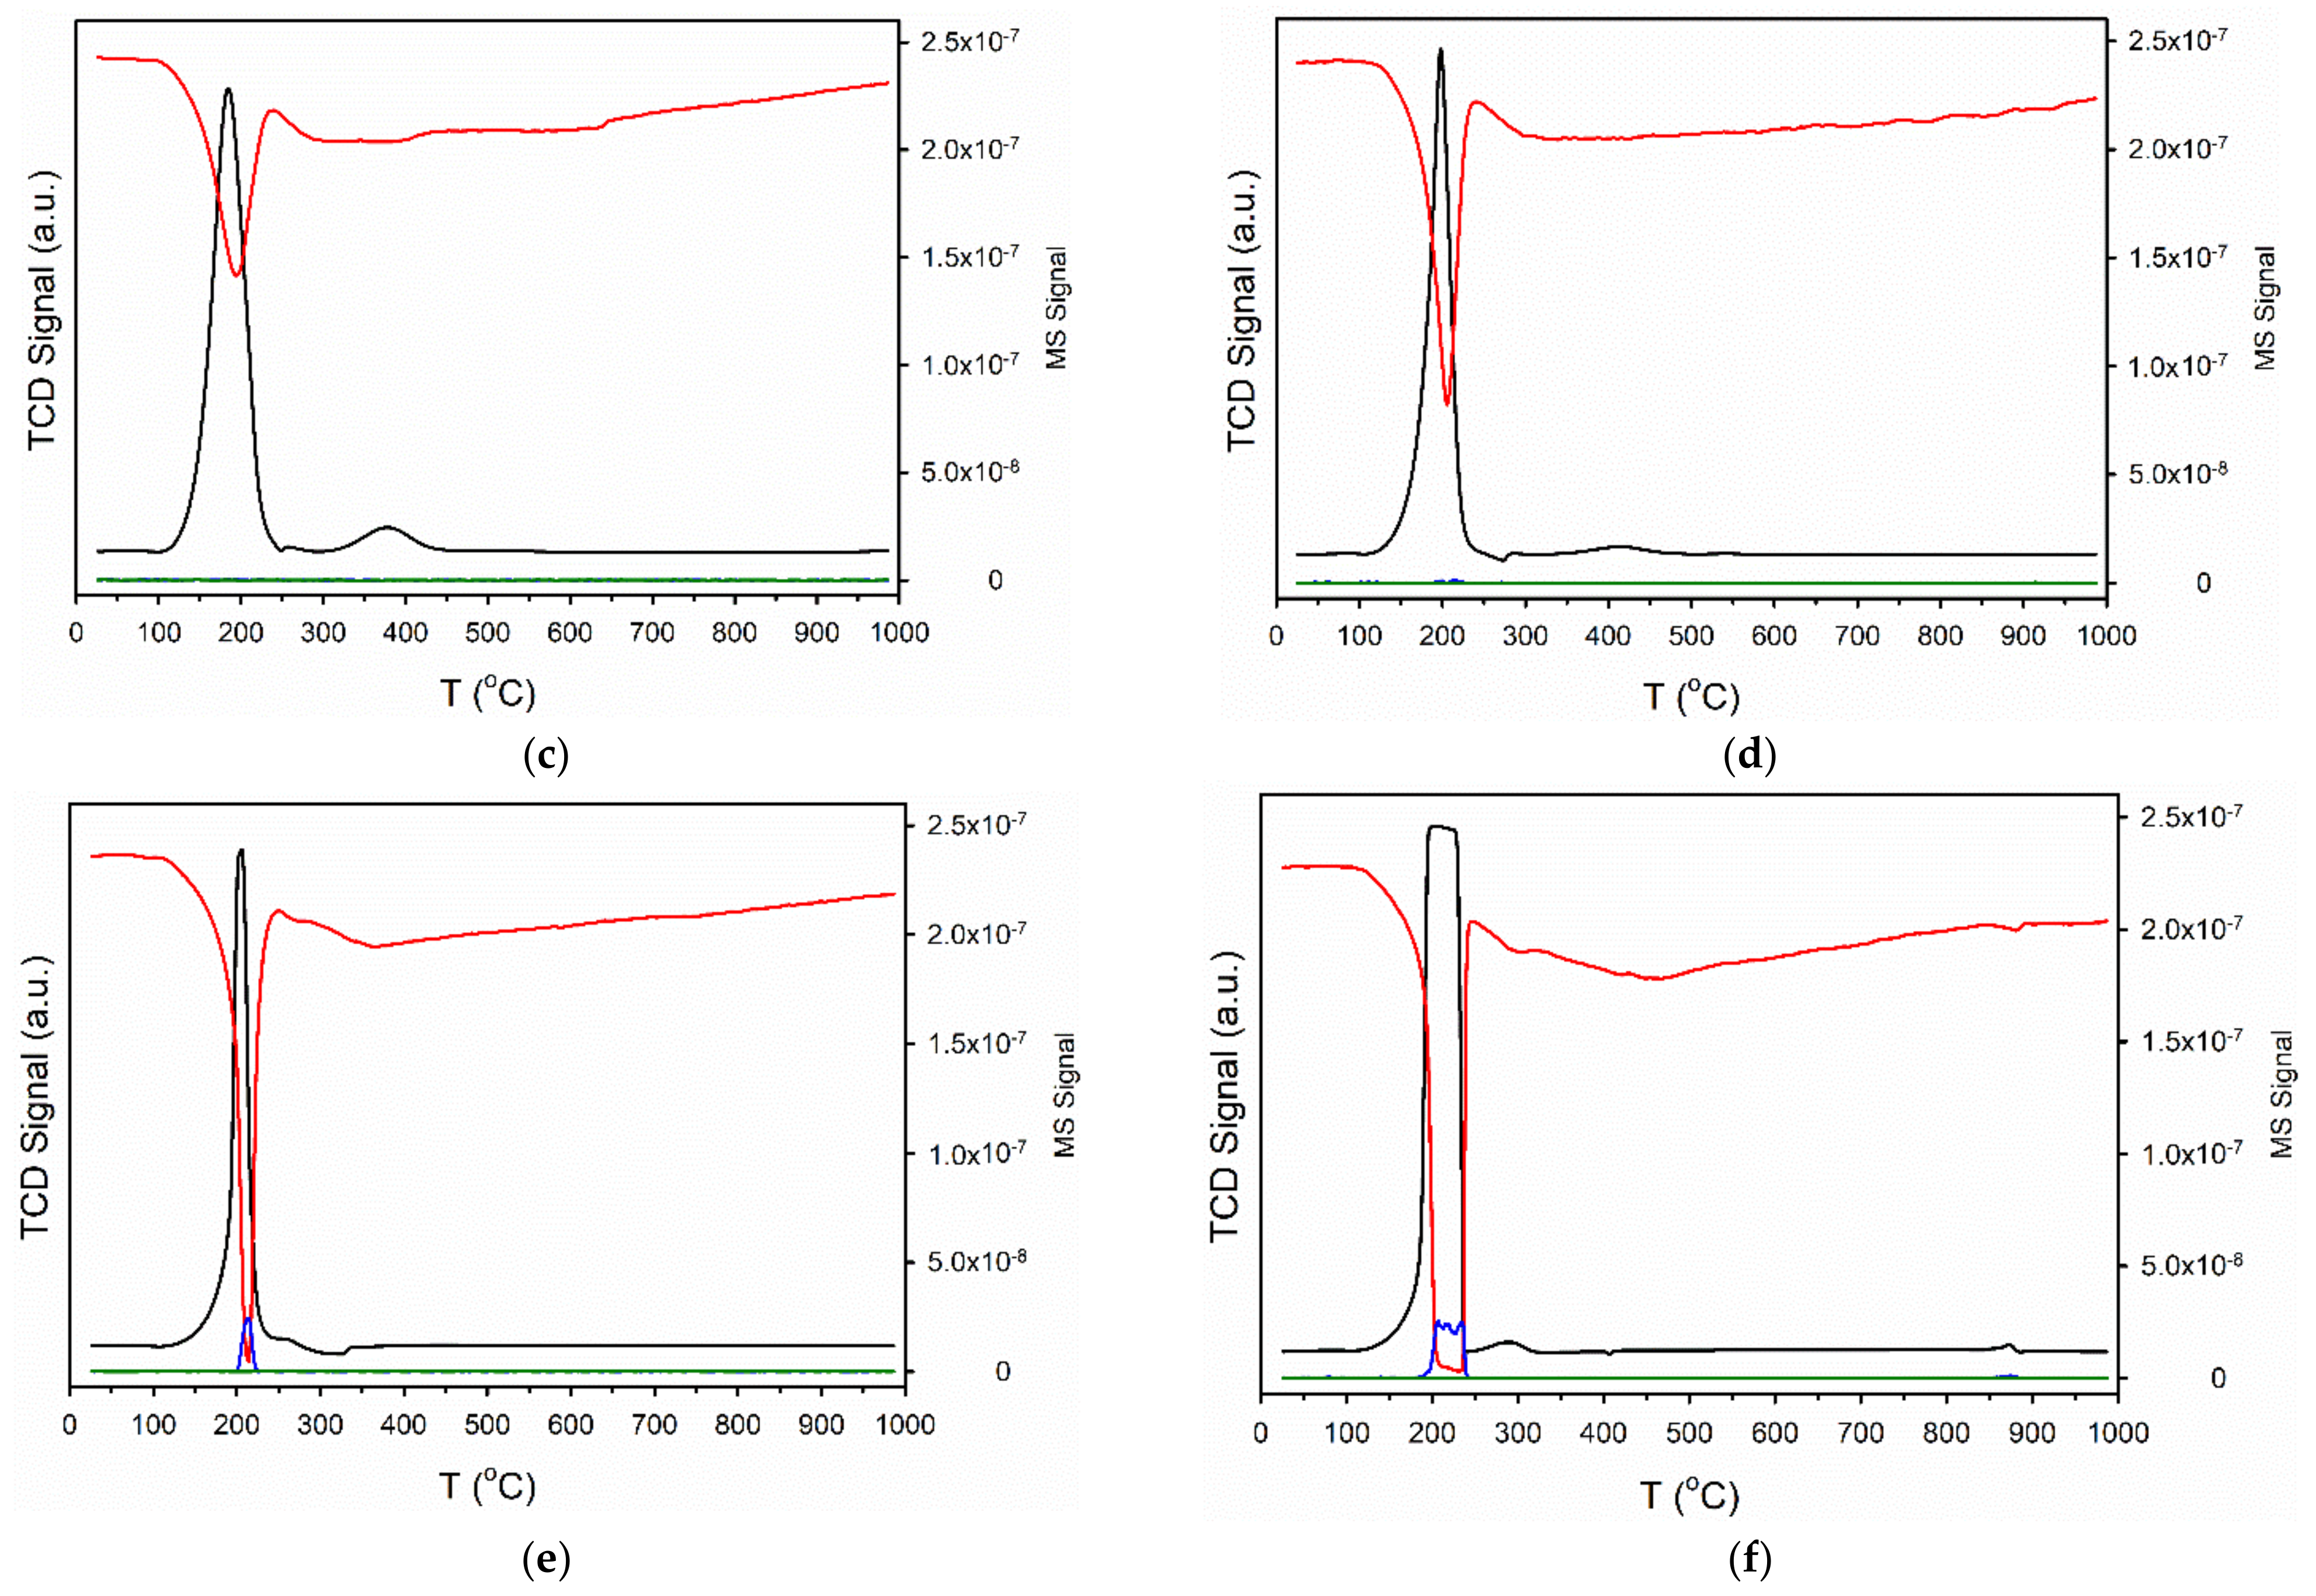
Figure 5.
DRIFTS spectra of carbonate decomposition during activation for (a) 2%Pt/ZrO2, and the same doped with (b) 0.55%Rb, (c) 0.93%Rb, (d) 1.86%Rb, (e) 2.79%Rb, (f) 3.72%Rb, (g) 4.65%Rb, (h) 5.58%Rb, and (i) 9.29%Rb.
Figure 5.
DRIFTS spectra of carbonate decomposition during activation for (a) 2%Pt/ZrO2, and the same doped with (b) 0.55%Rb, (c) 0.93%Rb, (d) 1.86%Rb, (e) 2.79%Rb, (f) 3.72%Rb, (g) 4.65%Rb, (h) 5.58%Rb, and (i) 9.29%Rb.
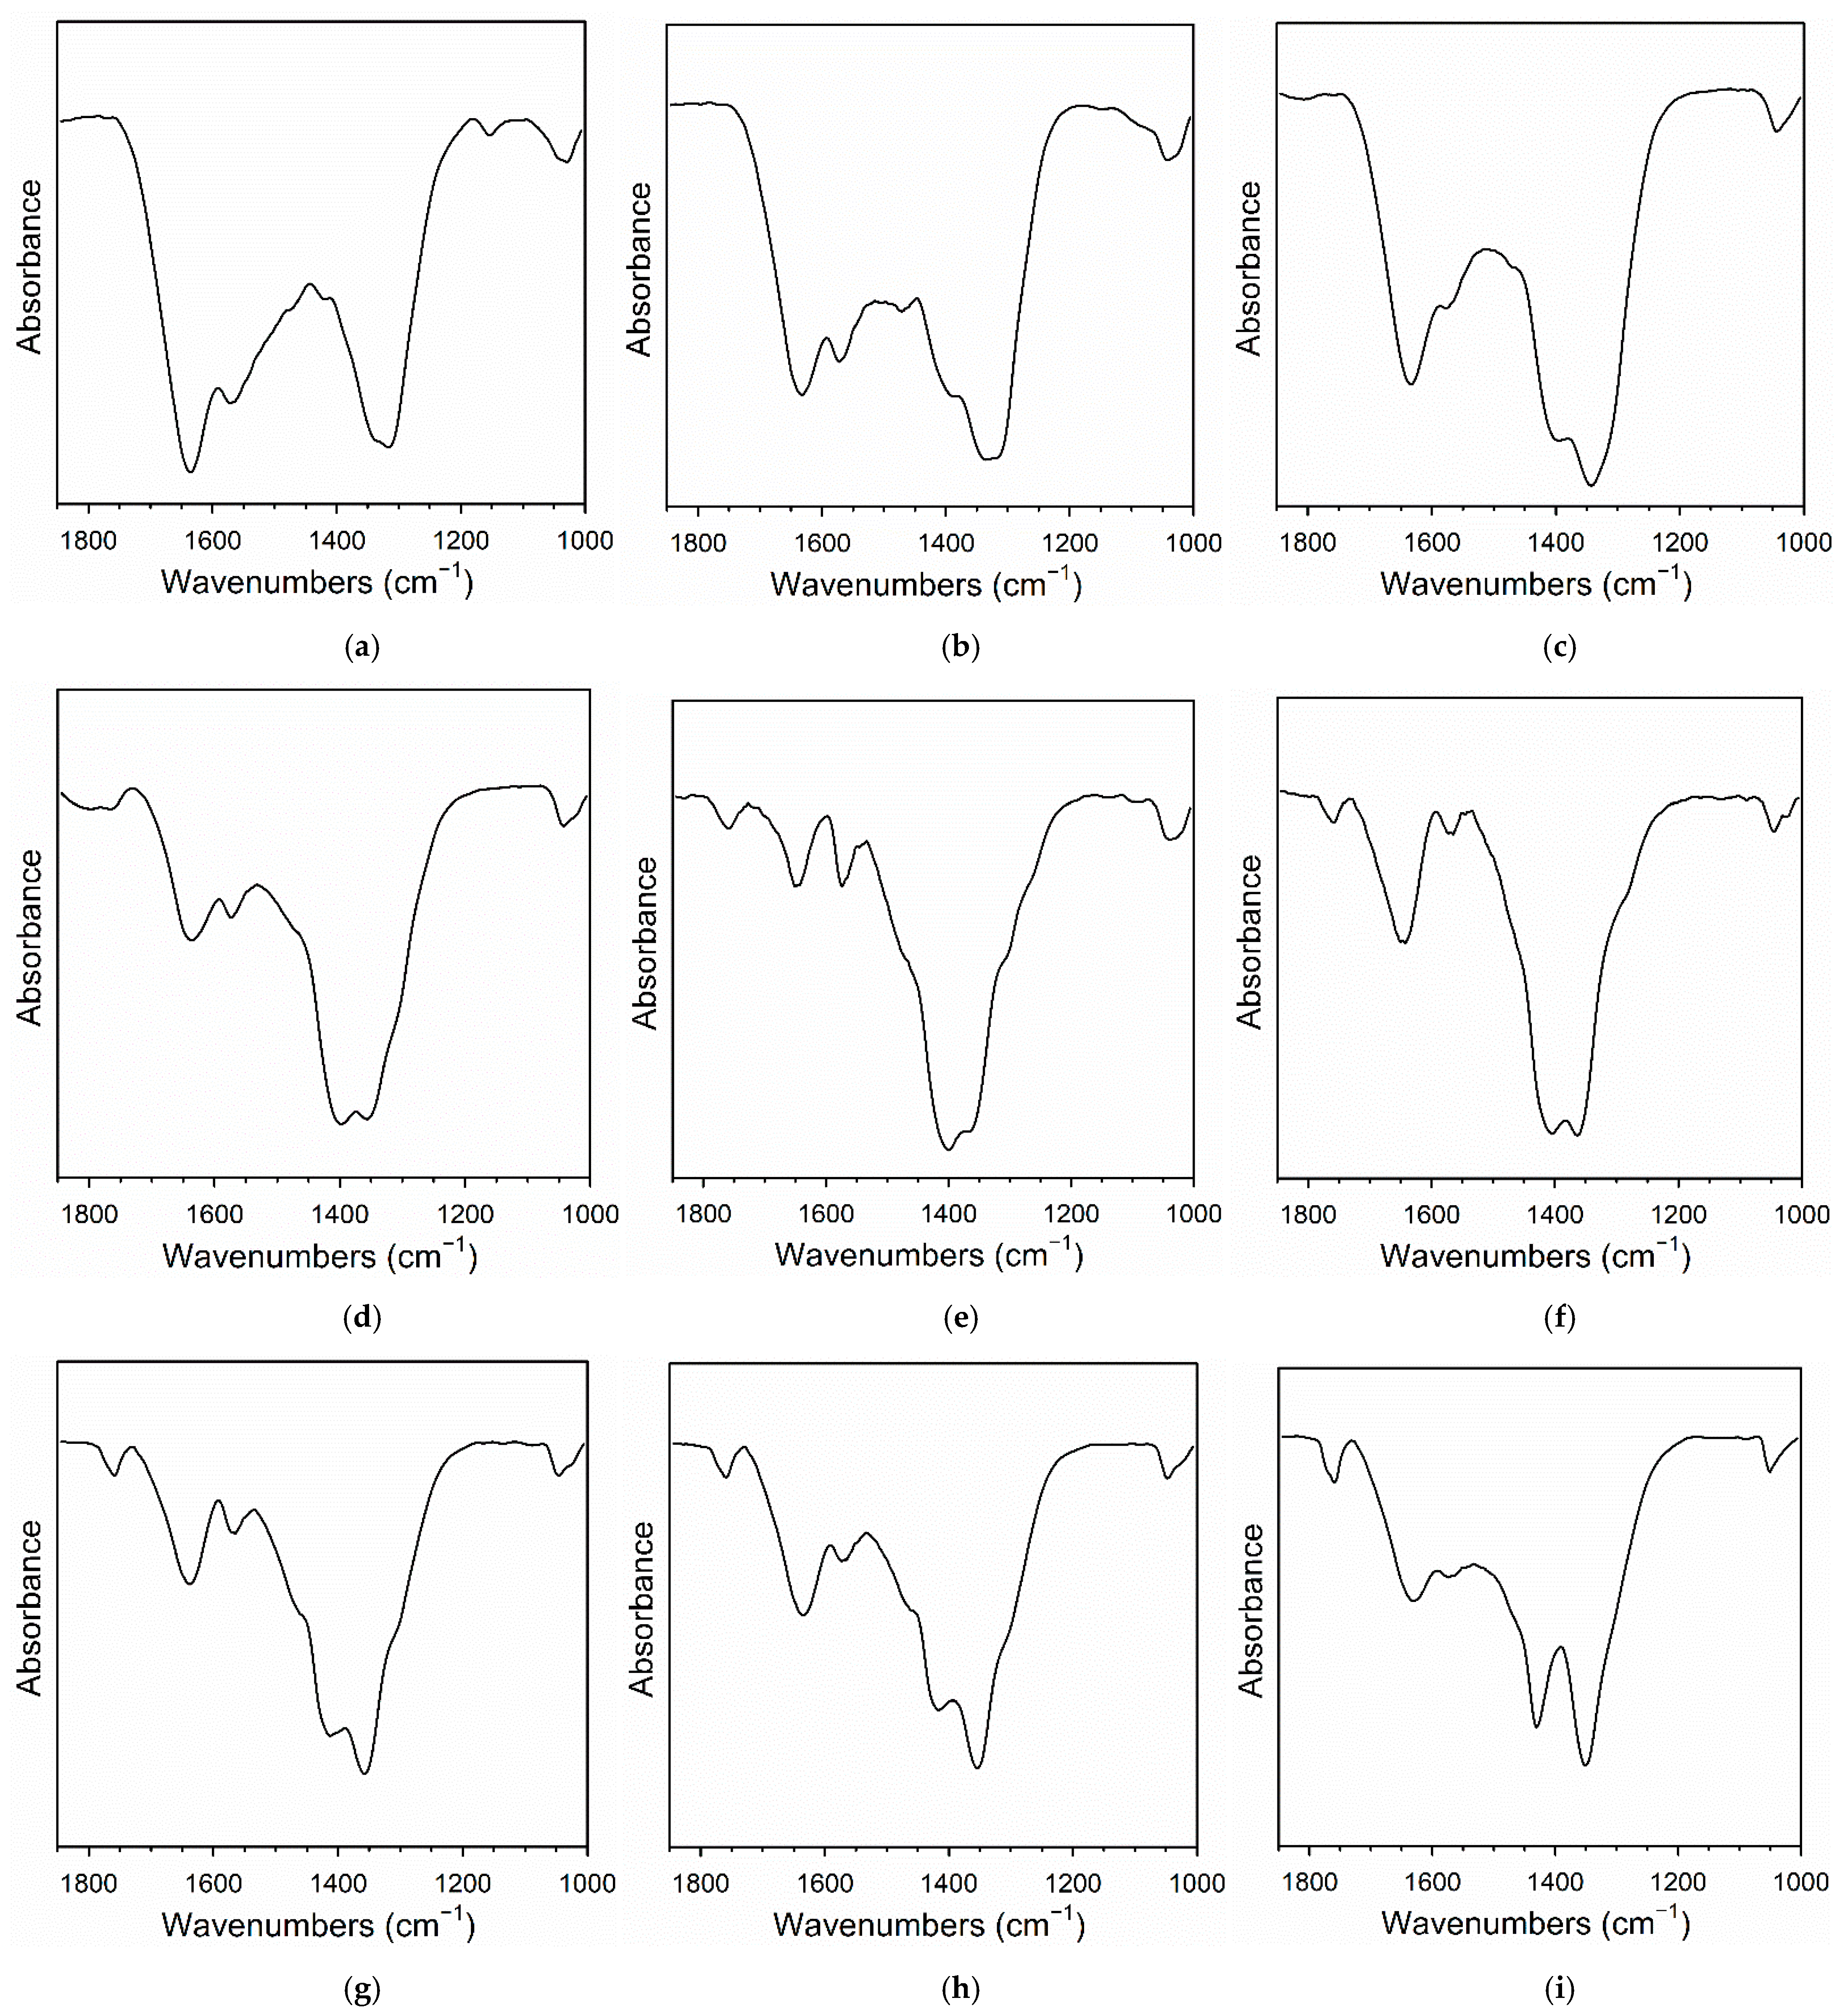
Figure 6.
CO2 temperature programmed desorption (TPD) signals of carbonate decomposition during activation for (a) 2%Pt/ZrO2, and the same doped with (b) 0.33%Rb, (c) 0.74%Rb, (d) 0.93%Rb, (e) 1.86%Rb, (f) 2.79%Rb, (g) 3.72%Rb, (h) 4.65%Rb, (i) 5.58%Rb, and (j) 9.29%Rb.
Figure 6.
CO2 temperature programmed desorption (TPD) signals of carbonate decomposition during activation for (a) 2%Pt/ZrO2, and the same doped with (b) 0.33%Rb, (c) 0.74%Rb, (d) 0.93%Rb, (e) 1.86%Rb, (f) 2.79%Rb, (g) 3.72%Rb, (h) 4.65%Rb, (i) 5.58%Rb, and (j) 9.29%Rb.

Figure 7.
EXAFS fittings, including (a) raw k1-weighted χ(k) data, (b) (solid line) filtered k1-weighted χ(k) data and (filled circles) results of the fittings, (c) raw and (d) filtered k1-weighted Fourier transform magnitude (solid line) data and (filled circles) results of the fittings for (I) Pt0 foil, (II) 2%Pt/ZrO2, and 2%Pt/ZrO2 with (III) 0.93%Rb, (IV) 1.86%Rb, (V) 2.79%Rb, (VI) 4.65%Rb, (VII) 5.58%Rb, and (VIII) 9.29%Rb.

Figure 8.
XANES spectra at the Pt (solid line) L-3 edge and (dashed) line L-2 edge, as well as (dash-dotted line) the L3–L2 difference spectra of (a) 2%Pt/ZrO2, (b) 0.93%Rb-2%Pt/ZrO2, (c) 1.86%Rb-2%Pt/ZrO2, (d) 2.79%Rb-2%Pt/ZrO2, (e) 4.65%Rb-2%Pt/ZrO2, (f) 5.58%Rb-2%Pt/ZrO2, and (g) 9.29%Rb-2%Pt/ZrO2. (h) Overlays of L3–L2 difference spectra, showing an increase in intensity with Rb loading.
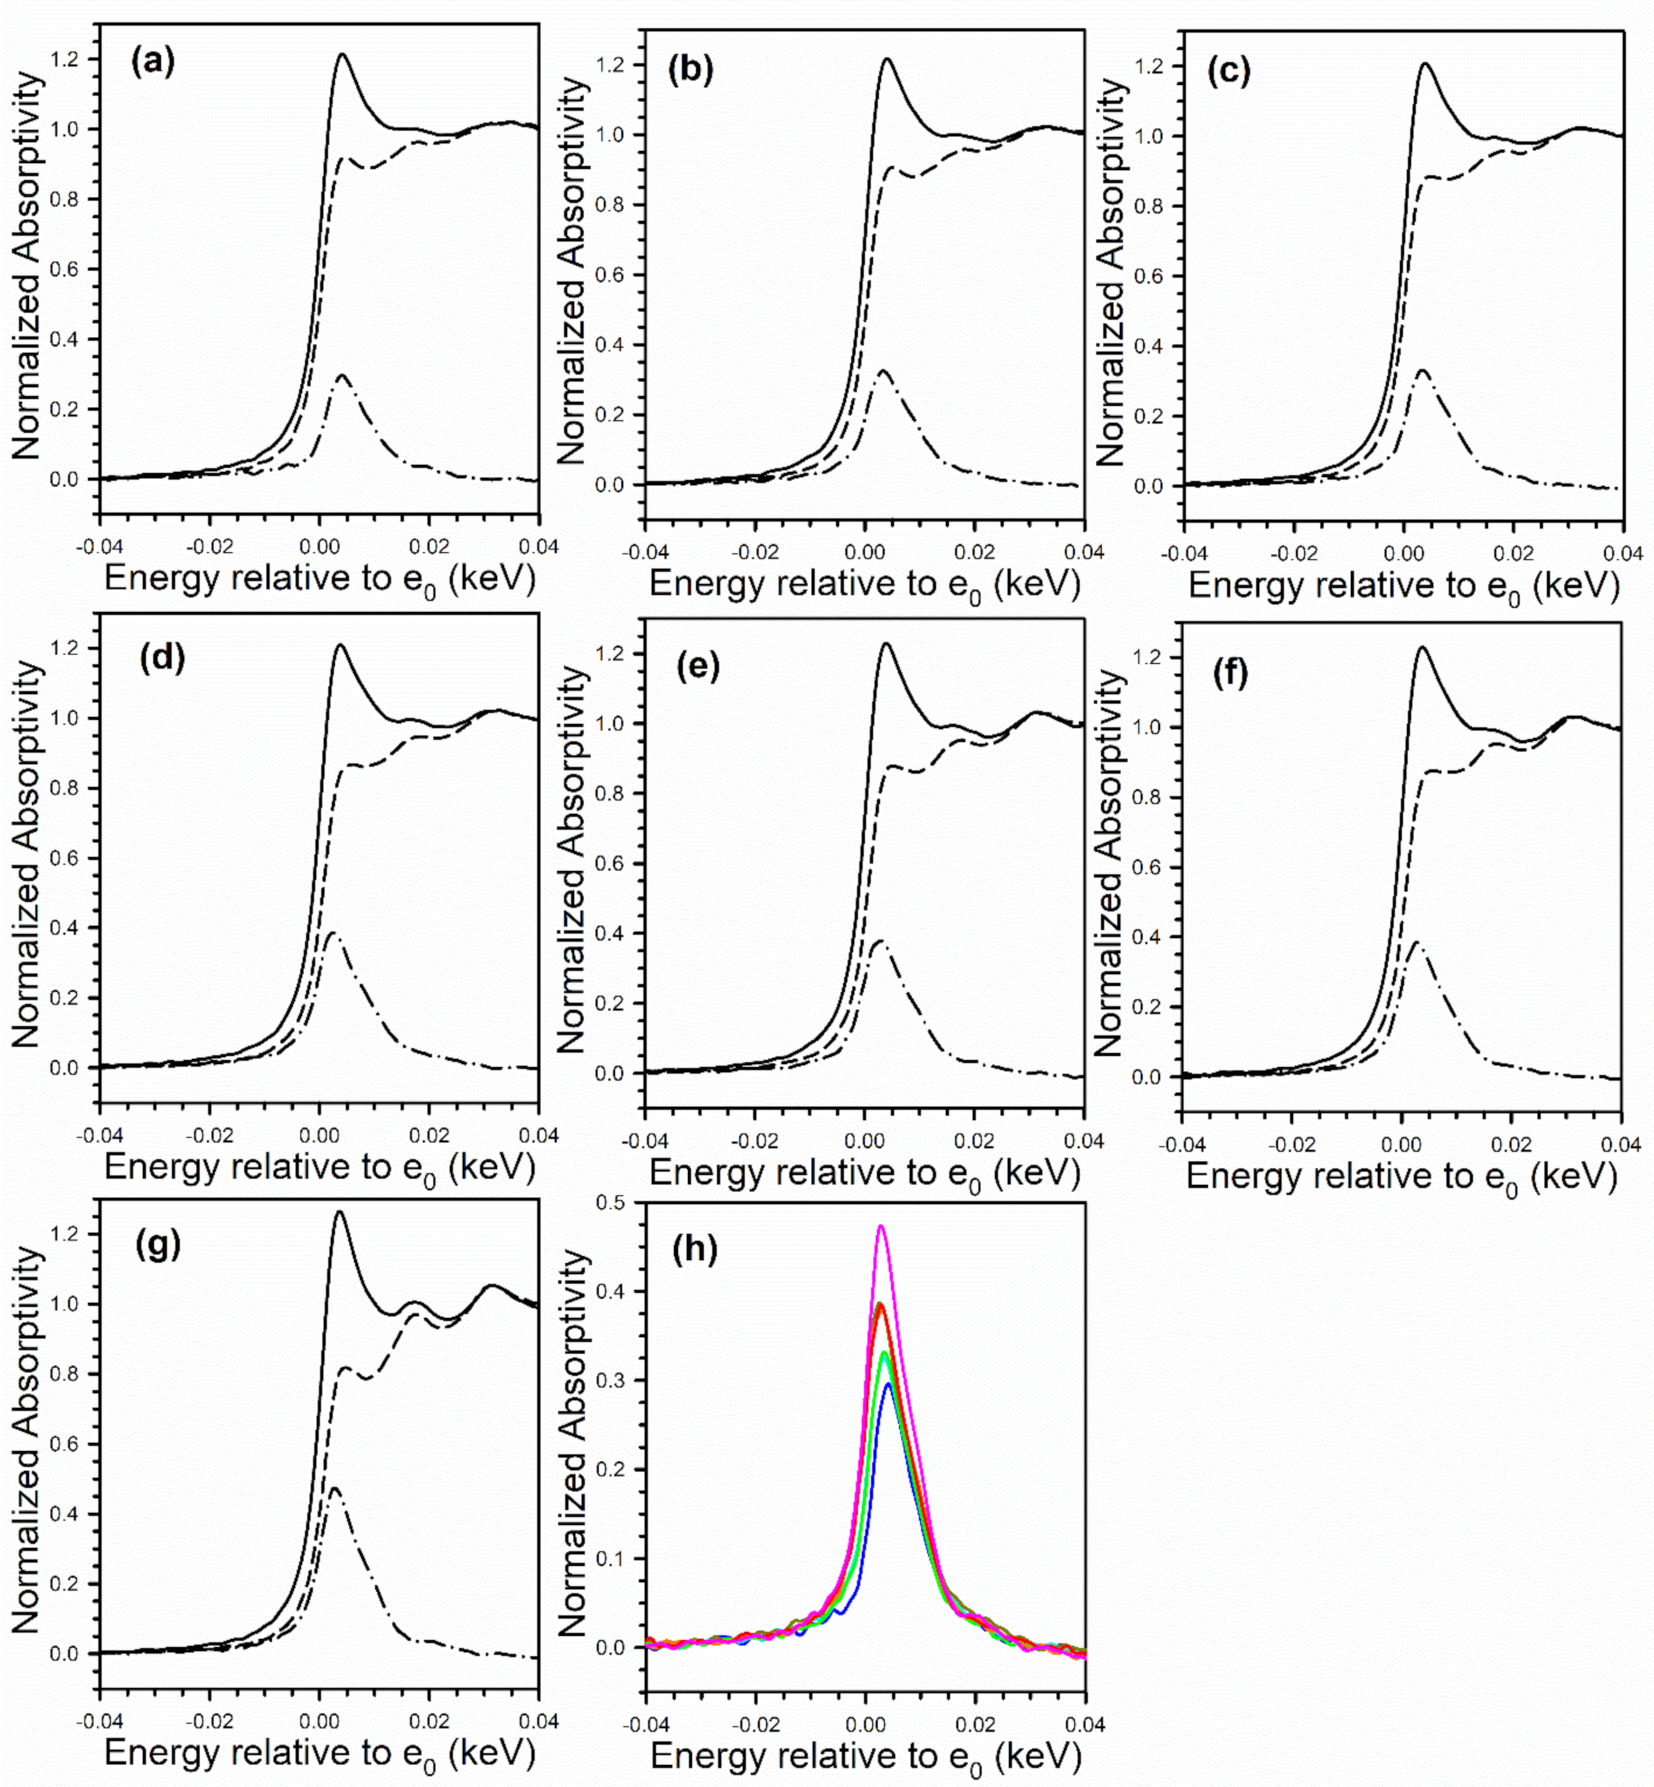
Figure 9.
TPR-XANES spectra at the Pt L-3 edge of (a) 2%Pt/ZrO2, (b) 0.93%Rb-2%Pt/ZrO2, (c) 1.86%Rb-2%Pt/ZrO2, (d) 2.79%Rb-2%Pt/ZrO2, (e) 4.65%Rb-2%Pt/ZrO2, (f) 5.58%Rb-2%Pt/ZrO2, and (g) 9.29%Rb-2%Pt/ZrO2.
Figure 9.
TPR-XANES spectra at the Pt L-3 edge of (a) 2%Pt/ZrO2, (b) 0.93%Rb-2%Pt/ZrO2, (c) 1.86%Rb-2%Pt/ZrO2, (d) 2.79%Rb-2%Pt/ZrO2, (e) 4.65%Rb-2%Pt/ZrO2, (f) 5.58%Rb-2%Pt/ZrO2, and (g) 9.29%Rb-2%Pt/ZrO2.
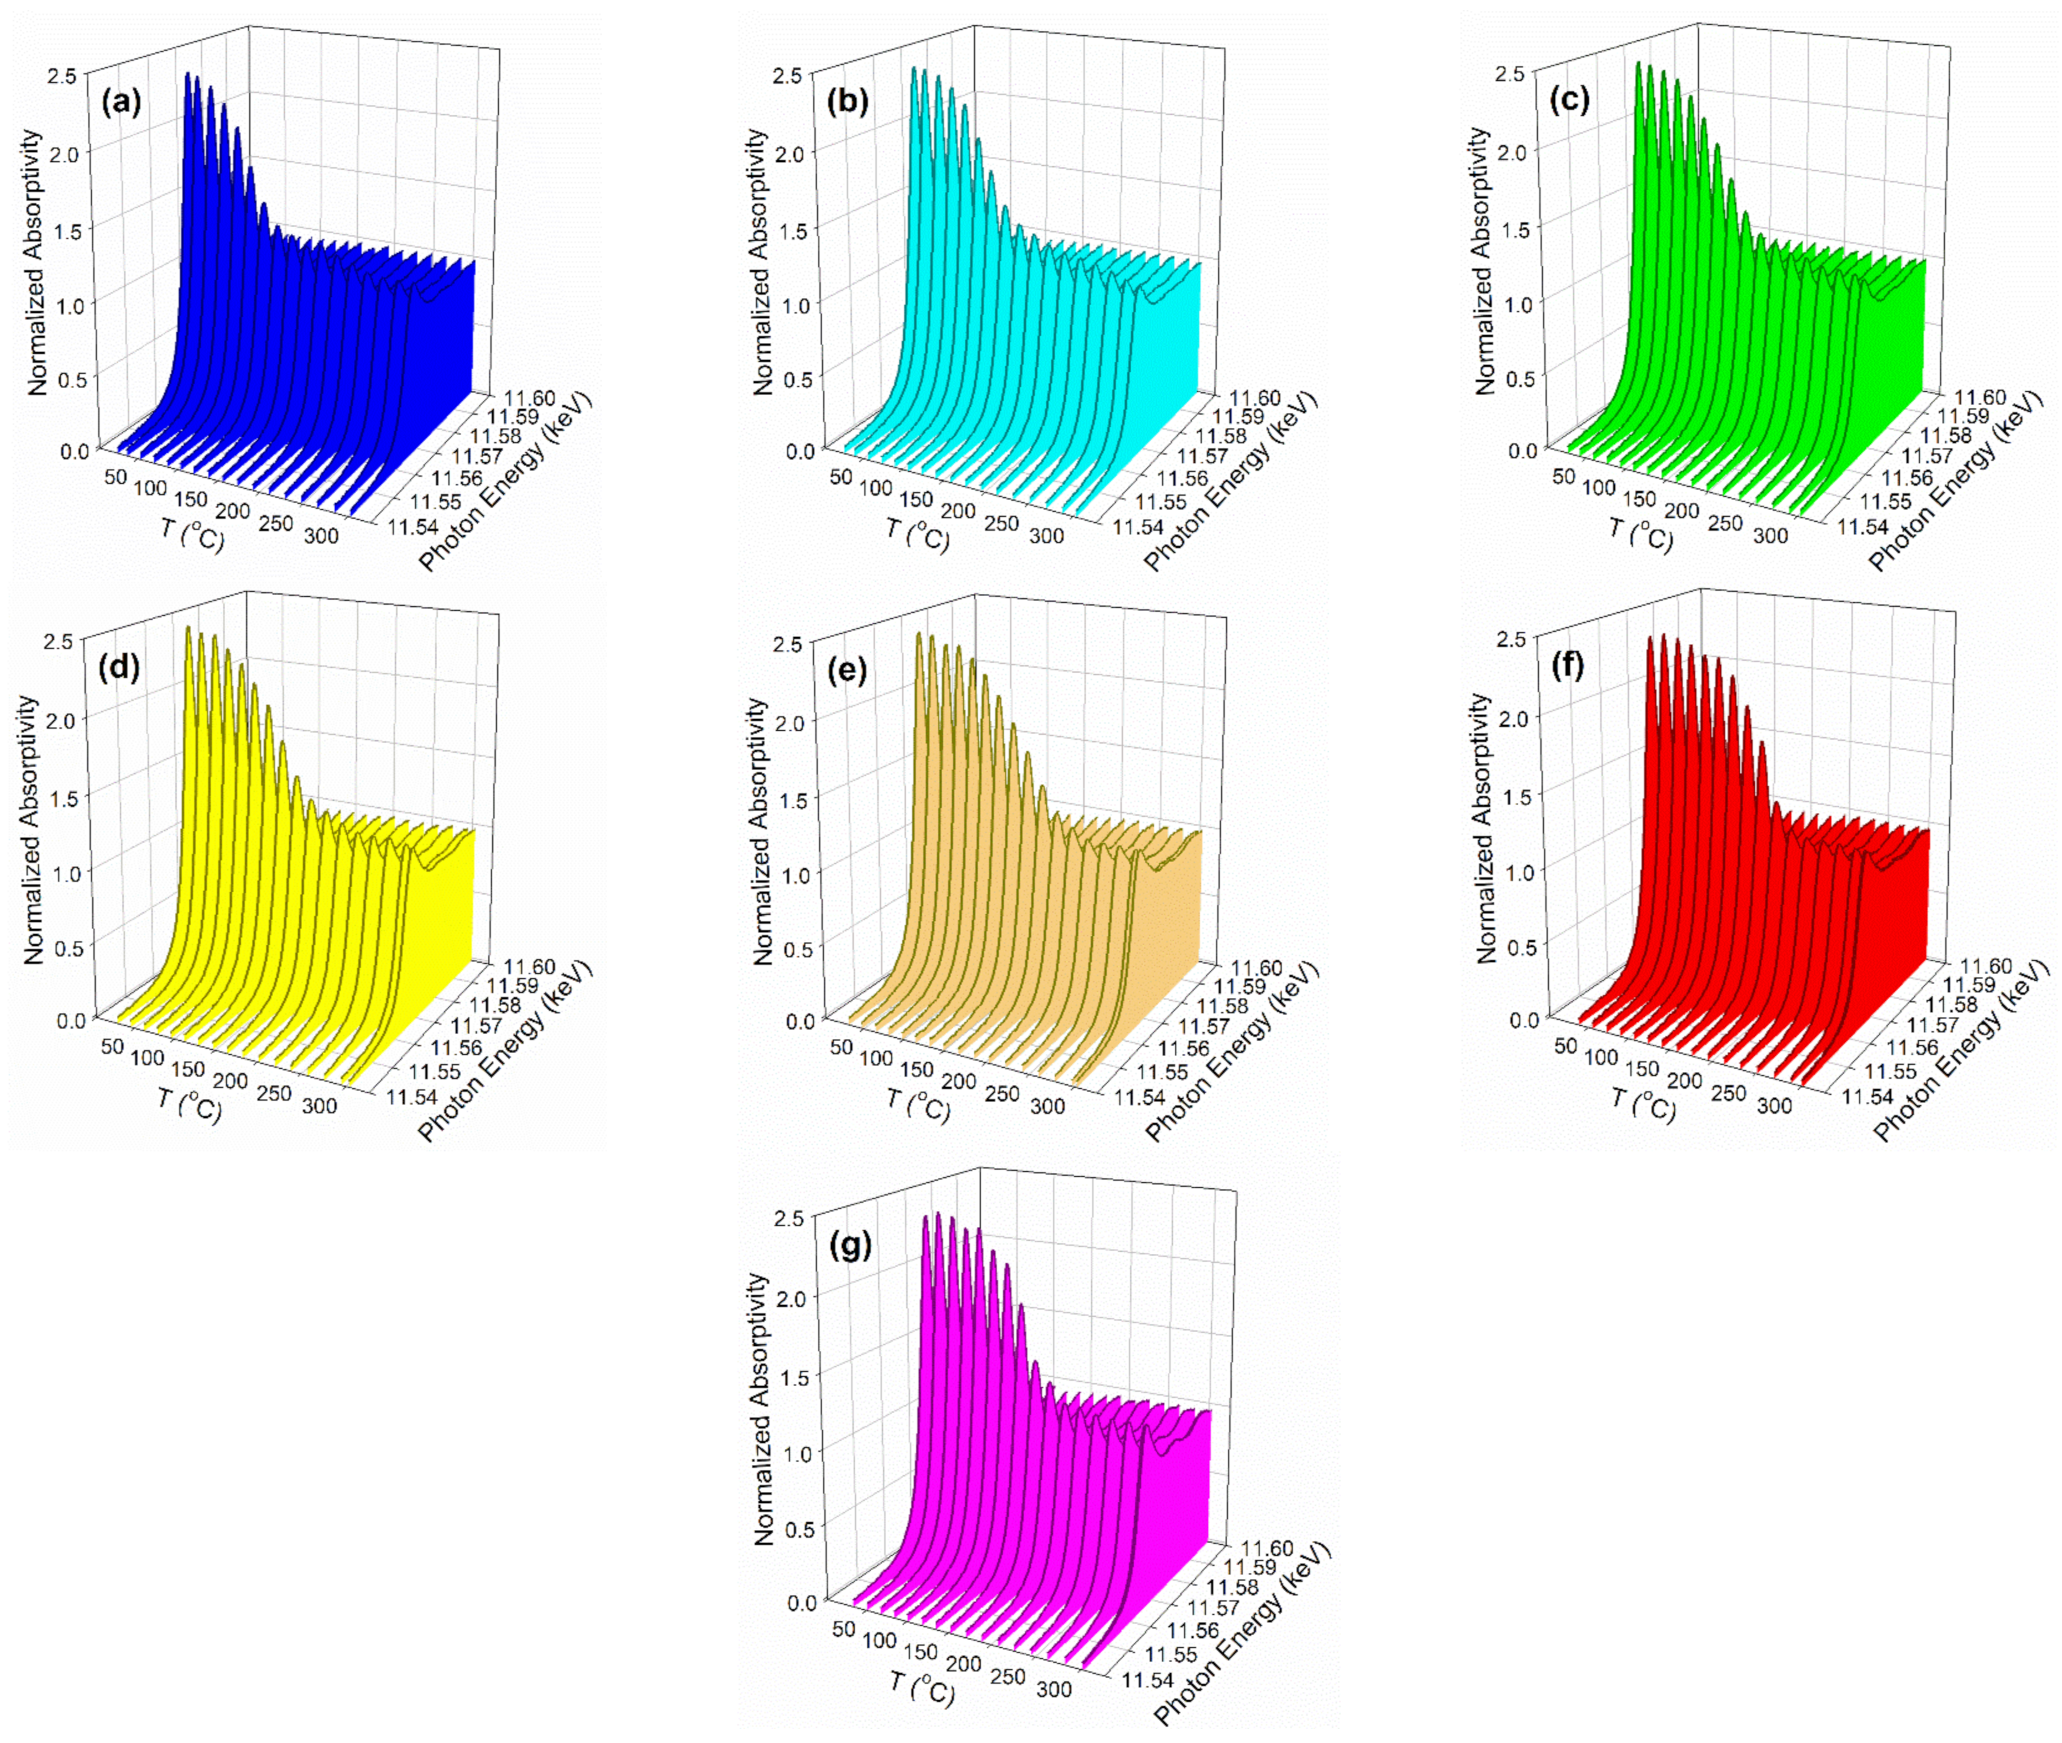
Figure 10.
TPR-EXAFS spectra at the Pt L-3 edge of (a) 2%Pt/ZrO2, (b) 0.93%Rb-2%Pt/ZrO2, (c) 1.86%Rb-2%Pt/ZrO2, (d) 2.79%Rb-2%Pt/ZrO2, (e) 4.65%Rb-2%Pt/ZrO2, (f) 5.58%Rb-2%Pt/ZrO2, and (g) 9.29%Rb-2%Pt/ZrO2.
Figure 10.
TPR-EXAFS spectra at the Pt L-3 edge of (a) 2%Pt/ZrO2, (b) 0.93%Rb-2%Pt/ZrO2, (c) 1.86%Rb-2%Pt/ZrO2, (d) 2.79%Rb-2%Pt/ZrO2, (e) 4.65%Rb-2%Pt/ZrO2, (f) 5.58%Rb-2%Pt/ZrO2, and (g) 9.29%Rb-2%Pt/ZrO2.
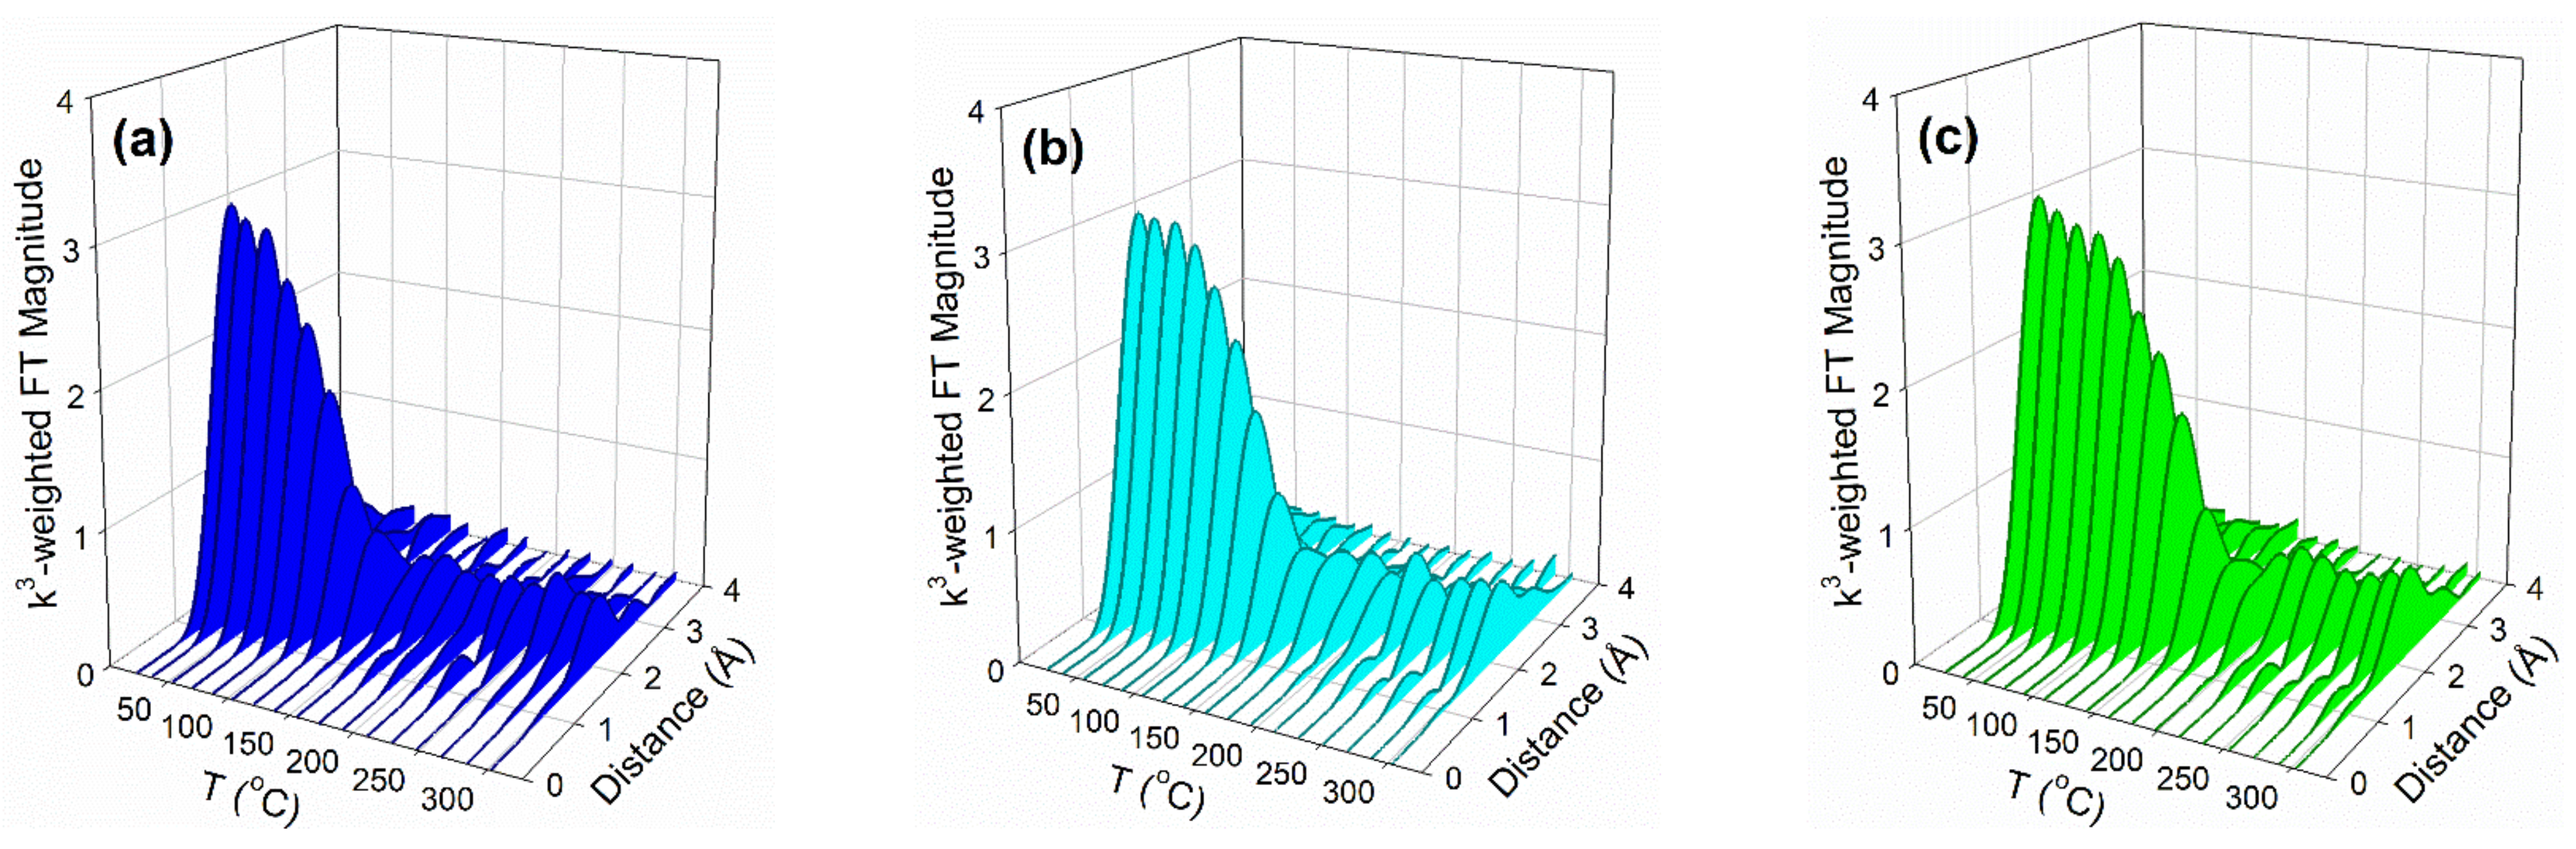
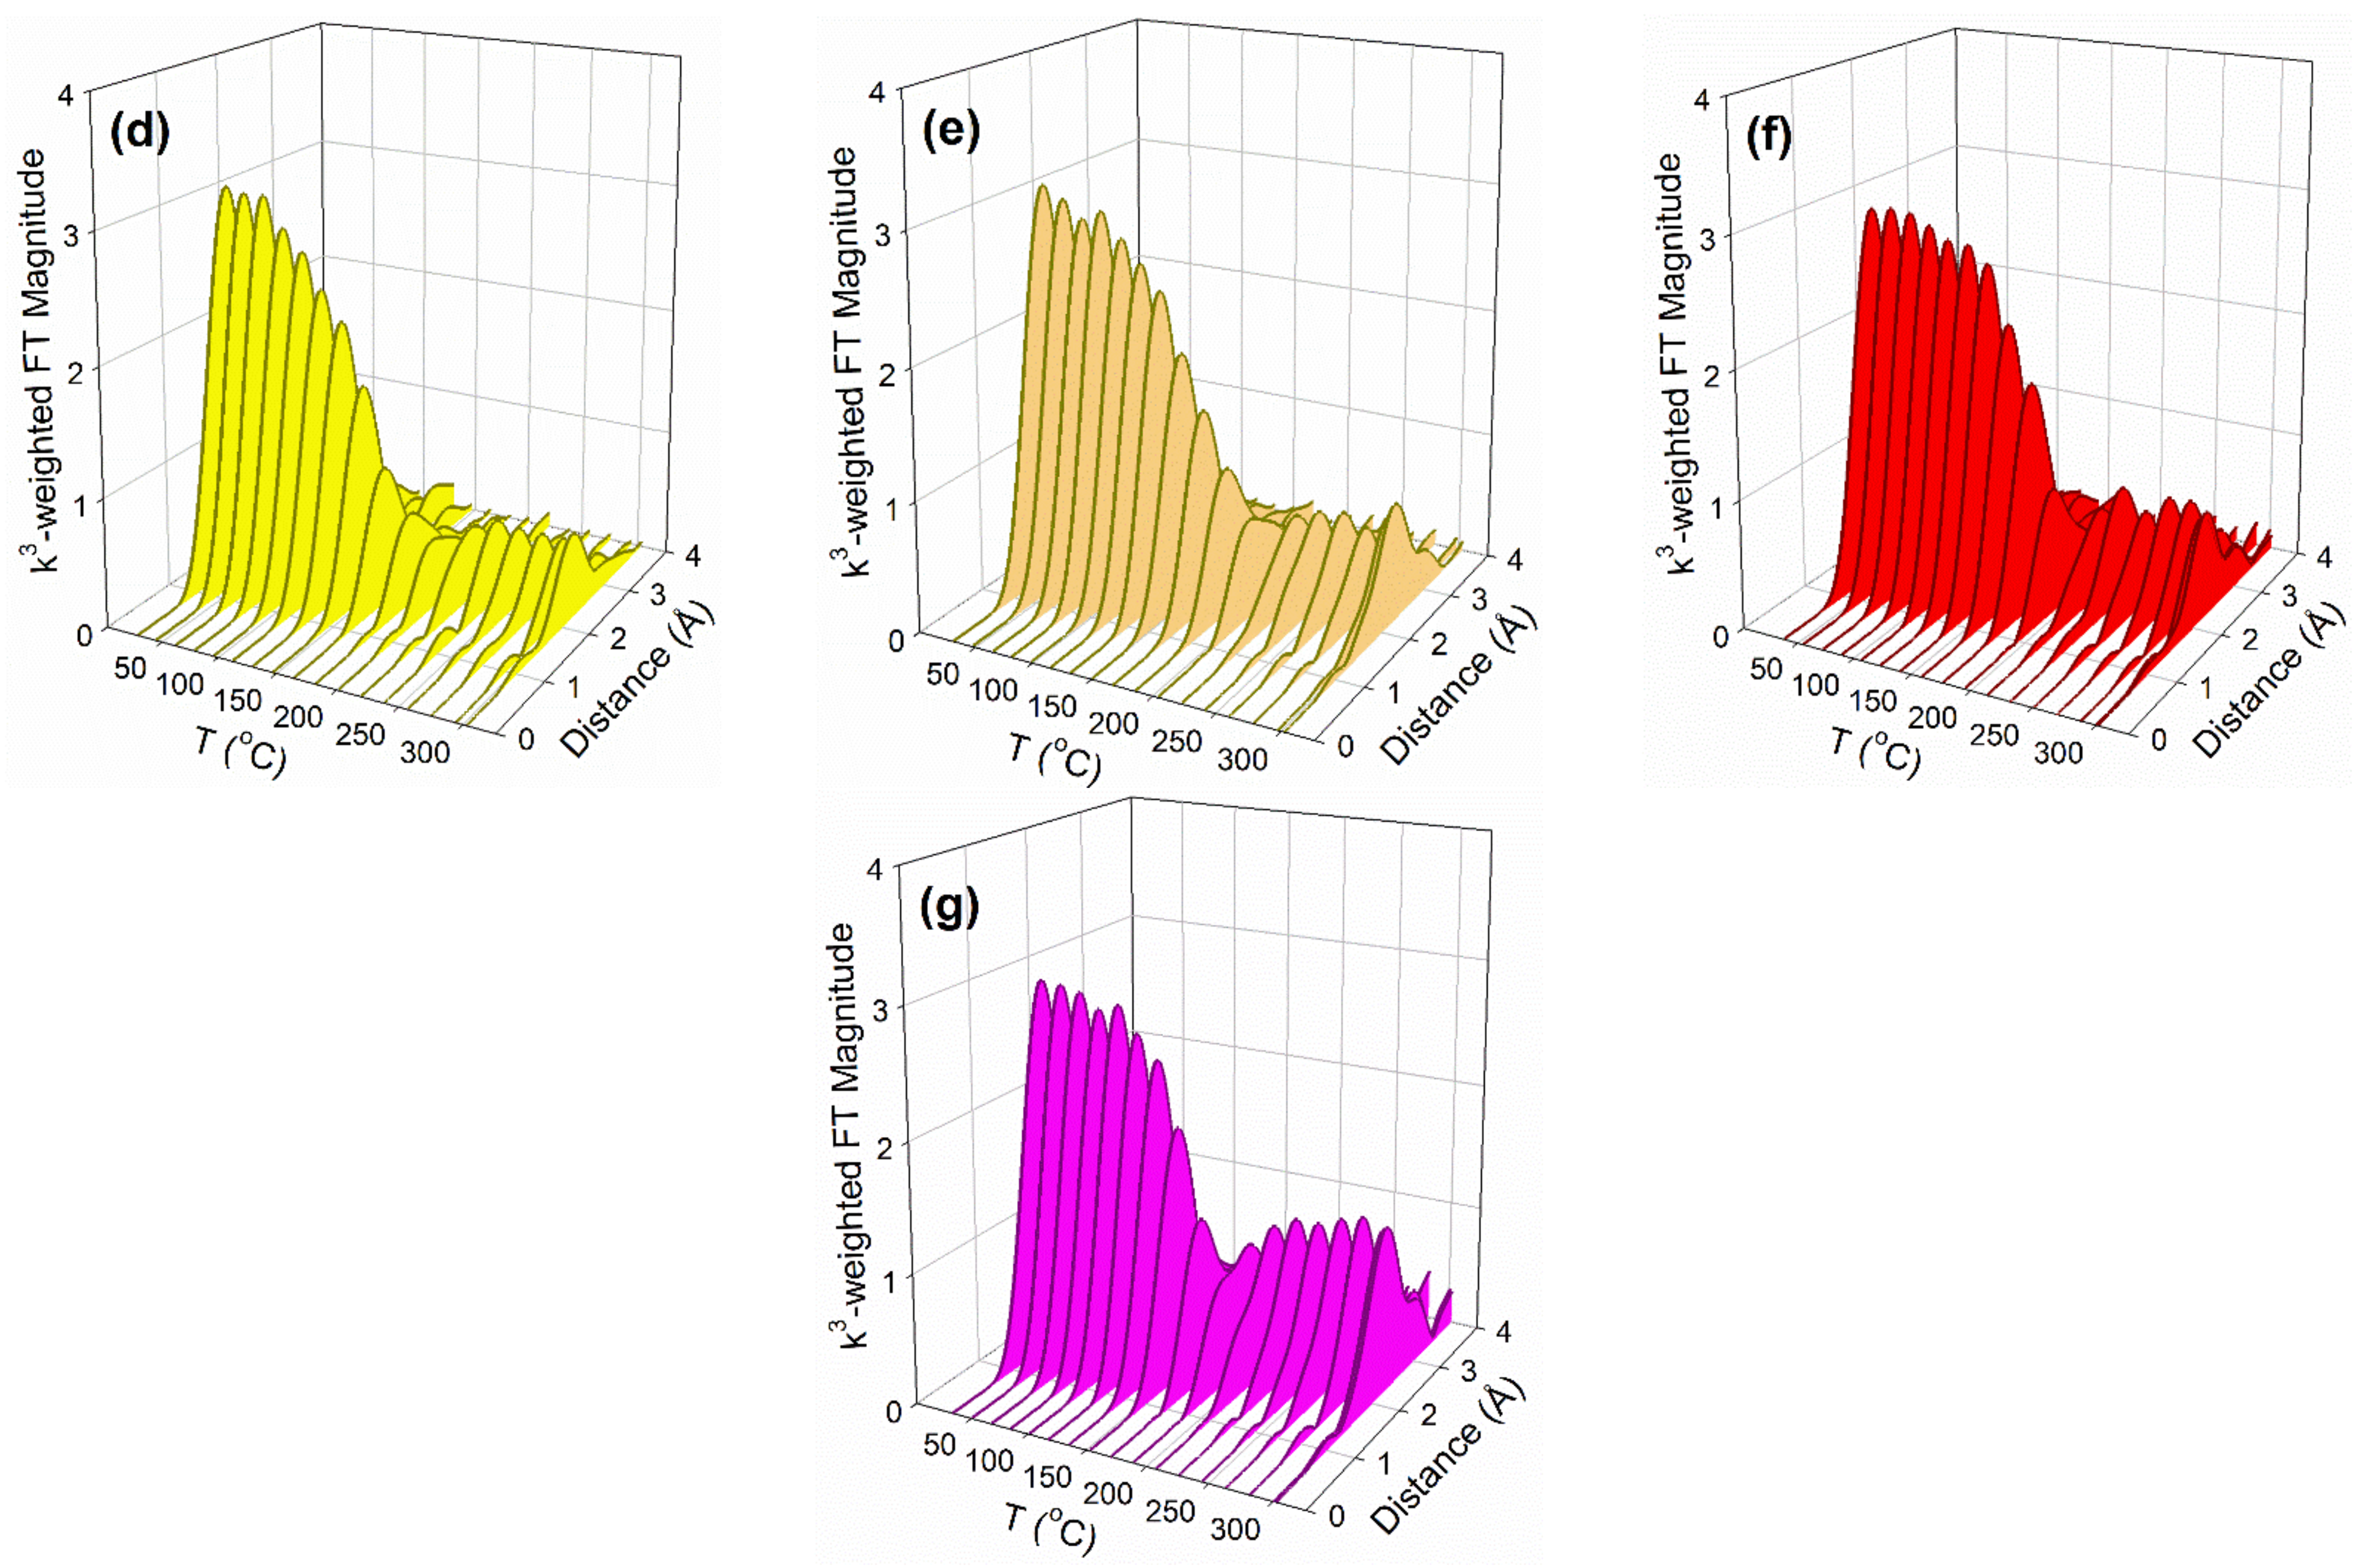
Figure 11.
Transmission electron microscopy (TEM) and scanning transmission microscopy with energy-dispersive X-ray spectroscopy (STEM-EDX) images for the (top) 0.93%Rb-2%Pt/ZrO2 catalyst and (bottom) the 9.29%Rb-2%Pt/ZrO2 catalyst. High loadings of Rb tend to agglomerate the Pt nanoparticles.
Figure 11.
Transmission electron microscopy (TEM) and scanning transmission microscopy with energy-dispersive X-ray spectroscopy (STEM-EDX) images for the (top) 0.93%Rb-2%Pt/ZrO2 catalyst and (bottom) the 9.29%Rb-2%Pt/ZrO2 catalyst. High loadings of Rb tend to agglomerate the Pt nanoparticles.
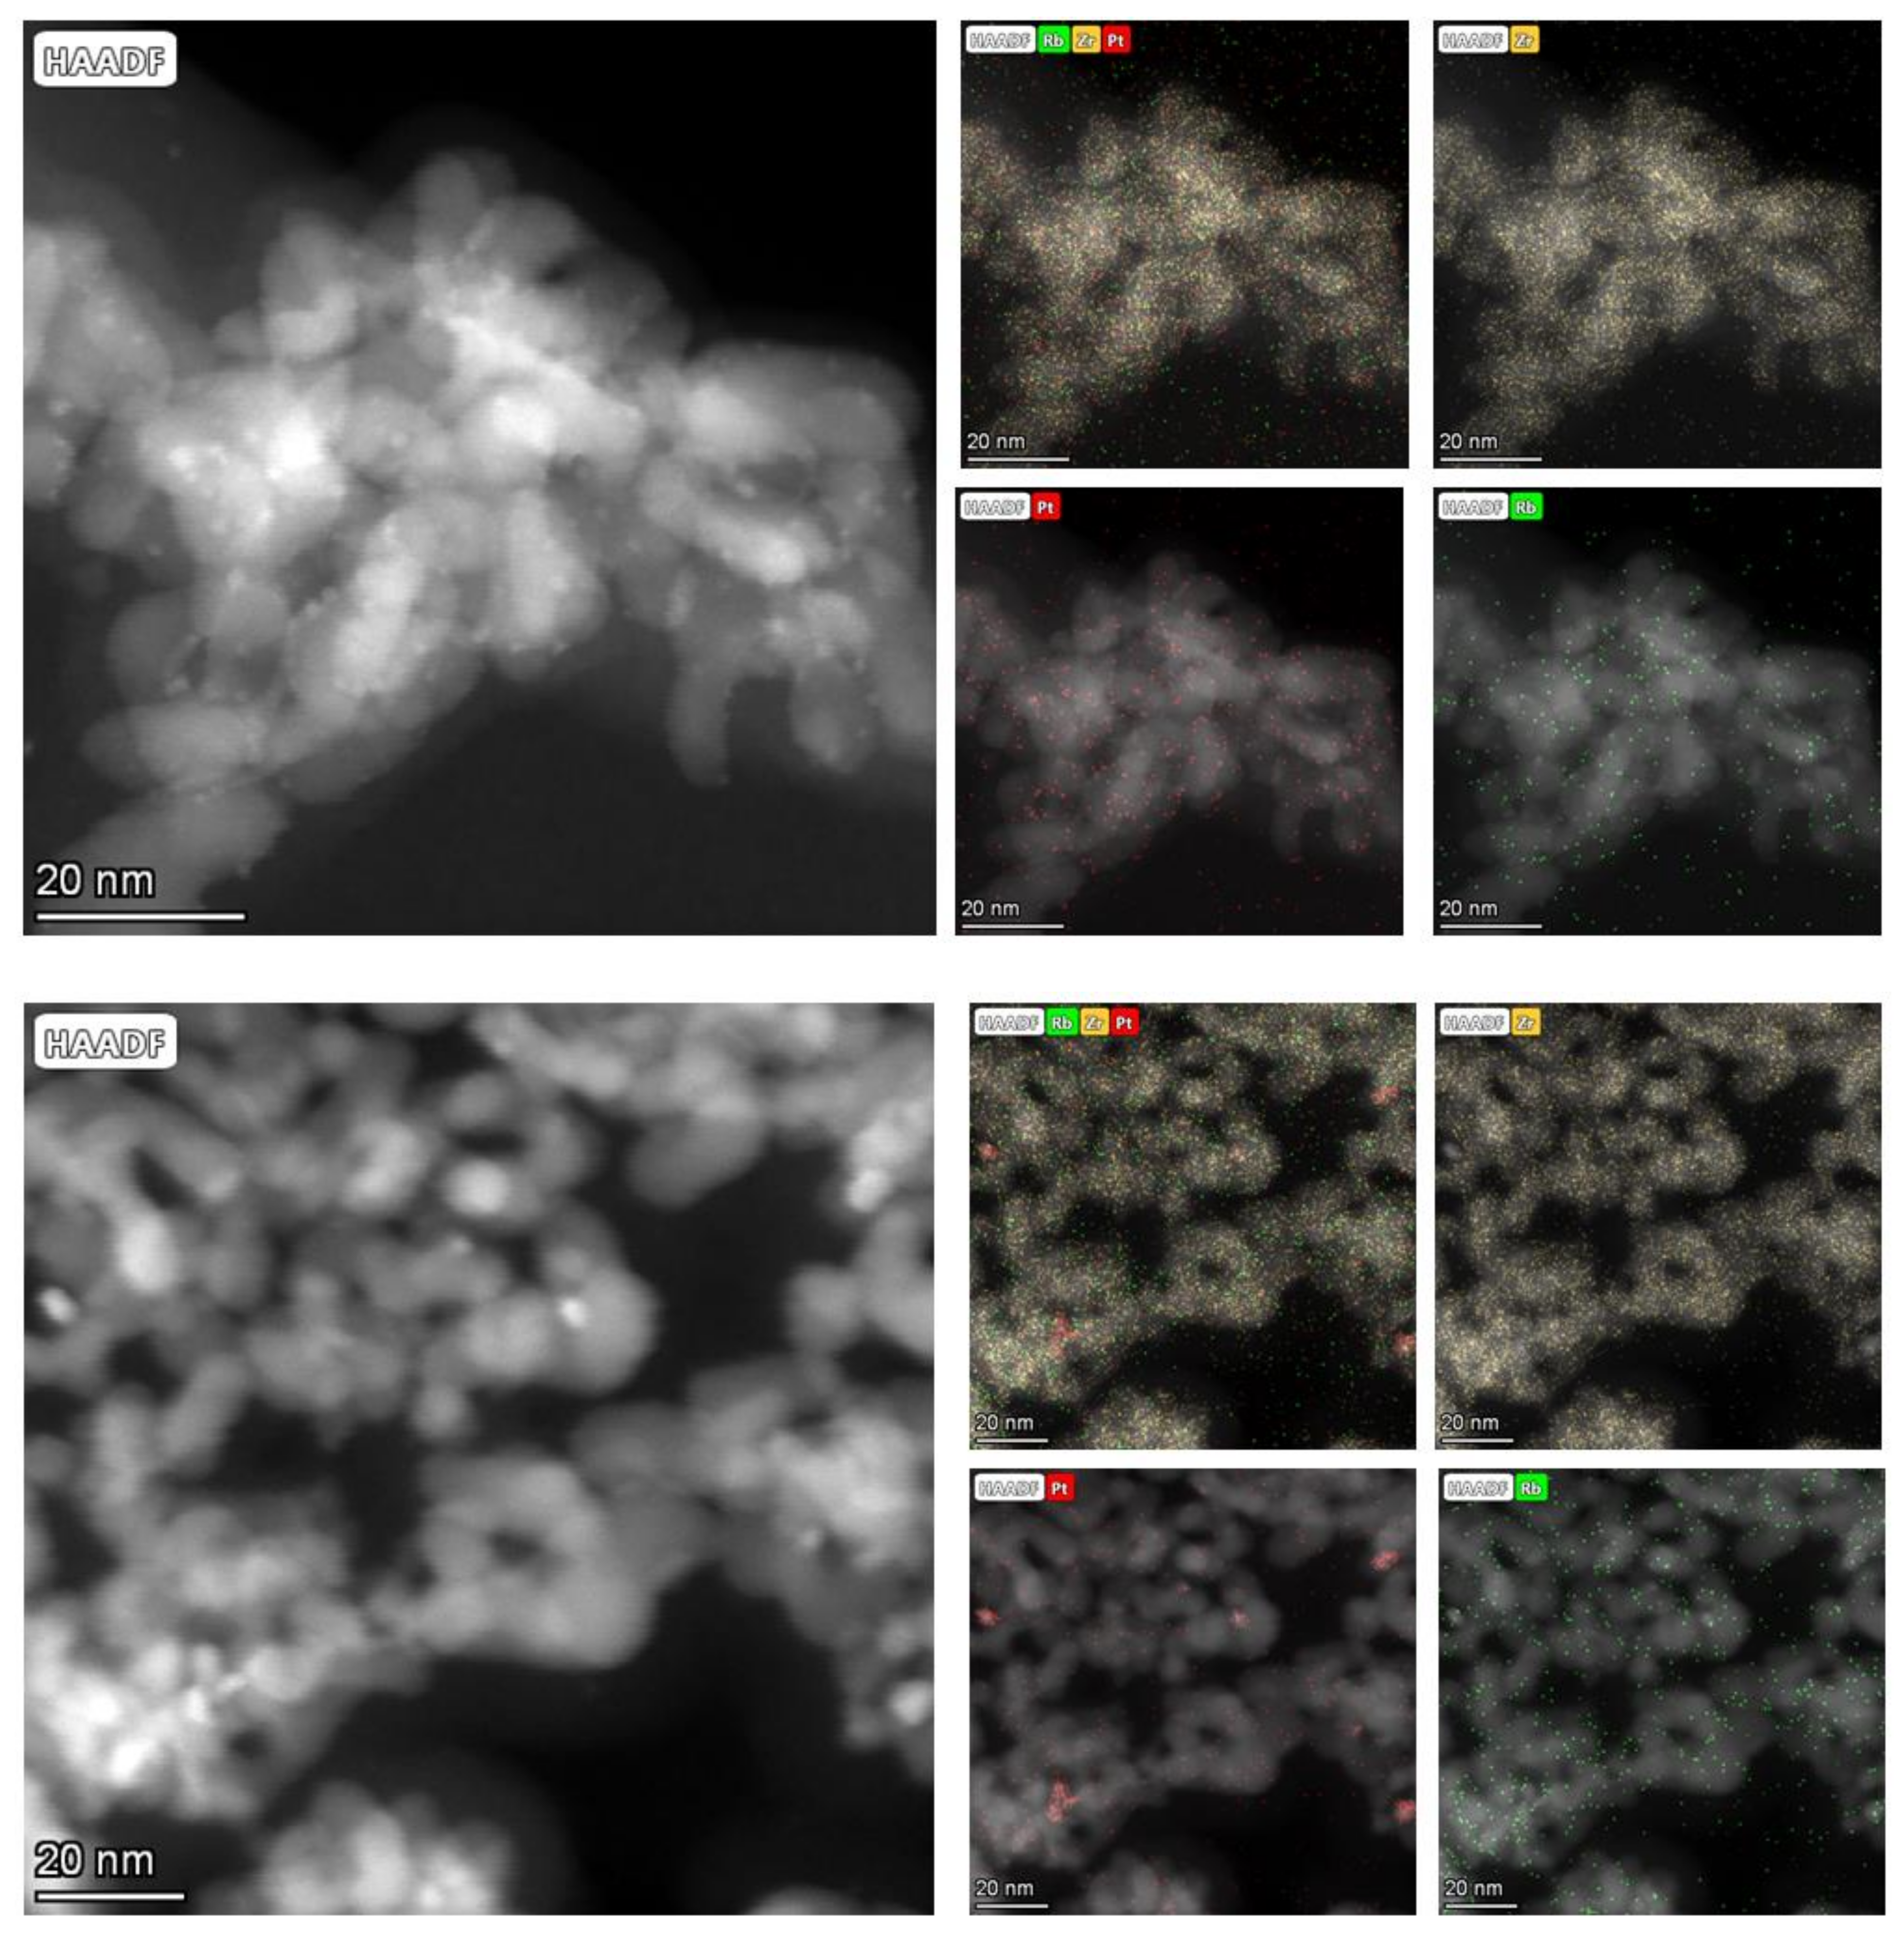
Figure 12.
Absorbance of the formate ν(CH) band region normalized to height of band on 2%Pt/ZrO2, including (a and dashed line spectra) 2%Pt/ZrO2, and the same catalyst doped with (b) 0.55%Rb, (c) 0.93%Rb, (d) 1.86%Rb, (e) 2.79%Rb, (f) 3.72%Rb, (g) 4.65%Rb, (h) 5.58%Rb, and (i) 9.29%Rb.
Figure 12.
Absorbance of the formate ν(CH) band region normalized to height of band on 2%Pt/ZrO2, including (a and dashed line spectra) 2%Pt/ZrO2, and the same catalyst doped with (b) 0.55%Rb, (c) 0.93%Rb, (d) 1.86%Rb, (e) 2.79%Rb, (f) 3.72%Rb, (g) 4.65%Rb, (h) 5.58%Rb, and (i) 9.29%Rb.
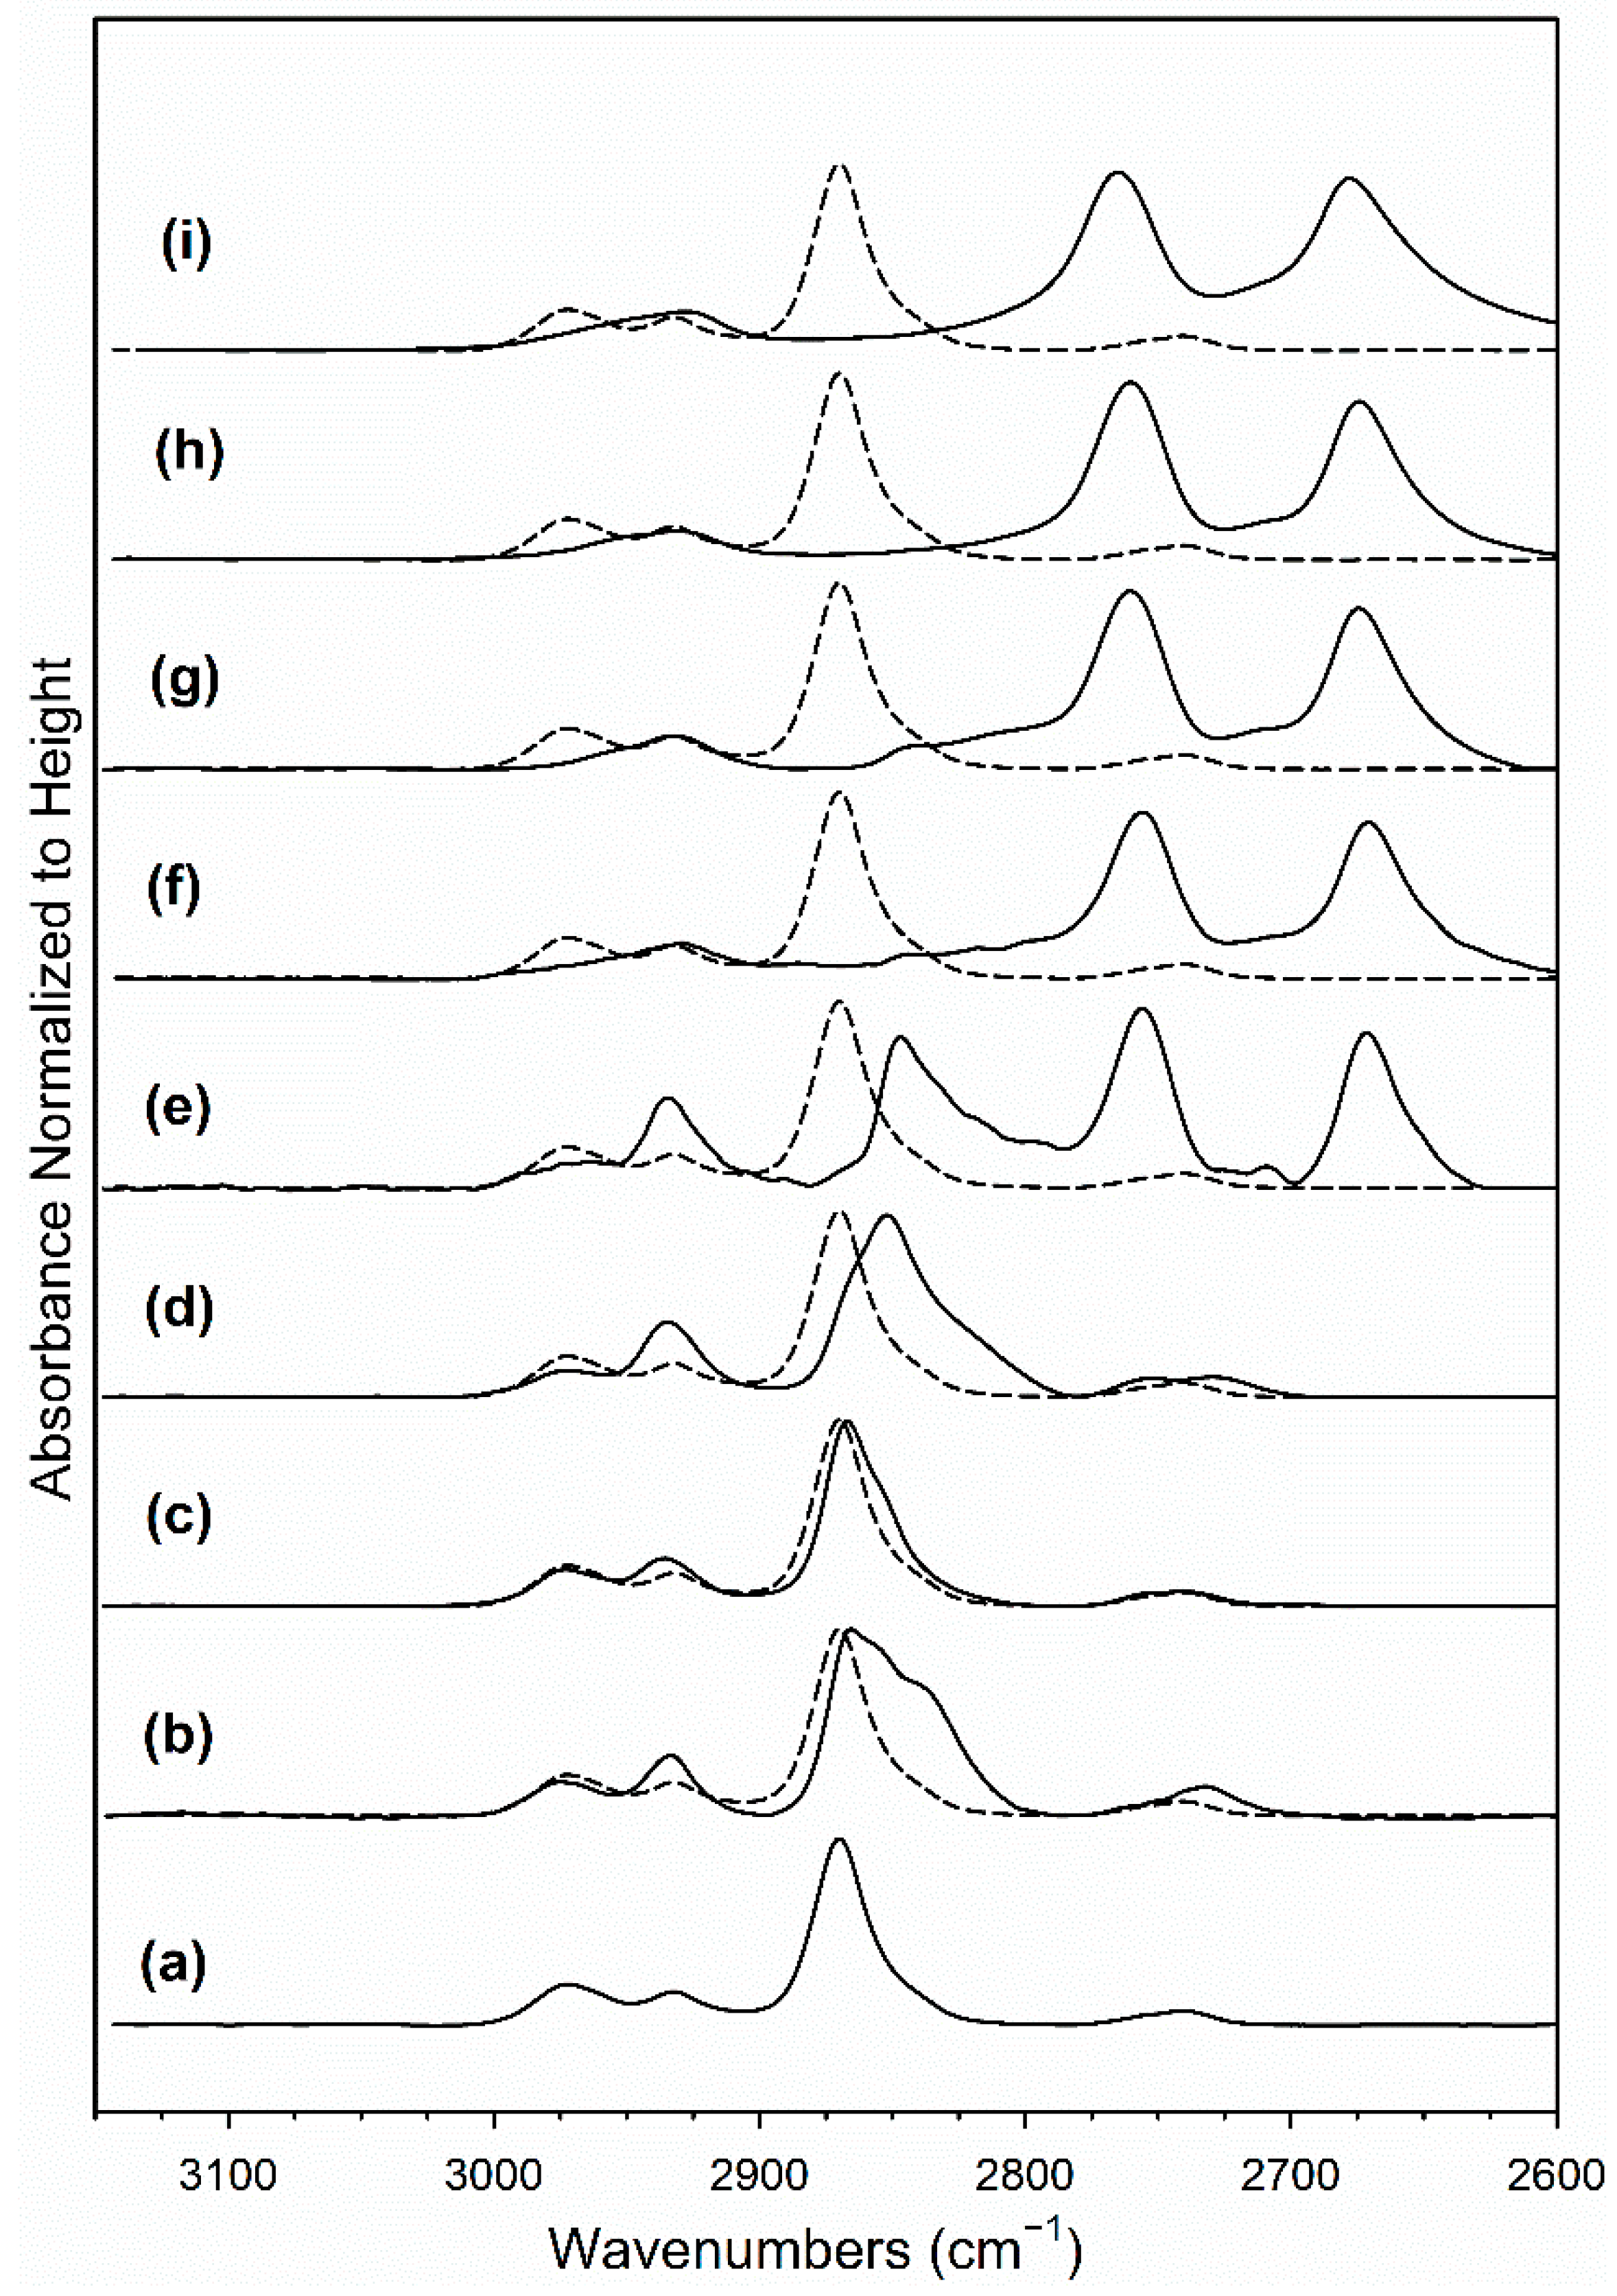
Figure 13.
Formate decomposition in steam at 130 °C, where the top 6 catalysts have a maximum y-scale of 0.15, while the bottom 3 catalysts have a maximum at 0.35, including (gray) 2%Pt/ZrO2, and the same catalyst doped with (periwinkle) 0.55%Rb, (cyan) 0.93%Rb, (green) 1.86%Rb, (pink) 2.79%Rb, (red) 3.72%Rb, (dark red) 4.65%Rb, (orange) 5.58%Rb, and (yellow) 9.29%Rb.
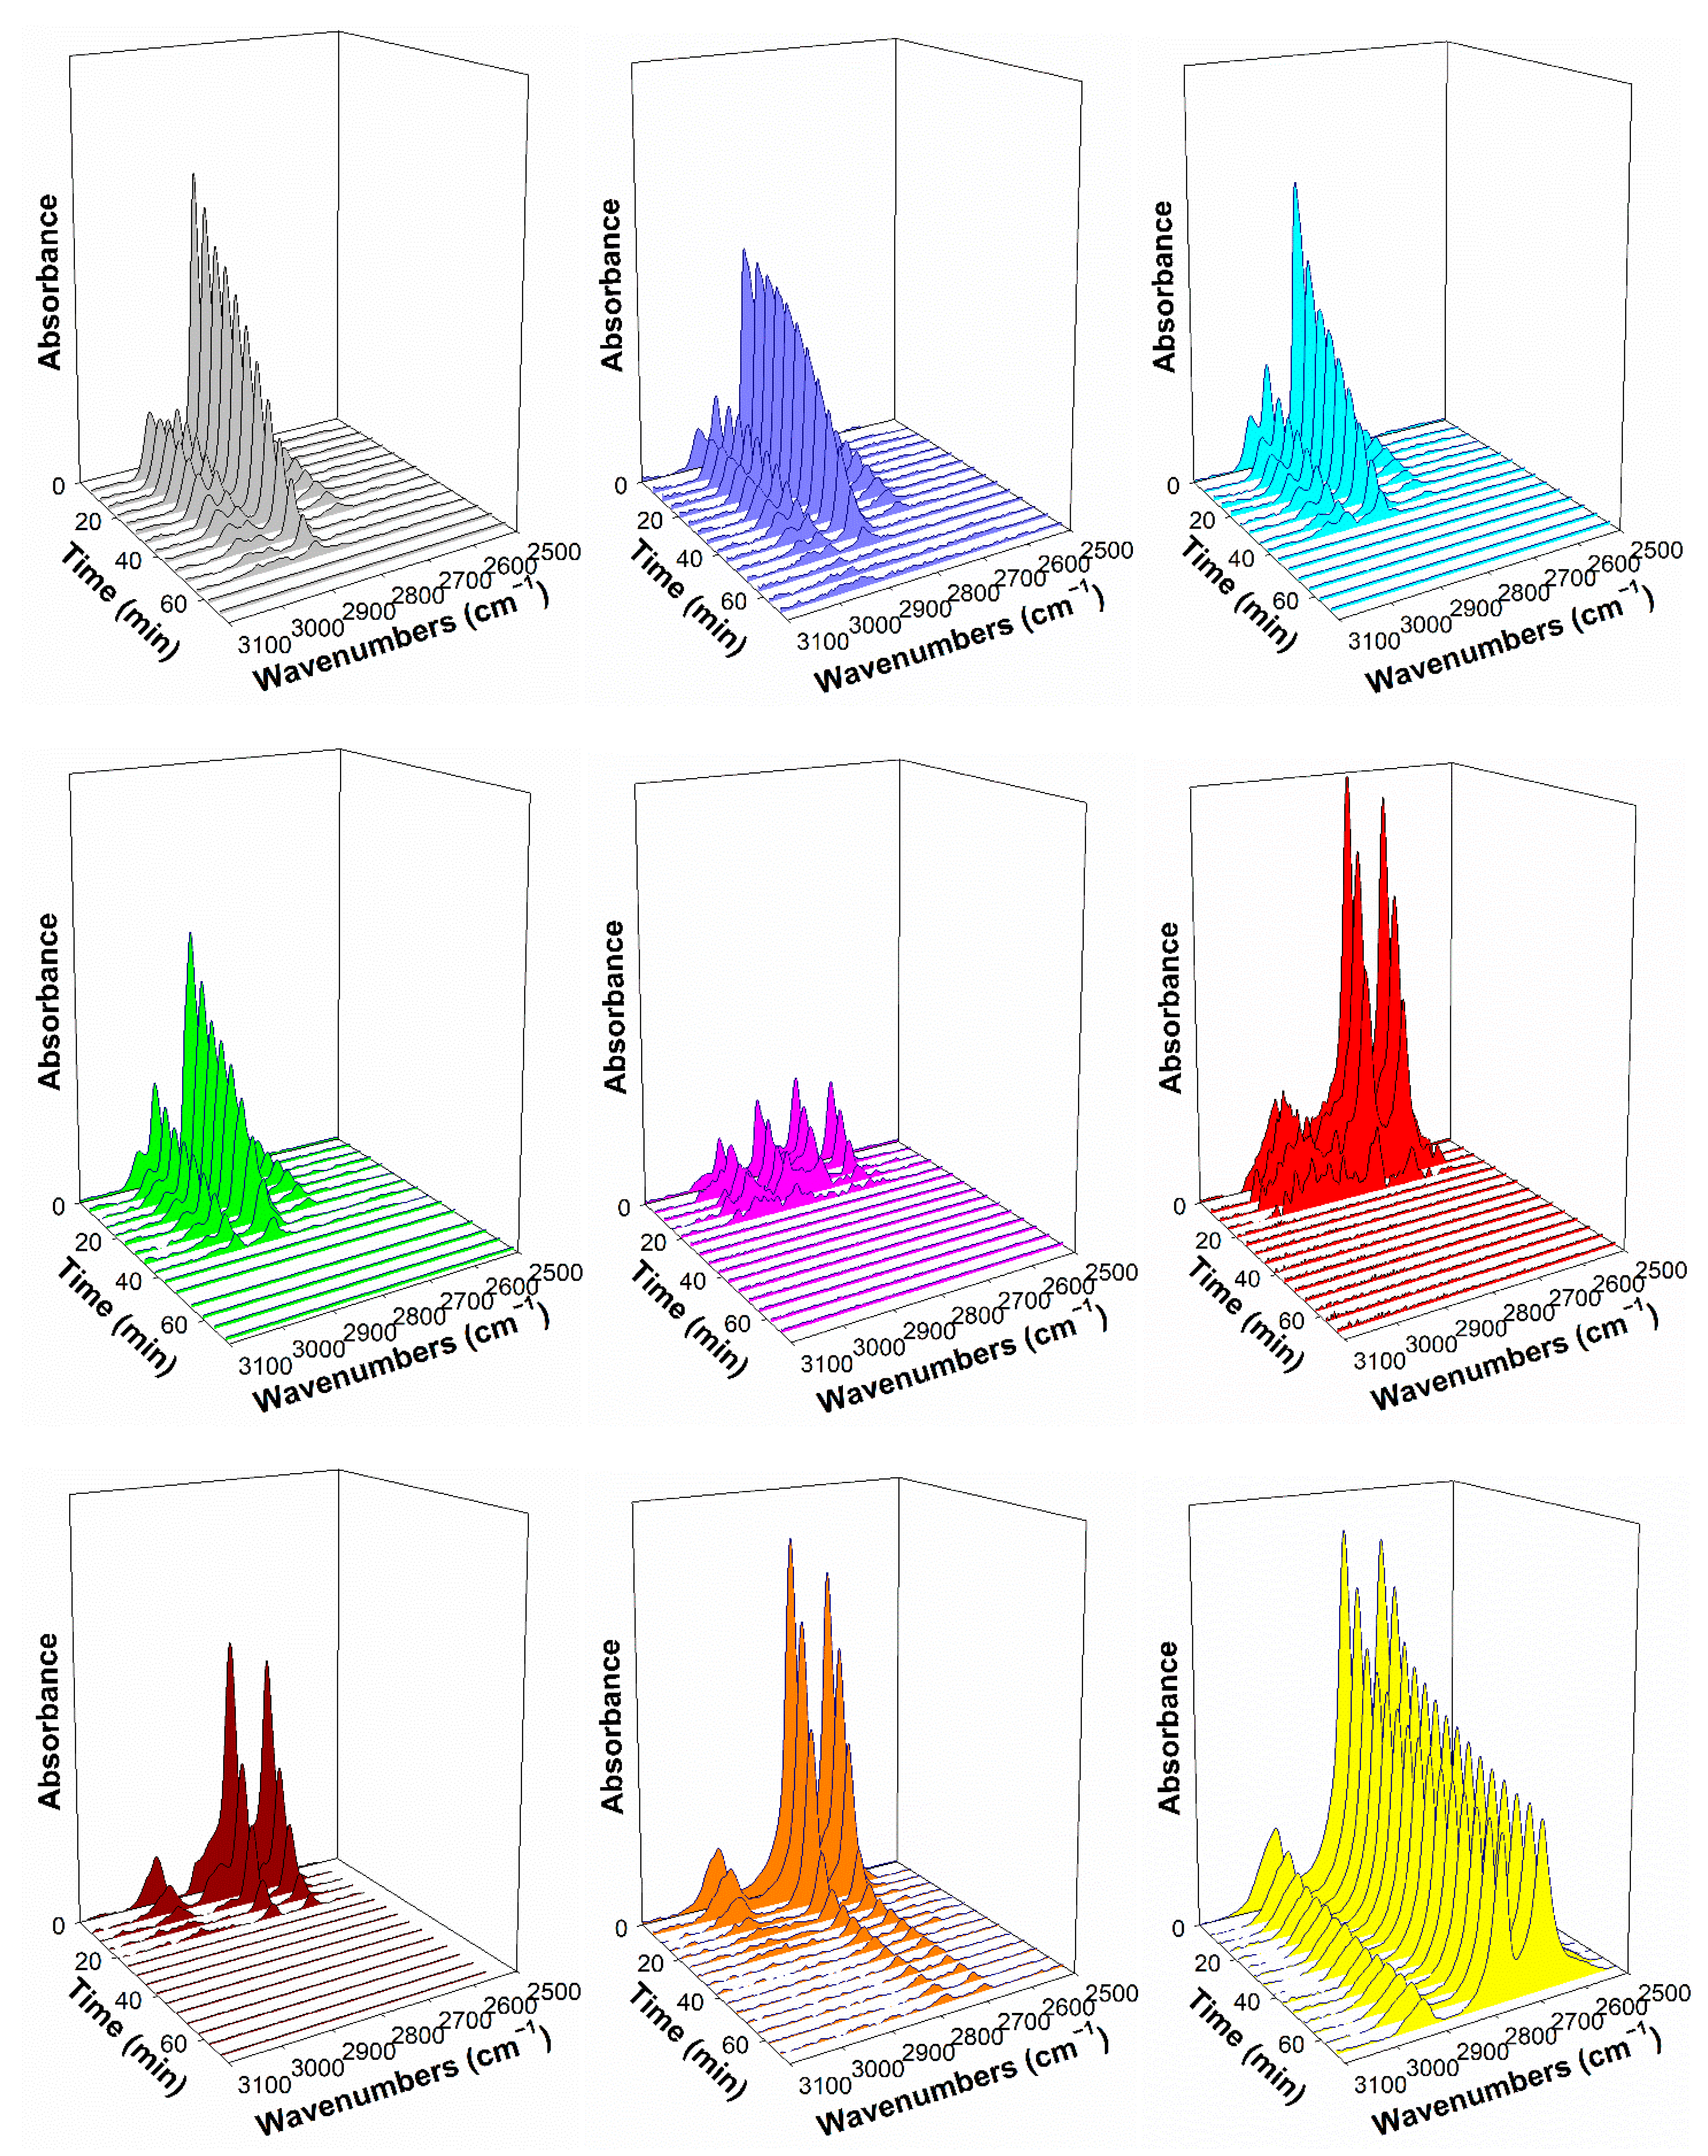
Figure 14.
Absorbance of the ν(CO) on Pt surface band region (to scale), including (a and dashed line spectra) 2%Pt/ZrO2, and the same catalyst doped with (b) 0.55%Rb, (c) 0.93%Rb, (d) 1.86%Rb, (e) 2.79%Rb, (f) 3.72%Rb, (g) 4.65%Rb, (h) 5.58%Rb, and (i) 9.29%Rb.
Figure 14.
Absorbance of the ν(CO) on Pt surface band region (to scale), including (a and dashed line spectra) 2%Pt/ZrO2, and the same catalyst doped with (b) 0.55%Rb, (c) 0.93%Rb, (d) 1.86%Rb, (e) 2.79%Rb, (f) 3.72%Rb, (g) 4.65%Rb, (h) 5.58%Rb, and (i) 9.29%Rb.
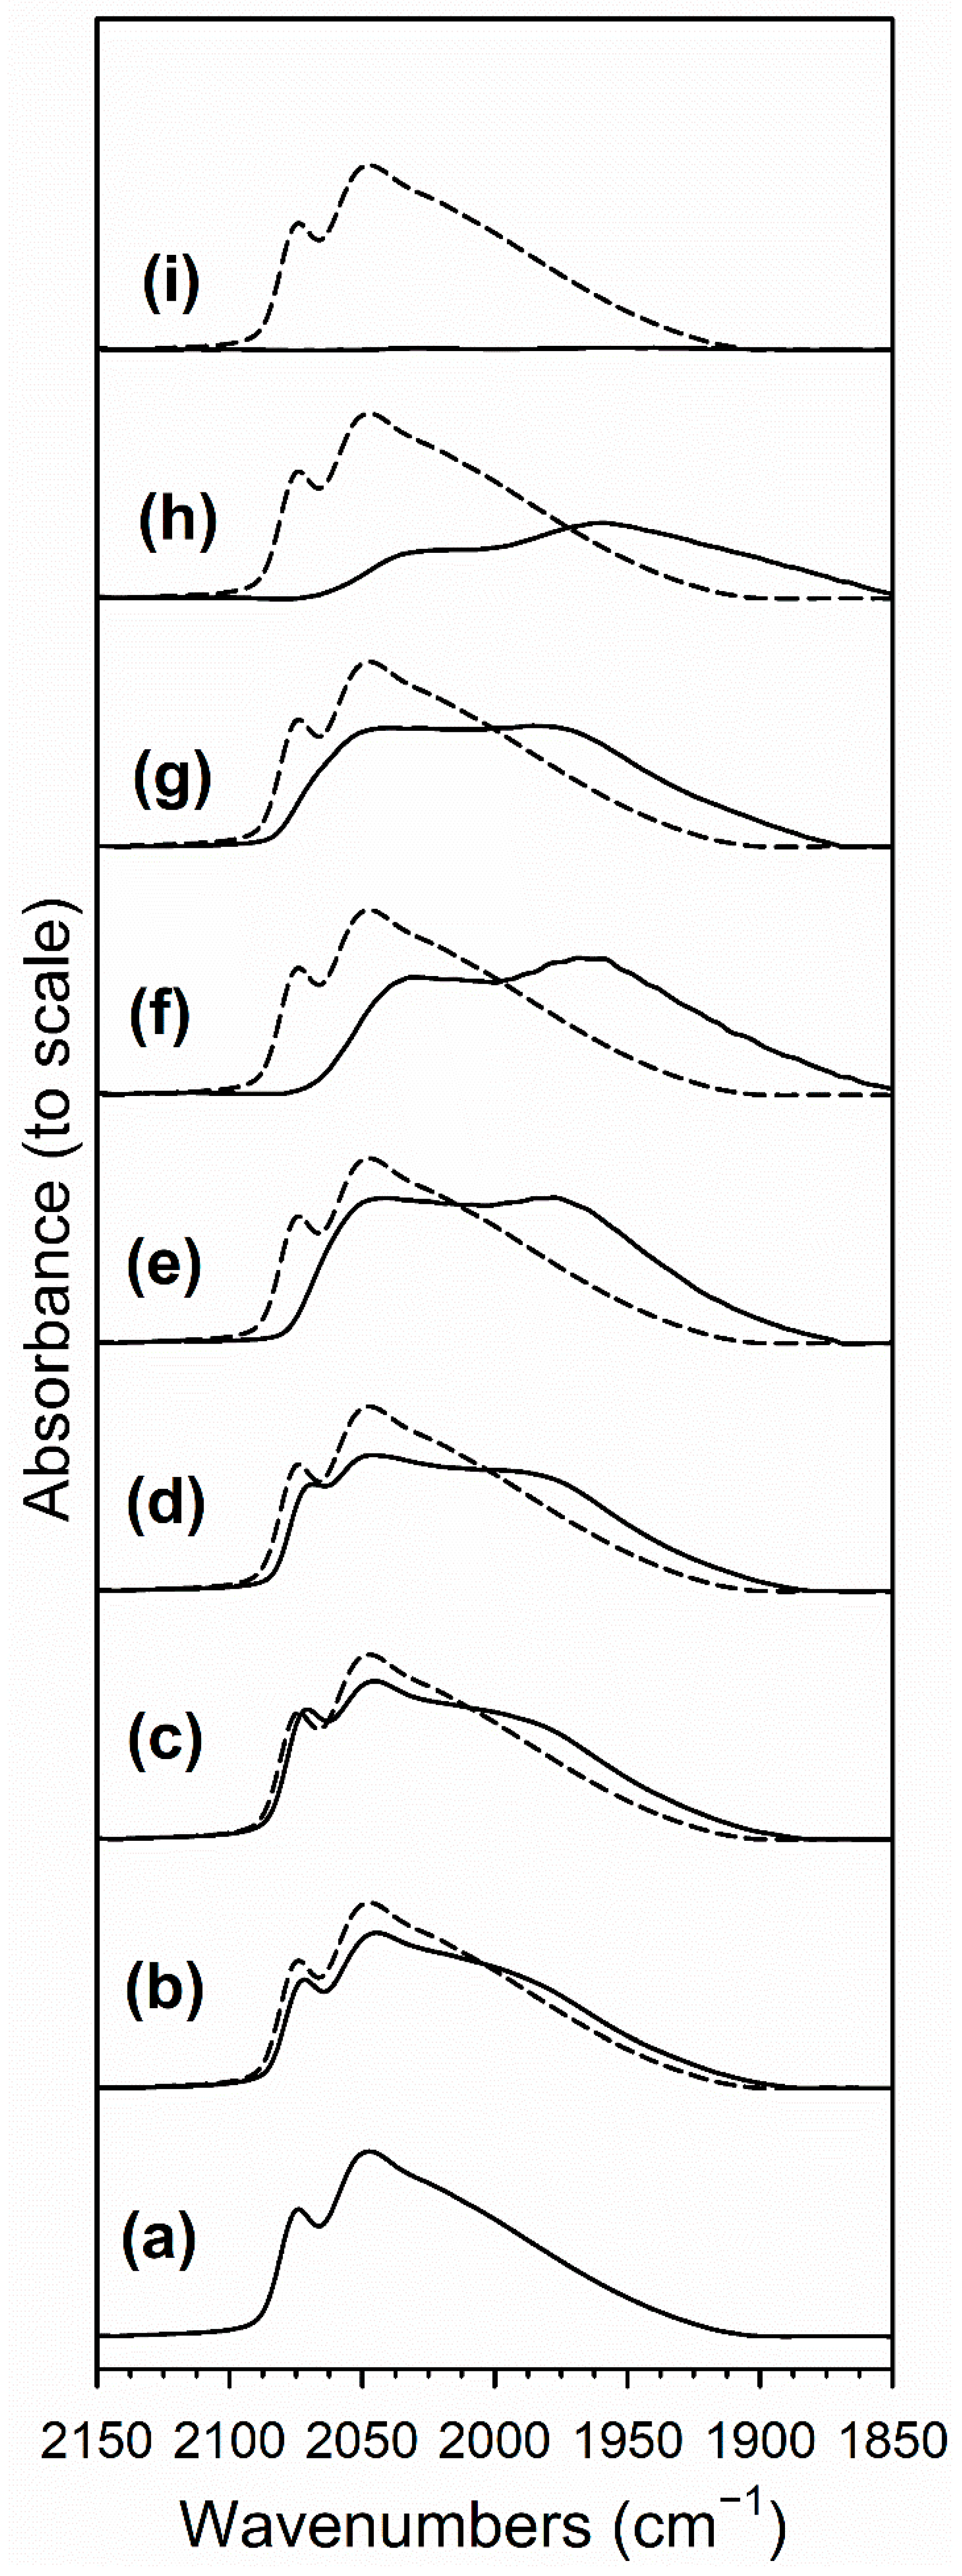
Figure 15.
Response of the Pt-CO band in steam at 130 °C, where the maximum in the y-axis is 0.70, including (gray) 2%Pt/ZrO2, and the same catalyst doped with (periwinkle) 0.55%Rb, (cyan) 0.93%Rb, (green) 1.86%Rb, (pink) 2.79%Rb, (red) 3.72%Rb, (dark red) 4.65%Rb, (orange) 5.58%Rb, and (yellow) 9.29%Rb.
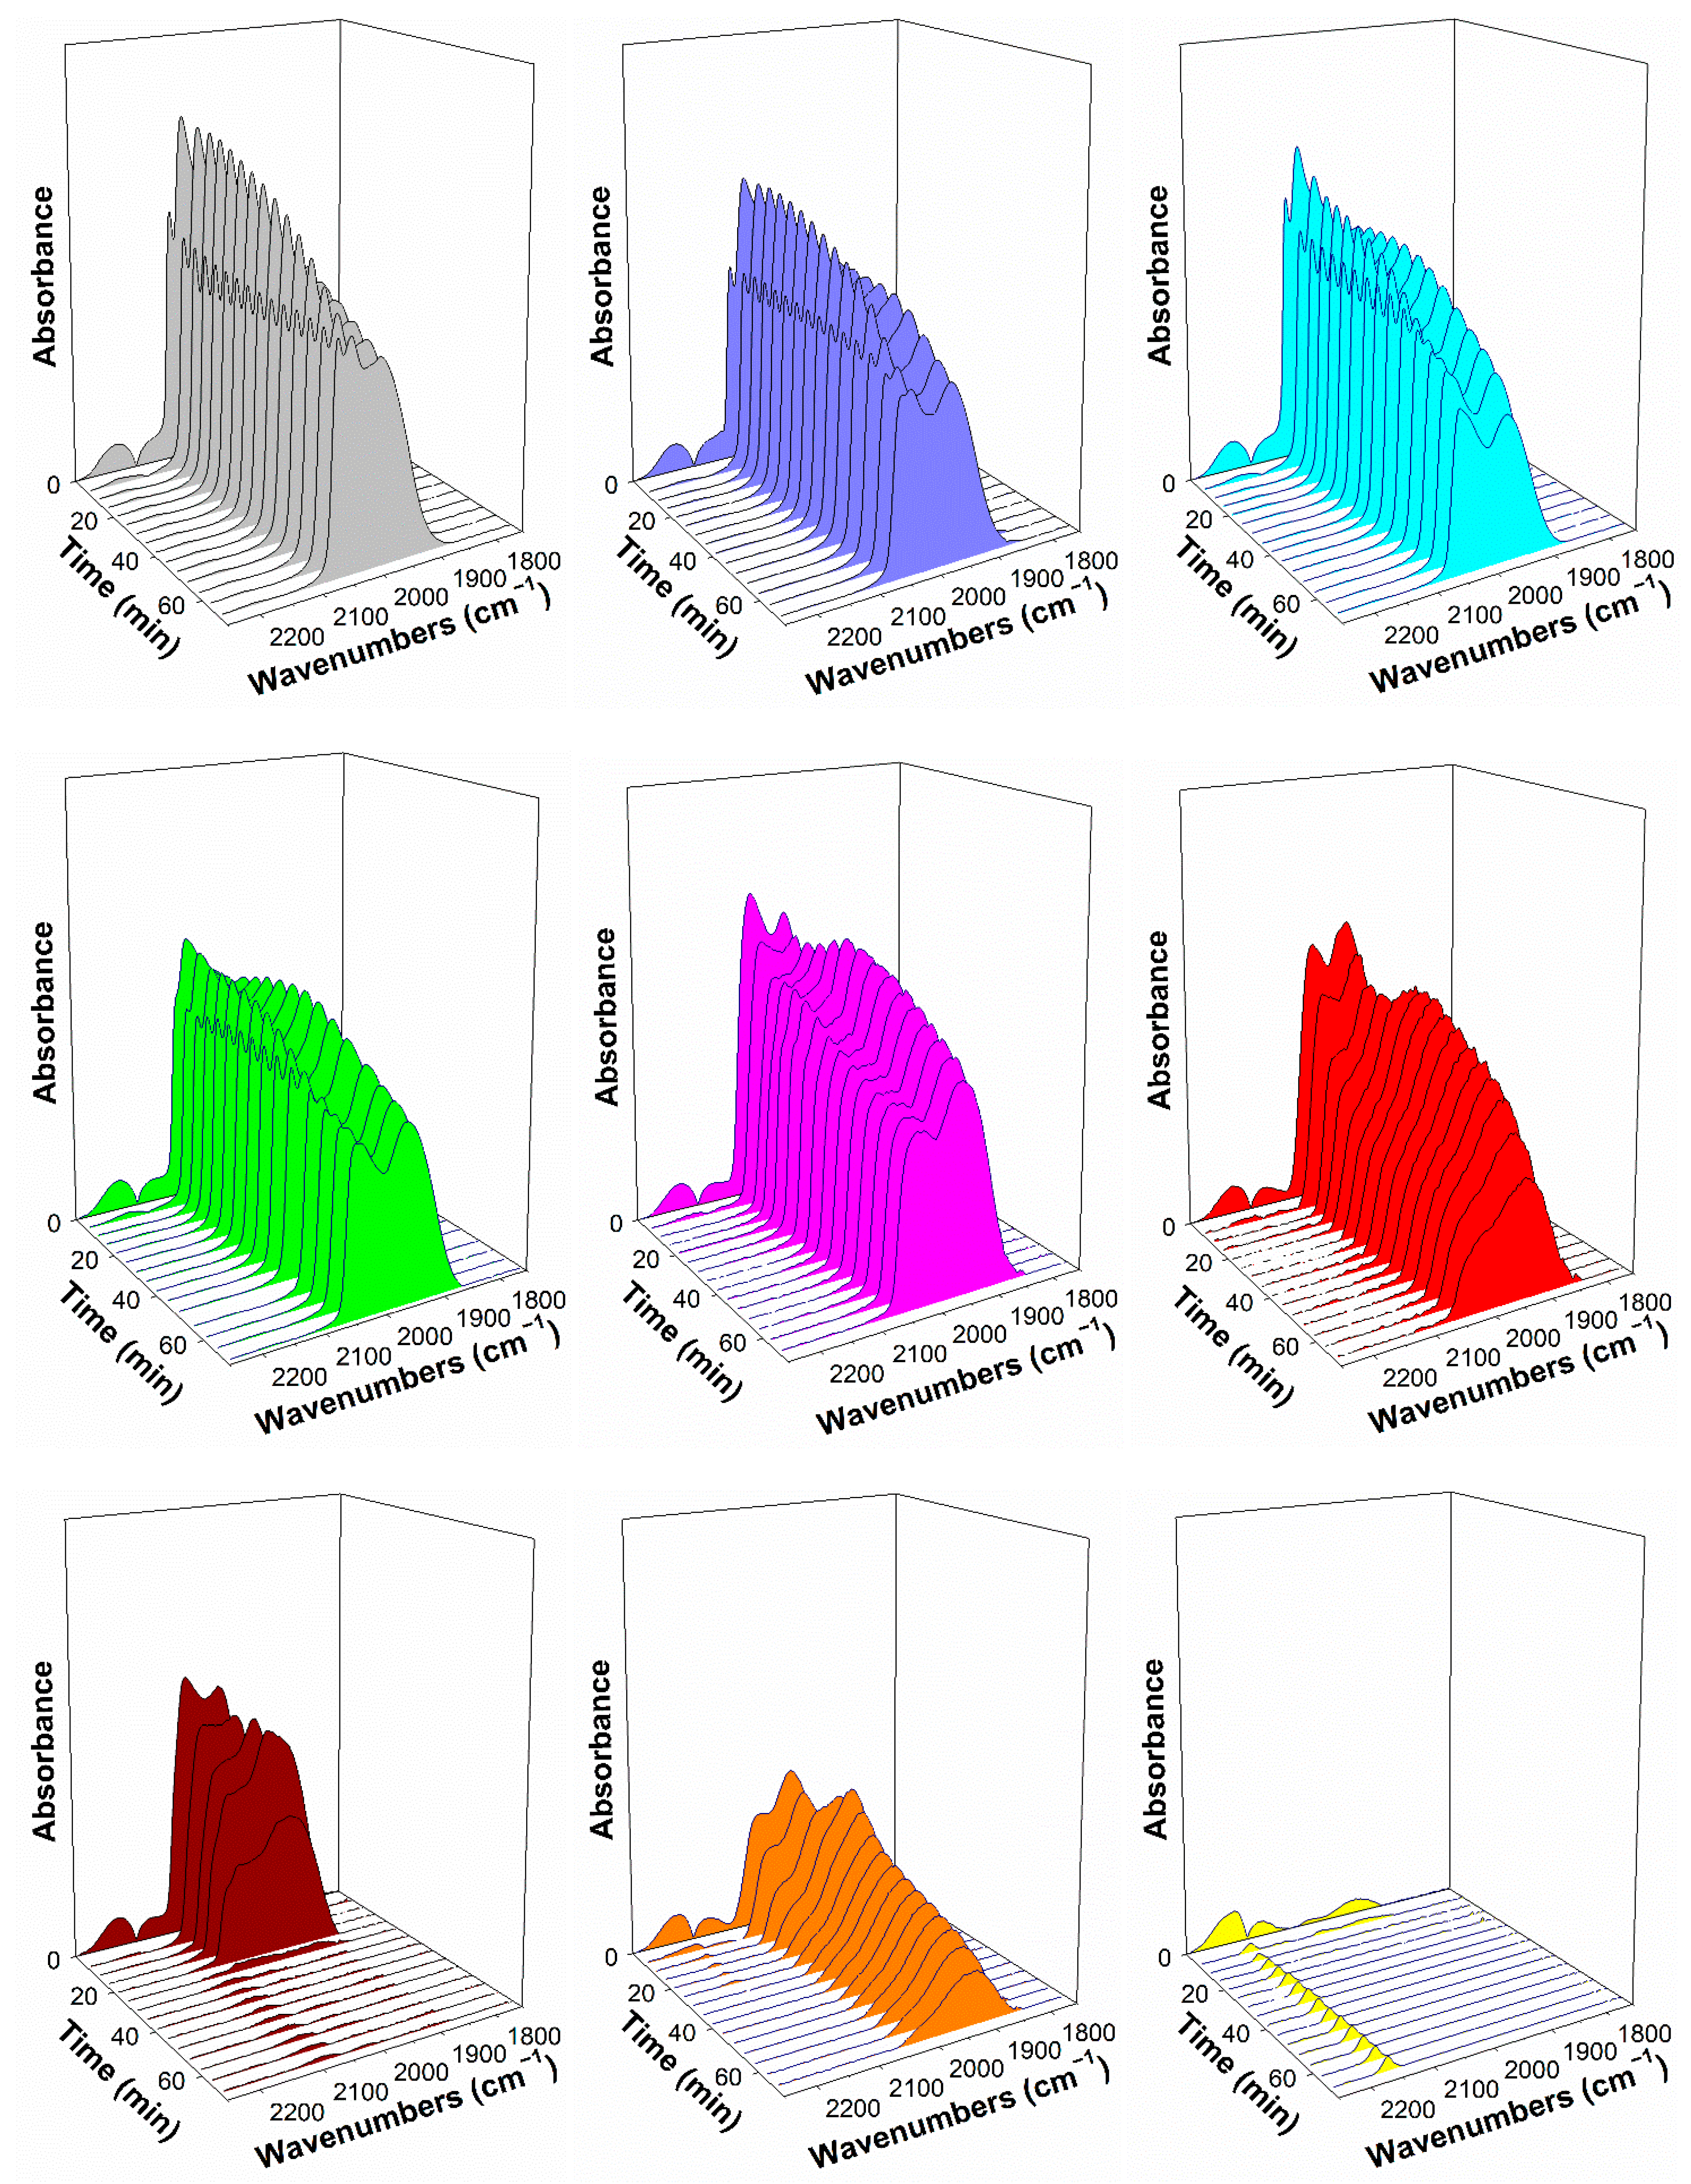
Figure 16.
Rubidium (yellow) distribution near platinum (dark gray) on the catalyst surface (blue) depending on the loading: (top left) no alkali, (top right) low rubidium loading, (bottom left) optimal rubidium loading, and (bottom right) excessive rubidium loading.
Figure 16.
Rubidium (yellow) distribution near platinum (dark gray) on the catalyst surface (blue) depending on the loading: (top left) no alkali, (top right) low rubidium loading, (bottom left) optimal rubidium loading, and (bottom right) excessive rubidium loading.
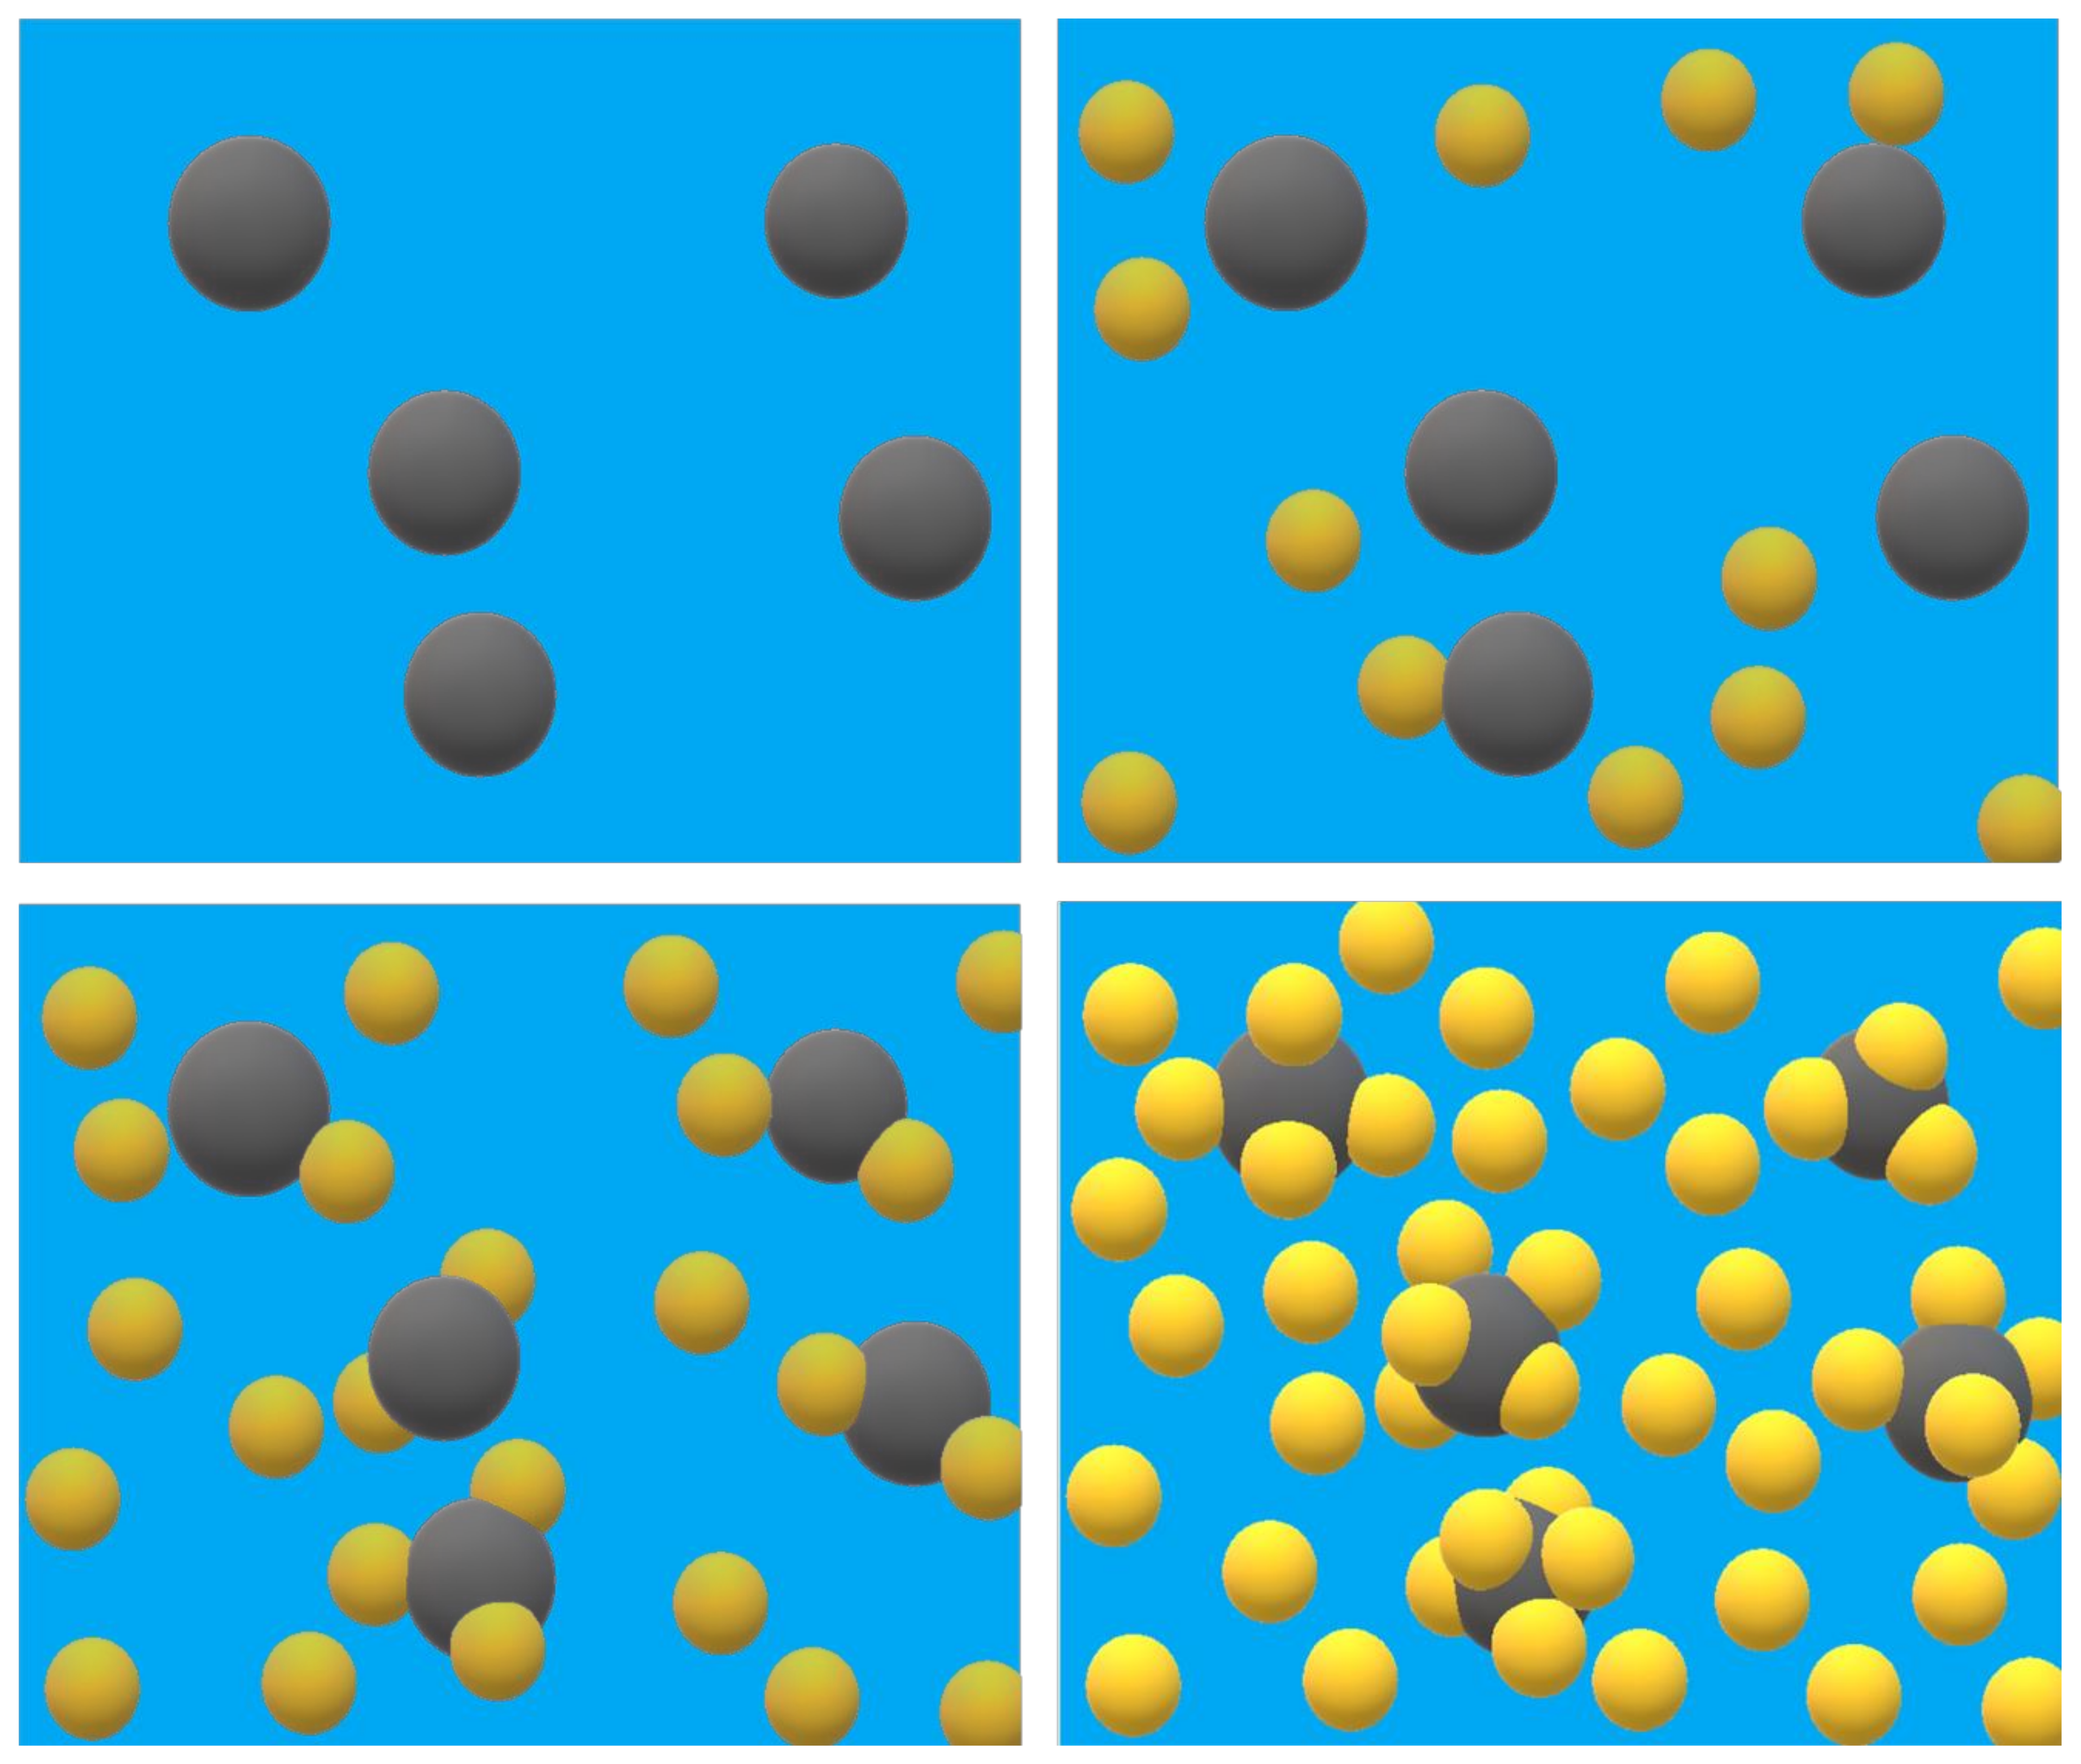
Figure 17.
Where possible, response of the CO2 gas phase band in steam at 130 °C, including (gray) 2%Pt/ZrO2, (periwinkle) 0.55%Rb-2%PtZrO2, (dark red) 4.65%Rb-2%Pt/ZrO2, and (orange) 5.58%Rb-2%Pt/ZrO2.
Figure 17.
Where possible, response of the CO2 gas phase band in steam at 130 °C, including (gray) 2%Pt/ZrO2, (periwinkle) 0.55%Rb-2%PtZrO2, (dark red) 4.65%Rb-2%Pt/ZrO2, and (orange) 5.58%Rb-2%Pt/ZrO2.
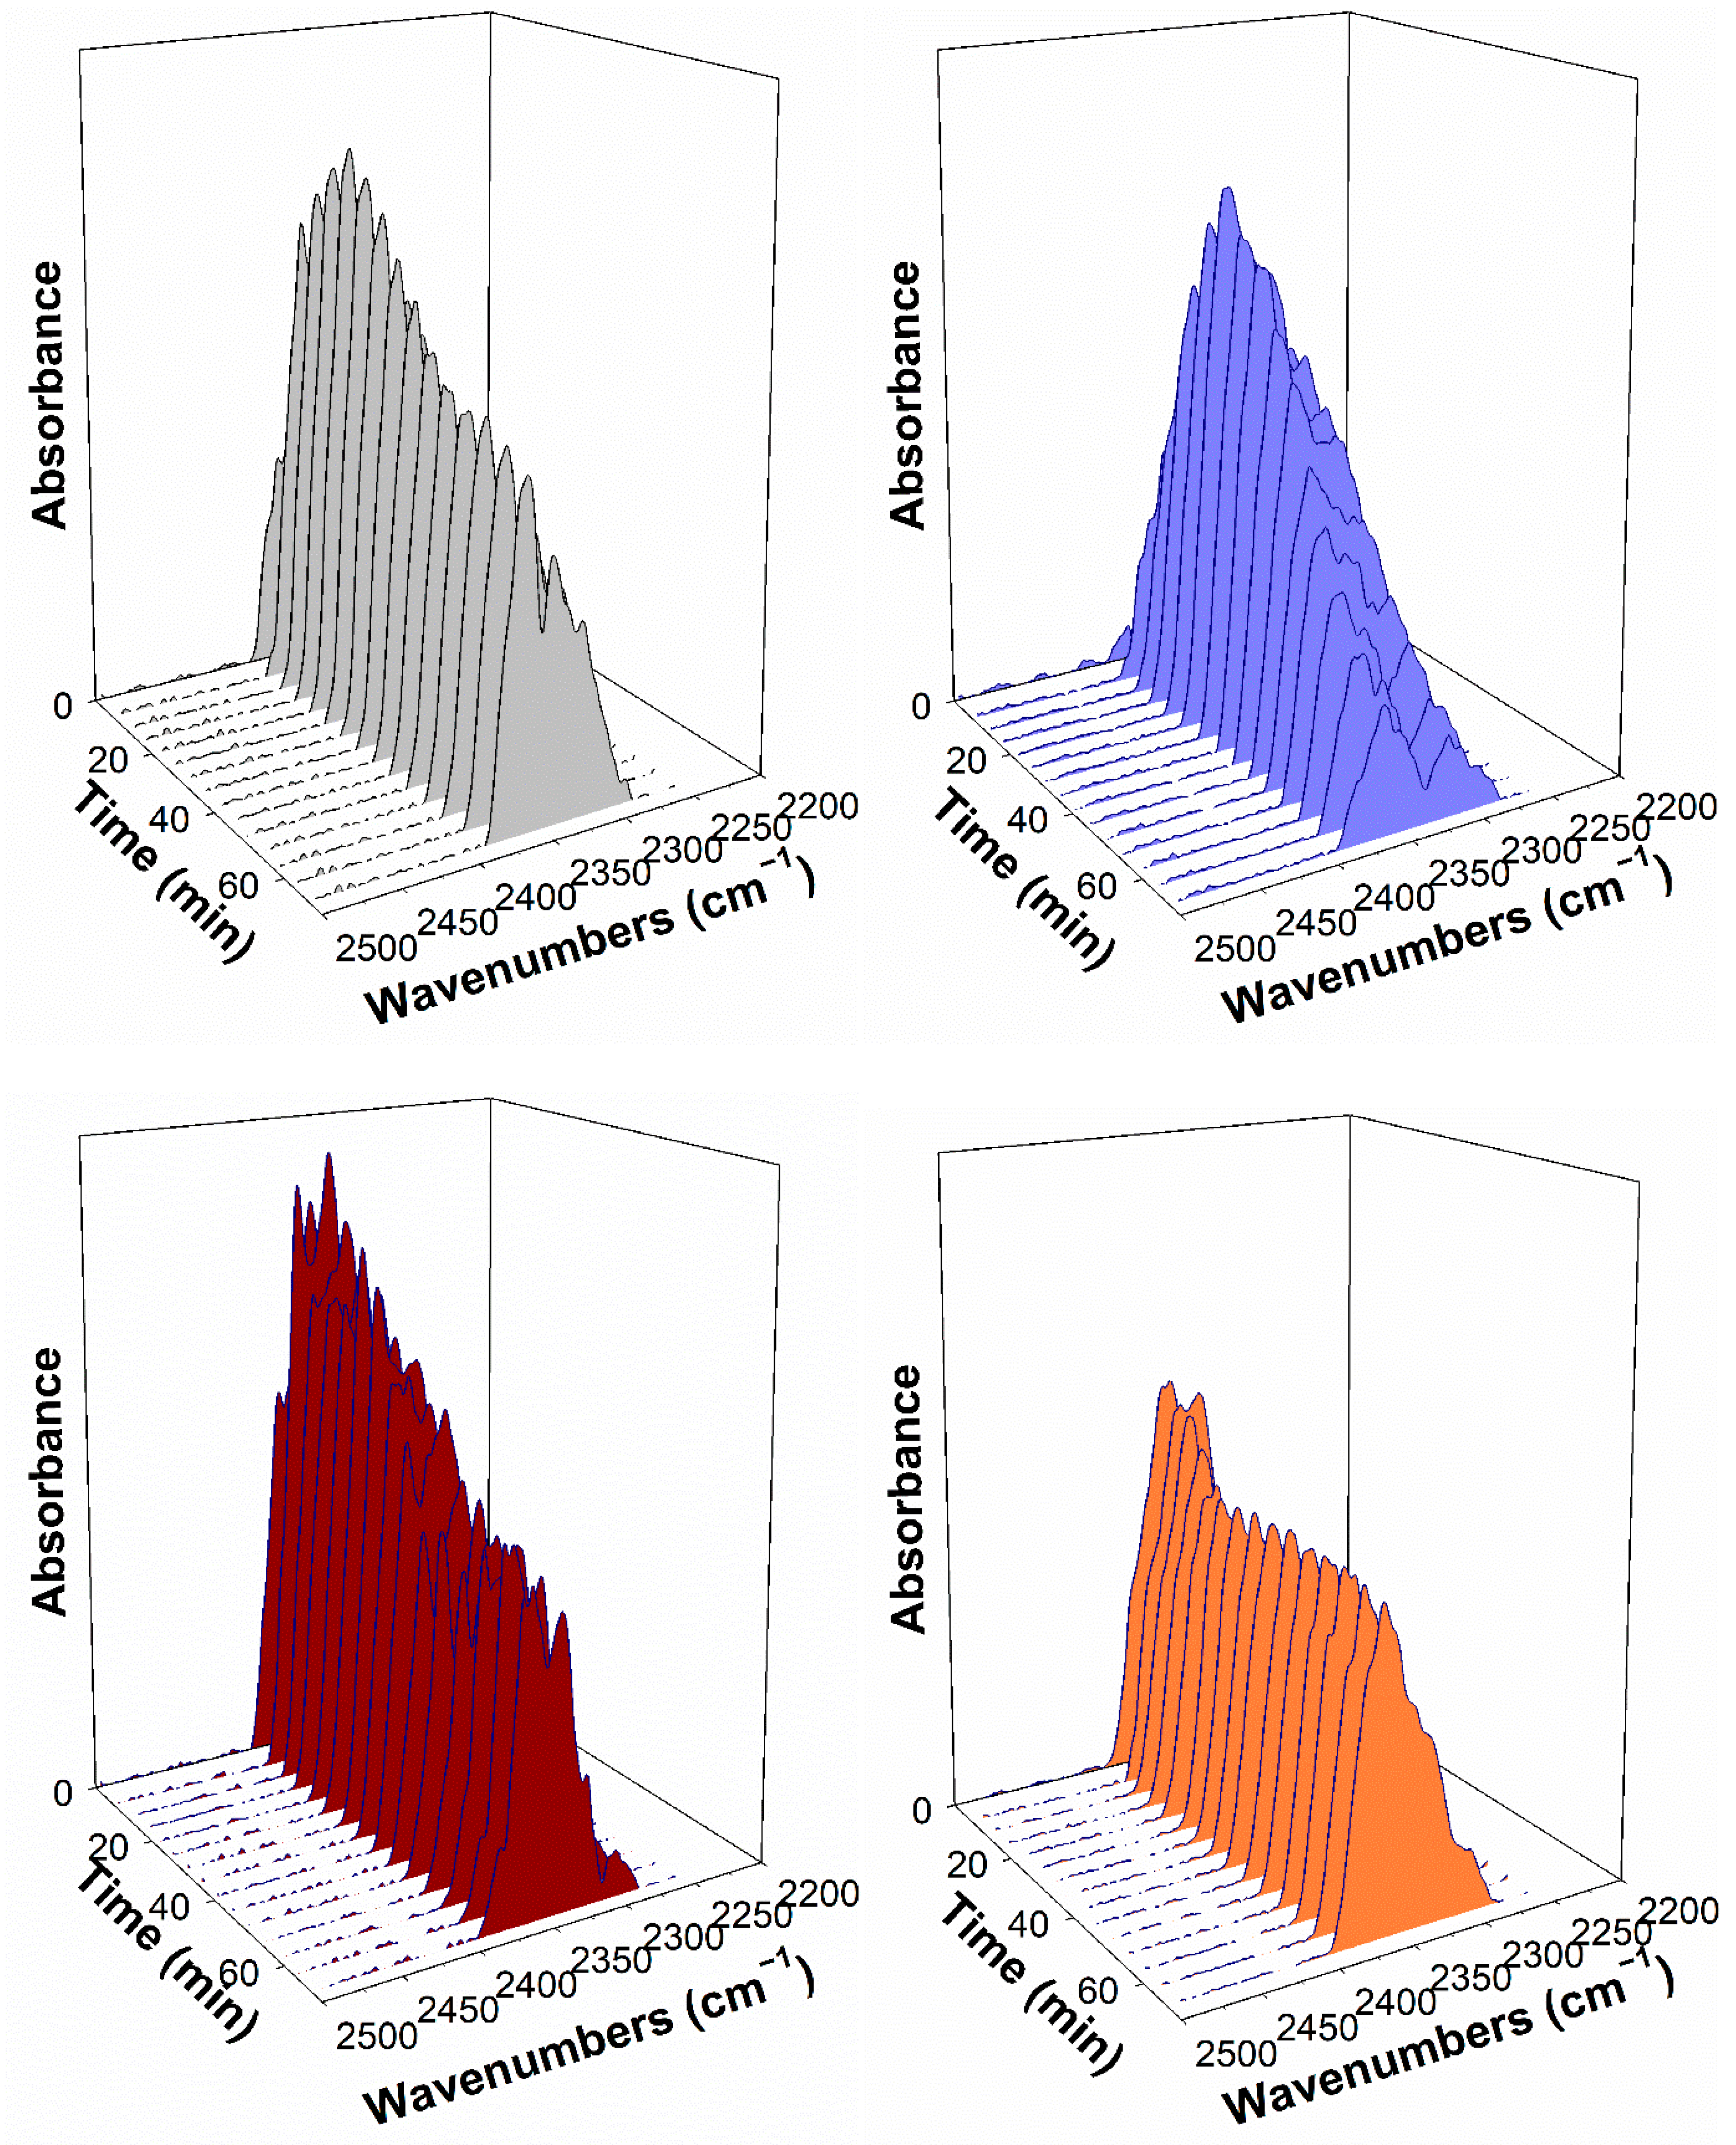
Figure 18.
DRIFTS spectra taken (bottom) before and (top) after formate decomposition in steam for ~100 min, including (a) 2%Pt/ZrO2, and the same catalyst with (b) 0.55%Rb, (c) 0.93%Rb, (d) 1.86%Rb, (e) 2.79%Rb, (f) 3.72%Rb, (g) 4.65%Rb, (h) 5.58%Rb, and (i) 9.29%Rb.
Figure 18.
DRIFTS spectra taken (bottom) before and (top) after formate decomposition in steam for ~100 min, including (a) 2%Pt/ZrO2, and the same catalyst with (b) 0.55%Rb, (c) 0.93%Rb, (d) 1.86%Rb, (e) 2.79%Rb, (f) 3.72%Rb, (g) 4.65%Rb, (h) 5.58%Rb, and (i) 9.29%Rb.
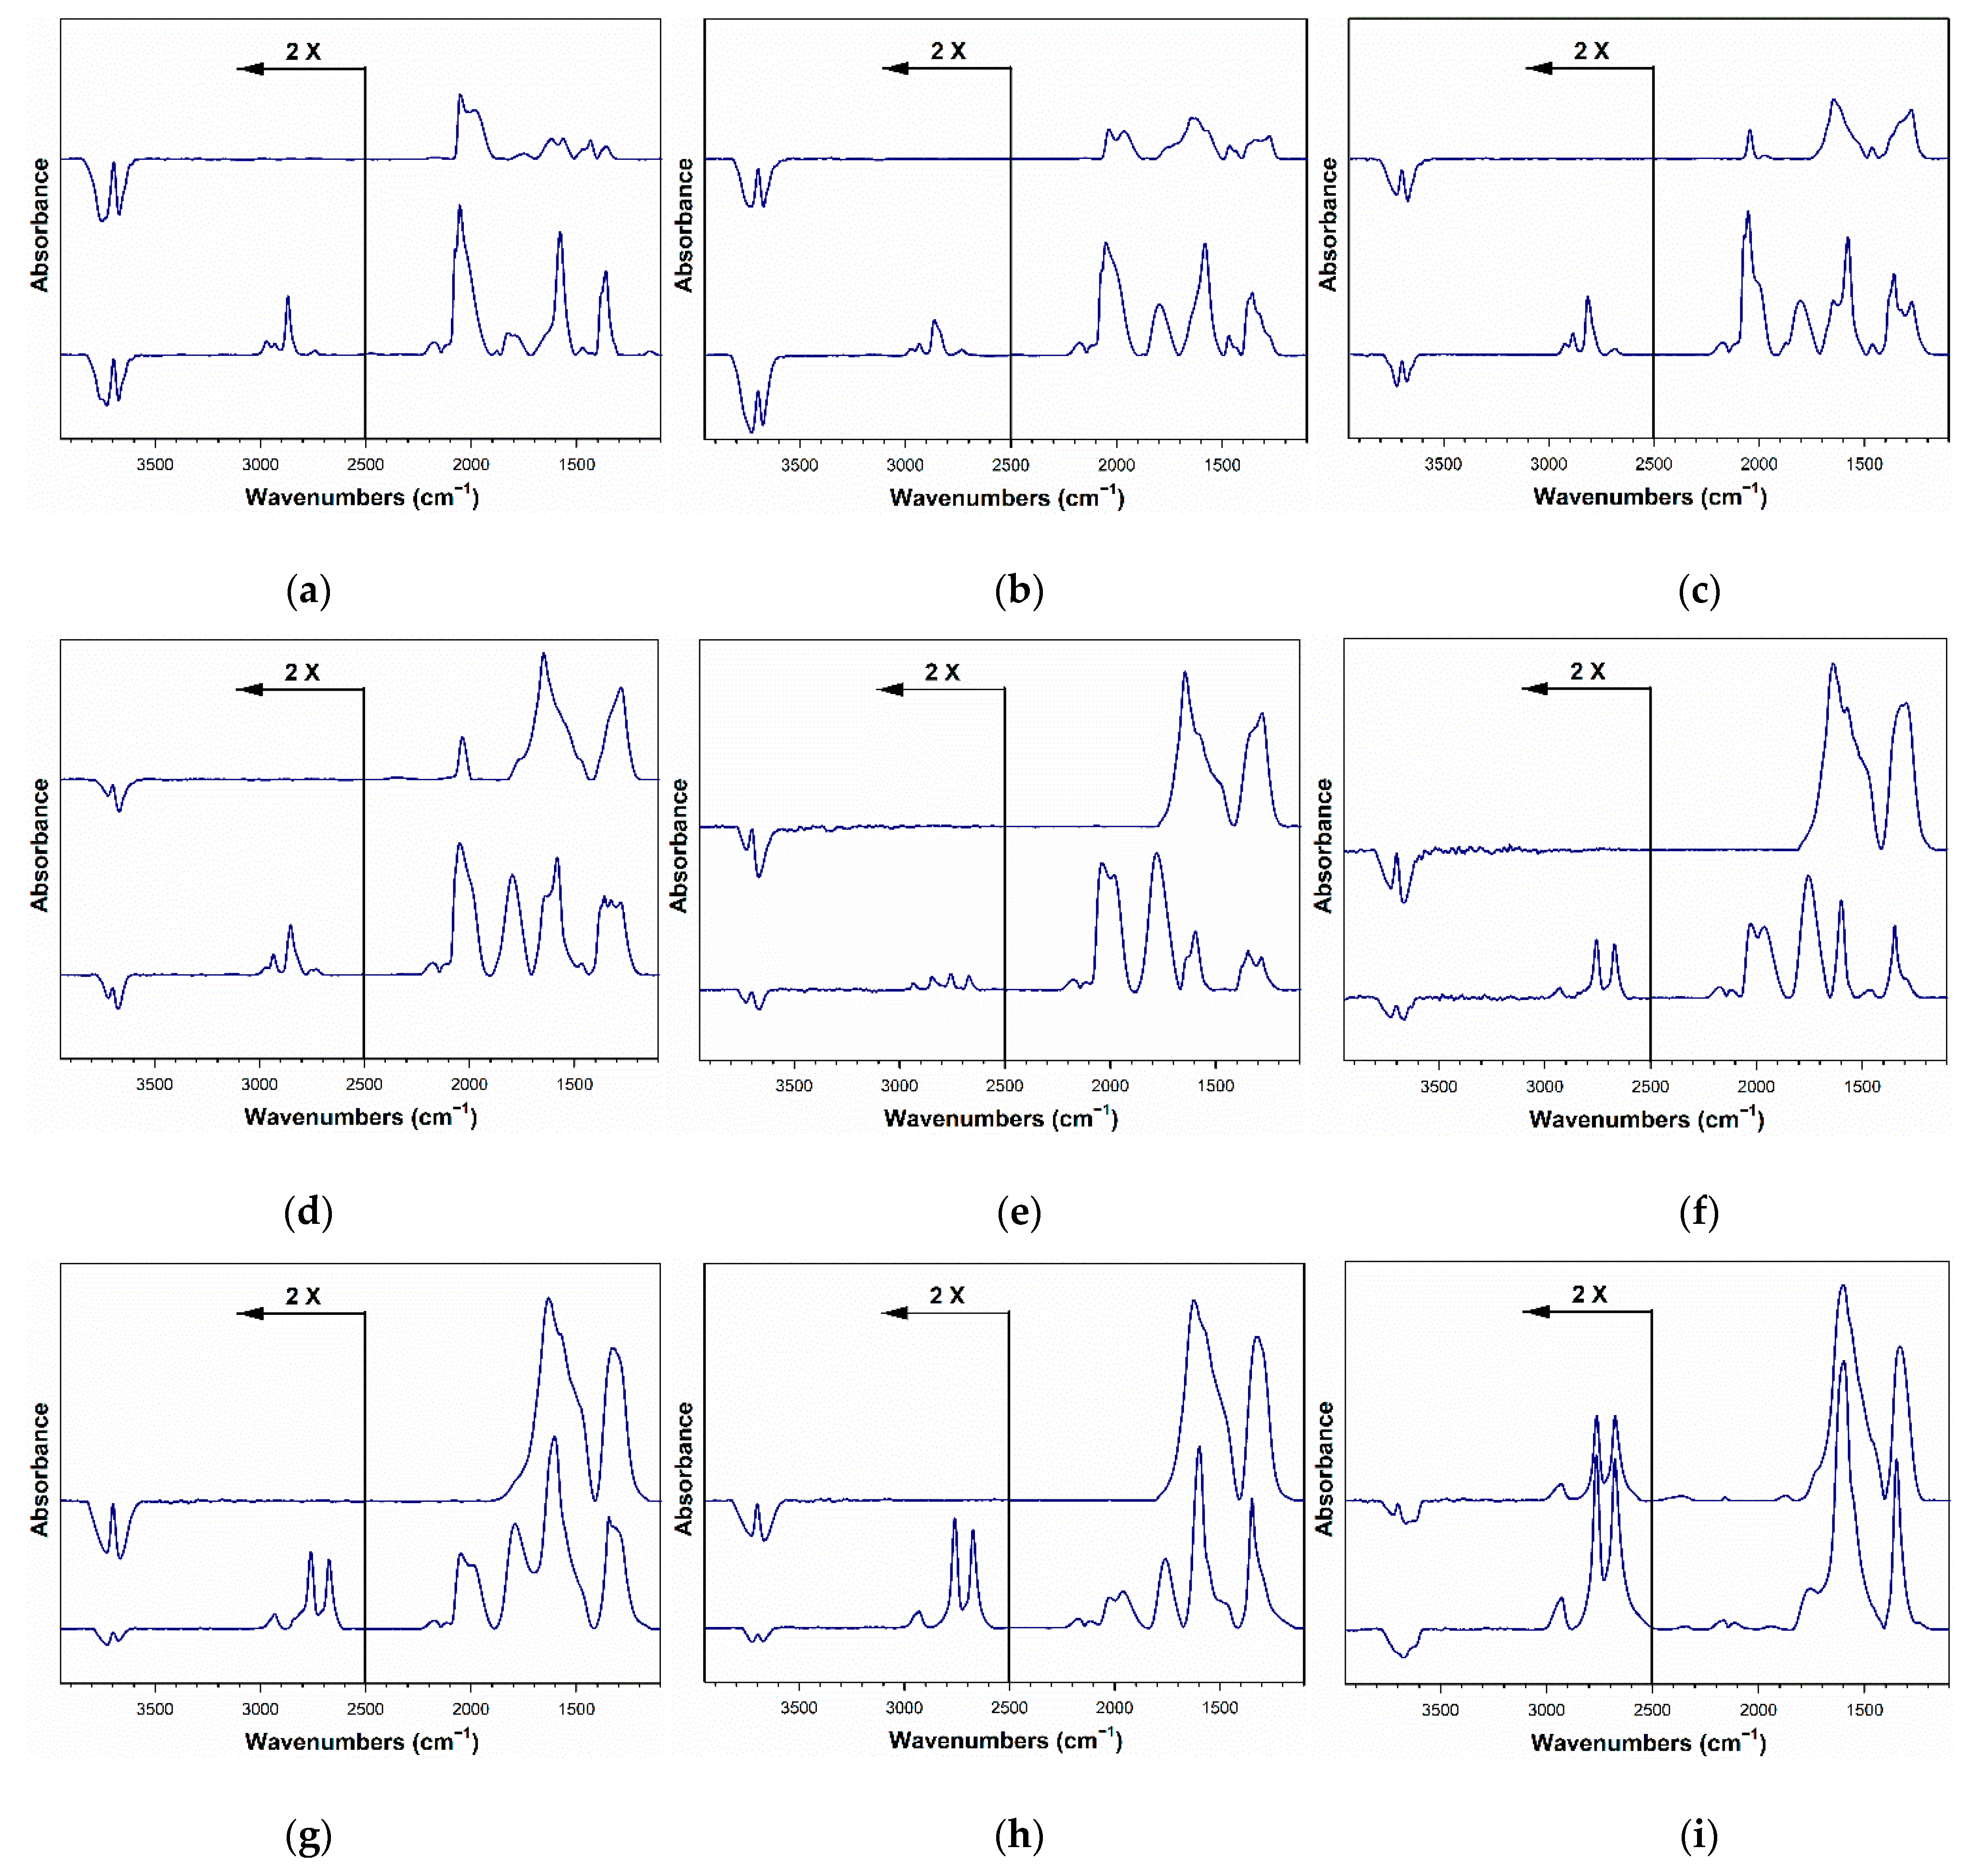
Figure 19.
Temperature programmed desorption mass spectrometry (TPD-MS) profiles of formate decomposition in co-adsorbed water, including (a) 2%Pt/ZrO2, and the same doped with (b) 0.33%Rb, (c) 0.55%Rb, (d) 0.74%Rb, (e) 0.93%Rb, (f) 1.86%Rb, (g) 2.79%Rb, (h) 3.72%Rb, (i) 4.65%Rb, (j) 5.58%Rb, and (k) 9.29%Rb. Note that the signal for (i) was divided by 2, (j) by 3, and (k) by 7.
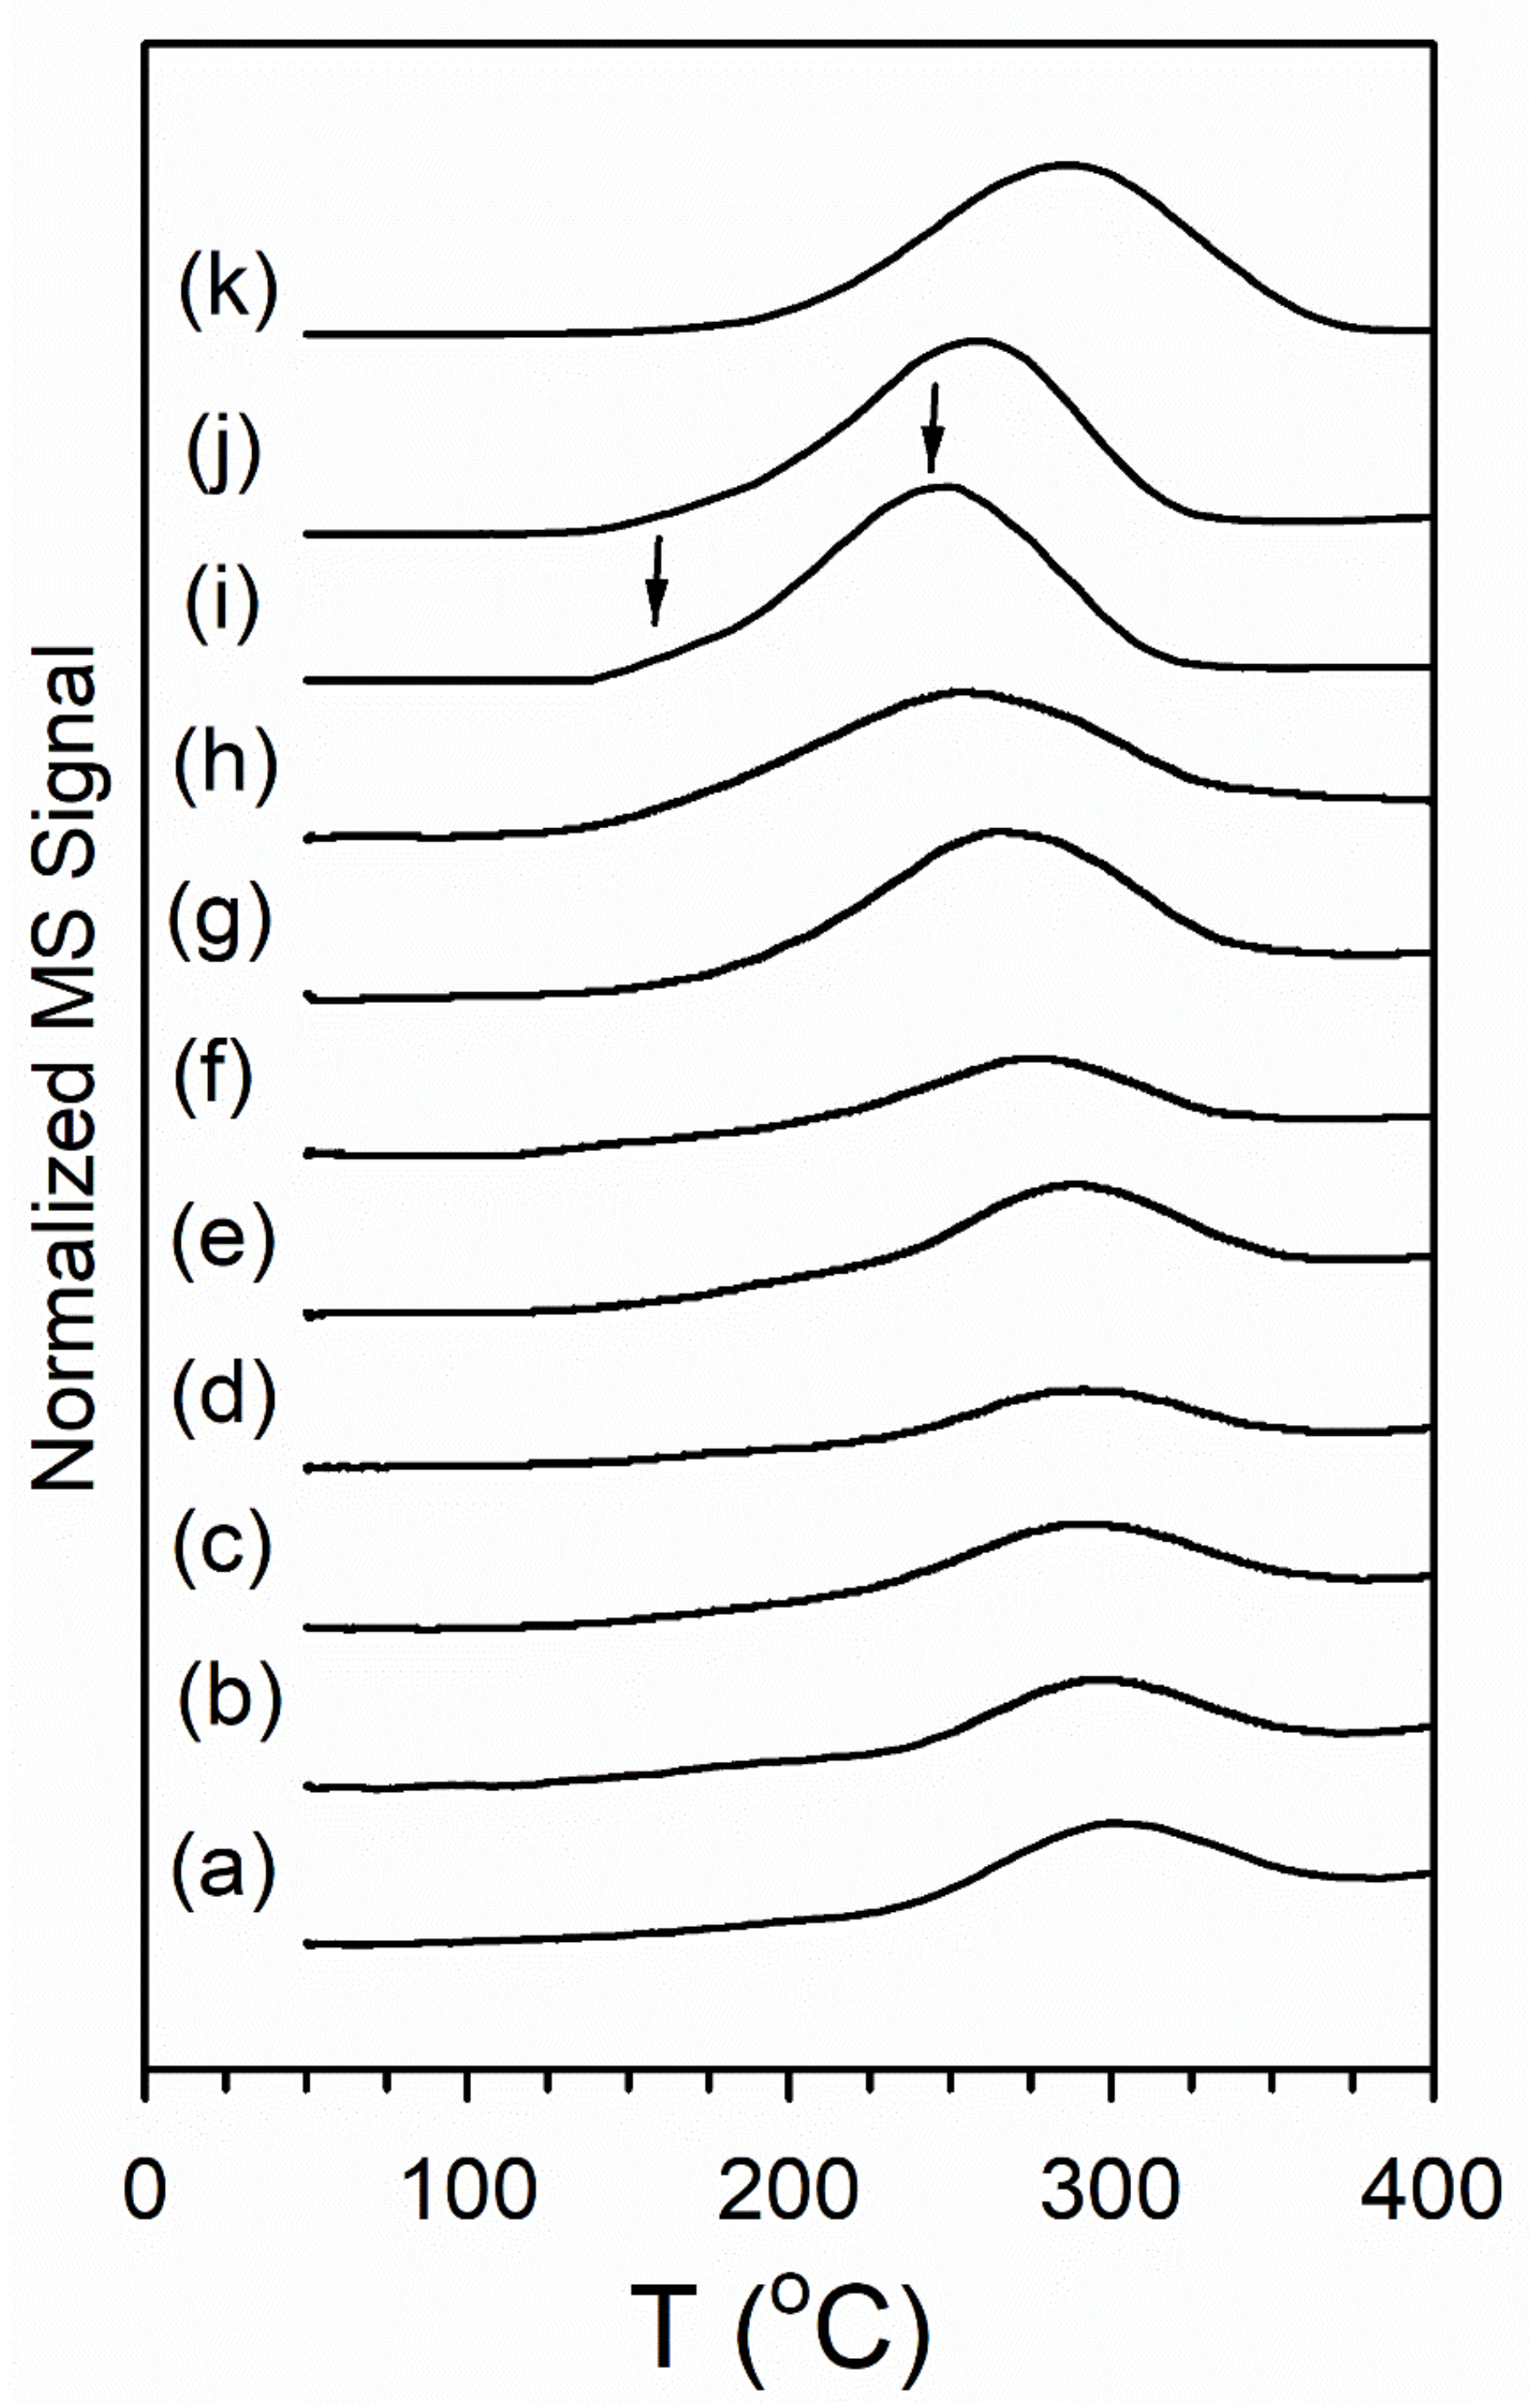
Figure 20.
CO conversion vs. time on stream during LT-WGS for 2%Pt/ZrO2 and the same catalyst doped with various amounts of rubidium (26.1%H2O, 2.9%CO, 29.9%H2, 4.3%N2, 36.8% He, P = 1 atm, SV = 167,638 Ncc/h∙gcat).
Figure 20.
CO conversion vs. time on stream during LT-WGS for 2%Pt/ZrO2 and the same catalyst doped with various amounts of rubidium (26.1%H2O, 2.9%CO, 29.9%H2, 4.3%N2, 36.8% He, P = 1 atm, SV = 167,638 Ncc/h∙gcat).

Table 1.
Surface area (AS), pore volume (VP), and average pore diameter (DP) for prepared catalysts.
Table 1.
Surface area (AS), pore volume (VP), and average pore diameter (DP) for prepared catalysts.
| Sample ID | As (BET) [m2/g] | Vp (BJH Des) [cm3/g] | Dp (BJH Des) [Å] |
|---|---|---|---|
| ZrO2 | 95.4 | 0.289 | 95 |
| 2%Pt/ZrO2 | 89.7 | 0.260 | 95 |
| 0.33%Rb-2%Pt/ZrO2 | 88.8 | 0.271 | 95 |
| 0.55%Rb-2%Pt/ZrO2 | 87.9 | 0.268 | 96 |
| 0.93%Rb-2%Pt/ZrO2 | 91.6 | 0.275 | 93 |
| 1.86%Rb-2%Pt/ZrO2 | 88.7 | 0.262 | 94 |
| 2.79%Rb-2%Pt/ZrO2 | 86.7 | 0.260 | 93 |
| 3.72%Rb-2%Pt/ZrO2 | 78.2 | 0.244 | 93 |
| 4.65%Rb-2%Pt/ZrO2 | 72.3 | 0.235 | 95 |
| 5.58%Rb-2%Pt/ZrO2 | 69.1 | 0.227 | 96 |
| 9.29%Rb-2%Pt/ZrO2 | 58.2 | 0.202 | 102 |
Table 2.
EXAFS fittings * for Pt L-3 edge data for catalysts following reduction in 100% flowing H2 for 2 h and cooling. Ranges: Δk = 3–10 Å−1; ΔR = 1.85–3.25 Å. S02 was fixed at 0.90 as a first approximation.
Table 2.
EXAFS fittings * for Pt L-3 edge data for catalysts following reduction in 100% flowing H2 for 2 h and cooling. Ranges: Δk = 3–10 Å−1; ΔR = 1.85–3.25 Å. S02 was fixed at 0.90 as a first approximation.
| Sample Description | N Pt-Pt Metal | R Pt-Pt (Å) Metal | e0 (eV) | σ2 (Å2) | r-Factor | Est. # Atoms * | Est. Diam. (nm) */** | Est. % Disp. (%) | |
|---|---|---|---|---|---|---|---|---|---|
| Pt0 foil | 12 (fixed) | 2.760 (0.0058) | 8.75 (0.632) | 0.00523 (0.00043) | 0.0084 | - | - | - | |
| 2%Pt/m-ZrO2 | 4.7 (0.70) | 2.669 (0.0157) | 4.22 (1.08) | 0.0100 (0.00249) | 0.0184 | 10 | 0.80 | 94 | |
| 0.72 | |||||||||
| 0.93%Rb-2%Pt/m-ZrO2 | 5.2 (0.42) | 2.690 (0.0084) | 4.30 (0.580) | 0.00971 (0.00133) | 0.0055 | 13 | 0.86 | 92 | |
| 0.78 | |||||||||
| 1.86%Rb-2%Pt/m-ZrO2 | 6.3 (0.41) | 2.705 (0.0072) | 4.89 (0.467) | 0.0112 (0.00116) | 0.0034 | 22 | 1.0 | 87 | |
| 0.93 | |||||||||
| 2.79%Rb-2%Pt/m-ZrO2 | 6.7 (0.39) | 2.720 (0.0064) | 6.04 (0.415) | 0.0103 (0.00102) | 0.0030 | 27 | 1.1 | 85 | |
| 0.99 | |||||||||
| 4.65%Rb-2%Pt/m-ZrO2 | 7.7 (0.62) | 2.736 (0.0081) | 6.51 (0.557) | 0.00834 (0.00128) | 0.0060 | 53 | 1.3 | 77 | |
| 1.2 | |||||||||
| 5.58%Rb-2%Pt/m-ZrO2 | 7.7 (0.55) | 2.745 (0.0068) | 7.15 (0.490) | 0.00665 (0.00107) | 0.0049 | 53 | 1.3 | 77 | |
| 1.2 | |||||||||
| 9.29%Rb-2%Pt/m-ZrO2 | 8.9 (0.47) | 2.750 (0.0047) | 7.96 (0.352) | 0.00505 (0.000723) | 0.0028 | 191 | 2.0 | 56 | |
| 1.9 | |||||||||
Table 3.
Formate ν(CH) band region positions upon CO adsorption using the assignments of Binet et al. [51]. Bold indicates strong bands while shoulders and weak bands are included in parentheses.
Table 3.
Formate ν(CH) band region positions upon CO adsorption using the assignments of Binet et al. [51]. Bold indicates strong bands while shoulders and weak bands are included in parentheses.
| Catalyst | Band Position (cm−1) | |||||
|---|---|---|---|---|---|---|
| ν(CH) | δ(CH) + νs(OCO) | 2δ(CH) | ν(OCO) Formate | ν(OCO) Carbonate | ν(OH) | |
| 2%Pt/ZrO2 (reference) | 2870 | 2973, 2932 | (2752) 2741 | 1386, 1361 sy 1578 asy | 1617, 1560, (1472) 1434, 1362 | 3762, 3675 |
| 0.55%Rb-2%Pt/ZrO2 | 2866 2838 | 2975 (2970), 2933 | (2741) 2732 | (1385) 1375, 1357 sy 1581 asy | (1641) 1619, 1566, 1467, 1377, 1348 (1280) | 3729, 3674 |
| 0.93%Rb-2%Pt/ZrO2 | (2863) 2855 (2837) | 2967, 2930 | (2756) 2727 | (1386) 1359 sy (1648) 1578 asy | 1647 1466 1277 | 3722, 3674 |
| 1.86%Rb-2%Pt/ZrO2 | (2866) 2849 (2832) | 2970, 2931 | (2750) 2725 (2683) | (1374) 1358 (1326) sy (1637) 1582 asy | 1647 (1473) 1278 | 3724, 3673 |
| 2.79%Rb-2%Pt/ZrO2 | 2848, 2756 | 2934 | (2709) 2674 | (1377) 1347 sy (1639) 1597 asy | 1648 (1350) 1280 | 3734, 3666 |
| 3.72%Rb-2%Pt/ZrO2 | 2756 | 2932 | (2705) 2670 | 1346 sy, 1600 asy | 1633, (1573) 1304 | 3733, 3670 |
| 4.65%Rb-2%Pt/ZrO2 | 2761 | 2934 | (2707) 2675 | 1346 sy, 1600 asy | 1635 (1567) 1327 | 3723, 3673 |
| 5.58%Rb-2%Pt/ZrO2 | 2760 | 2934 | (2710) 2675 | 1348 sy, 1598 asy | 1624, 1328 | 3730, 3671 |
| 9.29%Rb-2%Pt/ZrO2 | 2766 | 2927 | (2713) 2678 | 1352 sy, 1594 asy | 1601, 1337 | 3730, 3651 |
Table 4.
Dispersion and initial Pt-CO band magnitude relative to 2%Pt/ZrO2.
| Sample ID | Dispersion Relative to 2%Pt/ZrO2 | Initial Pt-CO Magnitude Relative to 2%Pt/ZrO2 |
|---|---|---|
| 2%Pt/ZrO2 | 1 | 1 |
| 0.93%Rb-2%Pt/ZrO2 | 0.98 | 1.05 |
| 1.86%Rb-2%Pt/ZrO2 | 0.93 | 0.97 |
| 2.79%Rb-2%Pt/ZrO2 | 0.90 | 1.11 |
| 4.65%Rb-2%Pt/ZrO2 | 0.82 | 1.02 |
| 5.59%Rb-2%Pt/ZrO2 | 0.82 | 0.42 |
| 9.29%Rb-2%Pt/ZrO2 | 0.60 | 0.10 |
Table 5.
Comparison of alkali on 2%Pt/ZrO2.
| Alkali Dopant | Optimal Weight% | Optimal Atom% | Maximum Formate ν(CH) Shift (cm−1) Relative to 2%Pt/ZrO2 | Allen Electronegativity of Alkali Metal [54] |
|---|---|---|---|---|
| Na | 1.8–2.5 | 3.15–4.38 | −64 | 0.869 |
| K | 2.55 | 2.69 | −94 | 0.734 |
| Rb | 0.55–0.93 | 0.27–0.46 | −109 | 0.706 |
Publisher’s Note: MDPI stays neutral with regard to jurisdictional claims in published maps and institutional affiliations. |
© 2021 by the authors. Licensee MDPI, Basel, Switzerland. This article is an open access article distributed under the terms and conditions of the Creative Commons Attribution (CC BY) license (http://creativecommons.org/licenses/by/4.0/).
Share and Cite
MDPI and ACS Style
Watson, C.D.; Martinelli, M.; Cronauer, D.C.; Kropf, A.J.; Jacobs, G. Low Temperature Water-Gas Shift: Enhancing Stability through Optimizing Rb Loading on Pt/ZrO2. Catalysts 2021, 11, 210. https://doi.org/10.3390/catal11020210
AMA Style
Watson CD, Martinelli M, Cronauer DC, Kropf AJ, Jacobs G. Low Temperature Water-Gas Shift: Enhancing Stability through Optimizing Rb Loading on Pt/ZrO2. Catalysts. 2021; 11(2):210. https://doi.org/10.3390/catal11020210
Chicago/Turabian StyleWatson, Caleb Daniel, Michela Martinelli, Donald Charles Cronauer, A. Jeremy Kropf, and Gary Jacobs. 2021. "Low Temperature Water-Gas Shift: Enhancing Stability through Optimizing Rb Loading on Pt/ZrO2" Catalysts 11, no. 2: 210. https://doi.org/10.3390/catal11020210
Note that from the first issue of 2016, this journal uses article numbers instead of page numbers. See further details here.