Effects of Framework Disruption of Ga and Ba Containing Zeolitic Materials by Thermal Treatment


1
School of Chemistry and Physics, Westville Campus, University of KwaZulu–Natal, Private Bag X 54001, Durban 4000, South Africa
2
School of Physical and Chemical Sciences, Mafikeng Campus, North-West University, Private Bag X 2046, Mmabatho 2745, South Africa
*
Author to whom correspondence should be addressed.
Catalysts 2020, 10(9), 975; https://doi.org/10.3390/catal10090975
Submission received: 21 July 2020
/
Revised: 28 July 2020
/
Accepted: 29 July 2020
/
Published: 30 August 2020
(This article belongs to the Special Issue Metal-Exchanged Zeolite Catalysts)
Abstract
:The effect of the thermal treatment of some zeolitic materials was studied on oxidative dehydrogenation (ODH) of n-octane. Gallium containing faujasite catalysts were synthesized using isomorphic substitution, specifically, a galosilicalite (Ga-BaY(Sil)) and an aluminosilicalite substituted with gallium (Ga-BaY(IS)), with constant Si/M ratio. The catalysts were thermally treated at different temperatures (250, 550, and 750 °C) before catalytic testing. The quantification of total and strength of acid sites by FT-IR (O-H region), pyridine-IR, and NH3-temperature-programmed desorption (TPD) confirmed a decrease in the number of Brønsted acid sites and an increase in the number of Lewis acid sites upon increasing the calcination temperature. Isothermal n-octane conversion also decreased with the catalysts’ calcination temperature, whereas octene selectivity showed the opposite trend (also at iso-conversion). The COx selectivity showed a decrease over the catalysts calcined from 250 to 550 °C and then an increase over the 750 °C calcined catalysts, which was due to the strong adsorption of products to strong Lewis acid sites on the catalysts leading to the deep oxidation of the products. Only olefinic-cracked products were observed over the 750 °C calcined catalysts. This suggested that the thermal treatment increases Lewis acid sites, which activate n-octane using a bimolecular mechanism, instead of a monomolecular mechanism.
1. Introduction
Zeolite materials offer a variety of properties in catalysis, resulting from their ability to be easily tuned both during synthesis and post synthesis. The introduction of other multivalent metals such as Fe, Ga, V, and Ti in the framework of zeolites can be carried out by substitution of aluminum during synthesis by an isomorphic substitution method [1,2]. Other cations, such as charge balancing cations on the extra framework of the zeolite (Na, K, Ba, etc.) can be introduced after synthesis by ionic exchange and impregnation [2]. Zeolites, however, are not ideal catalysts in the oxidative dehydrogenation of alkanes because of their highly acidic nature. The acidity of zeolites leads to unwanted side reactions that are selective to cracked products, catalyst deactivation as a result of coke deposition, and high COx production [3,4]. Therefore, it is of necessity to modify the acidic properties of zeolites to benefit the oxidative dehydrogenation (ODH) reactions in order to exploit other good properties (high surface area, thermal stability, high crystallinity, well-defined pores) of zeolites [1,2]. The introduction of group two alkaline earth metals by ionic exchange has shown to decrease the strength and overall acidity of the zeolite [5]. The introduction of other multivalent metals in the framework of a zeolite other than aluminum has also shown to decrease the acidity of zeolites [6]. These modifications of zeolites have led to the synthesis of aluminum-free materials called silicalites, (Scheme S1) which have less acidity compared to the unmodified aluminosilicalite (zeolite).
Zeolites and their analogues contain both Brønsted acid sites and Lewis acid sites, and these sites play different roles in the ODH of alkanes. Depending on the concentration of each acid site, the zeolite can either be a Brønsted acid or Lewis acid zeolite. Brønsted acid sites are associated with the hydroxyl groups bridging between the Si(OH)T groups of the zeolitic material, (T = multivalent metal), whereas Lewis acid sites are associated with the metallic species of the framework and extra framework of the material [7]. For hydrocarbon reactions, the Brønsted acid sites are known to directly activate the hydrocarbon by protonation of the feed molecule, whereas Lewis acid sites are known to induce a strong electrostatic field that can polarize adsorbed molecules which results in their activation [8].
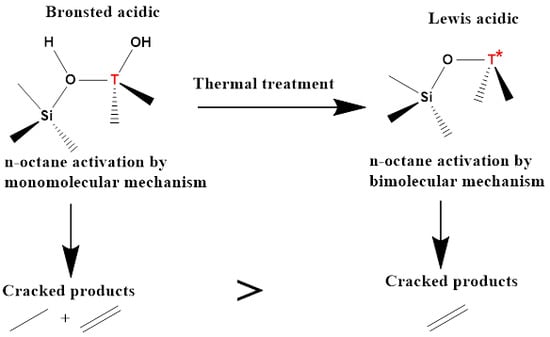
Zeolitic materials treated at temperatures below 450 °C are mostly Brønsted acidic and prevalently associated with the Si(OH)T sites. Thermally treating the zeolitic materials causes the T atoms to migrate into partial or total extra framework positions (Scheme S2). This is true for samples treated at temperatures around 650 °C and for samples with the lowest Si/M ratios, such as faujasites [9]. Partial migration of T atoms means that the framework has been disrupted, but the atoms are still linked to the framework in a form of low coordinated and isolated species. These species at lattice defects are of strong Lewis character. The final step of this migration ends with the complete breaking of the bonds linking the T atoms to the framework, leading to the free migration of T atoms to Lewis acid centers and the formation of a silanol nest [9].
In ODH reactions, it is important, therefore, to understand the migration of the zeolitic material’s acid sites, as this influences the cracking mechanism, as well as the overall feed molecule activation mechanism. It is known that in alkane cracking on zeolitic materials, there is an involvement of carbonium ions as well as carbenium ions which leads to cracking via a ß-scission. The formation of the two species leads to two mechanisms; namely, monomolecular and bimolecular mechanisms for Brønsted acid sites and Lewis acid sites, respectively [10,11]. The monomolecular mechanism is the more pronounced and faster of the two mechanisms, it proceeds via the feed molecule protonation, resulting in a pentacoordinated carbonium ion which can crack to give off a smaller alkane fragment and an adsorbed carbenium ion. This ion subsequently cracks by ß-scission resulting in an olefin and a smaller carbenium ion. Lewis acid sites facilitated bimolecular mechanisms proceed via a hydride ion abstraction by a Lewis acid site from the feed molecule to form a carbenium ion which then cracks via a repeated ß-scission [10,11]. Therefore, by tracking the reaction product selectivity and conversion, one can probe the dominating mechanism in the ODH of n-octane when using thermally modified zeolitic materials. n-Octane was chosen as the representative medium to long chain alkane, which are very abundant and of low value. The ODH reaction was studied because it offers an interesting and less energy-intensive route for the production of olefins from paraffins by rendering the reaction exothermic as a result of the insertion of an oxygen source into the reaction, thus suppressing the thermodynamic constraints [12].
2. Results and Discussion
2.1. Catalysts Characterization
2.1.1. Powder XRD
The XRD pattern of both the prepared catalysts (Figure S1) showed the already known crystal structure of the faujusite type zeolite with characteristic reflections centered around 21.8°, 26.4°, and 54.5° [13]. There were no diffraction peaks observed for any gallium oxide species which suggests good dispersion of the metal within the zeolite framework. Complete substitution of aluminum with gallium in the zeolite framework did not affect the crystal structure of the zeolite, as both the aluminosilicalite and galosilicalite catalysts showed similar diffractograms. A slight shifting of peaks was observed which could be attributed to the difference in the size of aluminum and gallium in the zeolitic framework.
2.1.2. FT-IR
The IR assignments for the two prepared catalysts are similar to previously reported faujasite type zeolitic materials (Figure S2) [12]. The shifts of the IR bands observed between the two spectra obtained can be attributed to change in lattice parameters induced by the substitution of aluminum with gallium. The IR spectra showed bands just above 1800 cm−1 which are assigned to asymmetric stretching of the internal tetrahedra, and symmetric stretching was shown by bands at 740–880 cm−1. These bands are weaker for Ga-BaY(IS), and that could be attributed to the difference in crystal growth in the presence of aluminum compared to the aluminum-free Ga-BaY(Sil) [14]. The first band around 420 cm−1 is indicative of the T-O bend, and the external linkage double ring was shown by the bands around 600 cm−1. There is a decrease in intensity of a ~3600 cm−1 band for Ga-BaY(Sil), which is a band associated with the hydroxyl group attached to extra framework aluminum [15,16,17].
To evaluate the effect of thermal treatment, the catalyst batches calcined at three different temperatures (250, 500, and 750 °C) were characterized by FT-IR in the O-H region (~3200–4200 cm−1). This can give information on the strength and qualitative amount of Brønsted acid sites. Both the catalysts (Ga-BaY(IS) and Ga-BaY(Sil)) showed stronger absorbance bands (Figure 1 and Figure 2) for catalysts calcined at 250 °C, and the bands decreased with increasing calcination temperature. There was also a shift observed in the IR bands, with a sample calcined at 750 °C showing bands closer to 3800 cm−1. This may be attributed to the difference in the strength of the OH bonds, with the strongest shifting to higher IR regions [18]. The disappearance of the OH bands with increasing temperature suggests that the number of Brønsted acid sites decreases during thermal treatment of the catalysts through dehydroxylation of the zeolites [9]. The IR bands for the galosilicalite (Ga-BaY(Sil) were less intense than for the aluminosilicalite (Ga-BaY(IS)), suggesting low Brønsted acid sites concentration for the aluminum-free catalyst.
2.1.3. Scanning Electron Microscopy
Figure 3 shows the cubic surface morphology of the prepared catalysts which is the typical morphology for the faujasite zeolitic materials. The difference in the crystal size between the two catalysts results from the different framework composition (aluminum and aluminum-free for Ga-BaY(IS) and Ga-BaY(Sil), respectively) which leads to different crystal growth rates during the synthesis [19,20].
2.1.4. Pyridine FT-IR
Pyridine IR was carried out at room temperature. Figure 4 and Figure 5 show the pyridine vibration range (1400–1700 cm−1) [21]. For both the catalysts, two bands related to Lewis-bonded pyridine appeared at 1450 and 1624 cm−1. Pyridine physically adsorbed via hydrogen bonding with surface hydroxyl groups and gave absorption bands at 1574 and 1595 cm−1, which confirmed the presence of weak and medium Brønsted acid sites. A band at 1489 cm−1 was due to the contribution of both Lewis and Brønsted acid sites [22]. For Ga-BaY(IS), the intensity for the IR bands showed 67% Lewis and 33% Brønsted acid sites for the 250 °C calcined sample, 73% Lewis and 27% Brønsted for the 550 °C calcined sample, and 77% Lewis and 23% Brønsted sites for the 750 °C calcined sample. For Ga-BaY(Sil), at 250 °C, the band intensities implied 71% Lewis and 29% Brønsted acid sites, at 550 °C, 74% Lewis and 26% Brønsted acid sites, while the 750 °C calcined sample showed 77% Lewis and 23% for Brønsted acid sites. These results suggest that upon increasing the calcination temperature, the migration of framework metal (Al/Ga) to the extra framework also increases, which creates more Lewis acid sites while decreasing Brønsted acid sites.
2.1.5. Temperature-Programmed Desorption with NH3
Ammonia-temperature-programmed desorption (TPD) analysis was only performed on the catalysts that were calcined at 550 °C and 750 °C. Catalysts calcined at 250 °C were not analyzed as they might still contain some volatile organics that can damage the instrument when run under the conditions used for the ammonia-TPD analysis. The results in Table 1 show results in three ammonia desorption regions, which correspond to weak acid sites (≤200 °C), medium strength acid sites (<400 °C), and strong acid sites (≥400 °C) [23]. Comparing the results between the two catalysts calcined at 550 °C and 750 °C, one sees an increase in the concentration of medium strength and strong acid sites and a decrease in the weak acid sites when the catalysts were calcined at 750 °C. This suggests that calcining at higher temperatures leads to the dehydroxylation of the weakly bound extra framework hydroxyl groups responsible for the weak Brønsted acid sites, leaving behind bare cations acting as Lewis acid sites. The contribution of both framework cations and hydroxyl groups contained within the zeolitic material framework induced the medium strength Lewis and Brønsted acid sites. Strong acid sites, around NH3 desorption at 600 °C, are assigned to Lewis acid sites associated with bare cations of framework aluminum and gallium that migrate to the extra framework upon calcining at higher temperatures. Ga-BaY(IS) had more strong and total acid sites compared to Ga-BaY(Sil) because of the presence of aluminum in the Ga-BaY(IS) catalyst [24].
2.1.6. Thermogravimetric Analysis
Thermogravimetric analysis of the prepared catalysts (Figure 6) showed three events, in the temperature ranges 25–300 °C, 300–700 °C, and 700–1000 °C. Ga-BaY(Sil) showed distinct differences compared to Ga-BaY(IS). Ga-BaY(IS) calcined at 250 °C showed a total weight loss of up to 24% compared to about 21% total weight loss by Ga-BaY(Sil). Weight loss for the 550 °C and 750 °C calcined Ga-BaY(IS) was about 8% and 4%, respectively, compared to 15% and 10% of Ga-BaY(Sil). The weight loss at the low temperature range was due to the loss of water and hydroxyl groups weakly bound to the extra framework cations. The weight loss at intermediate temperature ranges was due dehydroxylation within the framework of the zeolitic material [25]. This was more apparent for Ga-BaY(IS) which contains more of these sites, confirmed by the higher concentration and strength of Brønsted acid sites (Section 2.1.5). Ga-BaY(Sil) was unstable at very high temperatures, shown by a sharp decrease in the thermogravimetric analysis (TGA) curve just below 1000 °C. Ga-BaY(IS) was stable up to 1000 °C, suggesting that the complete substitution of aluminum with gallium in the framework of the zeolitic material decreases thermal stability.
2.1.7. Brunauer, Emmett, and Teller (BET) Studies
BET surface studies were carried out using the catalysts calcined at 250 °C and 750 °C to evaluate the effect of calcination temperature on the surface area and pore volumes of the prepared catalysts (Table 2). For both the catalysts (Ga-BaY(IS) and Ga-BaY(Sil)), surface areas decreased with increasing calcination temperature. For the pore volumes, only a slight change was observed, which also shows a decrease in pore volume as a result of partial pore blockage resulting from cation migration within the zeolitic material framework. There was also a slight increase in the pore diameter as the calcination temperature was increased.
N2 adsorption-desorption for the characterized catalysts all showed type IV isotherms (Figures S3–S6) which is typical of mesoporous solids. The hysteresis loops for the Ga-BaY(IS) catalysts were classified as H4 hysteresis loops, which suggests narrow slit-like pores, with walls composed of mesoporous silica. Ga-BaY(Sil) shows H2 type hysteresis loops which are indicative of a material with a narrow mouth to the pores and uniform channel-like pores [26]. The increase in adsorbed nitrogen volume at high relative N2 pressures for all the prepared samples relates to the presence of the intercrystalline porosity [27].
2.2. Catalytic Performance
Catalytic testing results shown in Figure 7 were obtained under similar testing conditions (Temperature = 450 °C, GHSV = 6000 h−1, C:O ratio = 8:1, and catalyst = 1 mL). Ga-BaY(Sil) calcined at different temperatures showed higher conversions when compared to Ga-BaY(IS) calcined under similar conditions. The higher conversions over Ga-BaY(Sil) catalysts may be attributed to the higher loading of Ga compared to the Ga-BaY(IS) catalysts, namely, three magnitudes higher. Conversion over both the catalysts decreased with increasing calcination temperature, and this suggests that as the calcination temperature increases, dehydroxylation of the catalysts leads to the decrease in the concentration of hydroxyl groups responsible for the Brønsted acid sites, which in turn decreases the activity of the catalysts. The selectivity to cracked products, which are a result of the acidity of the catalyst, also decreases with the calcination temperature. This also suggests the decrease in the concentration of the Brønsted acid sites as the calcination temperature is increased. The low cracking activity shown by catalysts calcined at 750 °C results from the induced Lewis acid sites from the dehydroxylation and migration of the framework cations. This is supported by the results shown in Table 3.
Table 3 shows the product distribution of the cracked products from the tested catalysts. The catalysts calcined at 250 °C showed both cracked alkanes and alkenes in the products stream, whereas as the calcination temperature was increased, the alkane-cracked products were not within detectable concentrations. However, for Ga-BaY(IS), the disappearance of alkane-cracked products was only observed for the 750 °C calcined catalyst. This was attributed to the higher concentration of strong Brønsted acid sites associated with the Ga-BaY(IS) catalyst compared to Ga-BaY(Sil).
The formation of cracked products follows different mechanisms. For the catalysts calcined at 250 °C, the higher concentration of Brønsted acid sites may activate the feed molecule (n-octane) via protonation and formation of the carbonium ion. When this carbonium ion cracks, it yields an alkane and an adsorbed carbenium ion, which also cracks via ß-scission to yield an alkene and a smaller carbenium ion. This mechanism is more pronounced and faster, which explains the higher conversions at low temperature calcined catalysts [28]. As the catalysts dehydroxylate at higher calcination temperatures, Brønsted acid sites decrease, and Lewis acid sites increase. The disappearance of alkane-cracked products is characteristic of a Lewis acid activated reaction. Lewis acid sites generate a carbenium ion directly from the feed molecule via abstraction of a hydride ion, which is followed by cracking via repeated ß-scissions. This mechanism leads to the formation of alkene-cracked products and it is slower, which explains the lower conversions for higher temperature calcined catalysts. Only C3–C5 cracked products were observed under testing conditions. C1–C2 may have been produced in small amounts and were unstable since primary carbonium ions require high energy to form.
Figure 8 and Figure 9 show octenes selectivity and COx selectivity, respectively. Less acidic Ga-BaY(Sil) showed higher octene selectivity, up to 36% for the 750 °C calcined catalyst compared to 27% for Ga-BaY(IS) catalyst. For both the catalysts, octene selectivity increased with increasing calcination temperature, which suggests the decrease in the concentration of Brønsted acid sites which lead to deep oxidation of the octene products. For COx, in Figure 9, a decrease is seen from the 250 °C calcined catalysts to the 550 °C calcined catalysts, which suggested the decrease in Brønsted acid sites which lead to over-oxidation to COx. The increase in COx from the 550 °C to 750 °C calcined catalysts may be attributed to the formation of more strong Lewis acid sites at this temperature, which leads to the strong adsorption of alkene products, and subsequently, leads to deep oxidation to COx.
Iso-conversion data (Figures S7–S10) of the prepared catalysts showed similar trends, which suggests insignificant conversion effects on the product selectivities obtained when the catalysts were tested under similar conditions. The catalysts were stable and, e.g., Figure S11 shows no coke formation over BaY(IS) after a three-day catalytic run.
3. Materials and Experimental Methods
3.1. Catalysts Preparation
Both studied catalysts were prepared by isomorphic substitution using a modified sol-gel method [29]. Synthesis of Ga-BaY(IS) was carried out in a 500 mL sealable Teflon beaker, where 14.53 g of BaCl2·2H2O (Merck NT Laboratory Suppliers, Kenilworth, NJ, USA) was dissolved in 37.5 g of distilled water, followed by the addition of 6.56 g of aluminum tri-sec-butoxide (Merck NT Laboratory Suppliers, Kenilworth, NJ, USA)) and 0.74 g of gallium nitrate (Sigma Aldrich, St. Louis, MO, USA) under agitation for 2 h to yield gallium aluminate solution. After 2 h, 30 wt% colloidal silica solution (Sigma Aldrich—26.44 g, St. Louis, MO, USA) was slowly poured to the aluminate solution under vigorous stirring. The beaker was then tightly sealed and transferred to an oil bath at 25 °C and aged for 24 h with constant stirring. Thereafter, the solution was aged at 40 °C for 24 h with no stirring, and finally at 80 °C for 48 h. The recovered solid was filtered under vacuum and washed with double distilled water until the pH was 8,9 and dried at 110 °C overnight. For the synthesis of Ga-BaY(Sil), 3.023 g of gallium nitrate was used in place of aluminum tri-sec-butoxide, but all other conditions and procedures were kept similar to the synthesis of Ga-BaY(IS). The coding used to distinguish between the two prepared catalysts is IS (for isomorphically substituted zeolite) and Sil (for the silicalite). After structure confirmation characterization (XRD, SEM, and FTIR) was carried out on the prepared catalysts, each sample was separated into three batches. One batch was calcined under flowing air at 250 °C for six hours, the next batch at 550 °C, and the last batch at 750 °C before catalytic testing.
3.2. Catalysts Characterization
Powder X-ray diffraction was carried out for structure and phase identification using a Bruker D8 Advance diffractometer, with a graphite monochromatic filter operated at 40 kV and 40 mA (Karlsruhe, Germany), and CuKα radiation (λ = 1.5406 nm). Data was collected in steps of 0.02° and scanning speed of 0.2 s−1, in the 2-theta range of 5°–90°. N2 physisorption was carried out with a Micromeritics Tristar II surface area and porosity analyzer at −196 °C (Norcross, GA, USA). Before analysis, finely ground samples were degassed up to their calcination temperature under N2 flow overnight in a Micromeritics Flow Prep 060 (Norcross, GA, USA). The catalysts calcined at 750 °C were degassed at 550 °C because the degassing instrument was limited to that temperature. Temperature-programmed experiments were carried out on a Micromeritics 2920 Autochem II Chemisorption Analyser (Norcross, GA, USA). Ammonia temperature-programmed desorption (NH3-TPD) was carried out with ca. 0.06 g catalyst following a reported method [30]. Infrared spectra were obtained at room temperature with a Perkin Elmer Spectrum 100 FT-IR Spectrometer equipped with a Universal ATR Sampling Accessory (Waltham, MA, USA). The pyridine IR spectra were obtained with the same instrument as above. For the pyridine IR, 0.05 g samples were treated with pyridine (1.0 mL) and dried under flowing air at room temperature. Then, the spectra were recorded in a range of 1400–1700 cm−1. A Zeiss Ultra Plus field emission gun scanning electron microscope (FEG-SEM) with Smart SEM Software (Oberkochen, Germany) was used for obtaining SEM and SEM-EDX images. Before the analyses, the samples were coated with gold using a Q150R series high vacuum Quorum sputter coater (Laughton, UK). Thermogravimetric analyses (TGA) were carried out with a Perkin Elmer STA 6000 (Waltham, MA, USA). The samples were subjected to a temperature ramp from 25 °C to 1000 °C in air.
3.3. Catalytic Testing
Catalytic testing was carried out using a laboratory scale continuous-flow, gas phase, fixed-bed reactor at 450 °C. Air and N2 were fed to the reactor as the oxidant and diluent gas, respectively. n-Octane (Merk, NJ, USA) with a purity of >98% was fed at a concentration (v/v) in the gaseous mixture above n-octane’s upper flammability limit using a calibrated Lab Alliance Series II HPLC Pump (New York, NY, USA). The mass delivered was recorded using an electronic balance. The n-octane fed was kept in the gaseous phase by heated feed lines at 130 °C using heating tape. Temperatures were controlled with CB-100 RK temperature control units with internal relays and monitored via K-type thermocouples. The pelletized catalysts (1.0 mL) were placed between two thin layers of glass wool and positioned in the hottest zone of the calibrated reactor block. The spaces in the reactor tube were packed with 24 gritt carborundum and stoppered by glass-wool at either end. A Ritter wet gas flow meter measured the total gas flow. The liquid products and unreacted feed were collected in a cylindrical stainless steel catch vessel at ca. 3.0 °C. The gaseous products were analyzed using a Perkin Elmer Clarus 400 gas chromatograph (GC) (Waltham, MA, USA) fitted with a 30 m × 530 μm Supelco Carboxen 106 PLOT column and equipped with a thermal conductivity detector (TCD). The liquid and gaseous products from the cooled catch vessel were analyzed using a Shimadzu GC-2025 (Kyoto, Japan), fitted with a 50 m × 200 μm PONA capillary column and flame ionization detector (FID). To obtain iso-conversion, the GHSV was varied in the range of 6000 h−1 for the less active catalysts to 8000 h−1 for the more active catalysts.
4. Conclusions
Thermal treatments of the zeolitic materials dehydroxylate the materials leading to a decrease in the bridging hydroxyl groups responsible for the Brønsted acidity of the material. At temperatures ranging from 550 °C and above, there is a partial and full migration of framework and extra framework cations in the zeolitic material, which induces Lewis acid sites of different acid strengths. Thermally treated zeolitic materials activate n-octane following two mechanistic routes, namely, a monomolecular mechanism and bimolecular mechanism. The monomolecular mechanism is Brønsted acid site facilitated and bimolecular mechanism is facilitated by Lewis acid sites. The products’ selectivity showed that for low temperature (250 °C) calcined catalysts, the dominating mechanism is the monomolecular mechanism. For high temperature (750 °C) calcined catalysts, the dominating mechanism was found to be the bimolecular mechanism.
Supplementary Materials
The following are available online at https://www.mdpi.com/2073-4344/10/9/975/s1, Scheme S1: Modification of zeolites by isomorphic substitution to yield a silicalite material, Scheme S2: Transformation of acid sites of zeolitic materials, Figure S1: XRD diffractograms of (A) Ga-BaY(IS), (B) Ga-BaY(Sil), Figure S2: FT-IR spectra of (A) Ga-BaY(IS), (B) Ga-BaY(Sil), Figure S3: N2 adsorption-desorption isotherms of Ga-BaY(Sil) calcined at 250 °C, Figure S4: N2 adsorption-desorption isotherms of Ga-BaY(Sil) calcined at 750 °C, Figure S5: N2 adsorption-desorption isotherms of Ga-BaY(IS) calcined at 250 °C, Figure S6: N2 adsorption-desorption isotherms of Ga-BaY(IS) calcined at 750 °C, Figure S7: Cracked products selectivity at iso-conversion for Ga-BaY(IS) and Ga-BaY(Sil) calcined at different temperatures (6 ± 1 % and 8 ± 1 % respectively), Figure S8: Cracked products distribution at iso-conversion for Ga-BaY(IS) and Ga-BaY(Sil) calcined at different temperatures, Figure S9: Octene selectivity at iso-conversion of Ga-BaY(IS) and Ga-BaY(Sil) calcined at different temperatures, Figure S10: COx selectivity at iso-conversion of Ga-BaY(IS) and Ga-BaY(Sil) calcined at different temperatures, Figure S11: Images of (A) used BaY (Before Ga substitution) with coke deposits, and (B) used Ga-BaY(IS) free of coke deposits after a 3 day run.
Author Contributions
Synthesis, characterization, catalysis measurements: S.S.N.; data analysis: S.S.N., H.B.F. and M.N.C.; project supervision and manuscript preparation: H.B.F. and M.N.C. All authors read and agreed to the published version of the manuscript.
Funding
This research was funded by C*Change, the DST-NRF Centre of Excellence in catalysis and SASOL.
Acknowledgments
We would like to thank the School of Chemistry and Physics, Microscopy and Microanalysis Unit (UKZN) for characterization and M. Datt (Sasol) for constructive criticism for this research.
Conflicts of Interest
The authors declare no conflict of interest.
References
- Kosinov, N.; Liu, C.; Hensen, E.J.M.; Pidko, E.A. Engineering of Transition Metal Catalysts Confined in Zeolites. Chem. Mater. 2018, 30, 3177–3198. [Google Scholar] [CrossRef] [PubMed]
- Moshoeshoe, M.; Nadiye-Tabbiruka, M.S.; Obuseng, V. A Review of the Chemistry, Structure, Properties and Applications of Zeolites. Am. J. Mater. Sci. 2017, 7, 196–221. [Google Scholar]
- Aliev, A.M.; Shabanova, Z.A.; Nadzhaf-Kuliev, U.M.; Medzhidova, S.M. Oxidative Dehydrogenation of Cyclohexane over Modified Zeolite Catalysts. Petrol. Chem. 2016, 56, 639–645. [Google Scholar] [CrossRef]
- Alamdari, A.; Karimzadeh, R. Oxidative Dehydrogenation of Liquefied Petroleum Gas on Copper, Zinc and Iron Oxide Impregnated on MFI Zeolite Assisted by Electric Power. Catalysts 2018, 8, 270. [Google Scholar] [CrossRef] [Green Version]
- Bakare, A.; Muraza, O.; Yoshioka, M.; Yamani, Z.H.; Yokoi, T. Conversion of Methanol to Olefins over Al-rich ZSM-5 Modified with Alkaline Earth Metal oxides. Catal. Sci. Technol. 2016, 6, 7852. [Google Scholar] [CrossRef]
- Shamzhy, M.; Opanasenko, M.; Concepción, P.; Martínez, A. New Trends in Tailoring Active Sites in Zeolite-based Catalysts. Chem. Soc. Rev. 2019, 48, 1095. [Google Scholar] [CrossRef]
- Li, G.; Liu, C.; Rohling, R.; Hensen, E.J.M.; Pidko, E.A. Lewis Acid Catalysis by Zeolites. In Modelling and Simulation in the Science of Micro- and Meso-Porous Materials; Richard, C., Catlow, A., Van Speybroeck, V., van Santen, R.A., Eds.; Elsevier: Amsterdam, The Netherlands, 2018; pp. 229–263. [Google Scholar]
- Almutairi, S.M.T. The Role of Lewis and Brønsted Acidity for Alkane Activation OVER Zeolites. Ph.D. Thesis, Eindhoven University of Technology, Eindhoven, The Netherlands, 2013. [Google Scholar]
- Areán, C.O.; Palomino, G.T.; Geobaldo, F.; Zecchina, A. Characterization of Gallosilicate MFI-Type Zeolites by IR Spectroscopy of Adsorbed Probe Molecules. J. Phys. Chem. 1996, 100, 6678–6690. [Google Scholar] [CrossRef]
- Krannila, H.; Haag, W.O.; Gates, B.C. Monomolecular and Bimolecular Mechanisms of Paraffin Cracking: N-butane Cracking Catalyzed by HZSM-5. J. Catal. 1992, 135, 115–124. [Google Scholar] [CrossRef]
- Corma, A.; Orchillés, A.V. Current Views on the Mechanism of Catalytic Cracking. Micropor. Mesopor. Mater. 2000, 35, 21–30. [Google Scholar] [CrossRef]
- Ndlela, S.S.; Friedrich, H.B.; Cele, M.N. Effects of modifying acidity and reducibility on the activity of NaY zeolite in the oxidative dehydrogenation of n-octane. Catalysts 2020, 10, 363. [Google Scholar] [CrossRef] [Green Version]
- Zeng, Y.; Walker, H.; Zhu, Q. Reduction of Nitrate by NaY Zeolite Supported Fe, Cu/Fe and Mn/Fe Nanoparticles. J. Hazard. Mater. 2016, 324, 605–616. [Google Scholar] [CrossRef] [PubMed]
- Li, S.; Li, J.; Dong, M.; Fan, S.; Zhao, T.; Wang, J.; Fan, W. Strategies to control Zeolite Particle Morphology. Chem. Soc. Rev. 2019, 48, 885–907. [Google Scholar] [CrossRef] [PubMed]
- Suresh, S.; Teja, K.R.; Chand, S. Catalytic Wet Peroxide Oxidation of Azo Dye (Acid Orange 7) Using NaY Zeolite from Coal Fly Ash. Int. J. Environ. Waste Manag. 2014, 14, 338–357. [Google Scholar] [CrossRef]
- Zhao, J.; Yin, Y.; Li, Y.; Chen, W.; Liu, B. Synthesis and Characterization of Mesoporous Zeolite Y by Using Block Copolymers as Templates. Chem. Eng. J. 2016, 284, 405–411. [Google Scholar] [CrossRef]
- Pal, N.; Pramanik, M.; Bhaumik, A.; Ali, M. Highly Selective and Direct Oxidation of Cyclohexane to Cyclohexanone over Vanadium Exchanged NaY at Room Temperature under Solvent-free Conditions. J. Mol. Catal. A Chem. 2014, 392, 299–307. [Google Scholar] [CrossRef]
- Lercher, J.A.; Gründling, C.; Eder-Mirth, G. Infra-red Studies of The Surface Acidity of Oxides and Zeolites using Adsorbed Probe Molecular. Catal. Today 1996, 27, 353–376. [Google Scholar] [CrossRef] [Green Version]
- Cele, M.N.; Friedrich, H.B.; Bala, M.D. A Study of Fe(III)TPPCl Encapsulated in Zeolite NaY and Fe(III)NaY in The Oxidation of n-octane, Cyclohexane, 1-octene and 4-octene. Reac. Kinet. Mech. Catal. 2014, 111, 737–750. [Google Scholar] [CrossRef]
- Mu, L.; Feng, W.; Zhang, H.; Hu, X.; Cui, Q. Synthesis and Catalytic Performance of a Small Crystal NaY Zeolite with High SiO2/Al2O3 Ratio. RSC Adv. 2019, 9, 20528. [Google Scholar] [CrossRef] [Green Version]
- Shao, C.; Lang, W.; Yan, X.; Guo, Y. Catalytic performance of gallium oxide based-catalysts for the propane dehydrogenation reaction: Effects of support and loading amount. RSC Adv. 2017, 7, 4710–4723. [Google Scholar] [CrossRef] [Green Version]
- El-Malki, M.; van Santen, R.A.; Sachtler, W.M.H. Introduction of Zn, Ga, and Fe into HZSM-5 Cavities by Sublimation: Identification of Acid Sites. J. Phys. Chem. B 1999, 103, 4611–4622. [Google Scholar] [CrossRef]
- Niwa, M.; Katada, N. New Method for the Temperature- Programmed Desorption (TPD) of Ammonia Experiment for Characterization of Zeolite Acidity: A Review. Chem. Rec. 2013, 13, 432–455. [Google Scholar] [CrossRef] [PubMed]
- Loiland, J.; Zhao, Z.; Patel, A.; Hazin, P. Boron-Containing Catalysts for the Oxidative Dehydrogenation of Ethane/Propane Mixtures. Ind. Eng. Chem. Res. 2019, 58, 19818–19824. [Google Scholar] [CrossRef]
- Bish, D.L.; Carey, J.W. Thermal Behavior of Natural Zeolites. Rev. Miner. Geochem. 2001, 45, 403–452. [Google Scholar] [CrossRef]
- Sing, K.S.W.; Everett, D.H.; Haul, R.A.W.; Moscou, L.; Pierotti, R.A.; Rouquérol, J.; Siemieniewska, T. Reporting Physisorption Data for Gas/Solid Systems with Special Reference to The Determination of Surface Area and Porosity (Recommendations 1984). Pure Appl. Chem. 1985, 57, 603–619. [Google Scholar] [CrossRef]
- Rutkowska, M.; Chmielarz, L.; Jabłońska, M.; Van Oers, C.J.; Cool, P. Iron Exchanged ZSM-5 and Y Zeolites Calcined at Different Temperatures: Activity in N2O Decomposition. J. Porous Mater. 2014, 21, 91–98. [Google Scholar] [CrossRef]
- Lu, J.; Zhao, Z.; Xu, C.; Duan, A.; Zhang, P. Effects of Calcination Temperature on the Acidity and Catalytic Performances of HZSM-5 Zeolite Catalysts for the Catalytic Cracking of n-Butane. J. Nat. Gas Chem. 2005, 14, 213–220. [Google Scholar]
- Huang, Y.; Wan, K.; Dong, D.; Li, D.; Hill, M.R.; Hill, A.J.; Wang, H. Synthesis of Hierarchical Porous Zeolite NaY Particles with Controllable Particle Sizes. Micropor. Mesopor. Mater. 2010, 127, 167–175. [Google Scholar] [CrossRef]
- Elkhalifa, E.A.; Friedrich, H.B. Effects of Boron and Barium Dopants on VMgO Catalysts Employed in the Oxidative Dehydrogenation of n-octane. Kinet. Catal. 2015, 56, 212–221. [Google Scholar] [CrossRef]
Figure 1.
FT-IR spectra of the O-H region of Ga-BaY(IS) calcined at (A) 250 °C, (B) 550 °C, (C) 750 °C.
Figure 1.
FT-IR spectra of the O-H region of Ga-BaY(IS) calcined at (A) 250 °C, (B) 550 °C, (C) 750 °C.

Figure 2.
FT-IR spectra of the O–H region of Ga-BaY(Sil) calcined at (A) 250 °C, (B) 550 °C, (C) 750 °C.
Figure 2.
FT-IR spectra of the O–H region of Ga-BaY(Sil) calcined at (A) 250 °C, (B) 550 °C, (C) 750 °C.

Figure 3.
SEM micrographs of (A) Ga-BaY(Sil), (B) Ga-BaY(IS).

Figure 4.
Pyridine-IR spectra of Ga-BaY(IS) calcined at (A) 250 °C, (B) 550 °C, (C) 750 °C.

Figure 5.
Pyridine-IR spectra of Ga-BaY(Sil) calcined at (A) 250 °C, (B) 550 °C, (C) 750 °C.

Figure 6.
Thermogravimetric analysis curves of (A) Ga-BaY(Sil) and (B) Ga-BaY(IS) calcined at different temperatures.
Figure 6.
Thermogravimetric analysis curves of (A) Ga-BaY(Sil) and (B) Ga-BaY(IS) calcined at different temperatures.

Figure 7.
Conversion and cracked products selectivity of Ga-BaY(IS) and Ga-BaY(Sil) calcined at different temperatures.
Figure 7.
Conversion and cracked products selectivity of Ga-BaY(IS) and Ga-BaY(Sil) calcined at different temperatures.

Figure 8.
Octene selectivity of Ga-BaY(IS) and Ga-BaY(Sil) calcined at different temperatures.

Figure 9.
COx selectivity of Ga-BaY(IS) and Ga-BaY(Sil) calcined at different temperatures.


Table 1.
Acid properties of zeolites calcined at different temperatures studied by NH3-temperature-programmed desorption (TPD).
Table 1.
Acid properties of zeolites calcined at different temperatures studied by NH3-temperature-programmed desorption (TPD).
| Acidity Amount (µmol g−1) | ||||
|---|---|---|---|---|
| Catalyst | W (100–200 °C) | M (200–400 °C) | S (400–600 °C) | Total Acidity |
| Ga-BaY(IS)-550 | 2.5 | 0.6 | 2.4 | 5.5 |
| Ga-BaY(IS)-750 | 0.7 | 1.5 | 3.8 | 6.0 |
| Ga-BaY(Sil)-550 | 1.0 | 0 | 1.1 | 2.1 |
| Ga-BaY(Sil)-750 | 0.7 | 1.1 | 1.6 | 3.4 |
Table 2.
Surface properties of Ga-BaY(IS) and Ga-BaY(Sil) calcined at different temperatures.
| Catalysts | BET (m2/g) | Pore Volume (cm3/g) | Pore Size (nm) |
|---|---|---|---|
| Ga-BaY(IS)-250 | 734 | 0.33 | 17 |
| Ga-BaY(IS)-750 | 709 | 0.32 | 18 |
| Ga-BaY(Sil)-250 | 492 | 0.22 | 18 |
| Ga-BaY(Sil)-750 | 472 | 0.21 | 19 |
Table 3.
Cracked products distribution over Ga-BaY(IS) and Ga-BaY(Sil) calcined at different temperatures.
Table 3.
Cracked products distribution over Ga-BaY(IS) and Ga-BaY(Sil) calcined at different temperatures.
| Catalysts | %Alkanes | %Alkenes |
|---|---|---|
| Ga-BaY(IS)-250 | 11 | 89 |
| Ga-BaY(IS)-550 | 3.0 | 97 |
| Ga-BaY(IS)-750 | 100 | |
| Ga-BaY(Sil)-250 | 6 | 94 |
| Ga-BaY(Sil)-550 | 1.0 | 99 |
| Ga-BaY(Sil)-750 | 100 |
© 2020 by the authors. Licensee MDPI, Basel, Switzerland. This article is an open access article distributed under the terms and conditions of the Creative Commons Attribution (CC BY) license (http://creativecommons.org/licenses/by/4.0/).
Share and Cite
MDPI and ACS Style
Ndlela, S.S.; Friedrich, H.B.; Cele, M.N. Effects of Framework Disruption of Ga and Ba Containing Zeolitic Materials by Thermal Treatment. Catalysts 2020, 10, 975. https://doi.org/10.3390/catal10090975
AMA Style
Ndlela SS, Friedrich HB, Cele MN. Effects of Framework Disruption of Ga and Ba Containing Zeolitic Materials by Thermal Treatment. Catalysts. 2020; 10(9):975. https://doi.org/10.3390/catal10090975
Chicago/Turabian StyleNdlela, Siyabonga S., Holger B. Friedrich, and Mduduzi N. Cele. 2020. "Effects of Framework Disruption of Ga and Ba Containing Zeolitic Materials by Thermal Treatment" Catalysts 10, no. 9: 975. https://doi.org/10.3390/catal10090975
Note that from the first issue of 2016, this journal uses article numbers instead of page numbers. See further details here.