Catalytic Decolorization of Rhodamine B, Congo Red, and Crystal Violet Dyes, with a Novel Niobium Oxide Anchored Molybdenum (Nb–O–Mo)

 ,
,
Abstract
:1. Introduction
2. Result and Discussion
3. Experimental
3.1. Materials and Chemicals
3.2. Preparation of the Catalyst
3.3. Experimental Procedure for Oxidative Decolorization of Rh B, Congo Red, and Crystal Violet
3.4. Characterization
4. Conclusions
Supplementary Materials
Author Contributions
Funding
Acknowledgments
Conflicts of Interest
References
- Banazadeh, A.; Salimi, H.; Khaleghi, M.; Shafiei-Haghighi, S. Highly efficient decolorization of hazardous dyes in aqueous phase by supported palladium nanocatalyst—A green approach. J. Environ. Chem. Eng. 2016, 4, 2178–2186. [Google Scholar] [CrossRef]
- Ameen, S.; Park, D.-R.; Shin, H.S. Silicon nanowires arrays for visible light driven photocatalytic decolorization of rose bengal dye. J. Mater. Sci. Mater. Electron. 2016, 27, 10460–10467. [Google Scholar] [CrossRef]
- Guo, C.; Xu, J.; He, Y.; Zhang, Y.; Wang, Y. Photodecolorization of rhodamine B and methyl orange over one-dimensional TiO2 catalysts under simulated solar irradiation. Appl. Surf. Sci. 2011, 257, 3798–3803. [Google Scholar] [CrossRef]
- Richardson, S.D.; Willson, C.S.; Rusch, K.A. Use of rhodamine water tracer in the marshland upwelling system. Groundwater 2004, 42, 678–688. [Google Scholar] [CrossRef]
- Liu, X.; Li, W.; Chen, N.; Xing, X.; Dong, C.; Wang, Y. Ag–ZnO heterostructure nanoparticles with plasmon-enhanced catalytic decolorization for Congo red under visible light. RSC Adv. 2015, 5, 34456–34465. [Google Scholar] [CrossRef]
- Singh, K.P.; Gupta, S.; Singh, A.K.; Sinha, S. Optimizing adsorption of crystal violet dye from water by magnetic nanocomposite using response surface modeling approach. J. Hazard. Mater. 2011, 186, 1462–1473. [Google Scholar] [CrossRef]
- Li, S. Removal of crystal violet from aqueous solution by sorption into semi-interpenetrated networks hydrogels constituted of poly (acrylic acid-acrylamide-methacrylate) and amylose. Bioresour. Technol. 2010, 101, 2197–2202. [Google Scholar] [CrossRef]
- Ghosh, D.; Bhattacharyya, K.G. Adsorption of methylene blue on kaolinite. Appl. Clay Sci. 2002, 20, 295–300. [Google Scholar] [CrossRef]
- Zaied, M.; Chutet, E.; Peulon, S.; Bellakhal, N.; Desmazières, B.; Dachraoui, M.; Chaussé, A. Spontaneous oxidative decolorization of indigo carmine by thin films of birnessite electrodeposited onto SnO2. Appl. Cataly. B Environmen. 2011, 107, 42–51. [Google Scholar] [CrossRef]
- Sharma, S.K. Green Chemistry for Dyes Removal from Waste Water: Research Trends and Applications; John Wiley & Sons: Hoboken, NJ, USA, 2015. [Google Scholar]
- Akpan, U.G.; Hameed, B.H. Parameters affecting the photocatalytic decolorization of dyes using TiO2-based photocatalysts: A review. J. Hazard. Mater. 2009, 170, 520–529. [Google Scholar] [CrossRef]
- Guo, J.; Yuan, S.; Jiang, W.; Yue, H.; Cui, Z.; Liang, B. Adsorption and photocatalytic decolorization behaviors of rhodamine dyes on surface-fluorinated TiO2 under visible irradiation. RSC Adv. 2016, 6, 4090–4100. [Google Scholar] [CrossRef]
- Zhang, J.; Song, Y.; Lu, F.; Fei, W.; Mengqiong, Y.; Genxiang, L.; Qian, X.; Xiang, W.; Can, L. Photocatalytic decolorization of rhodamine B on anatase, rutile, and brookite TiO2. Chin. J. Catal. 2011, 32, 983–991. [Google Scholar] [CrossRef]
- Hu, Y.; Li, D.; Wang, H.; Zeng, G.; Li, X.; Shao, Y. Role of active oxygen species in the liquid-phase photocatalytic decolorization of RhB using BiVO4/TiO2 heterostructure under visible light irradiation. J. Mol. Catal. A Chem. 2015, 408, 172–178. [Google Scholar] [CrossRef]
- Hadnadjev-Kostic, M.; Vulic, T.; Marinkovic-Neducin, R. Solar light induced rhodamine B decolorization assisted by TiO2–Zn–Al LDH based photocatalysts. Adv. Powder Technol. 2014, 25, 1624–1633. [Google Scholar] [CrossRef]
- Shi, L.; Liang, L.; Ma, J.; Meng, Y.; Zhong, S.; Wang, F.; Sun, J. Highly efficient visible light-driven Ag/AgBr/ZnO composite photocatalyst for degrading Rhodamine B. Ceram. Int. 2014, 40, 3495–3502. [Google Scholar] [CrossRef]
- Yang, J.; Sun, X.; Yang, W.; Zhu, M.; Shi, J. The Improvement of Coralline-Like ZnGa2O4 by Cocatalysts for the Photocatalytic Decolorization of Rhodamine B. Catalysts 2020, 10, 221. [Google Scholar] [CrossRef] [Green Version]
- Tian, J.; Shao, Q.; Zhao, J.; Pan, D.; Dong, M.; Jia, C.; Ding, T.; Wu, T.; Guo, Z. Microwave solvothermal carboxymethyl chitosan templated synthesis of TiO2/ZrO2 composites toward enhanced photocatalytic decolorization of Rhodamine B. J. Colloid Interface Sci. 2019, 541, 18–29. [Google Scholar] [CrossRef]
- Pica, M.; Calzuola, S.; Donnadio, A.; Gentili, P.L.; Nocchetti, M.; Casciola, M. De-ethylation and cleavage of rhodamine B by a zirconium phosphate/silver bromide composite photocatalyst. Catalysts 2019, 9, 3. [Google Scholar] [CrossRef] [Green Version]
- Hou, X.; Shen, W.; Huang, X.; Ai, Z.; Zhang, L. Ascorbic acid enhanced activation of oxygen by ferrous iron: A case of aerobic decolorization of rhodamine B. J. Hazard. Mater. 2016, 308, 67–74. [Google Scholar] [CrossRef] [Green Version]
- Prihod’ko, R.; Stolyarova, I.; Gündüz, G.; Taran, O.; Yashnik, S.; Parmon, V.; Goncharuk, V. Fe-exchanged zeolites as materials for catalytic wet peroxide oxidation. Decolorization of Rodamine G dye. Appl. Catal. B Environ. 2011, 104, 201–210. [Google Scholar] [CrossRef]
- Song, Y.; Zhao, S.; Tchounwou, P.; Liu, Y.-M. A nanoparticle-based solid-phase extraction method for liquid chromatography–electrospray ionization-tandem mass spectrometric analysis. J. Chromatogr. A 2007, 1166, 79–84. [Google Scholar] [CrossRef] [PubMed] [Green Version]
- Merka, O.; Yarovyi, V.; Bahnemann, D.W.; Wark, M. pH-control of the photocatalytic decolorization mechanism of rhodamine B over Pb3Nb4O13. J. Phys. Chem. C 2011, 115, 8014–8023. [Google Scholar] [CrossRef]
- Lin, C.; Lin, K.-S. Photocatalytic oxidation of toxic organohalides with TiO2/UV: The effects of humic substances and organic mixtures. Chemosphere 2007, 66, 1872–1877. [Google Scholar] [CrossRef] [PubMed]
- Rasalingam, S.; Wu, C.-M.; Koodali, R.T. Modulation of pore sizes of titanium dioxide photocatalysts by a facile template free hydrothermal synthesis method: Implications for photocatalytic decolorization of rhodamine B. Appl. Mater. Interfaces 2015, 7, 4368–4380. [Google Scholar] [CrossRef] [PubMed]
- Asahi, R.; Morikawa, T.; Ohwaki, T.; Aoki, K.; Taga, Y. Visible-light photocatalysis in nitrogen-doped titanium oxides. Science 2001, 293, 269–271. [Google Scholar] [CrossRef]
- Sakthivel, S.; Kisch, H. Daylight photocatalysis by carbon-modified titanium dioxide. Angew. Chem. Int. Ed. 2003, 42, 4908–4911. [Google Scholar] [CrossRef] [PubMed]
- Yu, J.C.; Ho, W.; Yu, J.; Yip, H.; Wong, P.K.; Zhao, J. Efficient visible-light-induced photocatalytic disinfection on sulfur-doped nanocrystalline titania. Environ. Sci. Technol. 2005, 39, 1175–1179. [Google Scholar] [CrossRef]
- Irie, H.; Maruyama, Y.; Hashimoto, K. Ag+-and Pb2+-doped SrTiO3 photocatalysts. A correlation between band structure and photocatalytic activity. J. Phys. Chem. C 2007, 111, 1847–1852. [Google Scholar] [CrossRef]
- Shim, W.G.; Lee, J.W.; Moon, H. Adsorption equilibrium and column dynamics of VOCs on MCM-48 depending on pelletizing pressure. Microporous Mesoporous Mater. 2006, 88, 112–125. [Google Scholar] [CrossRef]
- Krbal, M.; Ng, S.; Motola, M.; Hromadko, L.; Dvorak, F.; Prokop, V.; Sopha, H.; Macak, J.M. Sulfur treated 1D anodic TiO2 nanotube layers for significant photo-and electroactivity enhancement. Appl. Mater. Today 2019, 17, 104–111. [Google Scholar] [CrossRef]
- Motola, M.; Dworniczek, E.; Satrapinskyy, L.; Chodaczek, G.; Grzesiak, J.; Gregor, M.; Plecenik, T.; Nowicka, J.; Plesch, G. UV light-induced photocatalytic, antimicrobial, and antibiofilm performance of anodic TiO2 nanotube layers prepared on titanium mesh and Ti sputtered on silicon. Chem. Pap. 2019, 73, 1163–1172. [Google Scholar] [CrossRef]
- Zhao, T.; Hou, C.; Zhang, H.; Zhu, R.; She, S.; Wang, J.; Li, T.; Liu, Z.; Wei, B. Electromagnetic wave absorbing properties of amorphous carbon nanotubes. Sci. Rep. 2014, 4, 5619. [Google Scholar] [CrossRef] [PubMed] [Green Version]
- Lopes, O.F.; Paris, E.C.; Ribeiro, C. Synthesis of Nb2O5 nanoparticles through the oxidant peroxide method applied to organic pollutant photodecolorization: A mechanistic study. Appl. Catal. B Environ. 2014, 144, 800–808. [Google Scholar] [CrossRef]
- Zarei-Chaleshtori, M.; Hosseini, M.; Edalatpour, R.; Masud, S.S.; Chianelli, R.R. Photocatalytic decontamination of wastewater with porous material HNb3O8. Microchem. J. 2013, 110, 361–368. [Google Scholar] [CrossRef]
- Oliveira, L.; Gonçalves, M.; Guerreiro, M.; Ramalho, T.; Fabris, J.; Pereira, M.; Sapag, K. A new catalyst material based on niobia/iron oxide composite on the oxidation of organic contaminants in water via heterogeneous Fenton mechanisms. Appl. Catal. A Gen. 2007, 316, 117–124. [Google Scholar] [CrossRef]
- Rooke, J.C.; Barakat, T.; Brunet, J.; Li, Y.; Finol, M.F.; Lamonier, J.-F.; Giraudon, J.-M.; Cousin, R.; Siffert, S.; Su, B.L. Hierarchically nanostructured porous group Vb metal oxides from alkoxide precursors and their role in the catalytic remediation of VOCs. Appl. Catal. B Environ. 2015, 162, 300–309. [Google Scholar] [CrossRef]
- Lin, W.; Frei, H. Anchored metal-to-metal charge-transfer chromophores in a mesoporous silicate sieve for visible-light activation of titanium centers. J. Phy. Chem. B 2005, 109, 4929–4935. [Google Scholar] [CrossRef]
- Nakamura, R.; Okamoto, A.; Osawa, H.; Irie, H.; Hashimoto, K. Design of all-inorganic molecular-based photocatalysts sensitive to visible light: Ti (IV)− O− Ce (III) bimetallic assemblies on mesoporous silica. J. Am. Chem. Soc. 2007, 129, 9596–9597. [Google Scholar] [CrossRef]
- Bock, C.; Halvorsen, H.; MacDougall, B. Catalyst synthesis techniques. In PEM Fuel Cell Electrocatalysts and Catalyst Layers; Springer: Berlin/Heidelberg, Germany, 2008; pp. 447–485. [Google Scholar]
- Munnik, P.; de Jongh, P.E.; de Jong, K.P. Recent developments in the synthesis of supported catalysts. Chem. Rev. 2015, 115, 6687–6718. [Google Scholar] [CrossRef]
- Kim, W.; Yuan, G.; McClure, B.A.; Frei, H. Light induced carbon dioxide reduction by water at binuclear ZrOCoII unit coupled to Ir oxide nanocluster catalyst. J. Am. Chem. Soc. 2014, 136, 11034–11042. [Google Scholar] [CrossRef]
- Wu, J.; Li, J.; Liu, J.; Bai, J.; Yang, L. A novel Nb2O5/Bi2WO6 heterojunction photocatalytic oxidative desulfurization catalyst with high visible light-induced photocatalytic activity. RSC Adv. 2017, 7, 51046–51054. [Google Scholar] [CrossRef] [Green Version]
- Moradi, H.; Eshaghi, A.; Hosseini, S.R.; Ghani, K. Fabrication of Fe-doped TiO2 nanoparticles and investigation of photocatalytic decolorization of reactive red 198 under visible light irradiation. Ultrason. Sonochem. 2016, 32, 314–319. [Google Scholar] [CrossRef] [PubMed]
- Kim, J.-M.; Jung, Y.-H.; Kwak, J.-Y.; Kim, Y.-I. Synthesis and Characterization of Nb, Mo-doped and Nb/Mo-codoped Monoclinic VO2 Nanoparticles and Their Thin Films by Hydrothermal/Post-Thermal Transformation and Wet-Coating Method. J. Korean Chem. Soc. 2019, 63, 94–101. [Google Scholar]
- Gaikwad, S.; Han, S. A microwave method for the rapid crystallization of UTSA-16 with improved performance for CO2 capture. Chem. Eng. J. 2019, 371, 813–820. [Google Scholar] [CrossRef]
- Meshesha, D.S.; Matangi, R.C.; Tirukkovalluri, S.R.; Bojja, S. Synthesis, characterization and visible light photocatalytic activity of Mg2+ and Zr4+ co-doped TiO2 nanomaterial for decolorization of methylene blue. J. Asian Ceram. Soc. 2017, 5, 136–143. [Google Scholar] [CrossRef] [Green Version]
- Morais, L.A.; Adán, C.; Araujo, A.S.; Guedes, A.P.; Marugán, J. Photocatalytic Activity of Suspended and Immobilized Niobium Oxide for Methanol Oxidation and Escherichia coli Inactivation. J. Adv. Oxid. Technol. 2016, 19, 256–265. [Google Scholar] [CrossRef]
- Zhang, H.; Lin, Q.; Ning, S.; Zhou, Y.; Lin, H.; Long, J.; Zhang, Z.; Wang, X. One-step synthesis of mesoporous Pt–Nb2O5 nanocomposites with enhanced photocatalytic hydrogen production activity. RSC Adv. 2016, 6, 96809–96815. [Google Scholar] [CrossRef]
- Da Conceição, L.R.V.; Carneiro, L.M.; Rivaldi, J.D.; de Castro, H.F. Solid acid as catalyst for biodiesel production via simultaneous esterification and transesterification of macaw palm oil. Ind. Crops Prod. 2016, 89, 416–424. [Google Scholar] [CrossRef]
- Chiang, T.H.; Yeh, H.C. The synthesis of α-MoO3 by ethylene glycol. Materials 2013, 6, 4609–4625. [Google Scholar] [CrossRef] [Green Version]
- Varghese, B.; Haur, S.C.; Lim, C.-T. Nb2O5 nanowires as efficient electron field emitters. J. Phy. Chem. C 2008, 112, 10008–10012. [Google Scholar] [CrossRef]
- Brayner, R.; Bozon-Verduraz, F. Niobium pentoxide prepared by soft chemical routes: Morphology, structure, defects and quantum size effect. Phys. Chem. Chem. Phys. 2003, 5, 1457–1466. [Google Scholar] [CrossRef]
- Nakamura, R.; Frei, H. Visible light-driven water oxidation by Ir oxide clusters coupled to single Cr centers in mesoporous silica. J. Am. Chem. Soc. 2006, 128, 10668–10669. [Google Scholar] [CrossRef] [PubMed]
- Yuan, M.; Wang, S.; Wang, X.; Zhao, L.; Hao, T. Removal of organic dye by air and macroporous ZnO/MoO3/SiO2 hybrid under room conditions. Appl. Surf. Sci. 2011, 257, 7913–7919. [Google Scholar] [CrossRef]
- Kim, D.; Kim, G.; Bae, H.; Kim, E.; Moon, B.; Cheon, D.; Tarte, N.H. An External Energy Independent WO3/MoCl5 Nano-Sized Catalyst for the Superior Decolorization of Crystal Violet and Rhodamine B Dye. Catalysts 2019, 9, 642. [Google Scholar] [CrossRef] [Green Version]
- Wang, Y.; Zhu, Y.; Zhao, X.; Yang, X.; Li, X.; Chen, Z.; Yang, L.; Zhu, L.; Gao, T.; Sha, Z. Improving photocatalytic Rhodamine B degrading activity with Pt quantum dots on TiO2 nanotube arrays. Surf. Coat. Technol. 2015, 281, 89–97. [Google Scholar] [CrossRef]
- Abdel-Messih, M.; Ahmed, M.; El-Sayed, A.S. Photocatalytic decolorization of Rhodamine B dye using novel mesoporous SnO2–TiO2 nano mixed oxides prepared by sol–gel method. J. Photochem. Photobiol. A Chem. 2013, 260, 1–8. [Google Scholar] [CrossRef]
- Kuo, T.-J.; Lin, C.-N.; Kuo, C.-L.; Huang, M.H. Growth of ultralong ZnO nanowires on silicon substrates by vapor transport and their use as recyclable photocatalysts. Chem. Mater. 2007, 19, 5143–5147. [Google Scholar] [CrossRef]
- Li, J.; Wen, X.; Zhang, Q.; Ren, S. Adsorption and visible-light photodecolorization of organic dyes with TiO2/conjugated microporous polymer composites. RSC Adv. 2018, 8, 34560–34565. [Google Scholar] [CrossRef] [Green Version]
- Hu, C.; Peng, T.; Hu, X.; Nie, Y.; Zhou, X.; Qu, J.; He, H. Plasmon-induced photodecolorization of toxic pollutants with Ag− AgI/Al2O3 under visible-light irradiation. J. Am. Chem. Soc. 2010, 132, 857–862. [Google Scholar] [CrossRef]
- Ji, P.; Zhang, J.; Chen, F.; Anpo, M. Study of adsorption and decolorization of acid orange 7 on the surface of CeO2 under visible light irradiation. Appl. Catal. B Environ. 2009, 85, 148–154. [Google Scholar] [CrossRef]
- Zhang, C.; Lin, J. Visible-light induced oxo-bridged Zr IV− O− Ce III redox centre in tetragonal ZrO2–CeO2 solid solution for decolorization of organic pollutants. Phys. Chem. Chem. Phys. 2011, 13, 3896–3905. [Google Scholar] [CrossRef] [PubMed]
- Lamdab, U.; Wetchakun, K.; Kangwansupamonkon, W.; Wetchakun, N. Effect of a pH-controlled co-precipitation process on rhodamine B adsorption of MnFe2O4 nanoparticles. RSC Adv. 2018, 8, 6709–6718. [Google Scholar] [CrossRef] [Green Version]
- Xie, T.-H.; Sun, X.; Lin, J. Enhanced photocatalytic decolorization of RhB driven by visible light-induced MMCT of Ti (IV)− O− Fe (II) formed in Fe-doped SrTiO3. J. Phys. Chem. C 2008, 112, 9753–9759. [Google Scholar] [CrossRef]
- Su, S.; Guo, W.; Leng, Y.; Yi, C.; Ma, Z. Heterogeneous activation of Oxone by CoxFe3− xO4 nanocatalysts for decolorization of rhodamine B. J. Hazard. Mater. 2013, 244, 736–742. [Google Scholar] [CrossRef]
- Ai, L.; Zeng, C.; Wang, Q. One-step solvothermal synthesis of Ag-Fe3O4 composite as a magnetically recyclable catalyst for reduction of Rhodamine B. Catal. Commun. 2011, 14, 68–73. [Google Scholar] [CrossRef]
- Yang, X.; Li, R.; Wang, Y.; Wu, K.; Chang, S.; Tang, H. Solvent-induced controllable synthesis of recyclable Ag2CO3 catalysts with enhanced visible light photocatalytic activity. Ceram. Int. 2016, 42, 13411–13420. [Google Scholar] [CrossRef]
- Duraimurugan, J.; Shanavas, S.; Ramesh, R.; Acevedo, R.; Anbarasan, P.; Maadeswaran, P. Hydrothermal assisted phytofabrication of zinc oxide nanoparticles with different nanoscale characteristics for the photocatlytic decolorization of Rhodamine B. Optik 2020, 202, 163607. [Google Scholar]
- Zhang, J.; Zhang, Z.; Zhu, W.; Meng, X. Boosted photocatalytic decolorization of Rhodamine B pollutants with Z-scheme CdS/AgBr-rGO nanocomposite. Appl. Surf. Sci. 2020, 502, 144275. [Google Scholar] [CrossRef]
- Huang, H.; He, M.; Yang, X.; Tian, Z.; Hu, J.; Wen, B. One-pot hydrothermal synthesis of TiO2/RCN heterojunction photocatalyst for production of hydrogen and rhodamine B decolorization. Appl. Surf. Sci. 2019, 493, 202–211. [Google Scholar] [CrossRef]
- Das, M.; Bhattacharyya, K.G. Oxidation of Rhodamine B in aqueous medium in ambient conditions with raw and acid-activated MnO2, NiO, ZnO as catalysts. J. Mol. Catal. A Chem. 2014, 391, 121–129. [Google Scholar] [CrossRef]


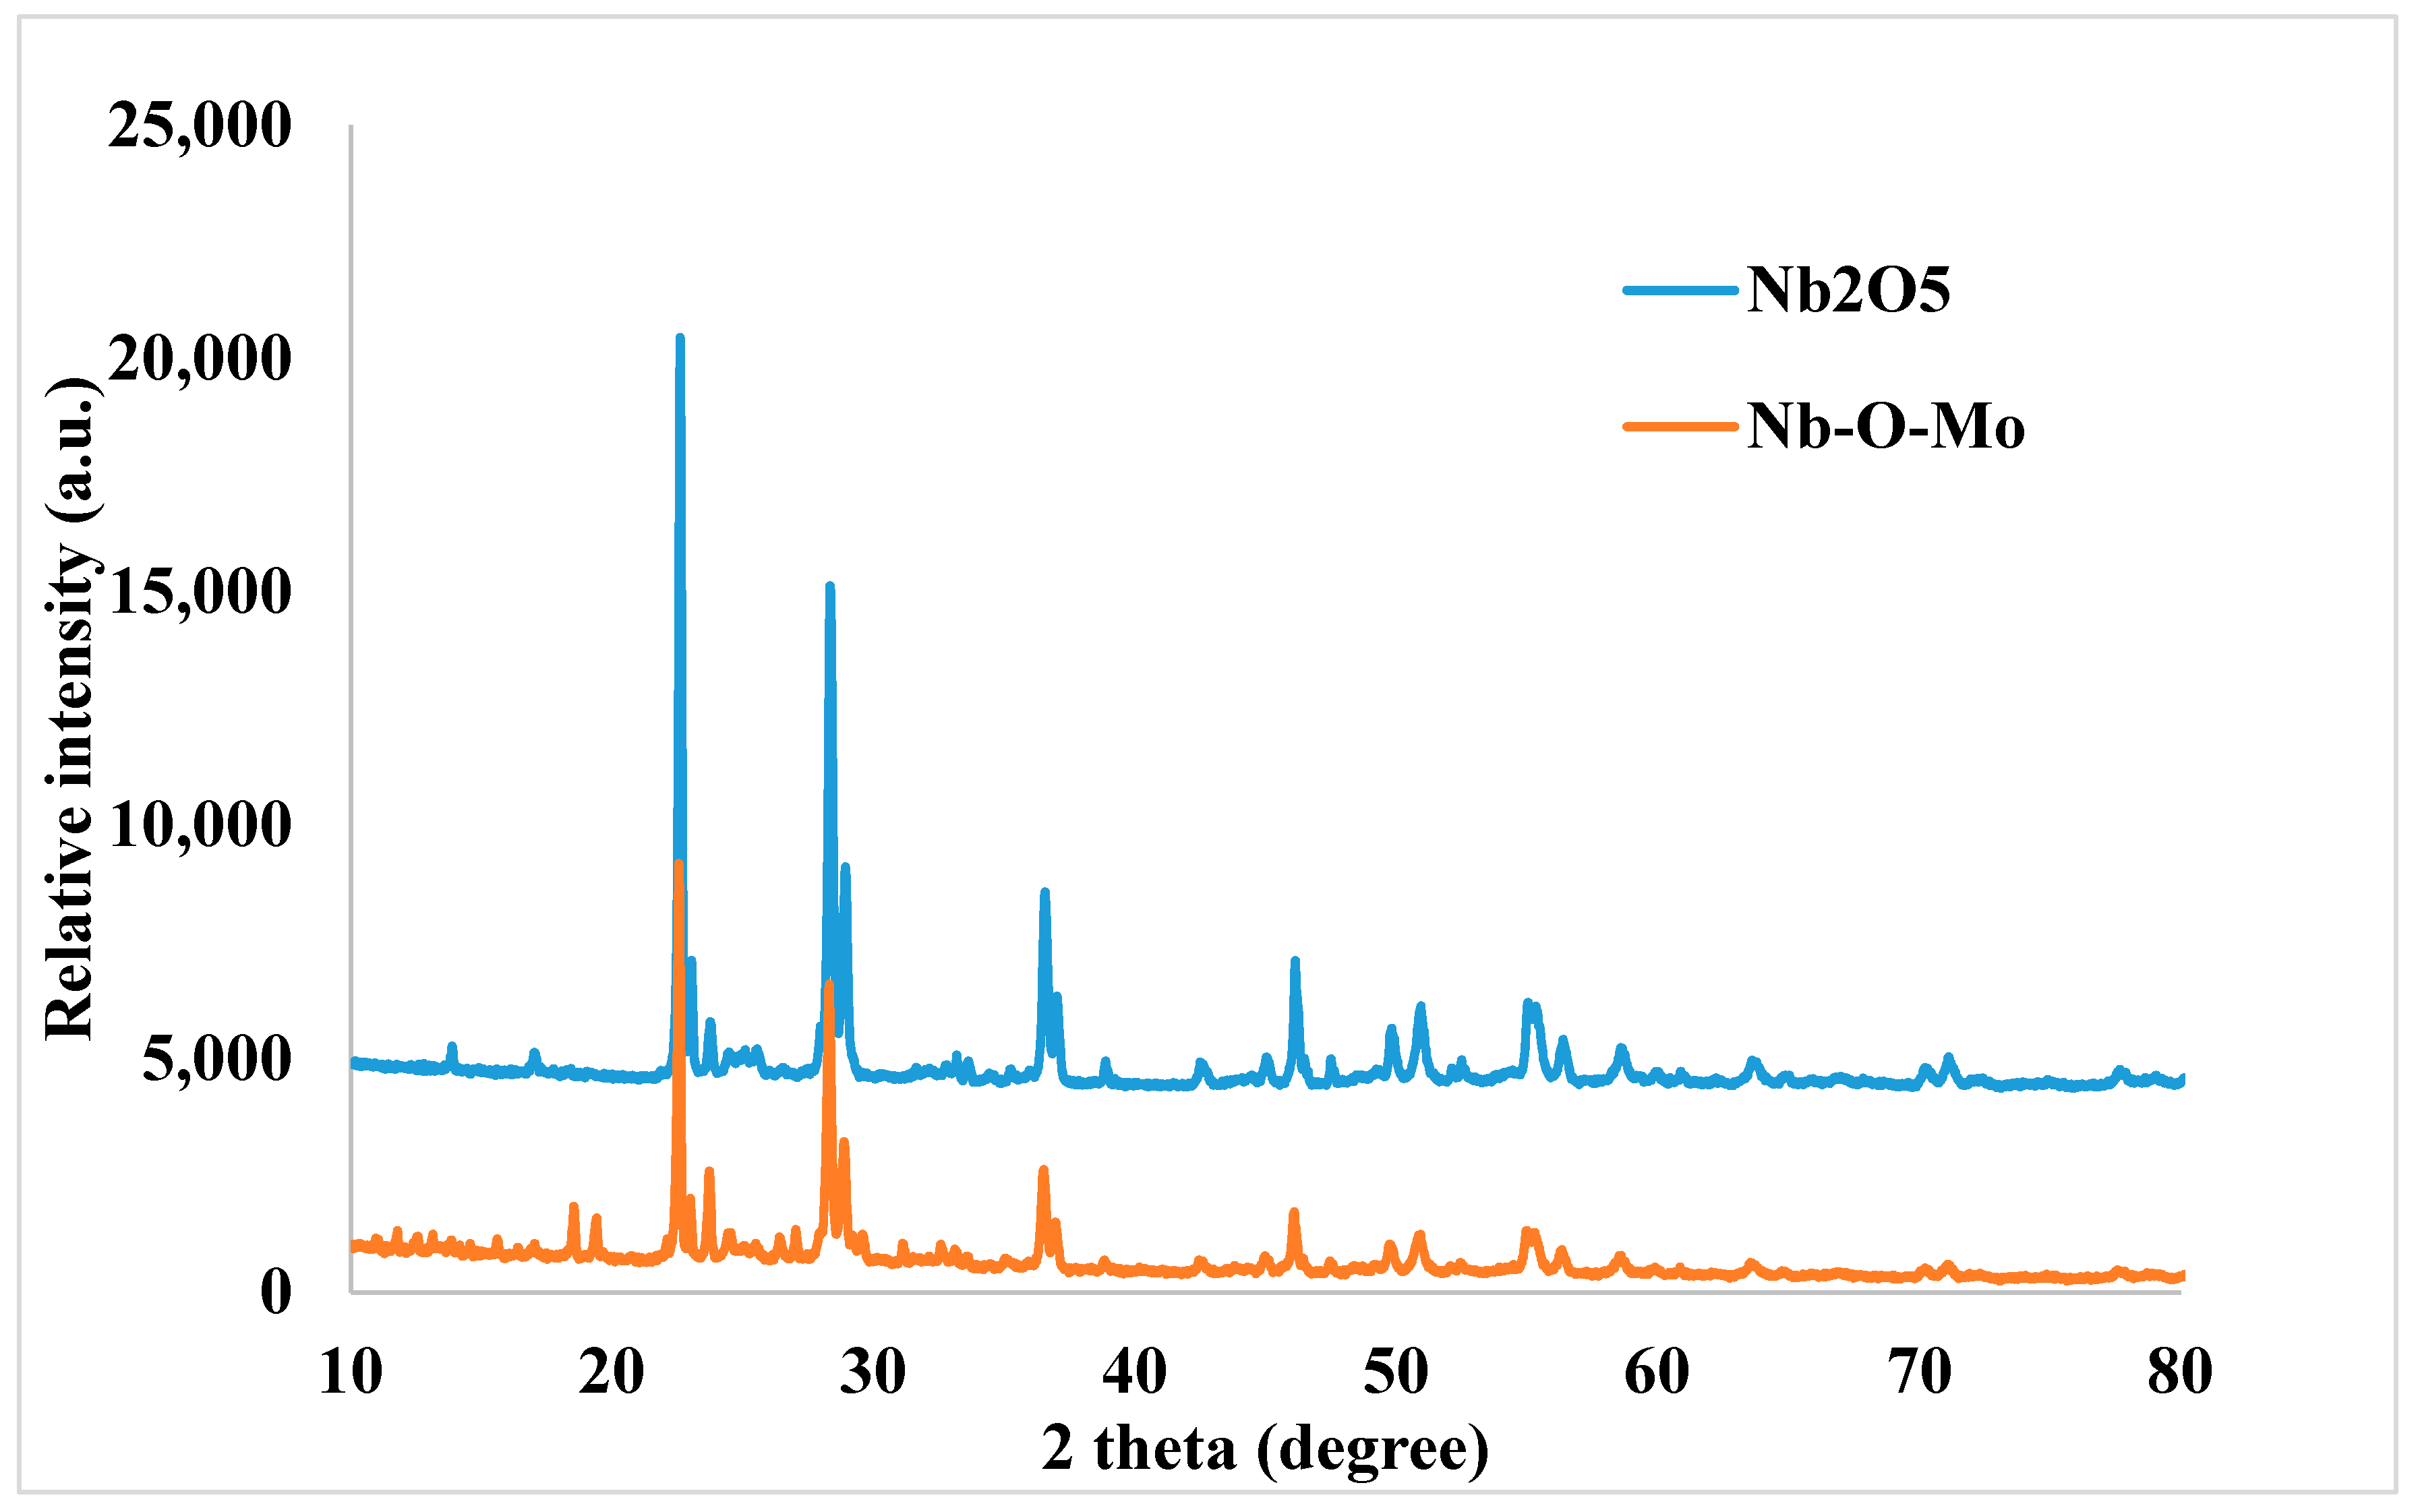
| Angle (2 Ɵ) | Intensity | |
|---|---|---|
| Nb2O5 | Nb–O–Mo | |
| 22.59 | 16,452 | 9156 |
| 28.36 | 11,108 | 6451 |
| 36.58 | 4470 | 2577 |
| 46.14 | 3107 | 1682 |
| 49.90 | 1468 | 965 |
| 50.98 | 1949 | 1222 |
| 55.43 | 2045 | 1258 |
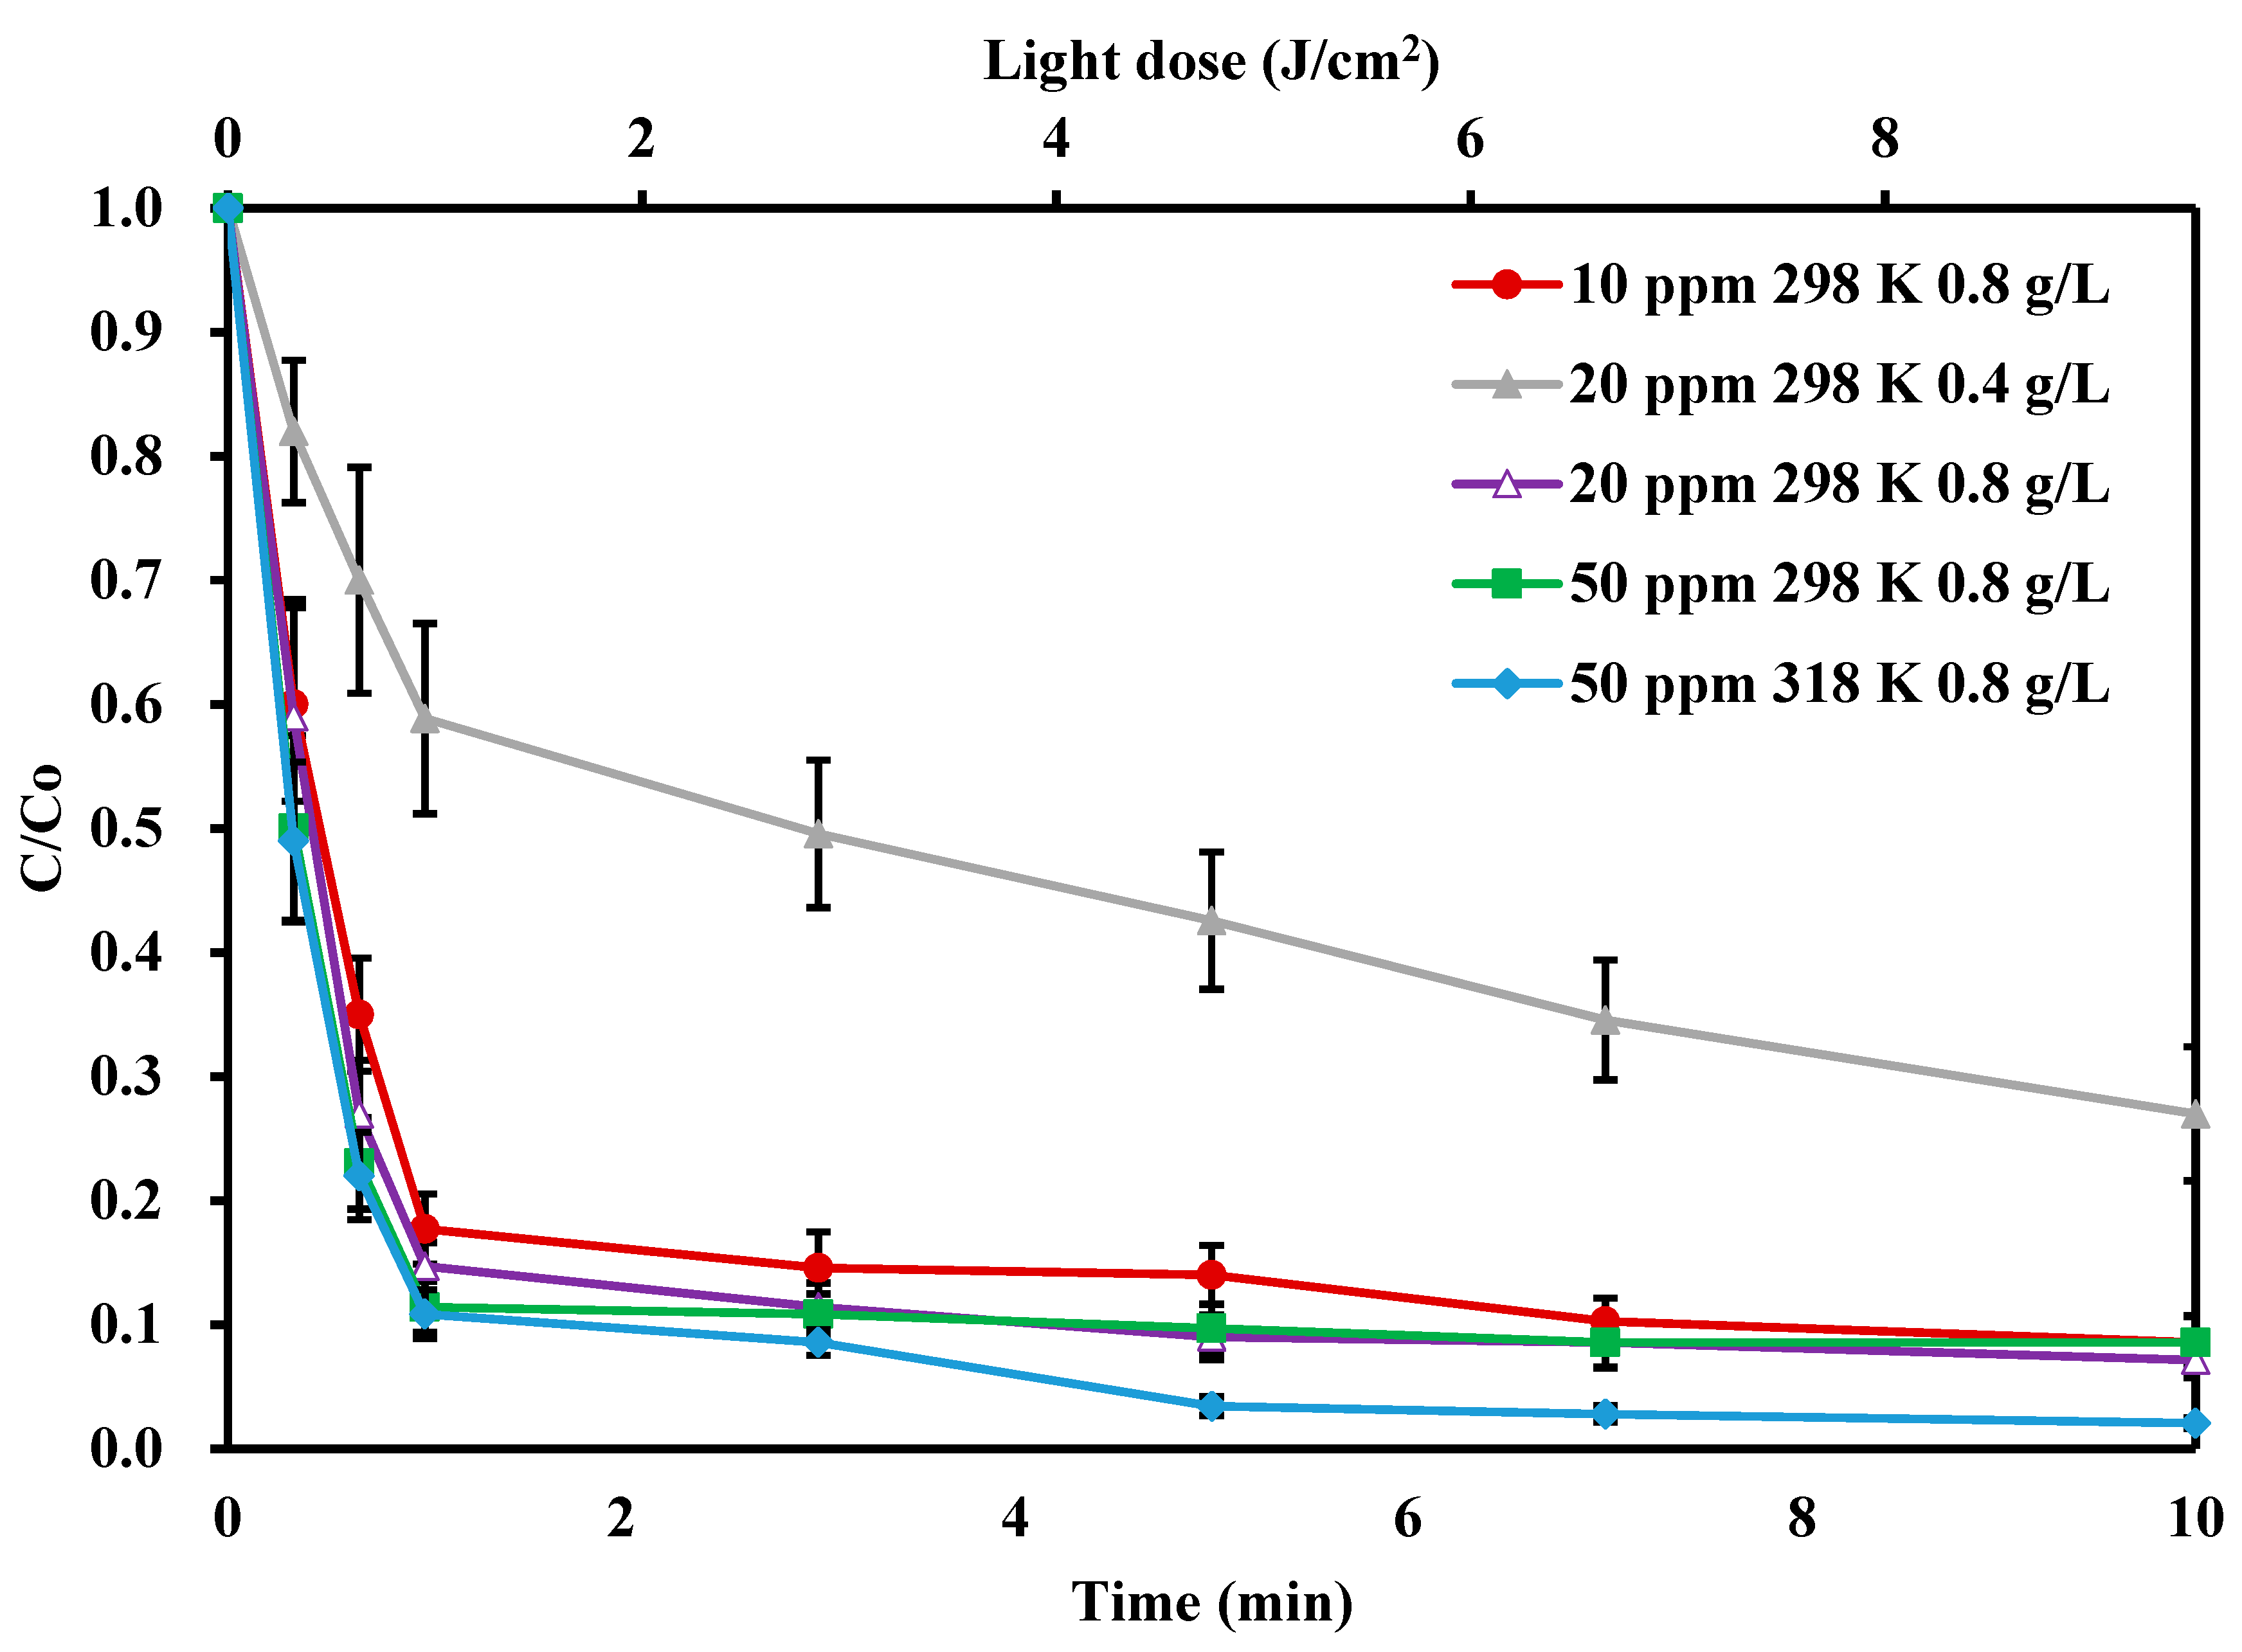
| Dye Concentration | R2 | k [min−1] |
|---|---|---|
| Rh B 20 ppm 298 K | 0.9948 | 1.944 |
| Rh B 50 ppm 298 K | 0.9995 | 2.220 |
| Rh B 50 ppm 318 K | 0.9993 | 2.226 |
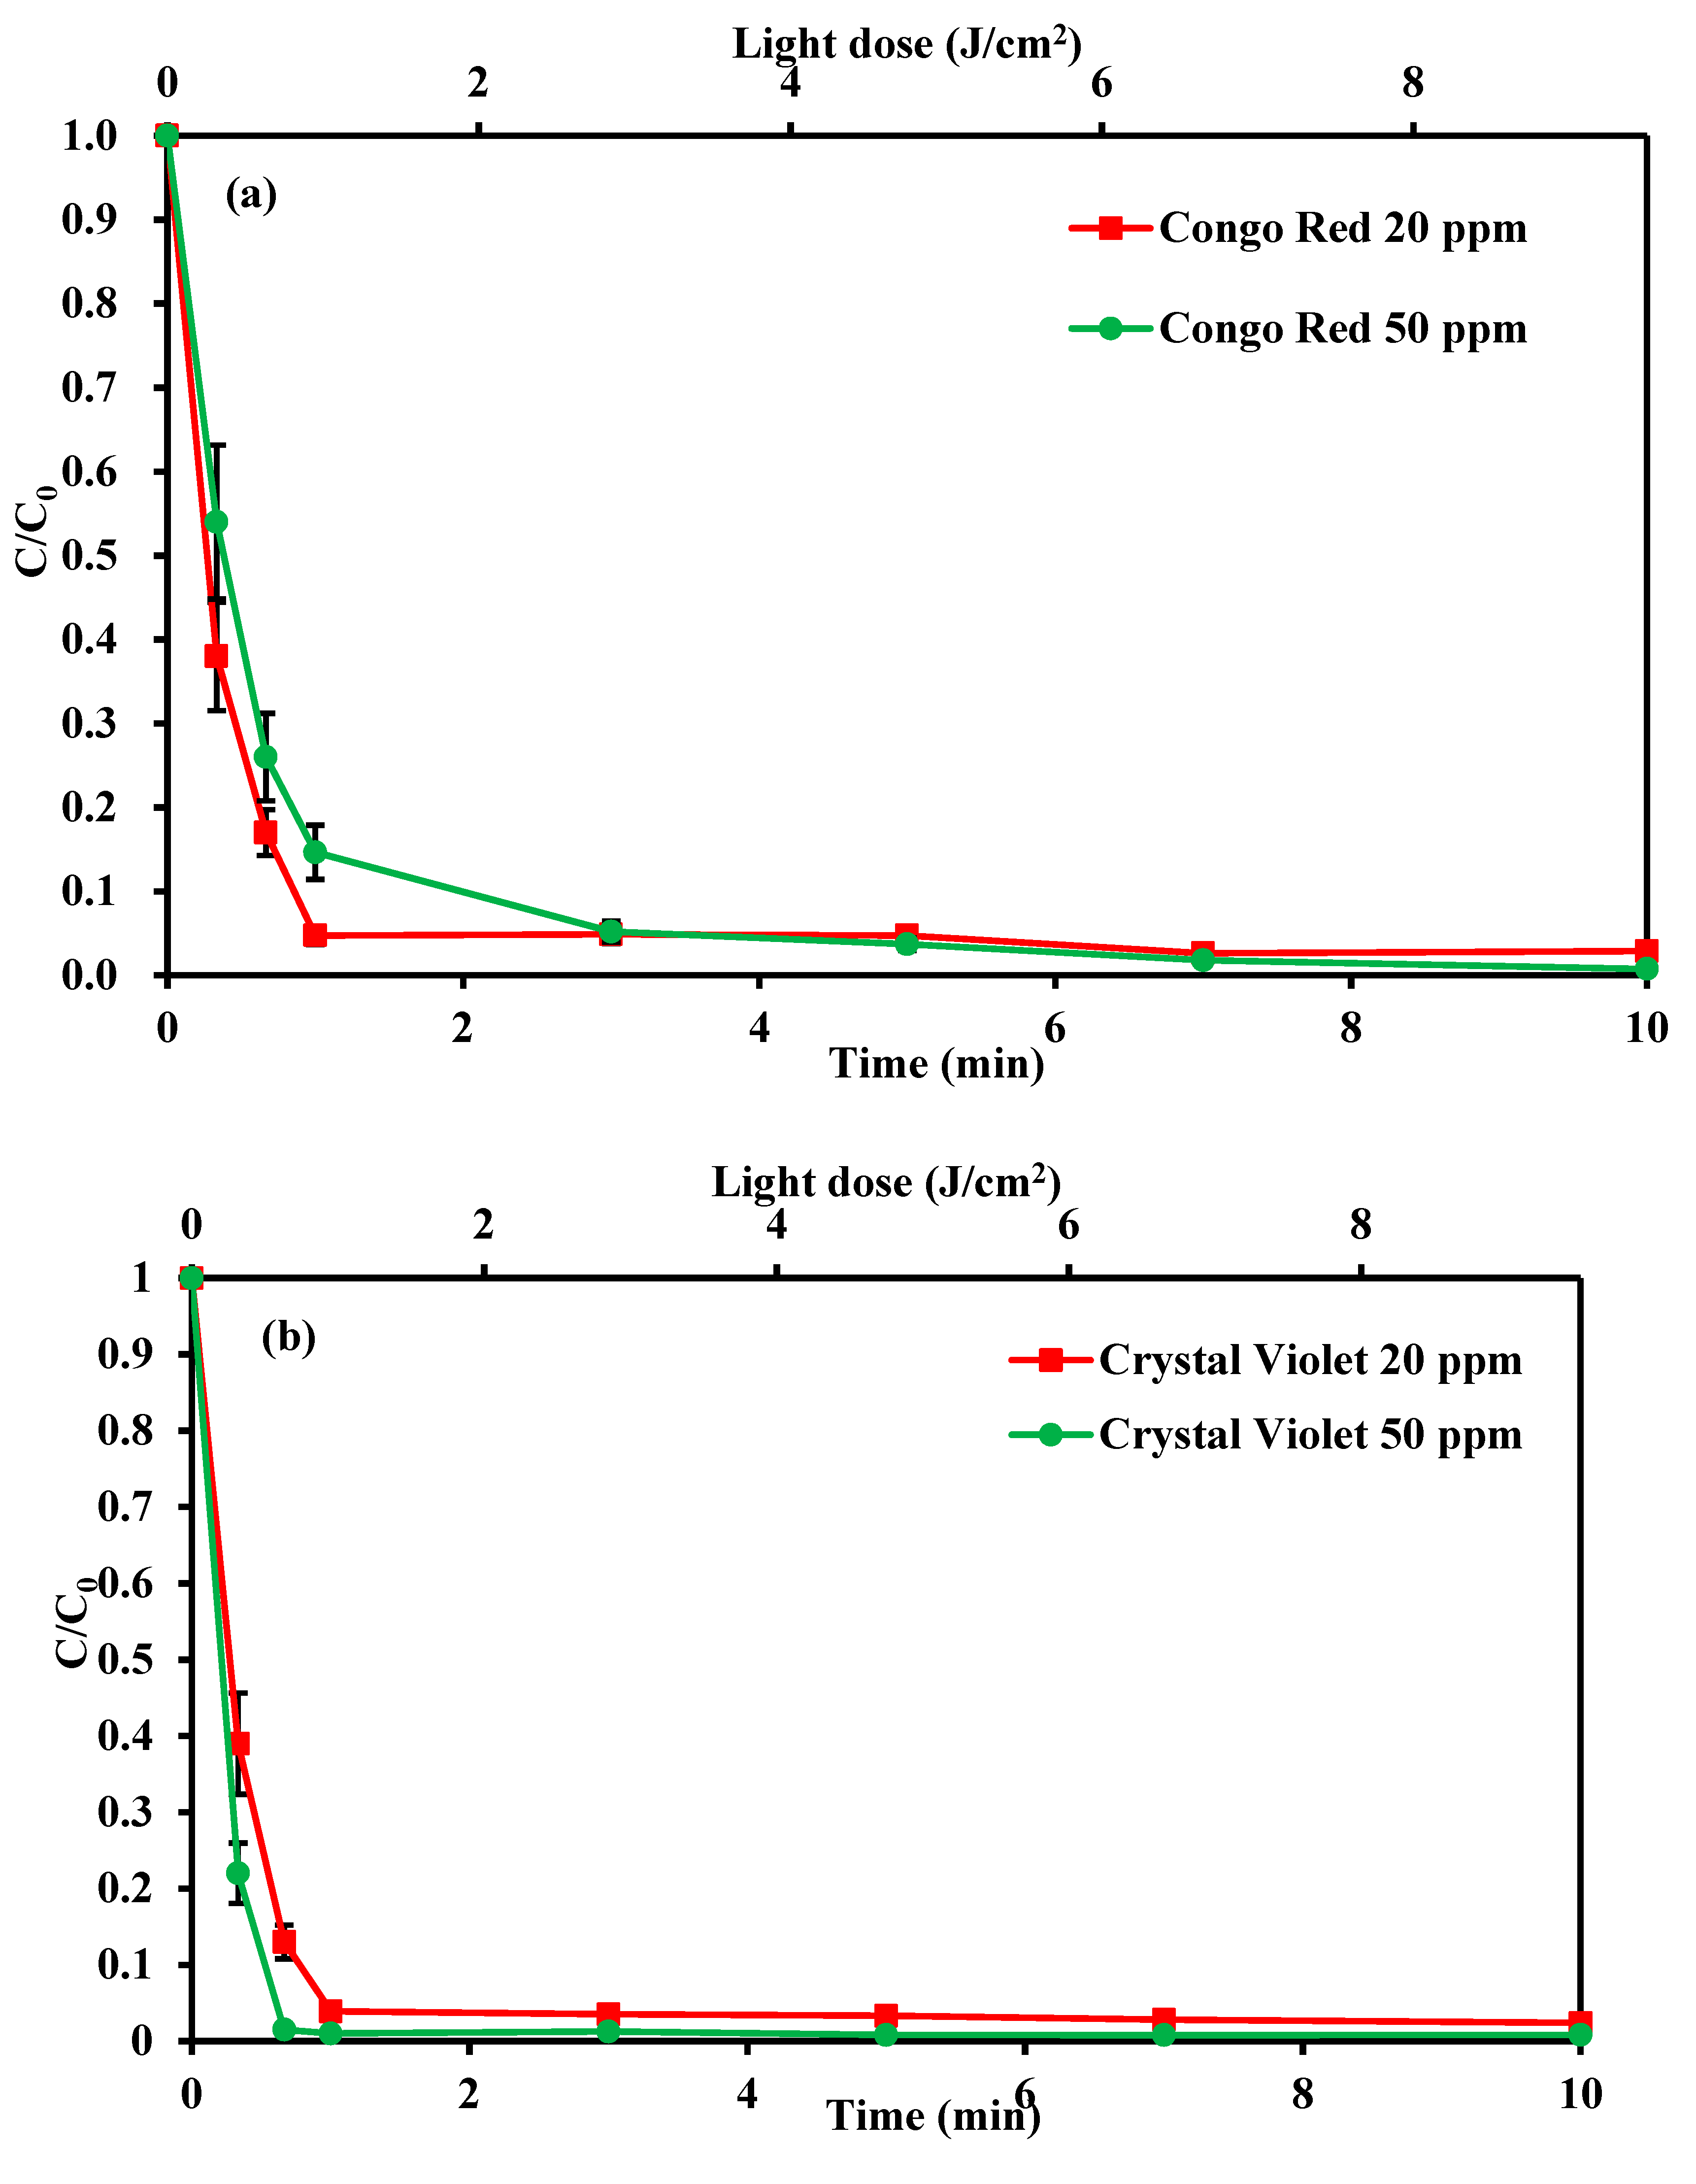
| Congo Red 20 ppm 298 K | 0.9931 | 2.940 |
| Congo Red 50 ppm 298 K | 0.9988 | 1.986 |
| Crystal Violet 20 ppm 298 K | 0.9896 | 3.486 |
| Crystal Violet 50 ppm 298 K | 0.9834 | 7.116 |
© 2020 by the authors. Licensee MDPI, Basel, Switzerland. This article is an open access article distributed under the terms and conditions of the Creative Commons Attribution (CC BY) license (http://creativecommons.org/licenses/by/4.0/).
Share and Cite
Kadam, R.L.; Kim, Y.; Gaikwad, S.; Chang, M.; Tarte, N.H.; Han, S. Catalytic Decolorization of Rhodamine B, Congo Red, and Crystal Violet Dyes, with a Novel Niobium Oxide Anchored Molybdenum (Nb–O–Mo). Catalysts 2020, 10, 491. https://doi.org/10.3390/catal10050491
Kadam RL, Kim Y, Gaikwad S, Chang M, Tarte NH, Han S. Catalytic Decolorization of Rhodamine B, Congo Red, and Crystal Violet Dyes, with a Novel Niobium Oxide Anchored Molybdenum (Nb–O–Mo). Catalysts. 2020; 10(5):491. https://doi.org/10.3390/catal10050491
Chicago/Turabian StyleKadam, Rahul L., Yeonhee Kim, Sanjit Gaikwad, Mincheol Chang, Naresh H. Tarte, and Sangil Han. 2020. "Catalytic Decolorization of Rhodamine B, Congo Red, and Crystal Violet Dyes, with a Novel Niobium Oxide Anchored Molybdenum (Nb–O–Mo)" Catalysts 10, no. 5: 491. https://doi.org/10.3390/catal10050491