Article

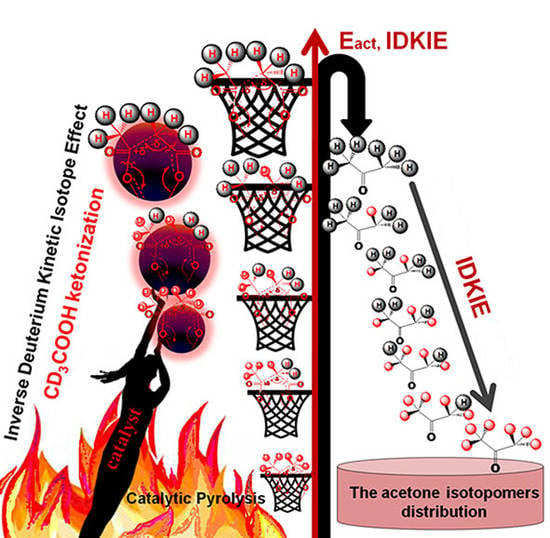
Catalytic Pyrolysis of Aliphatic Carboxylic Acids into Symmetric Ketones over Ceria-Based Catalysts: Kinetics, Isotope Effect and Mechanism

1
Chuiko Institute of Surface Chemistry, NAS of Ukraine, 17 General Naumov Str., 03164 Kyiv, Ukraine
2
Department of Physics, AlbaNova University Center, Stockholm University, SE-106 91 Stockholm, Sweden
*
Author to whom correspondence should be addressed.
Catalysts 2020, 10(2), 179; https://doi.org/10.3390/catal10020179
Submission received: 29 November 2019 / Revised: 8 January 2020 / Accepted: 21 January 2020 / Published: 3 February 2020
(This article belongs to the Special Issue Catalysis for the Production of Sustainable Fuels and Chemicals)

Abstract

:
Ketonization is a promising way for upgrading bio-derived carboxylic acids from pyrolysis bio-oils, waste oils, and fats to produce high value-added chemicals and biofuels. Therefore, an understanding of its mechanism can help to carry out the catalytic pyrolysis of biomass more efficiently. Here we show that temperature-programmed desorption mass spectrometry (TPD-MS) together with linear free energy relationships (LFERs) can be used to identify catalytic pyrolysis mechanisms. We report the kinetics of the catalytic pyrolysis of deuterated acetic acid and a reaction series of linear and branched fatty acids into symmetric ketones on the surfaces of ceria-based oxides. A structure–reactivity correlation between Taft’s steric substituent constants Es* and activation energies of ketonization indicates that this reaction is the sterically controlled reaction. Surface D3-n-acetates transform into deuterated acetone isotopomers with different yield, rate, E, and deuterium kinetic isotope effect (DKIE). The obtained values of inverse DKIE together with the structure–reactivity correlation support a concerted mechanism over ceria-based catalysts. These results demonstrate that analysis of Taft’s correlations and using simple equation for estimation of DKIE from TPD-MS data are promising approaches for the study of catalytic pyrolysis mechanisms on a semi-quantitative level.

Graphical Abstract

1. Introduction

Catalytic pyrolysis can effectively convert second-generation feedstocks (lignocellulose, waste oils, fats, algae, agricultural and forest residues, etc.) into bio-oil or pyrolysis oil [1,2,3,4,5,6,7]. The potential for the use of biomass resources of second-generation feedstocks in Europe is very high [8]. At the same time, the cost of second-generation raw materials is low [8]. One of the major components of bio-oil [1,2,3,4,5,6,7,9,10,11,12,13,14] is organic acids. Currently, some of them, including acetic, valeric, levulinic (γ-ketovaleric acid), 2,5 furan dicarboxylic acids, etc., are considered as key-building platforms in biomass conversion technologies [1,2,3,4,5,6,7,12,14]. The upgrading of bio-derived carboxylic acids has great economic, social and environmental advantages compared with the traditional use of fossil hydrocarbon resources.
The ketonization reaction, or ketonic decarboxylation is one of the attractive ways to convert carboxylic acids into sustainable biofuels and valuable industrial products with high added value [15,16,17,18,19,20,21,22,23]. Ketonization provides for the formation of a new C-C bond in one step, preserves the initial functional group C = O, and significantly reduces the oxygen content in the molecule due to decarboxylation and dehydration. In addition, the carbon chain almost doubles as a result of the symmetric ketone formation. The obtained ketones can be upgraded by catalytic hydrogenation/dehydration to liquid long-chain hydrocarbons [12,14].
Despite the close attention to the ketonization reaction, last year’s publications [15,16,17,18], including numerous studies and reviews [16,17,19,20,21,22,23] suggested that the mechanism of this reaction is not completely clear. Over the past few decades, several basic mechanisms of this reaction have been proposed [19,20,21,22,23,24,25,26,27,28,29,30,31,32,33,34,35,36,37,38,39,40,41]: (i) free-radical mechanism [24], (ii) direct concerted mechanism [20,25], (iii) mechanism involving an acyl intermediate [26], (iv) ketene based mechanisms [27,28,29], (v) and a beta-keto-acid-intermediate based mechanisms [30,31,32,33,34,35] (Scheme 1). The free-radical mechanism, the acyl-based mechanism, and ketene-based mechanism involve the participation of free radicals, acylium cation and ketene species as key intermediates of ketonization, respectively. The concerted mechanism was proposed by Rand et al. [25] for ketonization of adipic and 2,2,5,5-tetramethyladipic acids. This mechanism involves (a) decarboxylation with carbanion formation, (b) nucleophilic attack of carbanion with C-C bond formation, and (c) formation of ketone and a hydroxide anion (Scheme 1).
At the moment, the beta-keto-acid-intermediate-based mechanism is considered the most plausible [19,30,31,32,33,34,37,39]. The last two mechanisms require a stage of enolization with the elimination of hydrogen in the alpha position to the carboxyl group [19,30,31,32,33,34]. Two basic pieces of evidence are used to confirm mechanisms involving enolization. The first evidence is the presence of isotope exchange of D-H in the alpha position to the carboxyl group on the surface of the catalysts [28,29] (Scheme 2). On this basis, it is concluded that alpha hydrogen atoms take part in the reaction. The second proof is that a symmetric ketone pivalone is not formed from pivalic acid (CH3)3C-COOH) [28,30,35]. It was postulated that the reason for the lack of ketonization of pivalic acid is the absence of α-hydrogen, which excludes enolization, so ketonization is impossible [19,30,33]. However, this fact may be due to the steric effect of the substituents at the reaction center in the transition state (TS) for pivalic acid. Accordingly, it was assumed that enolisation is the rate-limiting step of the ketonization reaction.
However, on the basis of a detailed kinetic analysis [33], quantum chemical calculations [32], and an investigation of the isotopic effect [26,36], it was shown that enolization is not a rate-limiting stage. Rather the loss of the CO2 or the formation of a new C-C bond are the likely rate-determining steps [26,32,33,36]. Despite the enormous efforts spent on the establishment of the mechanism of this reaction, kinetic studies, isotope effect studies [26,27,36], quantum chemical calculations [30,31,32,33,36], studies of cross-ketonization reactions [28,30,33,38], 13C/12C exchange studies [34], H/D exchange studies on the catalyst surfaces [28,29,39], experiments with 13C-labeled acetic acids [28,33,34], Fourier Transform Infrared Spectroscopy FT-IR studies [36,37,39,40,41], etc., the question of establishing the full details of the ketonization reaction mechanism is still not completely closed [39]. However, linear free energy relationships (LFERs) have never been applied to study of the mechanism of ketonization. LFER is a very informative experimental approach because it can give information about the TS and the reaction mechanism on a semiquantitative basis [42,43]. Therefore, in our work, we decided to apply three of the most important experimental methods [42] to establish the mechanism of this reaction over ceria-based catalysts [44], which were not used or insufficiently used in previous works: 1) kinetic study and analysis of kinetics (n, Tmax, E, ν0, dS), 2) analysis of substituent effects (Taft plots) or LFERs between activation free energies change induced by substituents and the steric, the electron donating or electron withdrawing characteristics of the substituent and 3) study of the magnitude and the origin of deuterium kinetic isotope effect (DKIE).
The novelty of this study is due to the fact that using the LFERs principle, we obtained structure–reactivity correlation between Taft’s steric substituent constants Es* and activation energies of ketonization, and evaluated the contribution of the electronic and steric effects of the substituents for a wide reaction series of carboxylic acids (acetic, propionic, butyric, isobutyric, valeric, pivalic, hexanoic, heptanoic, nonanoic, octanoic, decanoic). In addition, a novel simple approximate equation was proposed for a quick estimate of the DKIE from temperature-programmed desorption mass spectrometry (TPD-MS) data. The values of inverse DKIE of the formation of a series of acetone D-isotopomers have been obtained using this simple equation. The obtained values of the inverse DKIE allowed us to get new physical insights about the sterically controlled mechanism of catalytic pyrolysis of aliphatic carboxylic acids into symmetric ketones over ceria-based catalysts.

2. Results and Discussion

2.1. Kinetic Study

It is well known that on the surfaces of various oxide catalysts, different pathways of the conversion of aliphatic acids may take place [18,44,45,46] (Scheme 3). Depending on the surface properties of the catalyst, reactions can occur such as ketenization, ketonization, decarboxylation, decarbonylation, cracking, reduction to aldehydes, and others.
As was previously established [43,47,48,49], the ketenization reaction (pathway b, Scheme 3) proceeds on the silica at 300–450 °C with a high level of selectivity. Ketenes formation has also been observed over Al2O3/SiO2, TiO2/SiO2 [41] and aluminosilicates due to the presence of Brönsted acid sites on their surfaces [50]. Cinnamic acids on the silica surface transform into corresponding ketenes, vinyl- and acetylene-benzenes via three parallel pathways b, e and f: ketenization, decarboxylation, and decarbonylation, [51,52,53]; whereas over the nanoceria surface, only the decarboxylation (f) takes place [54]. A comparative study [41] of pyrolytic decomposition of valeric acid over SiO2, Al2O3, CeO2/SiO2, Al2O3/SiO2, and TiO2/SiO2 catalysts showed that propylketene forms on the surfaces of all these oxides except for CeO2/SiO2. The formation of both ketene and ketone was observed on the surface of Al2O3. The ceria-based catalyst converted valeric acid into dibutylketone most efficiently in the investigated series of oxides due to the presence of basic sites on its surface [41]. As was noted earlier [40], ceria is the most basic oxide in the series of oxides CeO2, TiO2, and Al2O3.
The acid-base and redox properties of ceria-based materials have been extensively investigated because the unique catalytic activity enables ceria to catalyze a variety of organic reactions [55,56,57,58]. The surface of ceria is characterized by very low Lewis and Brönsted acid site density and weak acid strength [39], while at the same time extremely high density [59] of strong Lewis-base sites [60], which interact with carboxylic acids to form different types of carboxylates (monodentate, bidentate: chelate and bridge) [40,41,61]. Subsequent transformation of the surface carboxylates leads to the formation of ketones [37,40,41,61].
The main pyrolysis products of aliphatic carboxylic acids on the CeO2/SiO2 surface are the corresponding ketones and CO2. The typical TPD-MS data of the catalytic ketonization of aliphatic carboxylic acids are presented in Figure 1A,B with the example of propionic acid. Figure 1A,B show the mass spectrum and TPD curves obtained during the catalytic pyrolysis of propionic acid immobilized on the CeO2/SiO2 surface. The TPD profiles of the molecular ion of the ketonization product (diethyl ketone or 3-pentanone) with m/z = 86 and its fragment ions with m/z = 72 C2H5COCH2+), 57 (C2H5CO+), and 29 (C2H5+) reflect the shape of each other (Figure 1B). These ions are present in the spectra at the temperature of the maximum rate of the 3-pentanone formation, Figure 1A. It is known that ketonization is always accompanied by the release of water and CO2. Intensive decarboxylation accompanying the formation of the corresponding symmetrical dialkyl ketone is observed during propionic acid pyrolysis (Figure 1A,B) and all studied acids (C2–C10), except pivalic acid. As was previously established [19,35], and also observed it in this work, pivalic acid forms two other major products, isobutene and 2-dimethyl-4-methyl-3-pentanone (Table 1).
The possible side products were monitored but were not definitively detected, including pathways b, c, d, e, Scheme 3. The complex shape of the TPD curve for the ion with m/z = 44 may be evidence of the presence of path (f) at ~200 °C. Our assumption confirms the presence of peaks in the TPD curves at ~200 °C for ions with m/z = 28 and 29, which are the most intense in the ethane EI mass-spectrum [62]. The P/T curve was decomposed into individual Gaussians in order to semi-quantify the contribution of ketonization and decarboxylation with the formation of ethane in the process of propionic acid conversion, Figure 1C.
A comparative analysis of the peaks on the TPD curves (Figure 1B) with the peaks on the P/T curve (Figure 1C) shows that the P/T curve is the result of a superposition of several peaks that correspond to the desorption of water, physically adsorbed and hydrogen-bonded propionic acid, and desorption of pyrolysis products. The decomposition of the P/T curve into individual Gaussians allowed us to identify peaks 1 and 3 with desorption of propionic acid in molecular form, peaks 2 and 6 with processes of desorption of water and peaks 4 and 5 with desorption of products of catalytic transformations, because they are centered at the same temperature as corresponding TPD peaks, Table 2, Figure 1B,C.
The calculated integral intensities of peaks 1, 3, 4, and 5 make it possible to semi-quantify the efficiency of the catalytic conversion of propionic acid, Table 2. The degree of conversion of propionic acid during the pyrolysis is about 0.67, while the selectivity for the formation of 3-pentanone is above 0.90 and ethane is about 0.02. The obtained data are in good agreement with previously published data [63,64] regarding the catalytic activity of catalytic systems based on CeO2/SiO2 and catalytic systems based on ZrO2 in the ketonization of propionic acid [37]. The selectivity of 3-pentanone is higher than 97.5% on the ZrO2–based catalysts [37] and >93% on the CeO2/SiO2–based catalysts [63]. Deng et al. [64] have also confirmed a high catalytic activity of CeO2/SiO2 for acetic acid ketonization because it could convert acetic acid to acetone with high selectivity 96.63%. The activation energy E for propionic acid ketonization with 3-pentanone formation is 122 kJ·mol−1 (calculated by Arrhenius plot method), and 119 kJ·mol−1 (calculated by the modified equation), Table 1. These data also are in good agreement with the previous reports of 117 kJ·mol−1 on m-ZrO2 [33] and 124 kJ·mol−1 on m-ZrO2 and 100 kJ·mol−1 on t-ZrO2 [37].
Conversion and selectivity are highly dependent on reaction conditions, especially temperature. The effect of the reaction temperature on the degree of conversion and selectivity to ketone was studied [16,37,64]. It was shown that an increase in temperature to 425 °C allows the conversion of acetic acid to be achieved at about 93%–100% [16,64]. Importantly, the highest conversion of propionic acid on the zirconium surface was observed at a temperature of the highest ketonization rate [37]. Therefore, we can assume that the obtained temperature values of Tmax (Table 1), which are attributed to the temperature of the maximum rate of ketonization reaction of CnH2n+1COOH (n = 1–9), can be very useful for choosing the optimal conditions for the catalytic conversion of carboxylic acids into symmetric ketones. Tmax for the investigated series of carboxylic acids is in the range 247–292 °C. We suggest that optimal temperature conditions for the efficient catalytic ketonization of carboxylic acids over CeO2/SiO2 catalyst could also be in this range.
It is known that cerium-based oxides are effective catalysts of ketonization [21,38,56,63,64]. Therefore catalytic systems for industrial applications have been developed on their basis. Gliński et al. [63] investigated over 20 metal oxides supported on SiO2, Al2O3, and TiO2. It was demonstrated, that CeO2 was proved to be the most efficient as an active phase for ketonization reaction [63,64]. Gliński and coworkers [63] have suggested that high activity of CeO2 supported on SiO2, TiO2, and Al2O3 are a result of the synergy due to the interaction between the CeO2 and oxide support. We also assume synergies between the support and the active phase of the catalyst that contains strong basic centers. This determines the high catalytic activity of CeO2 materials.

2.2. Analysis of Kinetics Data

Detailed and targeted kinetic studies for reaction series of aliphatic carboxylic acids C2–C10 (acetic, propionic, butyric, isobutyric, valeric, pivalic, hexanoic, heptanoic, nonanoic, octanoic, decanoic) on the surface of nanosized CeO2/SiO2 have been investigated by temperature-programmed desorption mass spectrometry (TPD MS), Table 1. The obtained data and our previous study [41] showed that CeO2/SiO2 is suitable catalysts for ketonization.
The kinetic parameters (n, Tmax, E, ν0, dS) of the reaction of ketone formation were calculated, as described previously [43] (Table 1). The obtained values of the kinetic parameters show that the reaction proceeds according to the first order, since the determination coefficients (R2) are much higher, and the calculated deviation values are much smaller for the first order than for the second order. In addition, the first order of the reaction was also confirmed by us earlier [41] by studying the influence of the degree of surface coverage on the reaction rate. Namely, the absence of Tmax displacement towards low temperatures with increasing acid concentration on the surface indicates the first order [65].
The pre-exponential factor for this reaction series has close values within the limits of the same order. This indicates that the transition state for this reaction series has a similar structure. Thus, the entropy of activation for this series is constant (dS = const), so this reaction series is an isentropic series. This fact has allowed us to apply a Redhead peak maximum method to calculate the activation energy [66]. This method avoids the effect of various distortions in the form of a peak on the calculated values of the activation energy that can be produced by using complete analysis of TPD curves and the Arrhenius plot method [65,66,67,68]. In this work, we used the modified Equation (1) as suggested by Kislyuk and Rozanov on the basis of Redhead equation [67]. This relation directly includes the temperature of the peak maximum Tmax, [67]:
E = R Tmax ln(B/lnB)
where
B = (0TmaxCmaxn−1)b
In this formula, n is the reaction order, ν0 is the pre-exponential factor, Cn−1max is the concentration of the adsorbate at Tmax and b is the value of the sample heating rate.
A study of a number of acids shows an increase in the Tmax of reaction with an increase in the number of the methylene units and the branching in the molecule (Table 1). The corresponding increase in the activation energy was also obtained by using modified Equation (1) and the arithmetic average of the pre-exponential factor ν0average = 1/10 Σν0 acid=3.53 ± 1.89 × 10⁹ s−1 for the reaction series of 10 acids.
Thus, as a result of the kinetic analysis carried out, it is established that the reaction is of first order, the activation entropy has a negative value, i.e., the number of degrees of freedom in the transition state decreases and the transition state has a highly ordered structure. Thus, the next task is to establish how changes in the structure of the acid molecule affect the activation energy. This task can be solved by investigating the effect of the substituent using the approaches of LFERs.

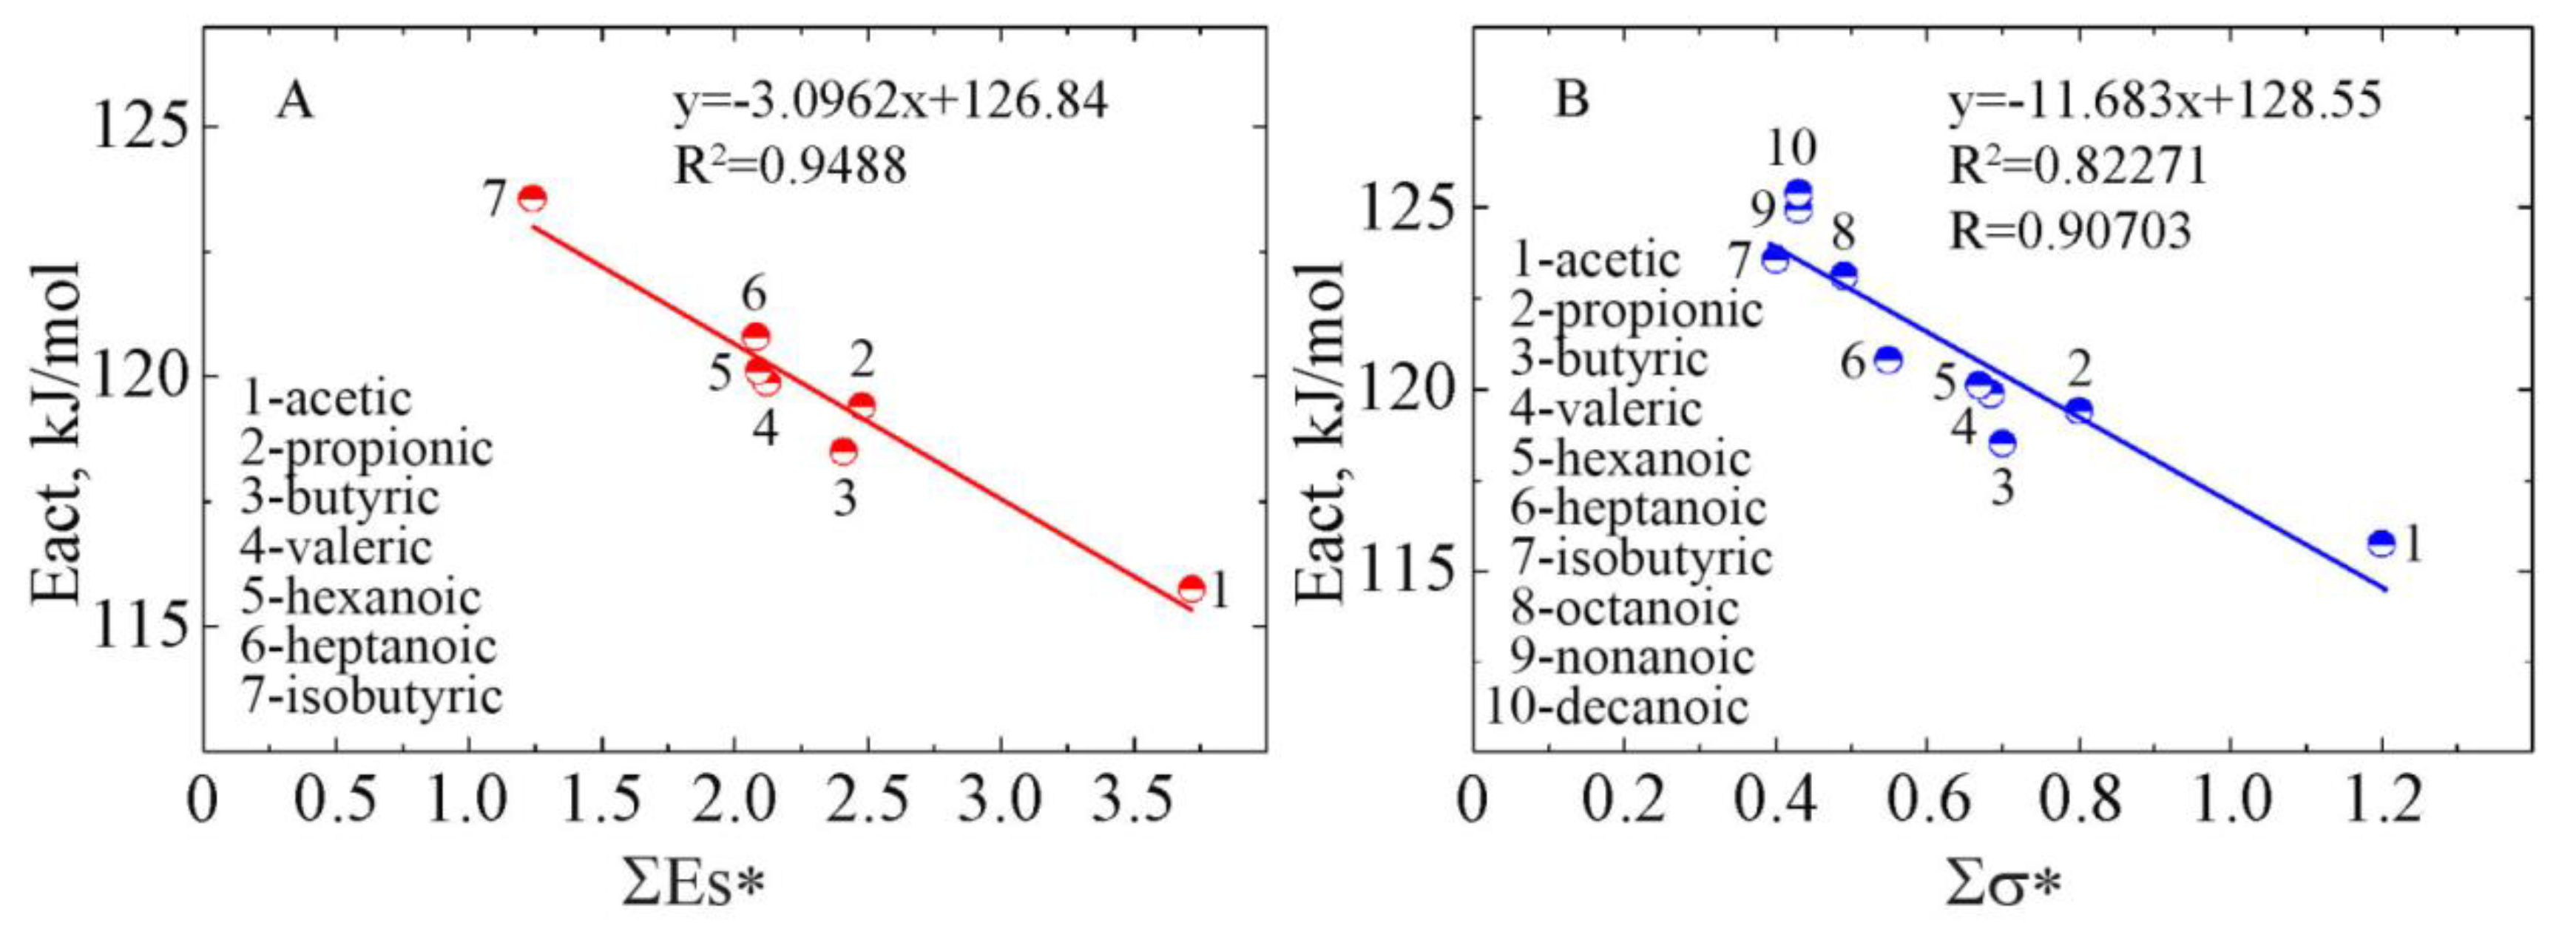
2.3. Analysis of Substituent Effects (Taft Plots) or Linear Free Energy Relationships (LFERs)

We were unable to find literature data on the use of LFERs to study the mechanism of ketonization, despite the fact that more in-depth data about the structure of the transition state can be obtained from studies of substituent effects [42]. So the next step was to search for correlations between the kinetic parameters and the thermodynamic ones: the activation energy and the Taft’s constants of substituents, respectively. An important step in the search for such correlations is the E-σ* and E-Es analysis, which allows us to determine the reaction center in the molecule. Such correlations can be obtained only if the reaction center is chosen correctly. Taft’s correlation was obtained (Figure 2A) only if the α-carbon atom was chosen as the reaction center, and not, for example, the β-carbon atom or the carbon atom of the carboxyl group. So, a linear correlation between the activation energies and the sum of the Taft steric constants at the α-carbon atom (E-ΣEs) with a high squared correlation coefficient R2 = 0.9488 indicates that the ketonization reaction is sterically sensitive, Figure 2A. The correlation E-Σσ* sum of induction Taft’s constants (Figure 2B) has a low value of the squared correlation coefficient R2 = 0.8227. These data indicate that the activation energy of ketonization is predominantly dependent on the steric effects of the substituents. That is, the transition state is less sensitive to the inductive effect of the substituents, although it is possible that electron-donor substituents slow down this reaction. The Taft correlation E-ΣEs indicates that the LFER principle is applicable to this reaction series. The presence of large substituents in the reaction center may prevent the interaction of atoms and thereby slow down the reaction or make it impossible. The steric effect does not allow to achieve the necessary conformation in the transition state for the realization of ketonization, the so-called “tert-butyl effect”. Although pivalic acid does not form a pivalon, it is an important member of this reaction series. Pivalic acid is the standard for this reaction series since the sum of both the induction and steric Taft’s constants for the α-carbon atom of the pivalic acid is 0 ((ΣEs = 3 × Es(CH3)=3 × 0 = 0; Σσ* = 3xσ*(CH3) = 3 × 0 = 0). Thus, the greatest steric effect should be observed, namely, for pivalic acid.

2.4. Study of DKIE During Catalytic Ketonization of CD3COOH (D3)

The isotopic effect is one of the most powerful tools for establishing the mechanism of reactions along with LFER and kinetic studies [42]. The presence of a primary H/D isotopic effect indicates that the bond containing the H atom being broken or formed in a kinetically relevant step [42]. However, there are contradictory data in the literature. Thus, for example, Hendren and coworkers [27] obtained the values of the primary isotopic effects k(H) = k(D) between 1.4 and 6.7 for the ketonization reaction. The absence of a primary isotopic effect was demonstrated in the study of the ketonization of deuterated acetic acid [26]. A very low value of the primary isotopic effect k(H)/k(D) = 1.1 was obtained in the work of Wang and Iglesia [36]. Thus, recent experimental data of the DKIE [26,36], as well as quantum chemical calculations [32,33] completely exclude enolization as a rate-limiting stage. However, this is not enough to completely exclude it as a necessary stage. In this regard, TPD-MS was used to an elucidation of DKIE by studying of the kinetics of the thermal transformations of deuterated acetic acid (CD3COOH) on the surface of the nanocomposites CeO2/SiO2 with higher amount of CeO2 (hCeSi).

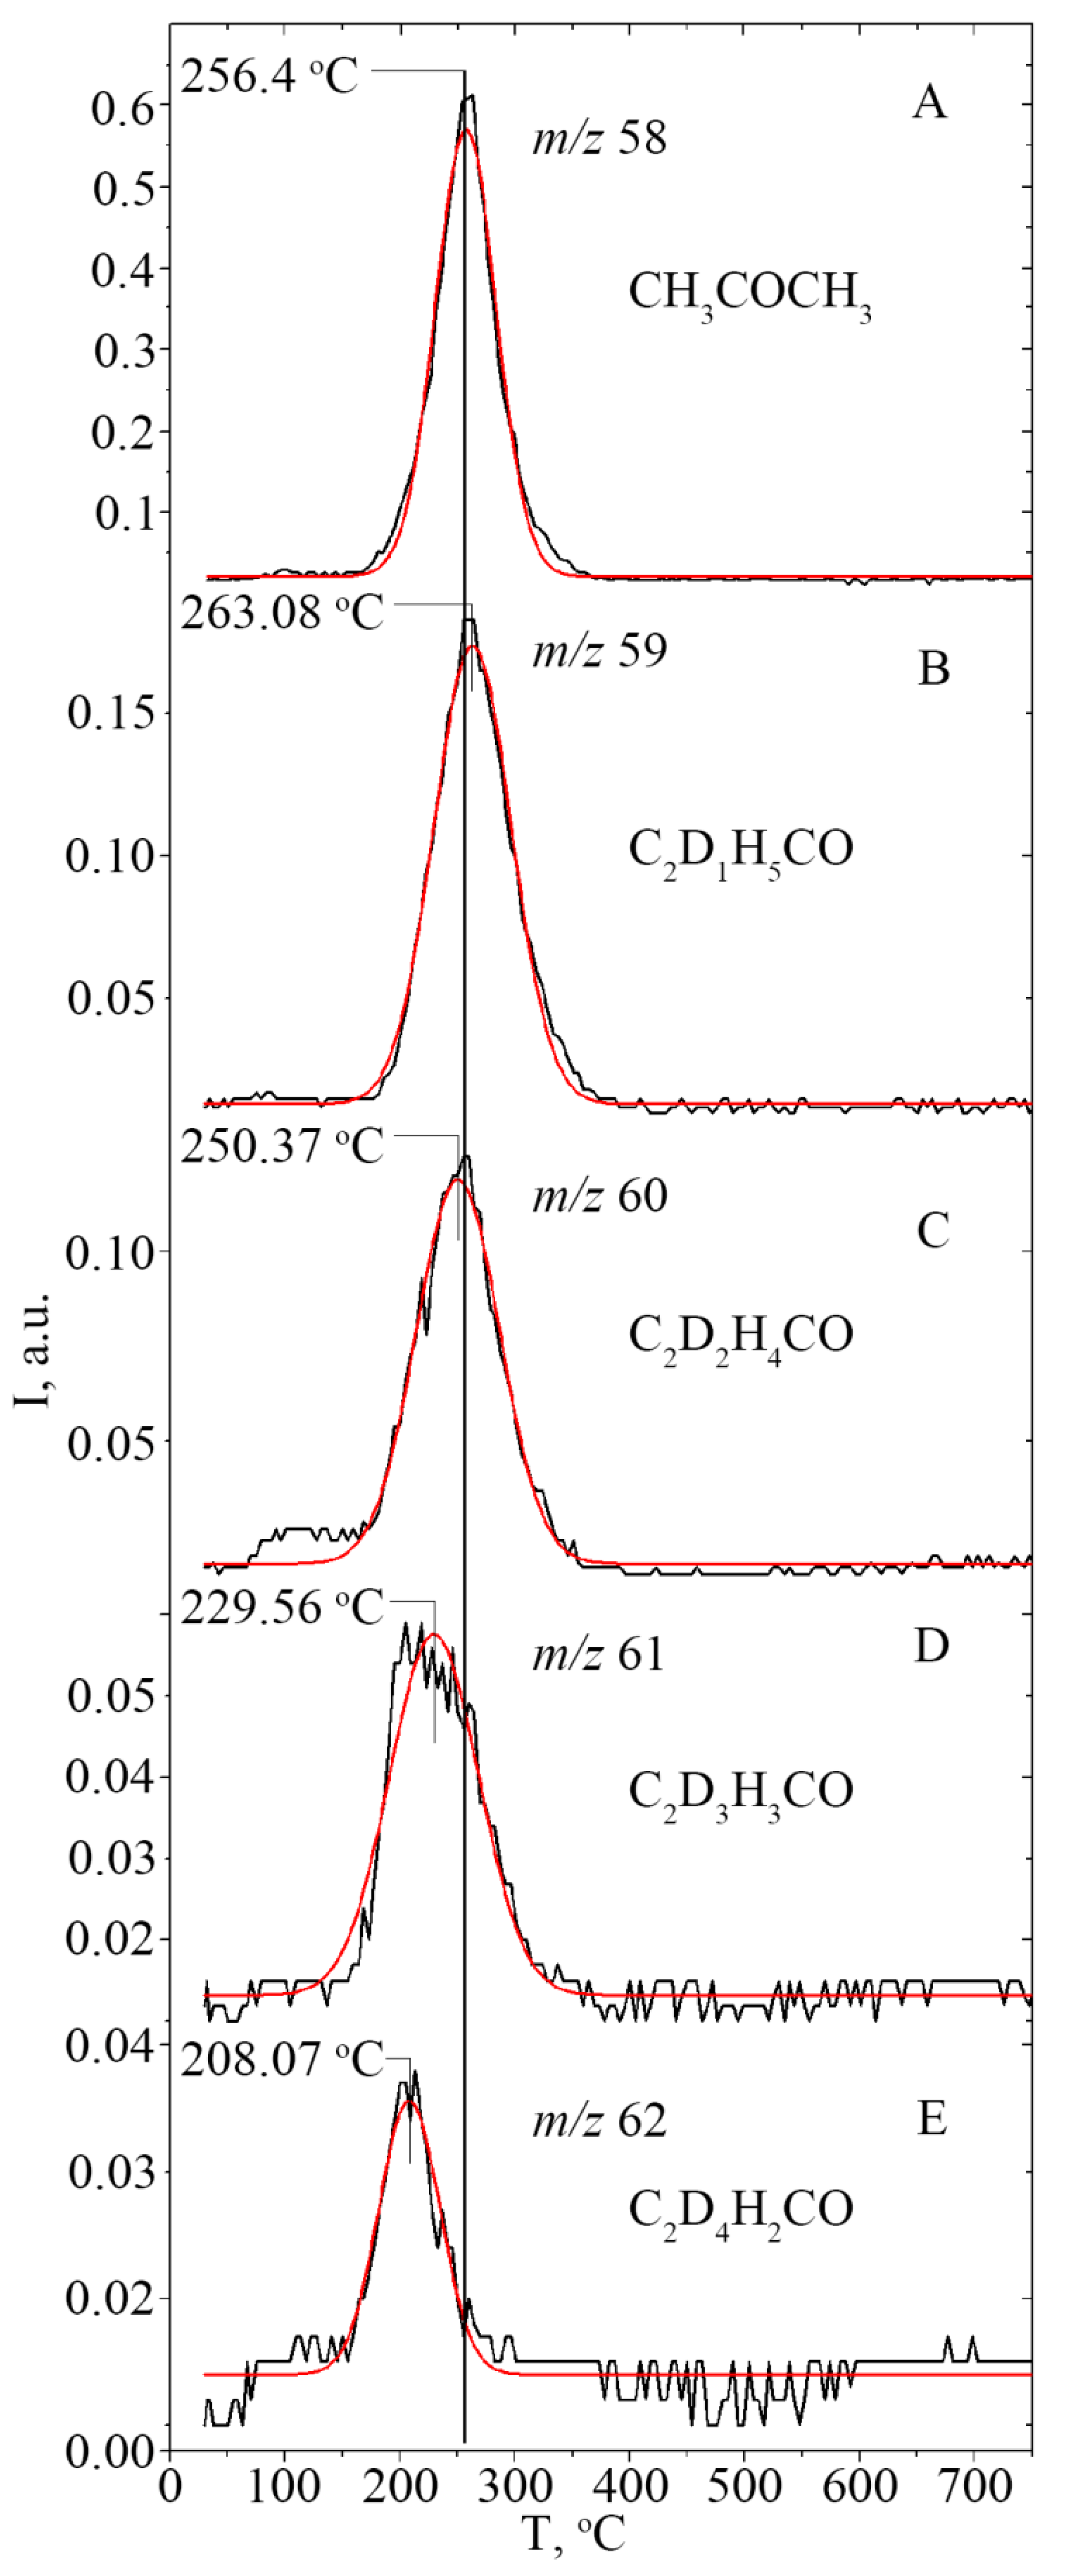
2.4.1. The Distribution of Acetone Isotopomers

The results of the TPD-MS studies confirm the presence of isotopic exchange on the surface of the catalysts, (Figure 3A,B). The peaks on the TPD curves corresponding to the isotopomers of acetone have a different intensity, and different Tmax localization, (Figure 3A,B). Earlier, in 1978, Munuera et al. [29], in their extremely important work, had already estimated the relative yield of isotopomers of acetone as result of the ketonization of a mixture of acids CD3COOH (76%) and CH3COOH (24%) adsorbed on the surface of titanium dioxide. However, due to the then instrumental imperfection, these estimates were not accurate enough, since they were made only on the basis of the peak height in the mass spectra at a fixed temperature ~250 °C. It is necessary to take into account the integrated intensity of the peaks for correct estimation.
In this regard, the mathematical procedure has been conducted to obtain the correct values of Tmax and integral intensities of the isotopomers peaks (see Figure 4, Figures S1–S5 and Table 3). Thus, the integral intensities of TPD peaks and distribution (%) for ions of acetone isotopomers with m/z = 62 (4%), 61 (11%), 60 (24%), 59 (35%), 58 (26%) were obtained during the pyrolysis of isotopic-labeled acetic acid CD3COOH on the hCeSi surface (Figure 4 and Table 3). It is noteworthy that the sum of the integral intensities of TPD peaks of ions of isotopomers with m/z = 62, 61, 60, 59, 58 is very close to integral intensities of TPD peaks of molecular ions of (CH3)2CO and (CH3)213CO that were obtained during the pyrolysis of nonlabeled acetic acid and 13C-labeled acetic acid (Figure 5, Figures S6 and S7, and Table 3).
The maximum yield is observed for monodeuterated acetone with m/z = 59, (Figure 3A, Figure 4B and Figure 5A). The increase in the number of deuterium atoms decreases the yield of the isotopomer. Unfortunately, we were unable to estimate the amount of fully deuterated (m/z = 64, C2D6H0CO) and mono-deuterated acetone (m/z = 63, C2D5H1CO) because their molecular weights are equal to the molecular weights of the molecular ions CD3CO2D and CD3CO2H, respectively. As a consequence, overlapping of the peaks of these isotopomers of acetone (C2D6H0CO and C2D5H1CO) with desorption peaks of physically adsorbed CD3CO2D and CD3CO2H acid molecules could occur.
It is most likely that the H/D isotope exchange on the surface and the ketonization reaction are two independent processes that are not related to each other. It seems that isotopic exchange easily proceeds on the oxide surface at temperatures much lower than a temperature at the start of ketonization. The adsorption layer of isotopomers of surface acetates –O-C(=O)-CDnH3-n with a different percentage distribution is formed in the isotopic exchange result, which is due to the efficiency of H/D exchange on the surface of a particular oxide. The efficiency of H/D exchange depends on the nature of the oxide surface. Based on the experimental data obtained, it can be said that on the surface of CeO2/SiO2, the H/D exchange starts at a quite low temperature ≤150 °C (Figure 3A,B). This process can likely proceed very easy through the tunneling mechanism, or through an enolization (see Scheme 2). H/D exchange was observed by Kozhevnikov et al. as a result of the exchange between surface acetates and the Brønsted acid sites [39].
Upon further heating, these exchanged deuterium atoms are desorbed in the form of deuterated water molecules DHO (m/z = 19) and D2O (m/z = 20) as a result of dehydration of surface, (Figure 3B and Figure 5B). The differences in the processes of water desorption during the pyrolysis of isotope-labeled and nonlabeled acetic acids are clearly seen in Figure 5A–C.

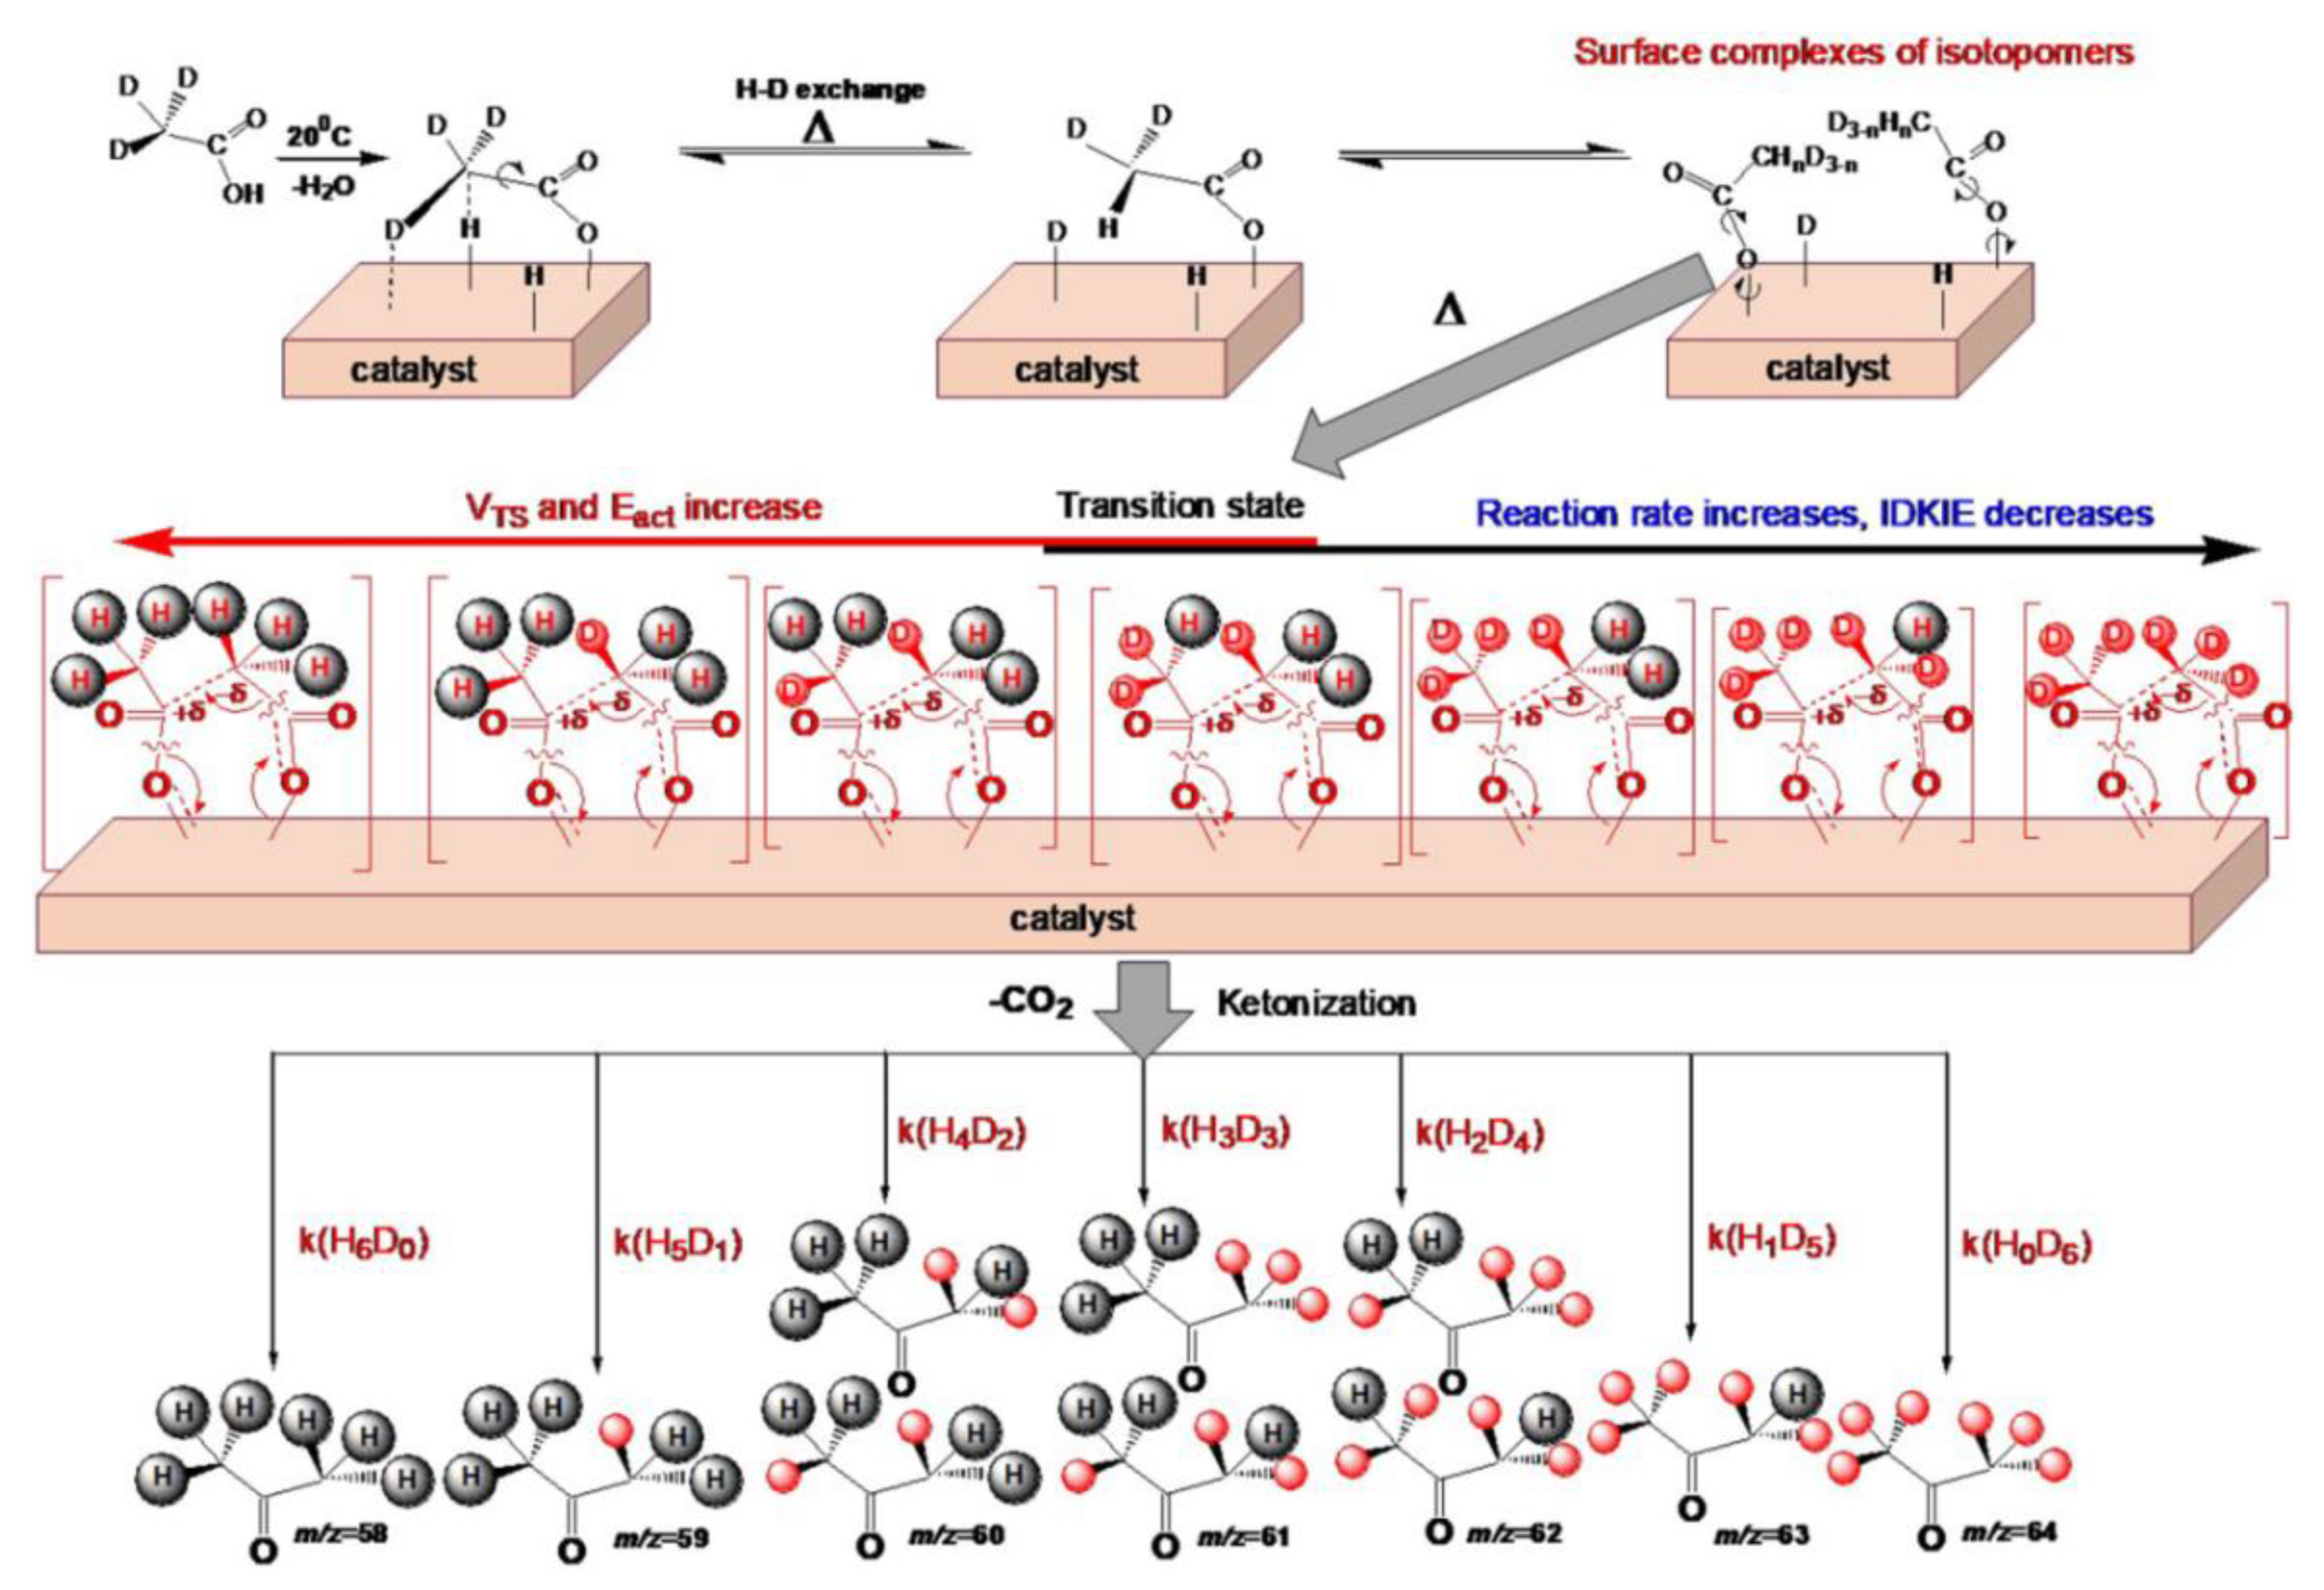
2.4.2. Study of the Magnitude and the Origin of DKIE

We assume that initially an adsorption layer from the surface complexes of acetic acid isotopomers DnH3-nCOOH is formed on the surface as a result of the H–D exchange. Their percentage distribution is due to the amount and strength of the surface active centers on which the H/D exchange occurs. Furthermore, these surface complexes of acetic acid isotopomers DnH3-nCOOH are transformed upon heating. As a result of ketonization, seven isotopomers and three isomers of isotope-labeled acetone can be formed: m/z = 64, 63, 62 (2 isomers), 61 (2 isomers), 60 (2 isomers), 59 and 58 (Scheme 4). The same value of the rate of formation of various isotopomers and accordingly, the same value of the primary DKIE, should be observed if the “beta-ketoacid” mechanism works.
Interestingly, the TPD peaks for the isotopomers of acetone were observed at different temperatures of the maximum desorption rate (Tmax) on the CeO2/SiO2 surface (see Figure 3 and Figure 4, Table 3). Most importantly, TPD peaks are shifted to higher temperatures with an increase in the numbers of H-atoms in a molecule of an isotopomer. As was shown earlier in the work performed by Leardini with co-authors, this may indicate the presence of an inverse isotope effect [69]. Determination of the exact value of the isotopic effect is a difficult experimental and calculation problem [42,69]. However, establishing even the type of isotope effect—primary, secondary or inverse—can play a key role in determining the reaction mechanism.
Therefore, we decided to use the modified Taft equation for the DKIE calculation. This equation was earlier proposed in the work of one of the coauthors [43] to study the mechanisms of catalytic reactions using the TPD-MS data:
lgk/ko = lg(B/2.3lgB)·ΔTmax/To max
After some manipulation, we obtain the simple equations for the elucidation of KIE values from TPD-MS data:
KIE = k/ko = 10lg(B/2.3lgB)·ΔTmax/To max
DKIE = k(H)/k(D) = 10lg(B/2.3lgB)·(Tmax(D)-Tmax(H))/Tmax(D)
The calculating kinetic parameters of ketonization reaction of CD3COOH, CH3COOH and CH313COOH on the hCeSi surface showed that the pre-exponential factors have close values within the limits of the same order ~109 as in the cause of reaction series of carboxylic acids on the lCeSi surface (Table 4). This result allows using Equation (5) for calculation of DKIE of formation of acetone isotopomers from deuterated acetic acid in comparison with formation acetone from nonlabeled acetic acid.
We calculated the isotope effect for isotopomers from one to four deuterium atoms in a molecule (Table 4). The reaction rate constant of formation of the deuterated d4-ketone in ~14.5-fold is larger than the reaction rate constant of the formation of nonlabeled ketone from nonlabeled CH3COOH. In addition, based on the fact that the Tmax of acetone formation from CH313COOH is rather close to Tmax of acetone formation from CH3COOH, it can be concluded that KIE = k(12C)/k(13C) is about ~1 (Table 4 and Figure 5).
The obtained values of inverse DKIE for C2D2H4CO (m/z = 60), C2D3H3CO (m/z = 61), and C2D4H2CO (m/z = 62) isotopomers formation confirm the concerted mechanism (Table 4). It is known that inverse DKIE is observed for a mechanism involving concerted bonds reorganization in the cyclic TS—for example, the Cope rearrangement [42,70,71]. The reason for this is that the compacting of the cyclic TS is the most important condition and a requirement for this type of reaction. Moreover, the different values of inverse DKIE confirm participating of all deuterium/protium atoms in the cyclic TS. As such, it has been suggested that the concerted mechanism involves the simultaneous single-step formation of a carbon–carbon bond and carbon dioxide release (Scheme 4).
The smaller size of the deuterium atom facilitates the achievement of the planar cyclic TS, in which the synchronous reorganization of bonds can occur easily only due to electron transfer, Scheme 4. Most likely, the reaction is realized in a single surface complex in which two acid residues are monodentate-bonded to two cerium atoms or one cerium atom. Ding and coauthors, by using the in situ Diffuse reflectance infrared Fourier transform spectroscopy (DRIFTS), showed that monodentate carboxylates are much more active then bidentate species during ketonization over ZrO2-based catalysts [37]. It is known that the deuterium atom is ~15% smaller than the protium atom. Replacement of each next atom of protium by deuterium leads to a decrease in the volume of the TS and, correspondingly, to an increase in the reaction rate and to a decrease in the activation energy. We calculated the activation energies of acetone isotopomers formation by using Equation (1) (Table 4). In point of fact, we can see that an increase in the number of deuterium atoms in the isotopomer molecules lead to a decrease in the activation energy of ketonization. This explains the presence of different isotope effects during the formation of acetone isotopomers.

3. Materials and Methods

3.1. Materials

The research was carried out for a deuterated acetic acid D3CCOOD (Sigma-Aldrich, St.Louis, USA, >99.5 atom %D), 13C-labeled acetic acid H3C13COOH (Sigma–Aldrich, St.Louis, USA, 99 atom %13C), and a reaction series of aliphatic carboxylic acids CnH2nCOOH (n = 1–9): acetic (Merck, Schuchardt, Germany, 99.7%), propionic (Merck, 99.5%), butyric (Merck, Schuchardt, Germany, 99.5%), isobutyric (Merck, Schuchardt, Germany, 99.5%), valeric (Merck, Schuchardt, Germany, 99.5%), hexanoic (Merck, Schuchardt, Germany, 99.5%), heptanoic (Merck, Schuchardt, Germany, 99.5%), octanoic (Merck, Schuchardt, Germany, 99.5%), nonanoic (Merck, Schuchardt, Germany, 99.5%), decanoic (Merck, Schuchardt, Germany, 99.5%), and pivalic (Fluka, 99.5%). Nonporous nanocomposites CeO2/SiO2 with low amount of CeO2—lCeSi and with higher amount of CeO2—hCeSi were prepared by using powdery fumed silica and cerium (III) acetylacetonate (Sigma-Aldrich). The modification of silica with cerium acetylacetonate and the characterization of obtained CeO2/SiO2 oxides using X-ray diffraction XRD and low-temperature Ar adsorption/desorption were described previously [72] (Table 5).
Samples of aliphatic carboxylic acids on the surfaces of the nanosized oxides with loadings of 0.6 mmol g−1 were obtained by impregnation. In a typical sample preparation session, 1 g of oxide was gradually mixed with 25 mL of a solution of acid. The samples were then aged at room temperature for 24 h, dried and stored in a desiccator until its use in the TPD-MS experiment. Ethanol solutions were used to prepare samples of reaction series of aliphatic carboxylic acids C2–C10 on the lCeSi surface. Aqueous solutions were used to prepare samples of deuterated acetic acid, nonlabeled acetic acid and 13C-labeled acetic acid on the hCeSi surface. Due to the fact that the deuterium atom of the hydroxyl group of the acid is subjected to very fast H/D exchange in aqueous solutions; in fact, the impregnation was performed with d3-acetic acid (D3CCOOH). This is what we wanted to achieve, in order to eliminate the distortion of the results due to the rapid exchange of acidic hydrogen atoms of the carboxyl group.

3.2. Temperature-Programmed Desorption Mass Spectrometry and Kinetic Parameters

The experiments were performed in an electron ionization MKh-7304A monopole mass spectrometer (Sumy, Ukraine) adapted for temperature-programmed desorption [33]. Sample weighing ~10 mg was first placed in a molybdenum-quartz ampule (5.4 mm in diameter, 20 cm in length, and 12 mL in volume) and evacuating to ~5 × 10⁻⁵ Pa at ~20 °C. For all measurements, the molybdenum-quartz ampule was filled to only approximately <<1/16 of the full volume to limit interparticle-diffusion effects [43]. All TPD measurements were carried out by heating the samples to ~750 °C at a constant rate of 0.17 °C s−1 using a programmed linear heating schedule (dT/dt = b, in which b is the heating rate). The mass spectra and the P/T curves (pressure-temperature curves; P, the pressure of volatile pyrolysis products; T, the temperature of samples) were recorded and analyzed using a computer-based data acquisition and processing setup. The pressure of volatile pyrolysis products was measured with a pressure vacuum gauge VMB-14. The mass spectra were recorded for a mass range of 1–210 amu. The kinetic parameters (temperature of the maximum desorption rate Tmax, reaction order n, activation energy E, pre-exponential factor ν0 and activation entropy dS) were calculated from the well-resolved TPD peaks for which the shape and position on the temperature scale were repeated with good resolution in several measurements. The procedure of obtaining kinetic parameters from TPD-MS data and full details of this equipment has been extensively described elsewhere [43].

4. Conclusions

In this study, the applicability of TPD-MS together with LFERs for the elucidation of the mechanism of catalytic pyrolysis of carboxylic acids into ketones over CeO2/SiO2 was investigated. The kinetic parameters of catalytic pyrolysis of CnH2nCOOH (n = 1–9), CD3COOH, and CH313COOH into ketones were calculated and analyzed. On their bases, the structure–reactivity correlation between Taft’s steric substituent constants Es* and activation energies of catalytic ketonization for the reaction series of fatty acids on the surface of nanosized CeO2/SiO2 was obtained. This correlation shows that ketonization is a sterically sensitive reaction. The study of the pyrolysis kinetics of deuterated acetic acid on the CeO2/SiO2 surface showed that H/D exchange starts at low temperature, <150 °C, and led to the formation layer of surface acetates isotopomers —O-C(=O)-CDnH3-n. It seems that H–D exchange on the surface and the ketonization are two independent processes and isotopic exchange proceeds easily at temperatures lower than the temperature of the start of ketonization reaction. Surface acetates during heating transform into deuterated acetone isotopomers with different yield, Tmax, rate, E, and DKIE. Activation energy and DKIE decrease with increasing of D-atoms number in the acetone isotopomer molecule. The obtained values of inverse DKIE do not confirm enolization as a rate-limiting step of ketonization over CeO2/SiO2. Moreover, the obtained values of inverse DKIE together with the structure–reactivity correlation support the concerted mechanism involving the synchronous reorganization of bonds in the cyclic TS. A proposed simple equation (5) can be a useful tool for the elucidation of KIE values from TPD-MS data. Its applicability has been demonstrated on this experimental data.

Supplementary Materials

The following are available online at https://www.mdpi.com/2073-4344/10/2/179/s1, Figures S1–S5: Fitting of the TPD peaks for the molecular ion of acetone isotopomer with m/z = 58–62 obtained during the pyrolysis of isotopic-labeled acetic acid CD3COOH on the hCeSi surface (0.6 mmol∙g−1). Figure S6: Fitting of the TPD peak for the molecular ion of acetone obtained during the pyrolysis of nonlabeled acetic acid CH3COOH on the hCeSi surface (0.6 mmol∙g−1). Figure S7: Fitting of the TPD peak for the molecular ion of acetone obtained during the pyrolysis of isotopic-labeled acetic acid CH313COOH on the hCeSi surface (0.6 mmol∙g−1).

Author Contributions

T.K. conducted samples preparation, results analysis, paper writing and project administration; B.P. conducted kinetics experiments; M.L. contributed to results discussion, editing of the paper and project administration. All authors have read and agreed to the published version of the manuscript.

Funding

This publication is based on work supported by the Swedish Research Council (VR, 348-2014-4250), by STCU (Grant P707), by the Volkswagen Foundation and by NAS of Ukraine (Program “New functional substances and materials of chemical production”). T.K. acknowledges the Swedish Institute for research scholarship for senior researchers within Visby Programme [03804/2016].

Acknowledgments

We are grateful to Borysenko M.V. and Kulyk K.S. for providing the CeO2/SiO2 samples.

Conflicts of Interest

The authors declare no conflict of interest.

References

  1. Bridgwater, A.V. Review of fast pyrolysis of biomass and product upgrading. Biomass Bioenergy 2012, 38, 68–94. [Google Scholar] [CrossRef]
  2. Kataki, R.; Chutia, R.S.; Mishra, M.; Bordoloi, N.; Saikia, R.; Bhaskar, T. Feedstock suitability for thermochemical processes. In Recent Advances in Thermo-Chemical Conversion of Biomass, 1st ed.; Pandey, A., Bhaskar, T., Stöcker, M., Sukumaran, R., Eds.; Elsevier: Amsterdam, The Netherlands, 2015; pp. 31–74. [Google Scholar]
  3. Zhang, S.; Yang, X.; Zhang, H.; Chu, C.; Zheng, K.; Ju, M.; Liu, L. Liquefaction of biomass and upgrading of bio-oil: A review. Molecules 2019, 24, 2250. [Google Scholar] [CrossRef] [PubMed] [Green Version]
  4. Lin, Y.C.; Huber, G.W. The critical role of heterogeneous catalysis in lignocellulosic biomass conversion. Energy Environ. Sci. 2009, 2, 68–80. [Google Scholar] [CrossRef] [Green Version]
  5. Albrecht, K.O.; Olarte, M.V.; Wang, H. Upgrading Fast Pyrolysis Liquids. In Thermochemical Processing of Biomass: Conversion into Fuels, Chemicals and Power, 2nd ed.; Brown, R.C., Ed.; Wiley Online Library: Hoboken, NJ, USA, 2019. [Google Scholar] [CrossRef]
  6. Sheldon, R.A. Green chemistry, catalysis and valorization of waste biomass. J. Mol. Catal. A Chem. 2016, 422, 3–12. [Google Scholar] [CrossRef]
  7. Climent, M.J.; Corma, A.; Iborra, S. Conversion of biomass platform molecules into fuel additives and liquid hydrocarbon fuels. Green Chem. 2014, 16, 516–547. [Google Scholar] [CrossRef] [Green Version]
  8. De Wit, M.; Faaij, A. European biomass resource potential and costs. Biomass Bioenergy 2010, 34, 188–202. [Google Scholar] [CrossRef]
  9. Nanda, S.; Mohanty, P.; Kozinski, J.A.; Dalai, A.K. Hydrothermal and Thermochemical Synthesis of Bio-Oil from Lignocellulosic Biomass: Composition, Engineering and Catalytic Upgrading. In Industrial Biotechnology, 1st ed.; Thangadurai, D., Sangeetha, J., Eds.; Apple Academic Press: New York, NY, USA, 2017; pp. 345–390. [Google Scholar]
  10. Nanda, S.; Mohanty, P.; Kozinski, J.A.; Dalai, A.K. Physico-Chemical Properties of Bio-Oils from Pyrolysis of Lignocellulosic Biomass with High and Slow Heating Rate. Energy Environ. Res. 2014, 21, 21–32. [Google Scholar] [CrossRef]
  11. Novakovskiy, D.J.; Jones, J.M. Uncatalysed and potassium-catalysed pyrolysis of the cell-wall constituents of biomass and their model compounds. J. Anal. Appl. Pyrol. 2008, 83, 12–25. [Google Scholar]
  12. Serrano-Ruiz, J.C.; Braden, D.J.; West, R.M.; Dumesic, J.A. Conversion of cellulose to hydrocarbon fuels by progressive removal of oxygen. Appl. Catal. B 2010, 100, 184–189. [Google Scholar] [CrossRef]
  13. Zhang, Y.; Cui, H.; Yi, W.; Song, F.; Zhao, P.; Wang, L.; Cui, J. Highly effective decarboxylation of the carboxylic acids in fast pyrolysis oil of rice husk towards ketones using CaCO3 as a recyclable agent. Biomass Bioenergy 2017, 102, 13–22. [Google Scholar] [CrossRef]
  14. Lange, J.P.; Price, R.; Ayoub, P.M.; Louis, J.; Petrus, L.; Clarke, L.; Gosselink, H. Valeric Biofuels: A Platform of Cellulosic Transportation Fuels. Angew. Chem. Int. Ed. 2010, 49, 4479–4483. [Google Scholar] [CrossRef] [PubMed]
  15. Jiang, B.; Xi, Z.; Lu, F.; Huang, Z.; Yang, Y.; Sun, J.; Liao, Z.; Wang, J.; Yang, Y. Ce/MgAl mixed oxides derived from hydrotalcite LDH precursors as highly efficient catalysts for ketonization of carboxylic acid. Catal. Sci. Technol. 2019, 9, 6335–6344. [Google Scholar] [CrossRef]
  16. Ling, H.; Wang, Z.; Wang, L.; Stampfl, C.; Wang, D.; Chen, J.; Huang, J. Composition-structure-function correlation of Ca/Zn/AlOx catalysts for the ketonization of acetic acid. Catal. Today 2019. [Google Scholar] [CrossRef]
  17. Ignatchenko, A.V. Multiscale approach for the optimization of ketones production from carboxylic acids by the decarboxylative ketonization reaction. Catal. Today 2019, 338, 3–17. [Google Scholar] [CrossRef]
  18. Psarras, A.C.; Michailof, C.M.; Iliopoulou, E.F.; Kalogiannis, K.G.; Lappas, A.A.; Heracleous, E.; Triantafyllidis, K.S. Acetic acid conversion reactions on basic and acidic catalysts under biomass fast pyrolysis conditions. J. Mol. Catal. 2019, 465, 33–42. [Google Scholar] [CrossRef]
  19. Pham, T.N.; Sooknoi, T.; Crossley, S.P.; Resasco, D.E. Ketonization of carboxylic acids: Mechanisms, catalysts, and implications for biomass conversion. ACS Catal. 2013, 3, 2456–2473. [Google Scholar] [CrossRef]
  20. Renz, M. Ketonization of carboxylic acids by decarboxylation: Mechanism and scope. Eur. J. Org. Chem. 2005, 6, 979–988. [Google Scholar] [CrossRef]
  21. Kumar, R.; Enjamuri, N.; Shah, S.; Al-Fatesh, A.S.; Bravo-Suárez, J.J.; Chowdhury, B. Ketonization of oxygenated hydrocarbons on metal oxide based catalysts. Catal. Today 2018, 302, 16–49. [Google Scholar] [CrossRef]
  22. Dooley, K.M. Catalysis of acid/aldehyde/alcohol condensations to ketones. Catalysis 2004, 17, 293–319. [Google Scholar]
  23. Simakova, I.L.; Murzin, D.Y. Transformation of bio-derived acids into fuel-like alkanes via ketonic decarboxylation and hydrodeoxygenation: Design of multifunctional catalyst, kinetic and mechanistic aspects. J. Energy Chem. 2017, 25, 208–224. [Google Scholar] [CrossRef]
  24. Hites, R.A.; Biemann, K. Mechanism of ketonic decarboxylation. Pyrolysis of calcium decanoate. J. Am. Chem. Soc. 1972, 94, 5772–5777. [Google Scholar] [CrossRef]
  25. Rand, L.; Wagner, W.; Warner, P.O.; Kovac, L.R. Reactions catalyzed by potassium fluoride. II. The conversion of adipic acid to cyclopentanone. J. Org. Chem. 1962, 27, 1034–1035. [Google Scholar] [CrossRef]
  26. Gumidyala, A.; Sooknoi, T.; Crossley, S. Selective ketonization of acetic acid over HZSM-5: The importance of acyl species and the influence of water. J. Catal. 2016, 340, 76–84. [Google Scholar] [CrossRef] [Green Version]
  27. Hendren, T.S.; Dooley, K.M. Kinetics of catalyzed acid/acid and acid/aldehyde condensation reactions to non-symmetric ketones. Catal. Today 2003, 85, 333–351. [Google Scholar] [CrossRef]
  28. Pestman, R.; Koster, R.M.; van Duijne, A.; Pieterse, J.A.Z.; Ponec, V. Reactions of Carboxylic Acids on Oxides. 2. Bimolecular Reaction of Aliphatic Acids to Ketones. J. Catal. 1997, 168, 265–272. [Google Scholar] [CrossRef]
  29. González, F.; Munuera, G.; Prieto, J.A. Mechanism of Ketonization of Acetic Acid on Anatase Ti02 Surfaces. J. Chem. Soc. Faraday Trans. 1978, 74, 1517–1529. [Google Scholar] [CrossRef]
  30. Pulido, A.; Oliver-Tomas, B.; Renz, M.; Boronat, M.; Corma, A. Ketonic decarboxylation reaction mechanism: A combined experimental and DFT study. ChemSusChem 2013, 6, 141–151. [Google Scholar] [CrossRef]
  31. Pham, T.N.; Shi, D.; Resasco, D.E. Kinetics and Mechanism of Ketonization of Acetic Acid on Ru/TiO2 Catalyst. Top. Catal. 2014, 57, 706–714. [Google Scholar] [CrossRef]
  32. Ignatchenko, A.V.; McSally, J.P.; Bishop, M.D.; Zweigle, J. Ab initio study of the mechanism of carboxylic acids cross-ketonization on monoclinic zirconia via condensation to beta-keto acids followed by decarboxylation. J. Mol. Catal. 2017, 441, 35–62. [Google Scholar] [CrossRef] [Green Version]
  33. Ignatchenko, A.V.; Kozliak, E.I. Distinguishing enolic and carbonyl components in the mechanism of carboxylic acid ketonization on monoclinic zirconia. ACS Catal. 2012, 2, 1555–1562. [Google Scholar] [CrossRef]
  34. Ignatchenko, A.V.; Cohen, A.J. Reversibility of the catalytic ketonization of carboxylic acids and of beta-keto acids decarboxylation. Catal. Commun. 2018, 111, 104–107. [Google Scholar] [CrossRef]
  35. Oliver-Tomas, B.; Renz, M.; Corma, A. Ketone formation from carboxylic acids by Ketonic decarboxylation: The exceptional case of the tertiary carboxylic acids. Chem. Eur. J. 2017, 23, 12900–12908. [Google Scholar] [CrossRef] [PubMed]
  36. Wang, S.; Iglesia, E. Experimental and theoretical assessment of the mechanism and site requirements for ketonization of carboxylic acids on oxides. J. Catal. 2017, 345, 183–206. [Google Scholar] [CrossRef] [Green Version]
  37. Ding, S.; Zhao, J.; Yu, Q. Effect of Zirconia Polymorph on Vapor-Phase Ketonization of Propionic Acid. Catalysts 2019, 9, 768. [Google Scholar] [CrossRef] [Green Version]
  38. Nagashima, O.; Sato, S.; Takahashi, R.; Sodesawa, T. Ketonization of carboxylic acids over CeO2-based composite oxides. J. Mol. Catal. A Chem. 2005, 227, 231–239. [Google Scholar] [CrossRef]
  39. Almutairi, S.T.; Kozhevnikova, E.F.; Kozhevnikov, I.V. Ketonisation of acetic acid on metal oxides: Catalyst activity, stability and mechanistic insights. Appl. Catal. A 2018, 565, 135–145. [Google Scholar] [CrossRef]
  40. Hasan, M.A.; Zaki, M.I.; Pasupulety, L. Oxide-catalyzed conversion of acetic acid into acetone: An FTIR spectroscopic investigation. Appl. Catal. A 2003, 243, 81–92. [Google Scholar] [CrossRef]
  41. Kulyk, K.; Palianytsia, B.; Alexander, J.D.; Azizova, L.; Borysenko, M.; Kartel, M.; Larsson, M.; Kulik, T. Kinetics of valeric acid ketonization and ketenization in catalytic pyrolysis on nanosized SiO2, γ-Al2O3, CeO2/SiO2, Al2O3/SiO2 and TiO2/SiO2. ChemPhysChem 2017, 18, 1943–1955. [Google Scholar] [CrossRef]
  42. Anslyn, E.V.; Dougherty, D.A. Modern Physical Organic Chemistry; University Science Books: Sausalito, CA, USA, 2006. [Google Scholar] [CrossRef] [Green Version]
  43. Kulik, T.V. Use of TPD-MS and linear free energy relationships for assessing the reactivity of aliphatic carboxylic acids on a silica surface. J. Phys. Chem. C 2012, 116, 570–580. [Google Scholar] [CrossRef]
  44. Dupre, G.D.; Schlosberg, R.H.; Pancirov, R.J.; Ashe, T.R.; Baset, Z. Pyrolysis studies of organic oxygenates VI. thermal Chemistry of long chain aliphatic acids. Liq. Fuels Technol. 1985, 3, 323–344. [Google Scholar] [CrossRef]
  45. Kim, K.S.; Barteau, M.A. Pathways for carboxylic acid decomposition on titania. Langmuir 1988, 4, 945–953. [Google Scholar] [CrossRef]
  46. García-Sánchez, M.; Sales-Cruz, M.; Lopez-Arenas, T.; Viveros-García, T.; Pérez-Cisneros, E.S. An Intensified Reactive Separation Process for Bio-Jet Diesel Production. Processes 2019, 7, 655. [Google Scholar] [CrossRef] [Green Version]
  47. Martinez, R.; Huff, M.C.; Barteau, M.A. Synthesis of ketenes from carboxylic acids on functionalized silica monoliths at short contact time. Appl. Catal. A 2000, 200, 79–88. [Google Scholar] [CrossRef]
  48. Libby, M.C.; Watson, P.C.; Barteau, M.A. Synthesis of Ketenes with oxide catalysts. Ind. Eng. Chem. Res. 1994, 33, 2904–2912. [Google Scholar] [CrossRef]
  49. Azizova, L.R.; Kulik, T.V.; Palyanytsya, B.B.; Lipkovska, N.A. Thermal and hydrolytic stability of grafted ester groups of carboxylic acids on the silica surface. J. Therm. Anal. Calorim. 2015, 122, 517–523. [Google Scholar] [CrossRef]
  50. Brei, V.V.; Brichka, A.V. A Study of the Brönsted Site Acidity of Crystalline and Amorphous Aluminosilicates: 2. Thermal Decomposition of Grafted Acetyl Groups. Adsorp. Sci. Technol. 1996, 14, 359–362. [Google Scholar] [CrossRef]
  51. Kulik, T.V.; Barvinchenko, V.N.; Palyanitsa, B.B.; Smirnova, O.V.; Pogorelyi, V.K.; Chuiko, A.A. A desorption mass spectrometry study of the interaction of cinnamic acid with a silica surface. Russ. J. Phys. Chem. 2007, 8, 83–90. [Google Scholar] [CrossRef]
  52. Kulik, T.V.; Lipkovska, N.A.; Barvinchenko, V.N.; Palyanytsya, B.B.; Kazakova, O.A.; Dovbiy, O.A.; Pogorelyi, V.K. Interactions between bioactive ferulic acid and fumed silica by UV–vis spectroscopy, FT–IR, TPD MS investigation and quantum chemical methods. J. Colloid Interface Sci. 2009, 339, 60–68. [Google Scholar] [CrossRef]
  53. Kulik, T.V.; Lipkovska, N.O.; Barvinchenko, V.M.; Palyanytsya, B.B.; Kazakova, O.A.; Dudik, O.O.; Menyhárd, A.; László, K. Thermal transformation of bioactive caffeic acid on fumed silica seen by UV–Vis spectroscopy, thermogravimetric analysis, temperature programmed desorption mass spectrometry and quantum chemical methods. J. Colloid Interface Sci. 2016, 470, 132–141. [Google Scholar] [CrossRef]
  54. Nastasiienko, N.; Palianytsia, B.; Kartel, M.; Larsson, M.; Kulik, T. Thermal transformation of caffeic acid on the nanosized cerium dioxide studied by temperature programmed desorption mass-spectrometry, thermogravimetric analysis and FTIR-spectroscopy. Colloids Interfaces 2019, 3, 34. [Google Scholar] [CrossRef] [Green Version]
  55. Vlasenko, N.V.; Kyriienko, P.I.; Yanushevska, O.I.; Valihura, K.V.; Soloviev, S.O.; Strizhak, P.E. The Effect of Ceria Content on the Acid–Base and Catalytic Characteristics of ZrO2–CeO2 Oxide Compositions in the Process of Ethanol to n-Butanol Condensation. Catal. Lett. 2019, 1–9. [Google Scholar] [CrossRef]
  56. Vivier, L.; Duprez, D. Ceria-Based Solid Catalysts for Organic Chemistry. ChemSusChem 2010, 3, 654–678. [Google Scholar] [CrossRef] [PubMed]
  57. Wu, Z.; Mann, A.K.; Li, M.; Overbury, S.H. Spectroscopic investigation of surface-dependent acid–base property of ceria nanoshapes. J. Phys. Chem. 2015, C 119, 7340–7350. [Google Scholar] [CrossRef]
  58. Wu, Z.; Li, M.; Mullins, D.R.; Overbury, S.H. Probing the surface sites of CeO2 nanocrystals with well-defined surface planes via methanol adsorption and desorption. ACS Catal. 2012, 2, 2224–2234. [Google Scholar] [CrossRef]
  59. Martin, D.; Duprez, D. Evaluation of the acid-base surface properties of several oxides and supported metal catalysts by means of model reactions. J. Mol. Catal. A Chem. 1997, 118, 113–128. [Google Scholar] [CrossRef]
  60. Binet, C.; Daturi, M.; Lavalley, J.C. IR study of polycrystalline ceria properties in oxidised and reduced states. Catal. Today 1999, 50, 207–225. [Google Scholar] [CrossRef]
  61. Calaza, F.C.; Chen, T.L.; Mullins, D.R.; Xu, Y.; Overbury, S.H. Reactivity and reaction intermediates for acetic acid adsorbed on CeO2 (111). Catal. Today 2015, 253, 65–76. [Google Scholar] [CrossRef] [Green Version]
  62. Stein, E. NIST Chemistry WebBook. IR and Mass Spectra, Database Number 69; Mallard, W.G., Linstrom, P.J., Eds.; National Institute of Standards and Technology: Gaithersburg, MD, USA, 2000. [Google Scholar]
  63. Gliński, M.; Kijeński, J.; Jakubowski, A. Ketones from monocarboxylic acids: Catalytic ketonization over oxide systems. Appl. Catal. A Gen. 1995, 128, 209–217. [Google Scholar] [CrossRef]
  64. Deng, L.; Fu, Y.; Guo, Q.X. Upgraded acidic components of bio-oil through catalytic ketonic condensation. Energy Fuels 2008, 23, 564–568. [Google Scholar] [CrossRef]
  65. Woodruff, D.P.; Delchar, T.A. Modern Techniques of Surface Science; Cambridge University Press: London, UK, 1986. [Google Scholar] [CrossRef]
  66. Redhead, P.A. Thermal Desorption of Gases. Vacuum 1962, 12, 203–211. [Google Scholar] [CrossRef]
  67. Kislyuk, M.U.; Rozanov, V.V. Temperature-programmed desorption and temperature-programmed reaction - methods of studying of kinetics and mechanisms of catalytic processes. Kinet. Catal. 1995, 36, 89–98. [Google Scholar]
  68. Carter, G. Thermal resolution of desorption energy spectra. Vacuum 1962, 12, 245–254. [Google Scholar] [CrossRef]
  69. Leardini, F.; Fernández, J.F.; Bodega, J.; Sanchez, C. Isotope effects in the kinetics of simultaneous H and D thermal desorption from Pd. J. Phys. Chem. Solid 2008, 69, 116–127. [Google Scholar] [CrossRef]
  70. Houk, K.N.; Gustafson, S.M.; Black, K.A. Theoretical secondary kinetic isotope effects and the interpretation of transition state geometries. 1. The Cope rearrangement. J. Am. Chem. Soc. 1992, 114, 8565–8572. [Google Scholar] [CrossRef]
  71. Hoque, M.E.U.; Guha, A.K.; Kim, C.K.; Lee, B.S.; Lee, H.W. Concurrent primary and secondary deuterium kinetic isotope effects in anilinolysis of O-aryl methyl phosphonochloridothioates. Org. Biomol. Chem. 2009, 7, 2919–2925. [Google Scholar] [CrossRef]
  72. Borysenko, M.V.; Kulyk, K.S.; Ignatovych, M.V.; Poddenezhny, E.N.; Boiko, A.A.; Dobrodey, A.O. Sol–gel synthesis of silica glasses, doped with nanoparticles of cerium oxide. In Nanomaterials and Supramolecular Structures; Shpak, A.P., Gorbyk, P.P., Eds.; Springer: Dordrecht, The Netherlands, 2009; pp. 227–233. [Google Scholar] [CrossRef]
Scheme 1. Simplified schemes of possible ketonization mechanisms and their key intermediates.
Catalysts 10 00179 sch001
Scheme 2. H/D exchange and enolization on the surface of the catalyst.
Catalysts 10 00179 sch002
Scheme 3. The possible pathways of the conversion of aliphatic acids on the surfaces of oxide catalysts.
Catalysts 10 00179 sch003
Figure 1. Catalytic pyrolysis of propionic acid supported on the nanocomposites CeO2/SiO2 with low amount of CeO2 (lCeSi) surface (0.6 mmol g−1). (A) Mass-spectrum of pyrolysis products at 265 °C, obtained after electron impact ionization. (B) temperature-programmed desorption curves (TPD curves) of the molecular ion of propionic acid with m/z = 74 and its fragment ions with m/z = 72, 44, 29, 28, 17 attributed to the desorption of the physically adsorbed and hydrogen-bonded acid. TPD curves attributed to the ketonization products: molecular ion of CO2 with m/z = 44, and molecular ion of 3-pentanone with m/z = 86 and its fragment ions with m/z = 72, 57, 29. TPD curve attributed to water desorption: fragment ion of molecular ion of water with m/z = 17. (C) Vapor pressure measured as a function of temperature (P/T curve); deconvolution of P/T curve (R2 = 0.99554); experimental data is black line, fitting curve—Red line, Gaussians—Green line.
Catalysts 10 00179 g001
Figure 2. (A) Linear correlation between the activation energies of ketonization of reaction series of carboxylic acids (C2–C10) on lCeSi and the sum of the Taft steric constants (ΣEs*) at the α-carbon atom of carboxylic acids. (B) The correlation between the activation energies and the sum of the Taft induction constants (Σσ*) at the α-carbon atom of the carboxylic acids.
Catalysts 10 00179 g002
Figure 3. (A) TPD curves for the ions of acetone isotopomers with m/z = 64, 62, 61, 60, 59, 58; (B) TPD curves for the ions of acetone isotopomers with m/z = 62, 60; TPD curves for the ions of D2O+ with m/z = 20 for the ions of D2+ with m/z = 4 were obtained during the pyrolysis of CD3COOH on the hCeSi surface.
Catalysts 10 00179 g003
Figure 4. Deconvolution of TPD curve for the ion of acetone with m/z = 58 that was obtained during the pyrolysis of nonlabeled acetic acid on the hCeSi surface (A). Deconvolution of TPD-curves for the ions of acetone isotopomers with m/z = 62, 61, 60 and 59 that were obtained during the pyrolysis of deuterated acetic acid on the hCeSi surface (BE). Experimental data is the black line; the fitting curve is the red line.
Catalysts 10 00179 g004
Figure 5. TPD curves for the molecular ion of acetone with m/z = 58, molecular ion of 13C-labeled acetone with m/z = 59, molecular ion of CO2 with m/z = 44, molecular ion of 13CO2 with m/z = 45, ion of H3O+ with m/z = 19, fragment ion of deuterated water HDO with m/z = 19 and fragment ion of water with m/z = 17 were obtained during the pyrolysis of CH3COOH (A); CD3COOH (B); CH313COOH (C) on the hCeSi surface.
Catalysts 10 00179 g005
Scheme 4. The possible mechanism of deuterated acetic acid ketonization into the acetone isotopomers involves the simultaneous carbon–carbon bond and carbon dioxide formations in one single step.
Catalysts 10 00179 sch004
Table 1. Kinetic parameters (temperature of the maximum desorption rate Tmax, reaction order n, activation energy E, pre-exponential factor ν0 and activation entropy dS) of ketonization of reaction series of carboxylic acids on the lCeSi surface (0.6 mmol/g). Sum of the Taft Induction Constants (∑σ*) and Sum of the Taft Steric Constants (∑Es) of the Substituents at the Reaction Center.
AcidΣEsΣσ*Tmax, °Cm/znE, kJ·mol−1ν0, s−1, (n = 1); mol1s−1, (n = 2)dS, cal·K−1 mol−1D± %,R2 aEb, kJ·mol−1
Acetic C23.721.22475811195.3 × 109−152.50.982115.1
22123.5 × 101930110.957-
Propionic C32.480.82668611224.4 × 109−1640.970119.4
22716.7 × 102454430.879-
Butyric C42.410.7.26211411132.4 × 109−173.40.972118.5
22529.7 × 102245210.922-
Isobutyric C41.240.428411411287.4 × 109−150.40.995123.6
22418.7 × 10203660.962-
Valeric C52.120.68526814211234.8 × 109−152.50.964119.9
22545.2 × 102244100.930-
Pivalic C50029057 c11305.2 × 108−204.80.962-
22514.2 × 101930400.853-
Hexanoic C62.090.672698511201.3 × 109−184.70.958120.1
22051.0 × 101718130.933-
Heptanoic C72.080.5527214211221.6 × 109−1860.947120.8
22821.7 × 102556200.920-
Octanoic C8-0.492828511221.4 × 109−189.00.940123.1
22505.3 × 102140320.900-
Nonanoic C9-0.432908511191.5 × 109−184.90.966124.9
22092.0 × 101718140.944-
Decanoic C10-0.452927211245.2 × 109−153.50.960125.4
22955.2 × 102662210.903-
a The coefficient of determination. b E = ln(B/lnB) RTmax. c The fragment ion of 2-dimethyl-4-methyl-3-pentanone.
Table 2. The calculated integral intensities for the peaks obtained by deconvolution of the P/T curve (R2 = 0.99554, Figure 1C).
Peak aProcess/ReactionProduct, m\zTmax (°C) TPD-CurveTmax (°C) P/T CurvePeak Area (a.u.), Σ (Peak Areas)%
Desorption of C2H5COOH in molecular form
1Desorption physically adsorbed acidC2H5COOH62650.0632913
m/z 7463
3Desorption of H-bonded acidC2H5COOH
m/z 29
1311330.0962420
Σ (1+3) = 0.1595333
Catalytic conversion of C2H5COOH
4Decarboxylation with ethane formationC2H6
m/z 29
CO2
m/z 44
196
196
1950.00511~1
5Ketonic decarboxylation(C2H5)2CO m/z 86
CO2
m/z44
265
267
2640.3160666
Σ (4+5) = 0.3211767
Σ (1+3+4+5) = 0.48070100
H2O desorption
2Desorption physically adsorbed waterH2O87810.0607126
m/z 17
6Dehydration, dehydroxylationH2O3913910.1742174
m/z 17
Σ (2+6) = 0.23492100
a Peak on the P/T curve (Figure 1C).
Table 3. Temperature of the maximum desorption rate Tmax, integral intensity (∫ I(m/z)) and distribution (%) of acetone isotopomers with m/z = 64, 62, 61, 60, 59, 58 obtained during the catalytic pyrolysis of isotopic-labeled acetic acid CD3COOH, CH313COOH and nonlabeled acetic acid CH3COOH on the hCeSi surface (0.6 mmol∙g−1).
m/z
Isotopomer of Acetone
Tmax∫ I(m/z), a.u.Distr., %R2 a
CD3COOH
58, C2D0H6CO269.910.2126.200.9906
59, C2D1H5CO263.113.5834.850.9929
60, C2D2H4CO250.49.1723.530.9817
61, C2D3H3CO229.54.3211.090.9774
62, C2D4H2CO208.11.443.700.9641
64, C2D6H0CO-<0.25<0.64-
∑ ∫ I(m/z) ~38.97~100-
CH313COOH
(CH3)213CO255.7~37.30~1000.9955
CH3COOH
(CH3)2CO256.4~36.79~1000.9912
a The coefficient of determination.
Table 4. Kinetic parameters (temperature of the maximum desorption rate Tmax, reaction order n, activation energy E, pre-exponential factor ν0 and activation entropy dS) of ketonization of CD3COOH, CH313COOH and CH3COOH on the hCeSi surface; the deuterium kinetic isotope effect (k(H)/k(D) obtained using the suggested Equation (5).
m/z, Isotopomer of AcetoneTmax, °Ck(H)/k(D)nE, kJ mol−1ν0, s−1dS, cal K−1 mol−1, %R2 aEb, kJ mol−1
CD3COOH
58, C2D0H6CO269.9-11255.1 × 109−15110.908120.3
22258.3 × 101931240.854-
59, C2D1H5CO263.11.395111161.1 × 109−1730.959118.7
21683.1 × 1019680.901-
60, C2D2H4CO250.40.736811183.8 × 109−1640.973116.2
22402.3 × 102245300.922-
61, C2D3H3CO229.50.24021-----111.2
62, C2D4H2CO208.10.06891-----106.4
CH313COOH
59, CH313COCH3255.7-11171.8 × 109−1770.960117.0
22042.5 × 101825110.906-
CH3COOH
58, CH3COCH3256.4-11225.4 × 109−1560.963117.2
22201.1 × 102032130.900-
a The coefficient of determination. b E = ln(B/lnB)RTmax.
Table 5. Characteristics of CeO2/SiO2 catalysts: specific surface area, amount and crystal size of CeO2.
Catalysts 1Sa, m2g−1Amount of CeO2,%dav,nm
lCeSi23012.35
hCeSi21218.35
1 Catalysts preparation and characterization were described previously by Borysenko et al. [72].

