Synthesis of Titanium Dioxide/Silicon Dioxide from Beach Sand as Photocatalyst for Cr and Pb Remediation


1
Department of Chemistry, Faculty of Mathematics and Sciences, Universitas Padjadjaran, Jl. Raya Bandung-Sumedang km. 21 Jatinangor, Sumedang, Jawa Barat 45363, Indonesia
2
Graduate School of Science Education, Bengkulu University, Jl. W.R. Supratman Kandang Limun, Bengkulu 38371, Indonesia
*
Author to whom correspondence should be addressed.
Catalysts 2020, 10(11), 1248; https://doi.org/10.3390/catal10111248
Submission received: 30 September 2020
/
Revised: 23 October 2020
/
Accepted: 27 October 2020
/
Published: 29 October 2020
(This article belongs to the Special Issue Photocatalysis and Environment)
Abstract
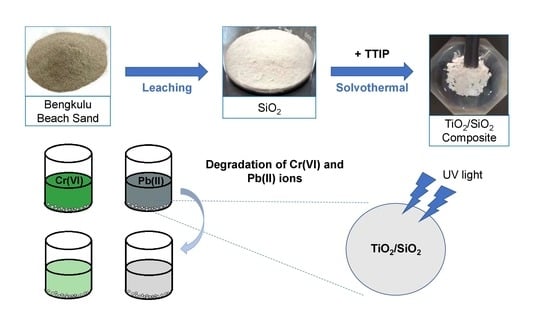
:Heavy metals are non-biodegradable and have a high toxicity effect on microorganisms which makes their presence in the environment extremely dangerous. The method of handling heavy metal waste by photocatalysis techniques using TiO2/SiO2 composite showed a good performance in reducing harmful pollutants. In this study, SiO2 from Bengkulu beach sand, Indonesia, was used as a support material for TiO2 photocatalyst to remove Cr(VI) and Pb(II). SiO2 was obtained through leaching techniques using NaOH as a solvent. The TiO2/SiO2 composite photocatalyst was synthesized using a solvothermal method at 130 °C and then characterized using X-ray diffraction (XRD), Fourier transform infrared spectroscopy (FTIR), scanning electron microscopy (SEM) and a particle size analyzer (PSA). Based on the XRD diffractogram, the synthesized TiO2 showed the anatase structure while the SiO2 showed the amorphous structure. The Ti–O–Si bond is defined in the infrared (IR) spectra, which indicates that the relationship between TiO2 and SiO2 is a chemical interaction. The results of SEM and PSA characterizations show agglomerated spherical (round) particles with a mean particle size of 616.9 nm. The TiO2/SiO2 composite of 7:1 ratio showed the highest photocatalytic activity after 180 min of ultraviolet (UV) irradiation, with a concentration-decrease percentage of 93.77% and 93.55% for Cr(VI) and Pb(II), respectively.
1. Introduction
The rapid growth of technology and manufacturing results in an increase in waste pollution to the environment. Heavy metals from industrial waste are one of contributors to water pollution [1]. These toxic metals cannot be broken down by microorganisms, and when accumulated in the body cause severe illness and even death [2]. Chromium or Cr is a metal that is commonly found in the environment because it is widely used in large industries such as metal coating, petrochemicals, mining, fertilizer, tanning leather, batteries, pesticides and the paper industry [2]. Chromium commonly comes in two forms, trivalent chromium Cr(III) and hexavalent chromium Cr(VI). Chromium in hexavalent form is 500 times more carcinogenic and very toxic compared to its trivalent form because it penetrates cell membranes and causes harmful effects. The maximum acceptable environmental threshold values for Cr(III) and Cr(VI) are 5 mg/L and 0.05 mg/L, respectively [1].
Besides chromium, water pollution due to the presence of lead is another global concern. Lead or Pb(II) is among the dangerous contaminants found in industrial waste. This compound causes mutations and is carcinogenic. Besides human activities that produce Pb, it is also naturally present in water. Pb undergoes crystallization in the air and is subsequently dissolved in rainwater that enters water bodies such as rivers and lakes [3]. Indonesian government regulations stipulate that the maximum acceptable of Pb level for conventional drinking water treatment is ≤0.1 mg/L [4].
Several methods for removing heavy metals from the environment have been actively investigated through various techniques such as adsorption, cross-flow microfiltration, precipitation and reverse osmosis [1,2]. However, these methods are relatively expensive and often inefficient when working at low concentrations. The method of photocatalysis using semiconductor material has the potential to reduce harmful pollutants and is also effective when working at low concentrations of Cr [5] and Pb [6].
Titanium dioxide (TiO2) is a semiconductor material widely used as a photocatalyst in the purifying wastewater process because it has many advantages such as high photocatalytic activity, high chemical stability when exposed to acidic and basic compounds, high oxidizing power, and low toxicity and it is easy to obtain [7]. Anatase is a form of photocatalyst claimed to be the best for photocatalytic activity, but its transformation into rutile is a weakness that limits its photocatalytic activity. Several studies have been conducted to overcome this problem by modifying the surface of TiO2 and synthesizing composite catalysts such as TiO2/SiO2, TiO2/ZrO2, TiO2/A12O3/SiO2, and TiO2/ZrO2/A12O3 [8]. Furthermore, the modification of TiO2 using SiO2 material to improve photocatalytic activity shows a high thermal stability and mechanical strength, and increases the active side of the photocatalyst surface. Another advantage of TiO2/SiO2 mixed oxides is that it inhibits agglomeration of TiO2 and transformation from anatase to rutile [7].
Silica is obtained from both organic and inorganic natural materials, by synthesis and extraction. Based on the types of natural materials that are non-biological, silica is obtained from sand and coal waste such as flying ash sludge. Beach sand is one of sources of natural silica which is very abundant. Eddy et al. [9] extracted silica successfully from Palangkaraya beach sand, Indonesia with a benefit of 91.19% and Munasir et al. [10] extracted silica successfully from Tuban beach sand, Indonesia, reaching 98.9% gain. In addition, Ishmah et al. [11] and Firdaus et al. [12] have succeeded in extracting silica from Bengkulu beach sand, Indonesia, by 97.3% and 99.5%, respectively. In this research, we evaluated the extraction of silicon dioxide (SiO2) from beach sand precursors and subsequently composite with titanium dioxide (TiO2) as a photocatalyst for decreasing the concentrations of Cr(VI) and Pb(II).
2. Results and Discussion
2.1. Characterization of Catalyst
The solvothermal method is widely used for the manufacture of oxides and is usually performed at temperatures below 400 °C. The basic principle of this method is the growth of crystals based on material solubility in solvents under high-pressure conditions. Medium temperature conditions are generally used to increase chemical diffusion while high pressure results in lesser energy consumption compared to temperature. Calcination temperature in the synthesis process has a significant impact on the TiO2 crystallinity phase, as it also affects the band gap energy value, which has a significant effect on photocatalytic performance. The anatase TiO2 phase is the best TiO2 crystal phase to be used in the photocatalytic process with 3.23 eV band gap energy. Based on research by [13], structures with optimal anatase phases are formed at temperatures of 400–600 °C. At temperatures above 600 °C, i.e., at 700 °C, the anatase structure phase begins to be transformed into rutile, the surface area decreases, and the photocatalyst activity is drastically weakened [14].
X-ray diffraction (XRD) analysis of TiO2/SiO2 composites was carried out to determine the characteristics of the TiO2 formed. The resulting diffractogram showed conformity to Inorganic Crystal Structure Database (ICSD) 98-015-5245 for amorphous SiO2 structures (tetragonal, space group P41/212), ICSD 98-017-2916 for TiO2 anatase structures (tetragonal, space group I41/amd) and ICSD 98-016-7961 for TiO2 rutile structures (tetragonal, space group P42/mnm). The TiO2 P25 Degussa crystal showed a peak pattern with the peaks at 2θ = 25.3°, 37.8°, 48.0°, 53.9°, 55.0°, 62.7°, 68.8°, 70.3°, and 75.1° that might belong to (011), (004), (020), (015), (121), (024), (116), (220), and (125) crystal planes of anatase phase respectively. Moreover, the peaks at 27.4° and 36.1° were ascribed to the (110) and (011) planes of rutile phase. For TiO2/SiO2 composites there was an additional peak at 24.1° that was ascribed to the (011) planes of amorphous SiO2 phase. Figure 1 shows that the composition of TiO2:SiO2 affects the peak intensity and the sharpness of the peak produced, while the higher the content of TiO2 causes the sharpness of the peak intensity.
Using the High Score Plus software (PANalytical 3.0.5), a Rietveld refinement of the photocatalysts was performed. Table 1 shows that composite has a different anatase/rutile phase ratio. This shows that the SiO2 plays a role in the formation of the anatase and rutile phase of TiO2. At the same calcination temperature (500 °C), TiO2:SiO2 (7:1) shows the highest anatase/rutile phase ratio, this indicates that little amount of SiO2 can effectively inhibit the transformation phase of anatase to rutile. However, excess SiO2 added is also ineffective for inhibiting this transformation.
Crystallite size was determined using the Scherrer Equation [9]:
where D is the crystallite size, K is the Scherrer constant (0.9), λ is the wavelength of the X-ray radiation, B is the value of the peak FWHM (full width at half maximum), and θ is the diffraction angle.
The crystallite size is obtained in Table 2. The values of B and θ are taken for crystal plane (011). The peaks corresponding to (011) plane of the TiO2:SiO2 composite shift slightly to higher values of 2θ and have wide peaks. The shift in the peak position to a higher angle (lower D value) may have resulted from the presence of SiO2. Lower D value implies compressive strain, which may emanate from the presence of the Si–O–Ti bonding characteristics. For TiO2:SiO2 (7:1) composite, the percentage of rutile and amorphous SiO2 phase were too low, making it inaccurate when calculating the crystallite size.
Fourier transform infrared spectroscopy (FTIR) analysis was carried out to classify functional groups in the photocatalysts. The FTIR spectrum in the range 400–4000 cm−1 of photocatalysts is shown in Figure 2. The strong and dominant absorption peak found in wave number 1090–1110 cm−1 is the asymmetrical extension of the Si–O–Si (siloxane) bond. The peak presence at wave 798 cm−1 indicates the vibrational strain of the Si–OH bond (silanol) in the amorphous SiO2 structure. The absorption peak at wave number 475 cm−1 is caused by O–Si–O (siloxy) bonding vibrations [11]. The peaks observed at 667–711 cm−1 are ascribed to the Ti–O and O–Ti–O absorption bands [15]. The infrared (IR) absorption band characteristics at wave numbers 3411–3467 cm−1 are the O–H stretching vibrations while at 1631–1638 cm−1 they are a typical absorption for O–H bending vibrations [16] due to the surface hydroxyl group. The content of hydroxyl ions are very important for photocatalytic activity. The holes resulting from photogeneration on the surface of the catalyst react with hydroxyl ions to produce hydroxyl radicals, which are strong oxidants [15].
A typical characteristic band of SiO2 and TiO2 P25 was present in all composites, indicating the composite process was successful. The O–H stretching and bending vibrations observed in all photocatalysts. The intensity of the O–H absorption peak increases with the addition of SiO2. This can be understood by the fact that the characteristic of pure SiO2 has properties of good adsorption of water from its surface [17]. In addition, the difference in O–H intensity between SiO2 and TiO2 P25 indicates that SiO2 has an active O–H side which is good for surface reaction processes. TiO2/SiO2 composite formation is characterized by Ti–O–Si bond appearance in the IR spectrum at 940–960 cm−1 wavelengths [17]. Table 3 shows the types of bonds present in SiO2, TiO2 and TiO2/SiO2 composite. The Ti–O–Si vibrational peak presence indicates that the interaction between TiO2 and SiO2 is a chemical reaction process (chemical bonding occurs) rather than a simple physical mixing process.
Scanning electron microscopy (SEM) analysis is carried out to determine the morphology of TiO2/SiO2 composites. Based on the 7000-fold magnification SEM analysis shown in Figure 3, it is known that the TiO2/SiO2 composite particles are spherical (round) and agglomeration occurs.
The Energy Dispersive X-ray Spectroscopy (EDS) qualitative analysis is performed to determine the composition of TiO2/SiO2 composites. This analysis is based on the X-ray radiation emitted by the atoms in the sample. Figure 4 indicates that the EDS analysis of TiO2/SiO2 composites with ratio 3:1, as shown in the sample, elements of titanium (Ti), silicon (Si) and oxygen (O) with atomic percent, are 17.94%, 3.43% and 78.62%, respectively.
Particle size analysis (PSA) research on TiO2/SiO2 composites was carried out to determine the average size and size distribution of the particles. Table 4 shows the particle sizes of the TiO2/SiO2 composite. It is understood that the more SiO2 that is added to the composite, the smaller the average particle size of TiO2 formed. Z-average values of each composite ratio 1:1; 3:1; and 7:1 respectively were 557.4 nm, 616.9 nm and 683.9 nm. The increased number of SiO2 causes a decrease in agglomeration and therefore reduces the particle size.
Decreasing the size of the TiO2 particle shortens the photoelectron time and the formation of a hole during photocatalytic reactions on the sample surface. It effectively reduces the photoelectron and hole recombination as well as increasing the photoelectron rate and the hole reduction or oxidation, which also increases the catalytic photocatalytic performance [8]. The composition of TiO2 with SiO2 produces a more uniform size-distribution of TiO2 and a relatively small particle size; therefore, the surface area of TiO2 gets larger and will increase its photocatalytic activity [17]. SiO2 substrate is an adsorbent that provides an adsorption side that supports TiO2 through the adsorption process so that more pollutants can be degraded as a remediation procedure [18].
2.2. Photocatalytic Activity
The photocatalyst activity of TiO2/SiO2 was tested for decreased concentration of Cr(VI) and Pb(II) metal ions in order to determine the synthesized photocatalyst performance compared to the Degussa TiO2 P25. Chromium and lead were chosen as objects because they are examples of heavy metals often found in industrial waste streams. This test was performed using a simulation sample, namely Cr(VI) and Pb(II) ion solution.
Adsorption and photocatalytic test results of Cr(VI) ions are shown in Figure 5a,b. In the same time span, the efficiency of the decreased concentration of Cr(VI) ions in Figure 5a, the ultraviolet (UV) irradiation sample is greater than the decreased efficiency in Figure 5b without irradiation. This shows that composite powder plays a role as a photocatalytic agent for the reduction of Cr(VI). Adsorption and photocatalytic test results for Pb(II) ion are shown in Figure 6a,b. At the same time, the effect of decreasing the concentration of Pb(II) ions in Figure 6a, with the sample under UV irradiation being greater than the decreasing efficiency in Figure 6b without irradiation, shows that the composite powder plays a role as photocatalytic reducing agent in Pb(II).
The Langumir–Hinshelwood first order kinetic model was applied to evaluate the reaction kinetics of photocatalysis. The first-order kinetics are calculated by [19]:
where r0 is the initial photocatalytic reduction efficiency (mg/L·min), k is the rate constant of a pseudo-first order reaction. In the beginning of the reaction, t = 0, Ct = Ci, the equation can be obtained after integration:
where Ci is the initial concentration (mg/L) of Cr(VI) or Pb(II), Ct is the concentration (mg/L) of Cr(VI) or Pb(II) in the solution at t min, and k (min−1) is the rate constant.
Table 5 shows the kinetic study of the photocatalytic reduction of Cr(VI) and Pb(II). The addition of SiO2 has an effect on the reaction kinetic constant. It can be seen that the presence of SiO2 causes and increase in the rate constant, indicating that SiO2 environment promotes the photocatalytic reduction processes. In addition, k presents a trend that gradually rises from 0.0084 min−1 for TiO2:SiO2 (1:1) composite and then continuously increases to 0.0162 min−1 for TiO2:SiO2 (7:1) composite in reduction of Cr(VI). Furthermore, the results show that Cr(VI) reduction efficiency by TiO2:SiO2 (7:1) composite was 1.9 times compared to TiO2 P25. In the reduction of Pb(II), k also show a trend that gradually rises from 0.0105 min−1 for TiO2:SiO2 (1:1) composite and then continuously increases to 0.0143 min−1 for TiO2:SiO2 (7:1) composite. The reduction efficiency by TiO2:SiO2 (7:1) composite was 1.4 times that of TiO2 P25. This indicates that suitable SiO2 on TiO2 promoted its photocatalytic ability significantly.
The performance of photocatalyst exposed to UV irradiation has a better reduction on heavy metals’ concentration compared to those not exposed to UV irradiation. This indicates that photons from a UV lamp determine the performance of the photocatalyst in Cr(VI) and Pb(II) ions. In a photocatalyst exposed to UV irradiation, the photoreduction process begins when photons with more energy than the photocatalyst band gap are absorbed by the TiO2/SiO2 photocatalyst. Therefore, the electron jumps from the valence band to the conduction band and forms a hole in the conduction band (hvb). The electrons in the valence band (ecb) and conduction band (hvb) will react with oxygen (O2) and water (H2O) which are absorbed by the photocatalyst. It will then form •OH radicals that react with metals after the process of reduction occurs [20]. In the photocatalyst that was not exposed to UV irradiation (dark conditions), there are no photons that activate the performance of the photocatalyst. Therefore, there was no photoreduction under these conditions. The decrease of Cr(VI) and Pb(II) concentration occurred because of the adsorption process. Since silica has a high adsorption capacity [17], we concluded that the adsorption process increases due to the high content of silica in the photocatalyst.
The effectiveness of chromium and lead concentrations reduction is shown in Figure 7a,b. Photocatalytic activity tests with UV irradiation for Cr(VI) ions using a TiO2 P25 photocatalyst only was 71.03%, while those using TiO2/SiO2 composites with ratios of 1:1; 3:1; and 7:1 were 79.59%, 82.81% and 93.77%, respectively. The efficiency of concentration reduction after UV irradiation for Pb(II) ions using TiO2 photocatalyst only was 80.91% and for TiO2/SiO2 composites at 1:1; 3:1; and 7:1 ratio were 86.52%, 92.22% and 93.55%, respectively. Although the 1:1 composite has a lower average particle size than the others, the particle size of this composite ratio is very heterogeneous (it can be seen from the maximum width of the wider PSA histogram) causing faster agglomeration and, therefore, interferes with the photocatalysis performance of the reduced metal concentrations. For TiO2/SiO2 (7:1), composites have the highest anatase phase ratio make it the best photo actively. This is because the anatase valence band edge at higher energy level relative to redox potentials of absorbed molecules enhances the redox capability [21]. In addition, the TiO2/SiO2 (7:1) composites also have the highest O–H bond making them good for surface photocatalytic reactions.
3. Materials and Methods
3.1. Materials
The beach sand used in this study was from the Bengkulu province, Indonesia. Distilled water was used throughout the experiments. Highest-purity available chemicals used in this study were hydrochloric acid (HCl 37%, Merck, Kenilworth, NJ, United States), ethanol (C2H5OH 99.5%, Merck, Kenilworth, NJ, United States), potassium dichromate (K2Cr2O7 99%, Merck, Kenilworth, NJ, United States), sodium hydroxide (NaOH 98%, Merck, Kenilworth, NJ, United States), lead(II) nitrate (Pb(NO3)2 99.9%, Merck, Kenilworth, NJ, United States), titanium dioxide (TiO2, P25 Degussa, Merck, Kenilworth, NJ, United States), and titanium tetraisopropoxide (TTIP, Ti(OC3H7)4, 97%, Sigma-Aldrich, St. Louis, MO, United States).
3.2. Extraction of Silica
Initially, the beach sand was crushed using a ring mill and then sieved with a 325-mesh sieve. In addition, the sand that escaped the sieve was soaked for 12 h in HCl 2 M and filtered. The resulting residue was then washed with distilled water until no yellowish color was present and then dried at 110 °C. After that, the sandstone was reacted with NaOH 3 M at 95 °C while stirring for 4 h, and then filtered. The filtrate (sodium silicate) was then stirred and poured drop by drop to form a gel (pH 7) with HCl 6 M addition. The gel formed was stored for 18 h, and then filtered and rinsed with distilled water and dried at 110 °C. The dried gel was crushed to obtain silica powder.
3.3. The Synthesis of TiO2/SiO2 Composite
The TiO2/SiO2 composites were synthesized with mole ratio of 1:1; 3:1 [22]; and 7:1 (TiO2:SiO2). Titanium tetraisopropoxide (TTIP, 520 μL) was prepared and then added to 40 mL of ethanol while stirring to prepare TiO2/SiO2 composites with a mole ratio of 3:1. Furthermore, the SiO2 suspension was prepared from 0.036 g of the SiO2 powder and sonicated in 20 mL of ethanol for 30 min. The SiO2 suspension was then mixed with the TTIP solution, transferred to an autoclave of 100 mL, and heated in an oven at 130 °C for 15 h. After cooling until room temperature was achieved, the solution was centrifuged at 6000 rpm for 10 min, and then the pH solution was adjusted to 7.0. The TiO2/SiO2 composites formed were then dried at 110 °C for 2 h and calcinated at 500 °C for 5 h. A similar procedure was also applied to TiO2/SiO2 composites with 1:1 and 7:1 mole ratio variation.
3.4. Characterization of Catalysis
The XRD diffractogram was carried out using the XRD MiniFlex600 (Rigaku, Tokyo, Japan). Measurements were carried out at room temperature using Cu Kα radiation (λ = 1.5406 Å) with scan range from 10° to 80° (2θ). The Fourier transform infrared spectra were acquired by a FTIR (PerkinElmer, Spectrum100, Waltham, MA, United States) and a scan range from 400–4000 cm−1. Particle size of the composites was measured by a particle size analyzer (PSA, Horiba SZ-100, Kyoto, Japan). Scanning electron microscopy (SEM) was performed by a SEM-EDX (Hitachi SU3500, Tokyo, Japan).
3.5. Photocatalytic Activity Test
The Cr(VI) ion solution 100 mL (3 mg/L) was added to a beaker glass and then added to 100 mg of TiO2/SiO2 composite. The mixture was then placed on a artificial homemade photoreactor and irradiated with an Hg lamp (HPL-N 125W, Philips, Shanghai, China, equal UV A with wavelength 315–400 nm) on a magnetic stirrer (IKA C-MAG MS 4, Staufen, Germany) with an irradiated area of 26 cm2 for 180 min at room temperature. We then took 10 mL of Cr(VI) solution every 30 min using a syringe membrane. The concentration of metal ion was again measured using atomic absorption spectroscopy (AAS, Shimadzu AA7000, Kyoto, Japan). The same treatment (100 mg) was applied to TiO2/SiO2 composite with 3:1 and 7:1 ratio, and to TiO2 without SiO2 as a control. This photocatalytic activity test was also conducted without irradiation at the same time interval for each sample. The same photocatalytic activity test procedure was also applied to Pb(II) solution (40 mg/L).
4. Conclusions
The composite of SiO2/TiO2 increased the photocatalytic activity in decreasing Cr(VI) and Pb(II) concentrations. By using the optimal condition, the percentages of heavy metals concentration reduction were 93.77% and 93.55% for Cr(VI) and Pb(II) ions, respectively. The high effectiveness of this method for reducing the concentration of heavy metals can be used as an alternative remediation method on Cr and Pb waste.
Author Contributions
Conceptualization, D.R.E. and M.L.F.; methodology, S.N.I.; software, S.N.I. and M.D.P.; validation, D.R.E. and M.L.F.; formal analysis, S.N.I.; investigation, S.N.I. and M.D.P.; resources, S.N.I.; data curation, S.N.I.; writing—original draft preparation, S.N.I.; writing—review and editing, D.R.E. and M.D.P.; visualization, M.D.P.; supervision, D.R.E. and M.L.F.; project administration, D.R.E.; funding acquisition, D.R.E. All authors have read and agreed to the published version of the manuscript.
Funding
This research was funded by Research Grant from Kemenristek-BRIN 2020 with Student Thesis Research Grant Number 1827/UN6.3.1/LT/2020, 12 May 2020.
Acknowledgments
The author thanks Putri Rizka Lestari and Nobuhiro Kumada from the Center for Crystal Science and Technology, University of Yamanashi, for characterization analysis.
Conflicts of Interest
The authors declare no conflict of interest.
References
- Sane, P.; Chaudhari, S.; Nemade, P.; Sontakke, S. Photocatalytic reduction of chromium(VI) using combustion synthesized TiO2. J. Environ. Chem. Eng. 2018, 6, 68–73. [Google Scholar] [CrossRef]
- Ojemaye, M.O.; Okoh, O.O.; Okoh, A.I. Performance of NiFe2O4-SiO2-TiO2 Magnetic Photocatalyst for the Effective Photocatalytic Reduction of Cr(VI) in Aqueous Solutions. J. Nanomater. 2017, 2017, 5264910. [Google Scholar] [CrossRef] [Green Version]
- Kotz, J.C.; Treichel, P.M.; Townsend, J.R. Chemistry and Chemical Reactivity, 7th ed.; Thomson Brooks/Cole: Pacific Grove, CA, USA, 2009. [Google Scholar]
- Said, N.I. Pengolahan Air Limbah Domestik di DKI Jakarta “Tinjauan Permasalahan, Strategi dan Teknologi Pengolahan”, 1st ed.; Badan Pengkajian dan Penerapan Teknologi: Jakarta, Indonesia, 2008; 606p.
- Eddy, D.R.; Rahayu, I.; Hartati, Y.W.; Firdaus, M.L.; Bakti, H.H. Photocatalytic activity of gadolinium doped TiO2 particles for decreasing heavy metal chromium concentration. J. Phys. Conf. Ser. 2018, 1080, 012013. [Google Scholar] [CrossRef]
- Bi, J.; Wang, J.; Huang, X.; Tao, Q.; Chen, M.; Wang, T.; Hao, H. Enhanced removal of Pb (II) and organics by titanate in a designed simultaneous process. Sep. Purif. Technol. 2020, 251, 117339. [Google Scholar] [CrossRef]
- Besançon, M.; Michelin, L.; Josien, L.; Vidal, L.; Assaker, K.; Bonne, M.; Lebeau, B.; Blin, J.L. Influence of the porous texture of SBA-15 mesoporous silica on the anatase formation in TiO2-SiO2 nanocomposites. New J. Chem. 2016, 40, 4386–4397. [Google Scholar] [CrossRef]
- Cheng, Y.; Luo, F.; Jiang, Y.; Li, F.; Wei, C. The effect of calcination temperature on the structure and activity of TiO2/SiO2 composite catalysts derived from titanium sulfate and fly ash acid sludge. Colloids Surf. A Physicochem. Eng. Asp. 2018, 554, 81–85. [Google Scholar] [CrossRef]
- Eddy, D.R.; Puri, F.N.; Noviyanti, A.R. Synthesis and Photocatalytic Activity of Silica-based Sand Quartz as the Supporting TiO2 Photocatalyst. Procedia Chem. 2015, 17, 55–58. [Google Scholar] [CrossRef] [Green Version]
- Munasir; Sulton, A.; Triwikantoro; Zainuri, M.; Darminto. Synthesis of silica nanopowder produced from Indonesian natural sand via alkalifussion route. AIP Conf. Proc. 2013, 1555, 28–31. [Google Scholar]
- Ishmah, S.N.; Permana, M.D.; Firdaus, M.L.; Eddy, D.R. Extraction of Silica from Bengkulu Beach Sand using Alkali Fusion Method. PENDIPA J. Sci. Edu. 2020, 4, 1–5. [Google Scholar] [CrossRef]
- Firdaus, M.L.; Madina, F.E.; Yulia, F.S.; Elvia, R.; Soraya, N.I.; Eddy, D.R.; Cid-Andres, A.P. Silica Extraction from Beach Sand for Dyes Removal: Isotherms, Kinetics and Thermodynamics. Rasayan J. Chem. 2020, 13, 249–254. [Google Scholar] [CrossRef]
- Zhang, Y.; Weidenkaff, A.; Reller, A. Mesoporous Structure and Phase Transition of Nanosrystalline TiO2. Mater. Lett. 2002, 54, 375–381. [Google Scholar] [CrossRef]
- Sikong, L.; Damchan, J.; Kooptarnond, K.; Niyomwas, S. Effect of doped SiO2 and calcinations temperature on phase transformation of TiO2 photocatalyst prepared by sol-gel method. Songklanakarin J. Sci. Technol. 2008, 30, 385–391. [Google Scholar]
- Devi, L.G.; Rajashekhar, K.E. A kinetic model based on non-linear regression analysis is proposed for the degradation of phenol under UV/solar light using nitrogen doped TiO2. J. Mol Catal. A Chem. 2011, 334, 65–76. [Google Scholar] [CrossRef] [Green Version]
- Lin, L.; Zheng, R.Y.; Xie, J.L.; Zhu, Y.X.; Xie, Y.C. Synthesis and characterization of phosphor and nitrogen co-doped titania. Appl. Catal. B Environ. 2007, 76, 196–202. [Google Scholar] [CrossRef]
- Sirimahachai, U.; Ndiege, N.; Chandrasekharan, R.; Wongnawa, S.; Shannon, M.A. Nanosized TiO2 particles decorated on SiO2 spheres: Synthesis and photocatalytic activities. J. Sol-Gel Sci. Technol. 2010, 56, 3–6. [Google Scholar] [CrossRef]
- Sellapan, R. Mechanisms of Enhanced Activity of Model TiO2/Carbon and TiO2/Metal Nanocomposite Photocatalysts; Department of Applied Physics Chalmers University: Gotebrog, Sweden, 2013. [Google Scholar]
- Pu, S.; Hou, Y.; Chen, H.; Deng, D.; Yang, Z.; Xue, S.; Zhu, R.; Diao, Z.; Chu, W. An efficient photocatalyst for fast reduction of Cr(VI) by ultra-trace silver enhanced titania in aqueous solution. Catalysts 2018, 8, 251. [Google Scholar] [CrossRef] [Green Version]
- Zaccariello, G.; Moretti, E.; Storaro, L.; Riello, P.; Canton, P.; Gombac, V.; Montini, T.; Rodríguez-Castellón, E.; Benedetti, A. TiO2-mesoporous silica nanocomposites: Cooperative effect in the photocatalytic degradation of dyes and drugs. RSC Adv. 2014, 4, 37826–37837. [Google Scholar] [CrossRef]
- Gao, M.; Zhu, L.; Ong, W.L.; Wang, J.; Ho, G.W. Structural design of TiO2-based photocatalyst for H2 production and degradation applications. Catal. Sci. Technol. 2015, 5, 4703–4726. [Google Scholar] [CrossRef]
- Pal, A.; Jana, T.K.; Chatterjee, K. Silica supported TiO2 nanostructures for highly efficient photocatalytic application under visible light irradiation. Mat. Res. Bull. 2016, 76, 353–357. [Google Scholar] [CrossRef]
Figure 1.
X-ray diffraction (XRD) pattern of (a) TiO2 P25; (b) TiO2/SiO2 (1:1) composite; (c) TiO2/SiO2 (3:1) composite and; (d) TiO2/SiO2 (7:1) composite.
Figure 1.
X-ray diffraction (XRD) pattern of (a) TiO2 P25; (b) TiO2/SiO2 (1:1) composite; (c) TiO2/SiO2 (3:1) composite and; (d) TiO2/SiO2 (7:1) composite.

Figure 2.
Fourier transform infrared (FTIR) spectrum of (a) SiO2; (b) TiO2 P25; (c) TiO2/SiO2 (1:1) composite; (d) TiO2/SiO2 (3:1) composite and; (e) TiO2/SiO2 (7:1) composite.
Figure 2.
Fourier transform infrared (FTIR) spectrum of (a) SiO2; (b) TiO2 P25; (c) TiO2/SiO2 (1:1) composite; (d) TiO2/SiO2 (3:1) composite and; (e) TiO2/SiO2 (7:1) composite.
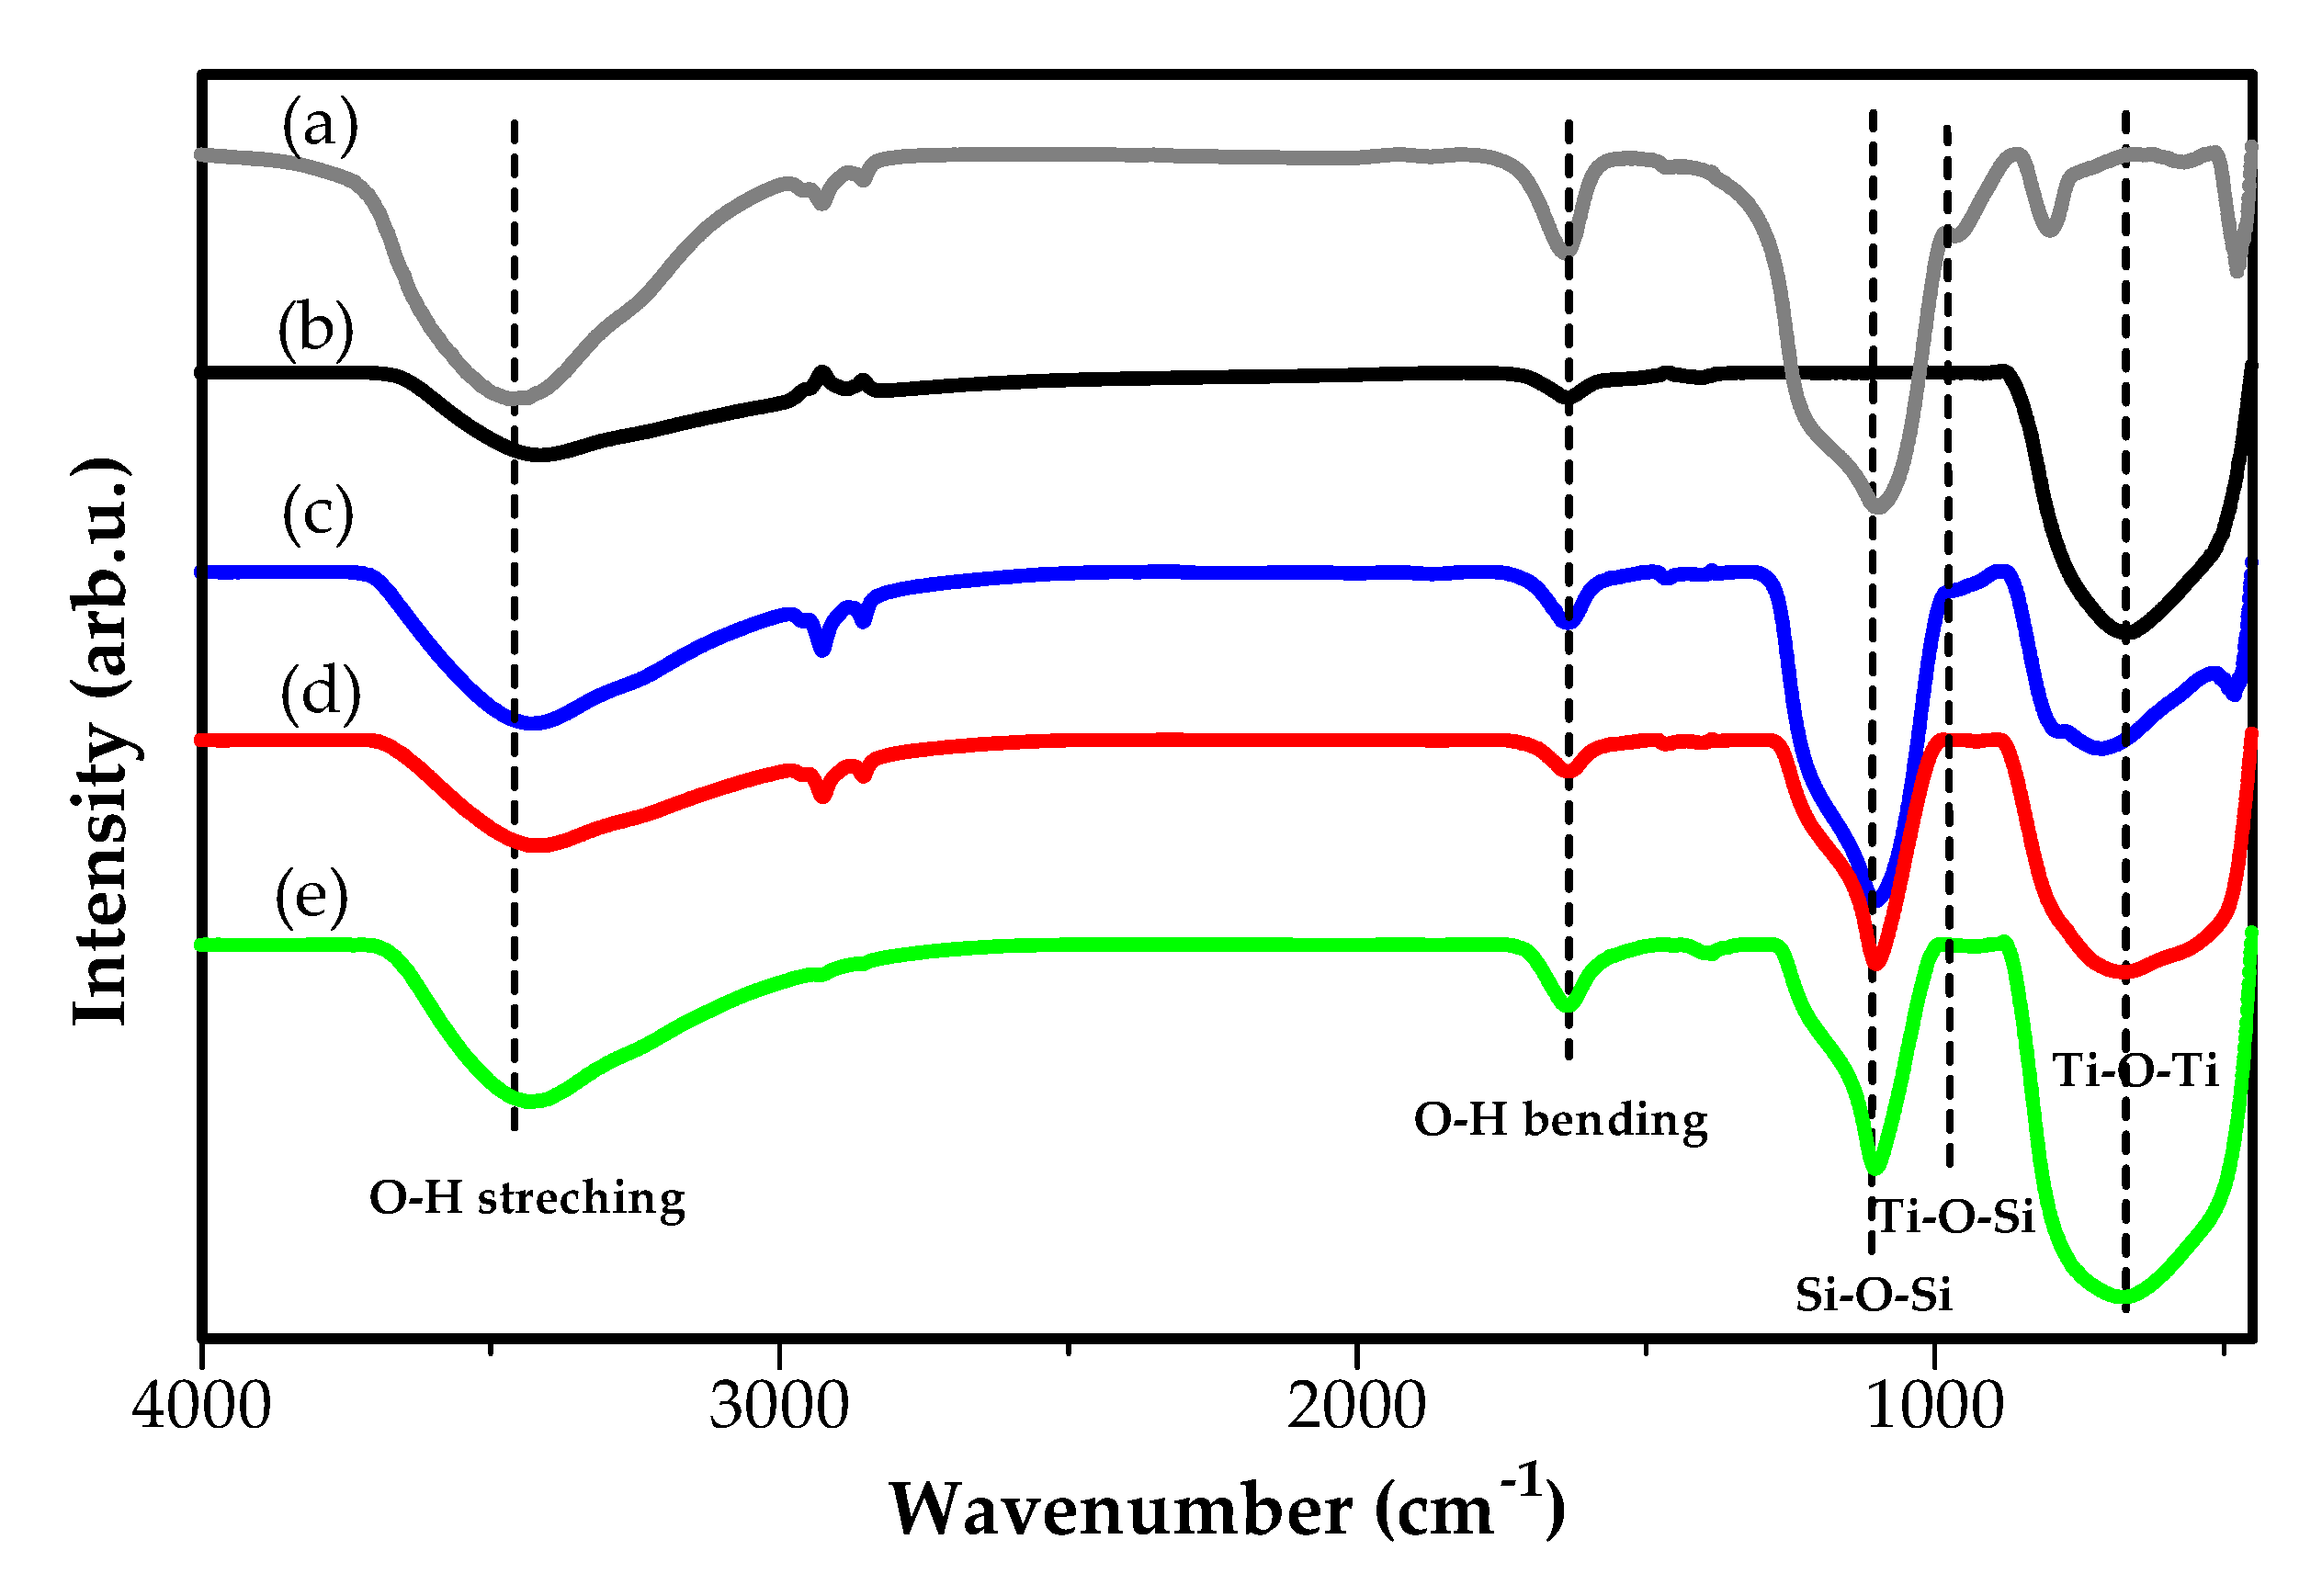
Figure 3.
The TiO2/SiO2 composite morphology by scanning electron microscopy (SEM).
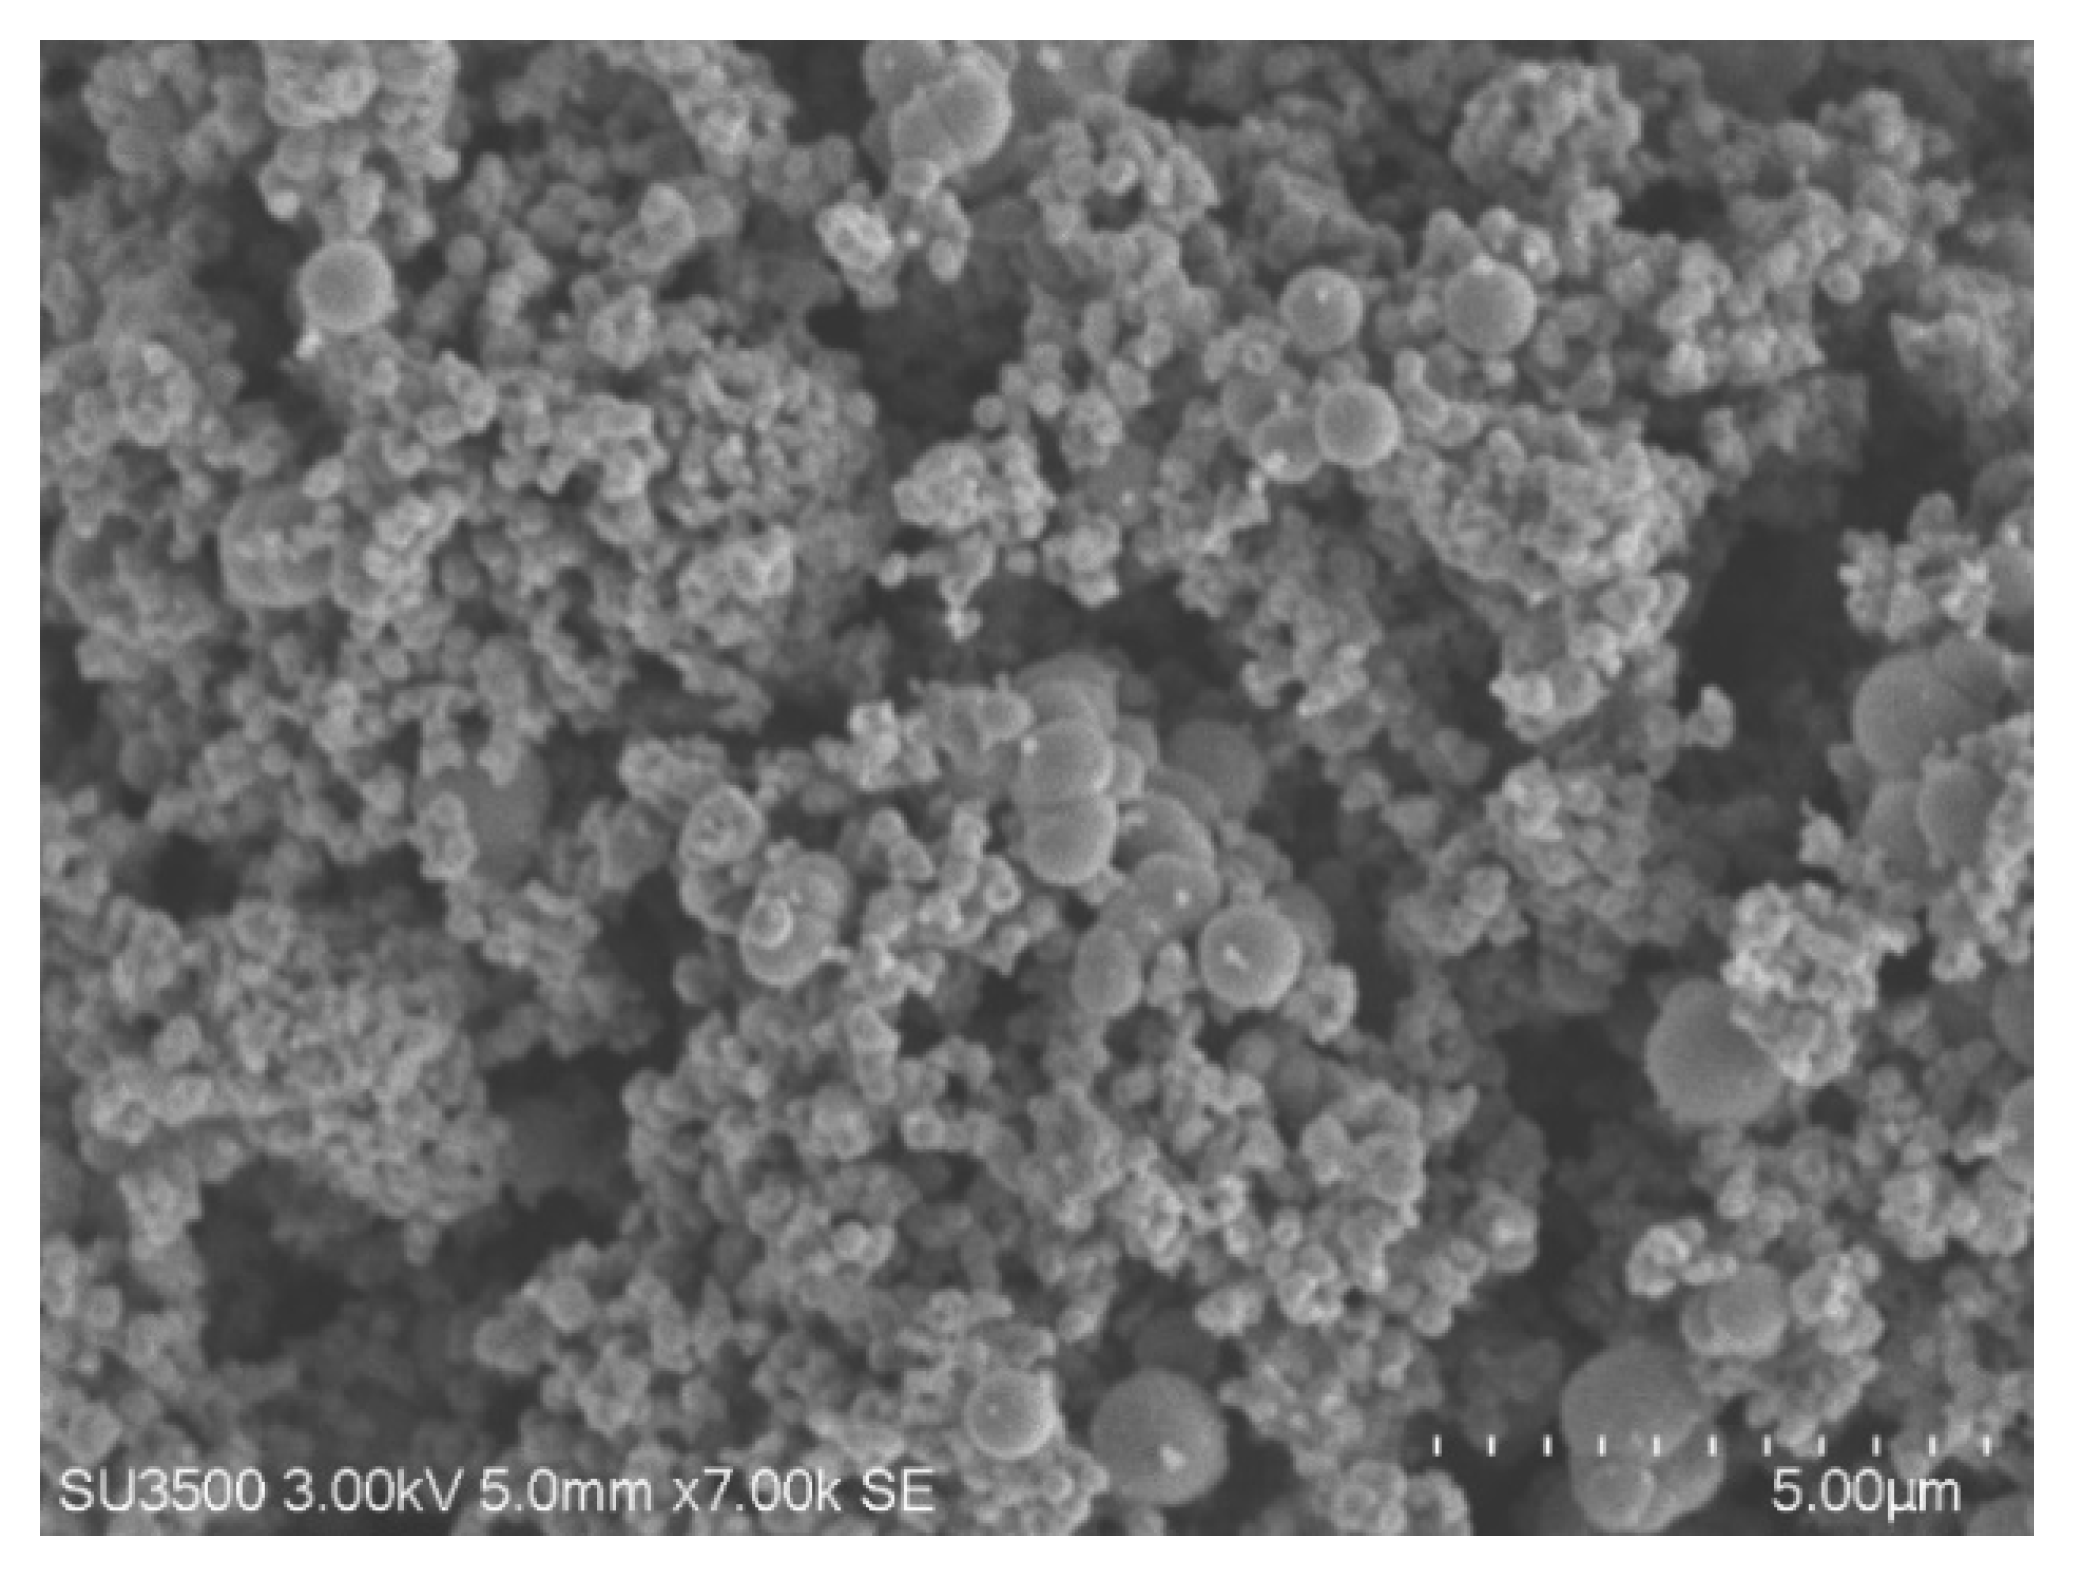
Figure 4.
EDS of TiO2/SiO2 composite.
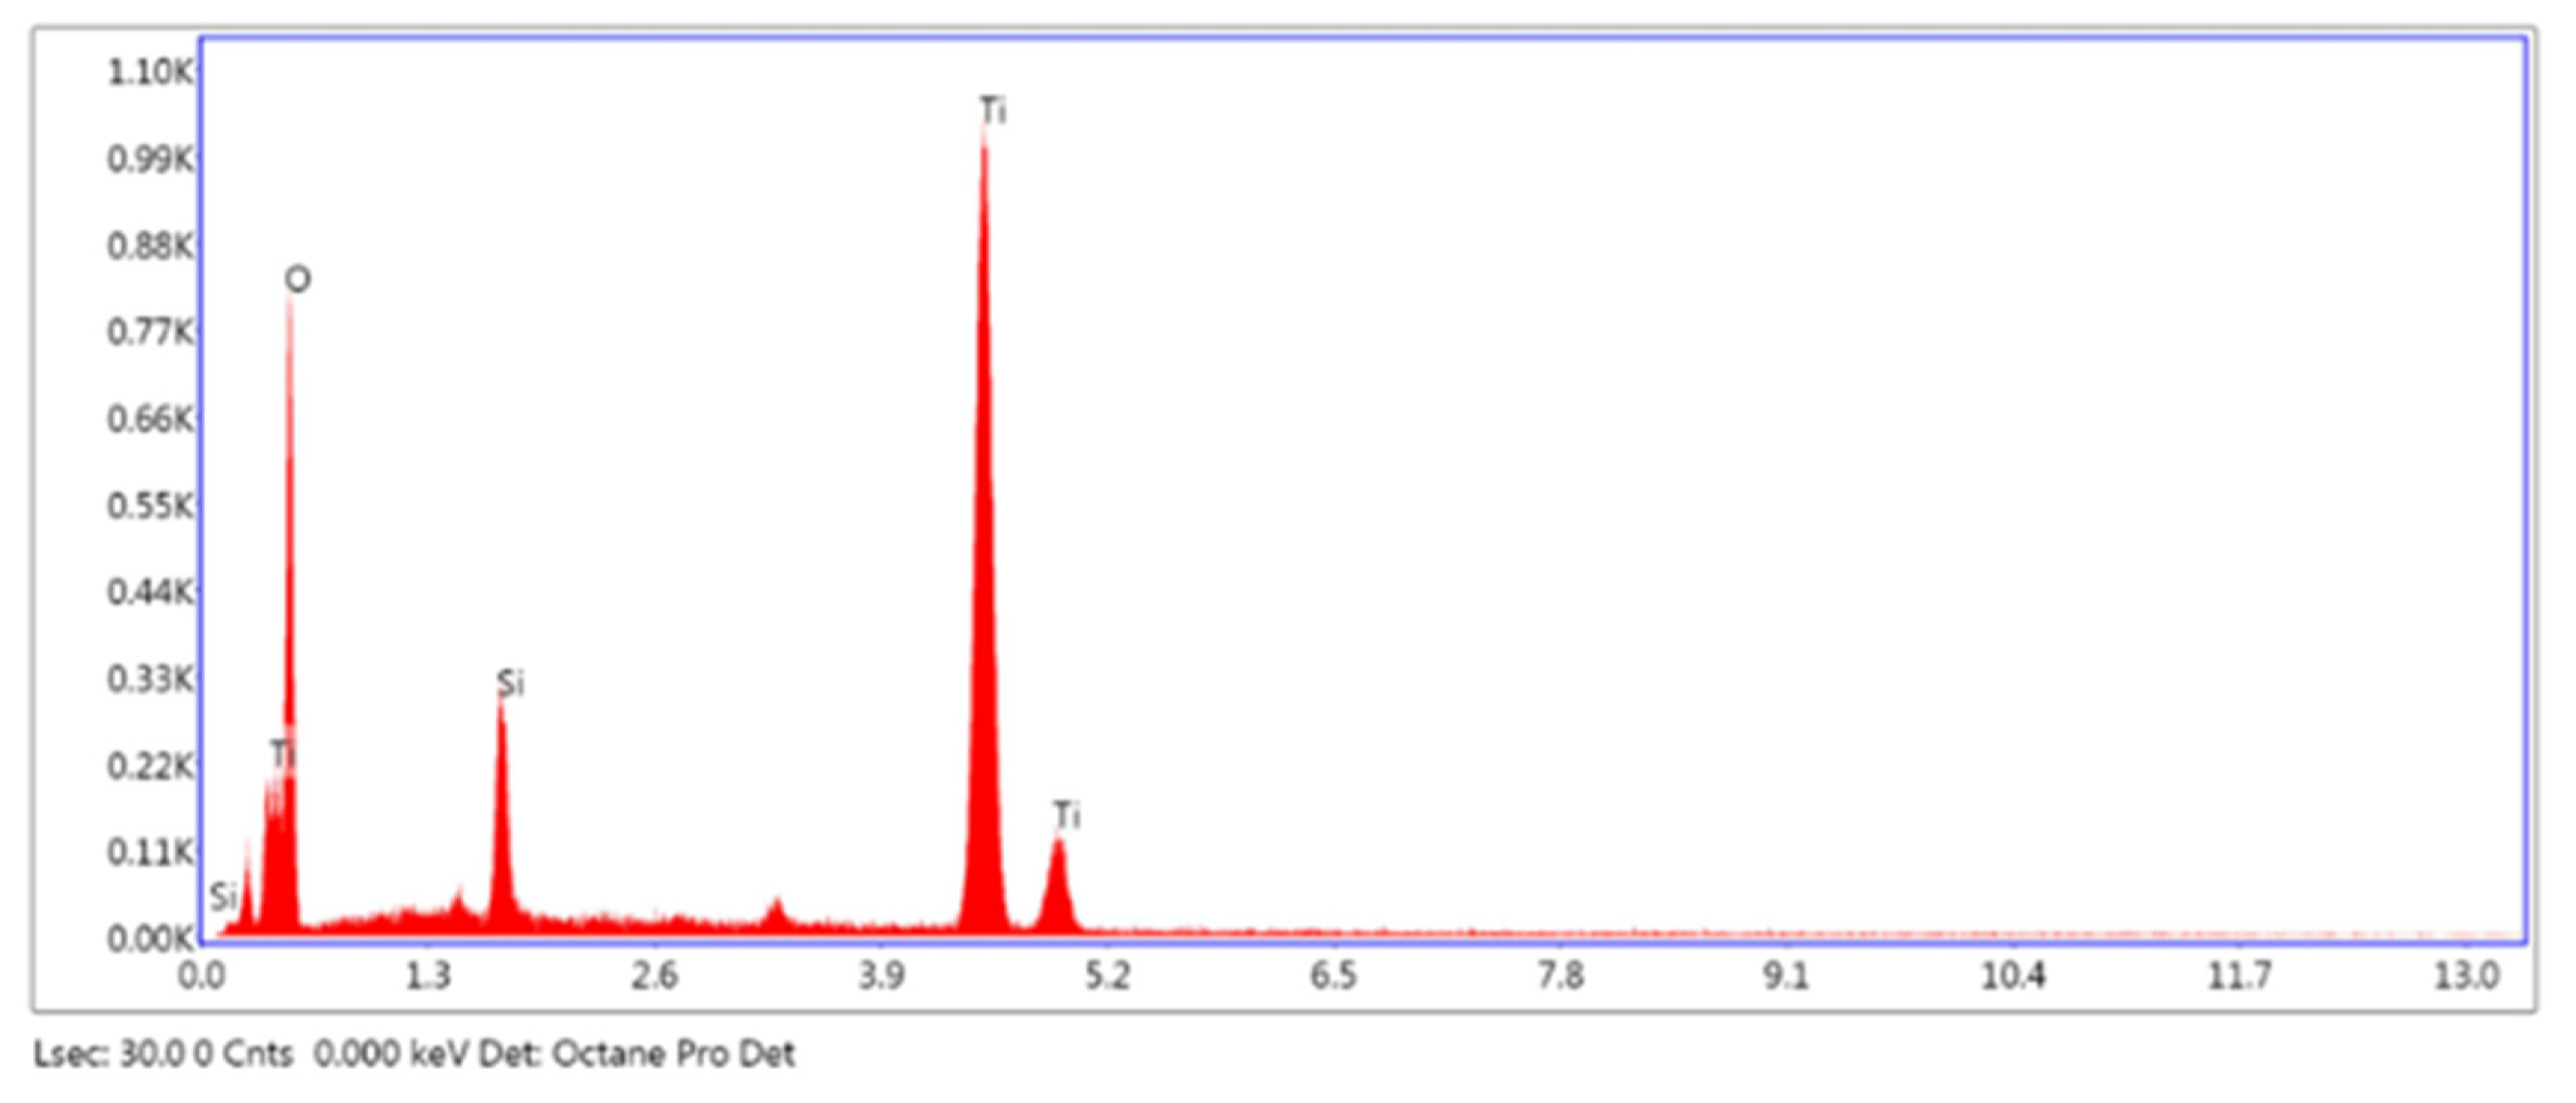
Figure 5.
(a) Adsorption activity and; (b) Photocatalytic activity of catalyst on Cr(VI). The experiment was conducted using 100 mL Cr(VI) ion solution 3 mg/L and 100 mg catalyst with 180 min treatment.
Figure 5.
(a) Adsorption activity and; (b) Photocatalytic activity of catalyst on Cr(VI). The experiment was conducted using 100 mL Cr(VI) ion solution 3 mg/L and 100 mg catalyst with 180 min treatment.
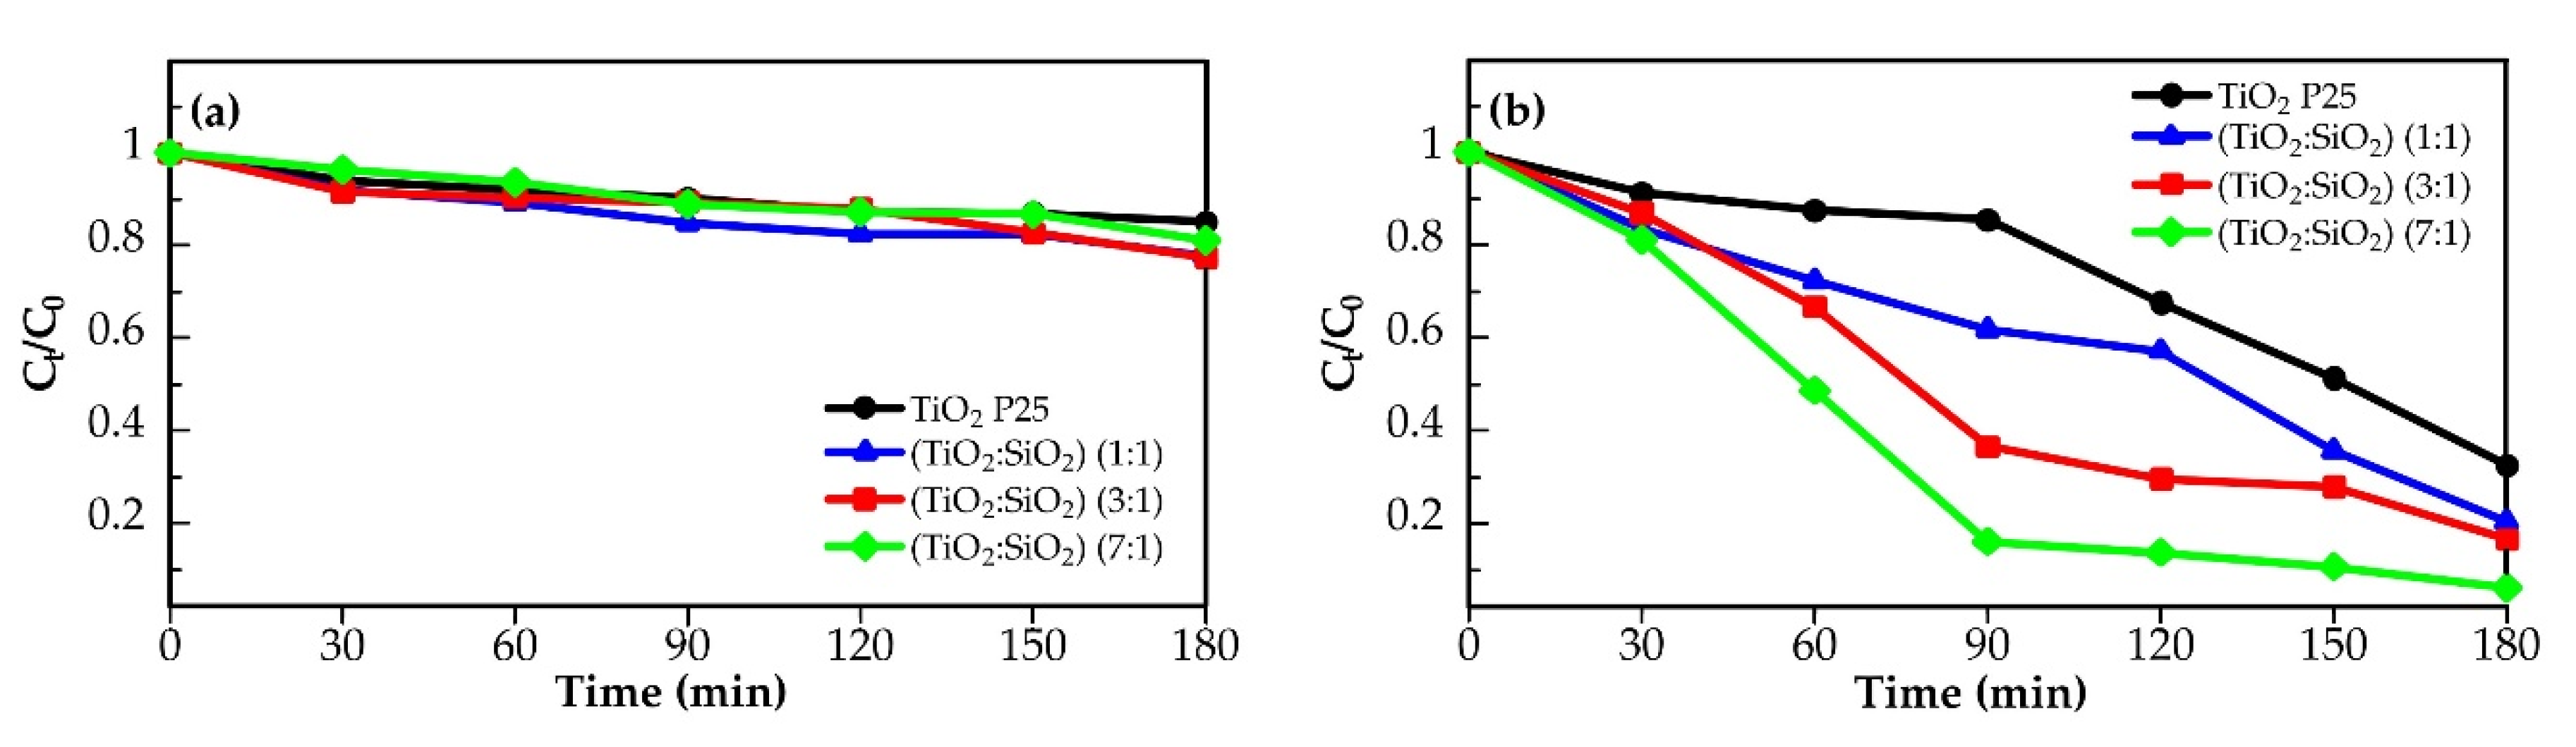
Figure 6.
(a) Adsorption activity and; (b) photocatalytic activity of catalyst on Pb(II). The experiment was conducted using 100 mL Pb(II) ion solution 40 mg/L and 100 mg catalyst with 180 min treatment.
Figure 6.
(a) Adsorption activity and; (b) photocatalytic activity of catalyst on Pb(II). The experiment was conducted using 100 mL Pb(II) ion solution 40 mg/L and 100 mg catalyst with 180 min treatment.
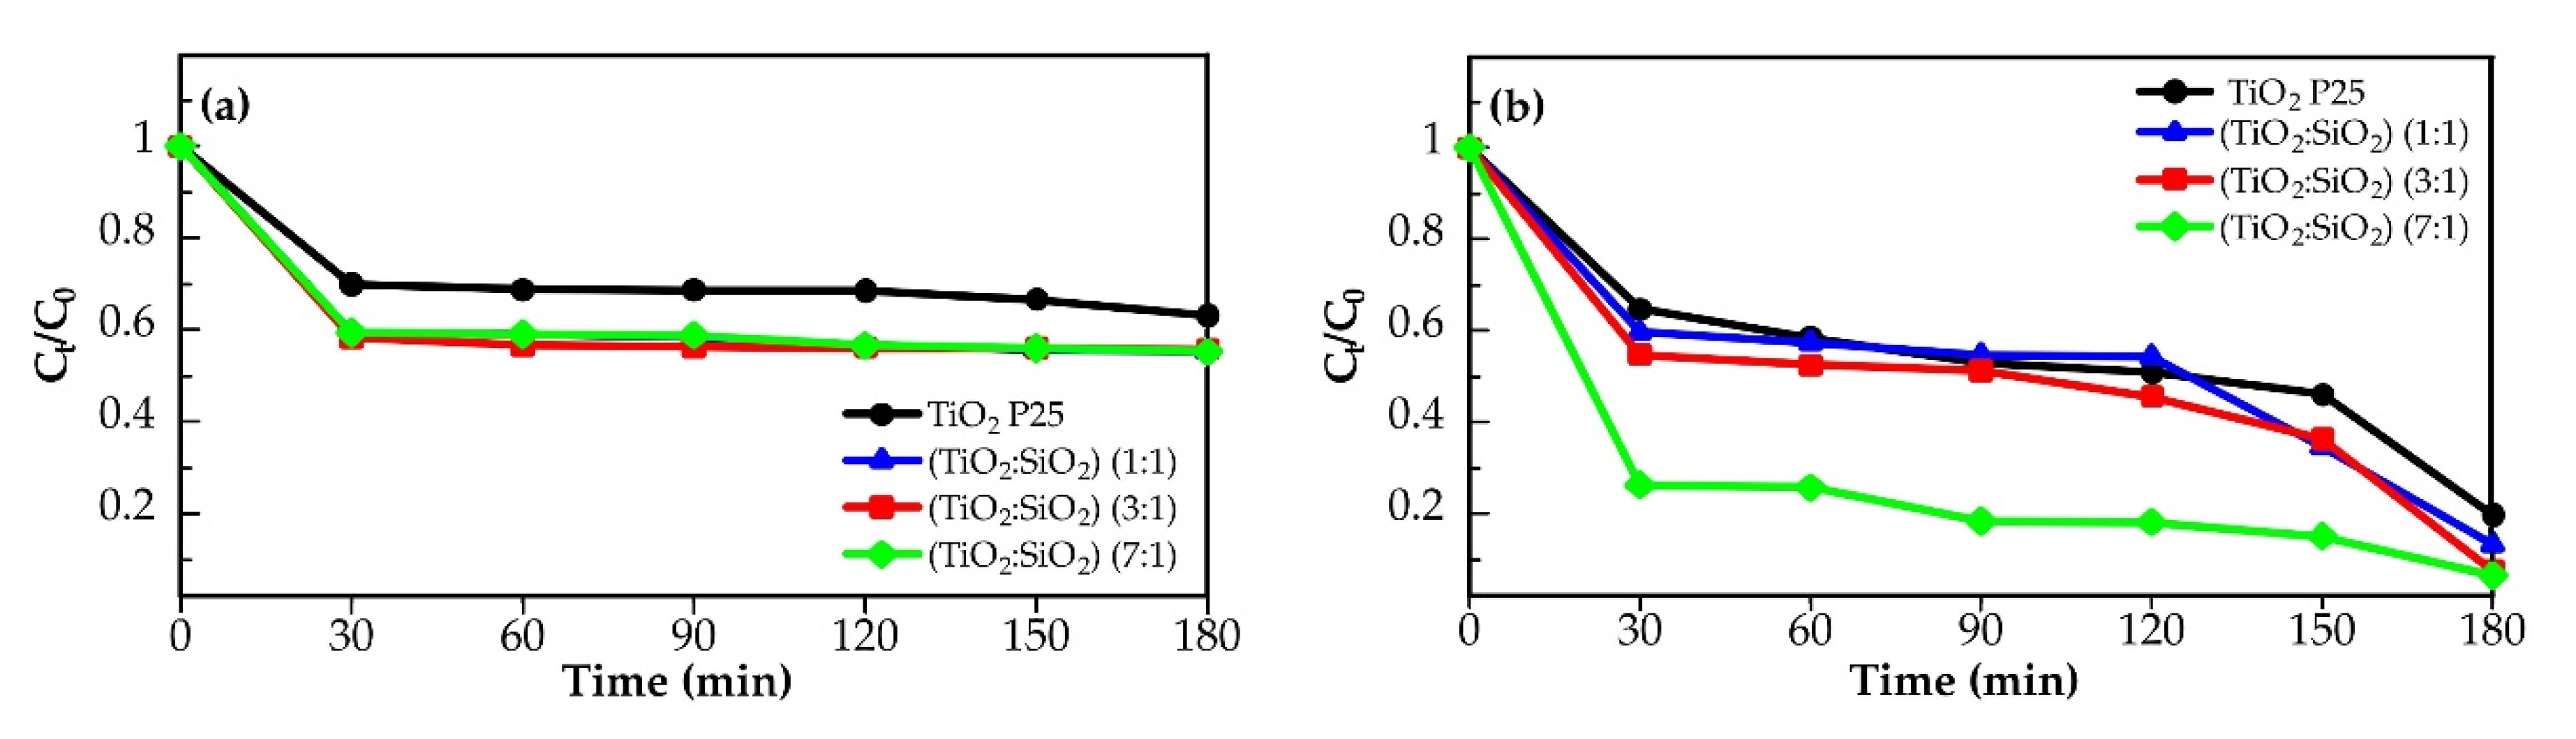
Figure 7.
(a) Efficiency of decreasing Cr(VI) concentrations and; (b) Pb(II) concentrations after ultraviolet (UV) irradiation for 180 min. The experiment was conducted using 100 mg catalyst.
Figure 7.
(a) Efficiency of decreasing Cr(VI) concentrations and; (b) Pb(II) concentrations after ultraviolet (UV) irradiation for 180 min. The experiment was conducted using 100 mg catalyst.


Table 1.
Percentage of anatase, rutile and amorphous SiO2 phase in photocatalysts.
| Photocatalysts | Phase (%) | ||
|---|---|---|---|
| Anatase | Rutile | Amorphous SiO2 | |
| TiO2 P25 | 85.7 | 14.3 | - |
| TiO2:SiO2 (1:1) | 49.0 | 6.5 | 44.4 |
| TiO2:SiO2 (3:1) | 69.0 | 8.3 | 22.6 |
| TiO2:SiO2 (7:1) | 97.9 | 0.9 | 1.2 |
Table 2.
The crystallite size of photocatalysts.
| Photocatalysts | Crystallite Size (nm) | ||
|---|---|---|---|
| Anatase | Rutile | Amorphous SiO2 | |
| TiO2 P25 | 32.84 | 22.59 | - |
| TiO2:SiO2 (1:1) | 8.79 | 9.01 | 2.57 |
| TiO2:SiO2 (3:1) | 11.79 | 7.16 | 2.59 |
| TiO2:SiO2 (7:1) | 11.58 | - | - |
Table 3.
Wavenumber of SiO2, TiO2 P25 and TiO2/SiO2 composite for FTIR characterization.
| Bond Type | SiO2 | TiO2 P25 | TiO2:SiO2 (1:1) | TiO2:SiO2 (3:1) | TiO2:SiO2 (7:1) |
|---|---|---|---|---|---|
| O–H streching | 3467 cm−1 | 3411 cm−1 | 3429 cm−1 | 3411 cm−1 | 3429 cm−1 |
| O–H bending | 1638 cm−1 | 1635 cm−1 | 1634 cm−1 | 1631 cm−1 | 1636 cm−1 |
| Si–O–Si | 1091 cm−1 | - | 1100 cm−1 | 1105 cm−1 | 1102 cm−1 |
| Ti–O–Ti | - | 667 cm−1 | 711 cm−1 | 671 cm−1 | 667 cm−1 |
| Ti–O–Si | - | - | 942 cm−1 | 958 cm−1 | 942 cm−1 |
Table 4.
TiO2/SiO2 composite particle size analysis (PSA) characterization.
| Particle Size | TiO2/SiO2 Ratio | ||
|---|---|---|---|
| 1:1 | 3:1 | 7:1 | |
| Median (nm) | 797.7 | 628.9 | 719.0 |
| Mode (nm) | 698.5 | 620.1 | 696.4 |
| Z-Average (nm) | 557.4 | 616.9 | 683.9 |
Table 5.
The kinetic study of photocatalysts.
| Photocatalysts | k (min−1) | r0 (mg/L·min) | R2 |
|---|---|---|---|
| Photocatalysis of Cr(VI): | |||
| TiO2 P25 | 0.0060 | 0.0180 | 0.9301 |
| TiO2:SiO2 (1:1) | 0.0084 | 0.0252 | 0.9462 |
| TiO2:SiO2 (3:1) | 0.0101 | 0.0303 | 0.9645 |
| TiO2:SiO2 (7:1) | 0.0162 | 0.0486 | 0.9559 |
| Photocatalysis of Pb(II): | |||
| TiO2 P25 | 0.0085 | 0.3400 | 0.9626 |
| TiO2:SiO2 (1:1) | 0.0105 | 0.4200 | 0.9224 |
| TiO2:SiO2 (3:1) | 0.0135 | 0.5400 | 0.9060 |
| TiO2:SiO2 (7:1) | 0.0143 | 0.5720 | 0.9443 |
Publisher’s Note: MDPI stays neutral with regard to jurisdictional claims in published maps and institutional affiliations. |
© 2020 by the authors. Licensee MDPI, Basel, Switzerland. This article is an open access article distributed under the terms and conditions of the Creative Commons Attribution (CC BY) license (http://creativecommons.org/licenses/by/4.0/).
Share and Cite
MDPI and ACS Style
Eddy, D.R.; Ishmah, S.N.; Permana, M.D.; Firdaus, M.L. Synthesis of Titanium Dioxide/Silicon Dioxide from Beach Sand as Photocatalyst for Cr and Pb Remediation. Catalysts 2020, 10, 1248. https://doi.org/10.3390/catal10111248
AMA Style
Eddy DR, Ishmah SN, Permana MD, Firdaus ML. Synthesis of Titanium Dioxide/Silicon Dioxide from Beach Sand as Photocatalyst for Cr and Pb Remediation. Catalysts. 2020; 10(11):1248. https://doi.org/10.3390/catal10111248
Chicago/Turabian StyleEddy, Diana Rakhmawaty, Soraya Nur Ishmah, Muhamad Diki Permana, and M. Lutfi Firdaus. 2020. "Synthesis of Titanium Dioxide/Silicon Dioxide from Beach Sand as Photocatalyst for Cr and Pb Remediation" Catalysts 10, no. 11: 1248. https://doi.org/10.3390/catal10111248
Note that from the first issue of 2016, this journal uses article numbers instead of page numbers. See further details here.