Discharge Enhancement Phenomenon and Streamer Control in Dielectric Barrier Discharge with Many Pores


1
School of Physics, Huazhong University of Science and Technology, Wuhan 430074, China
2
Department of Physics, Wuhan University of Technology, Wuhan 430074, China
3
School of Physics Science and Technology, Anshan Normal University, Anshan 114007, China
*
Authors to whom correspondence should be addressed.
Catalysts 2020, 10(1), 68; https://doi.org/10.3390/catal10010068
Submission received: 9 December 2019
/
Revised: 29 December 2019
/
Accepted: 30 December 2019
/
Published: 2 January 2020
(This article belongs to the Special Issue Nonthermal Plasma-Assisted Catalytic Reactions for Environmental Protection)
Abstract
:The surface and volume discharge enhancement phenomena and streamer propagation direction control in catalytic pores are significant for the plasma catalytic degradation of pollutants. In this work, we use a two-dimensional particle-in-cell with Monte Carlo collisions model to explore the effect of lateral voltage on streamer enhancement and streamer propagation control for different driving voltages in pores of various shapes, sizes, and numbers. The driving voltage is applied to the top of the device, while the lateral voltages are applied at the left and right sides of the device. The surface and volume discharge enhancement phenomena become more significant and streamer propagation is more restricted within a narrow channel as the lateral voltage (with the same values on the left and right sides) increases from −5 kV to −30 kV for a fixed driving voltage of −20 kV. In this case, both the volume and surface discharges are intensive, leading to highly concentrated plasma species in a narrow channel. Moreover, the streamer propagates in a straight direction, from top to the bottom plate, with the lateral voltage added on both sides. The streamer propagation, however, deviates from the center and is directed to the right side when the lateral voltage is applied to the left. Our calculations also indicate that increasing the number or size of the pores enhances both the volume and surface discharges.
1. Introduction
Due to the selectivity of catalytic materials and the high activity of plasma, plasma catalysis has been successfully applied to environmental protection activities. Plasma catalysis, an emerging branch of plasma processing, is thus attracting increasing attention [1,2,3,4,5,6,7,8]. In practice, two types of plasma catalysis exist according to the different positions of the catalyst: the single-stage type and the two-stage type [3]. In the single-stage type, the catalyst is placed inside the plasma discharging area, and two configurations exist: dielectric barrier discharge (DBD) [9,10,11] and corona discharge [1]. DBD is a kind of micro-discharge [12] in which the dielectric barriers are placed on the surface of the bare electrode. The filamentary mode [13] and Townsend mode [14] are two types of DBDs. Both can be operated at atmospheric pressure and generate non-equilibrium plasma [13]. The filamentary mode DBD can be treated as a streamer [15] and produces abundant plasma species without the need to heat the background gas remarkably.
DBD is used in many environmental protection and other applications, such as reduction of nitrogen oxides [2], abatement of volatile organic compounds (VOCs) [16,17,18], and so on [19]. Acetone, a VOC, is widely used as a solvent and paint thinner [20]. However, when using DBD to deal with pollution, toxic byproducts could be generated [21]. Adding a catalyst improves the effectiveness of pollution abatement [5]. Koo et al. [22] studied atmospheric pressure micro-discharge in porous ceramic to produce H2 from an H2O/SO2 gas mixture. Although they did not use conventional electrocatalysts such as Pt, the reaction between H2O and SO2 was efficiently promoted, possibly due to non-thermal electrons. Adding packing materials may efficiently advance the selectivity of plasma catalysis [6] and generate the additional synergetic effect of plasma catalysts [23]. Hensel et al. studied the plasma catalyst system by adopting direct current [24,25] and alternating current (AC) [26] high-voltage power. They found that micro-discharge could be generated in porous dielectric materials such as alumina (Al2O3) and cordierite (2MgO·2Al2O3·5SiO2). The pore size is one of the most critical parameters for atmospheric pressure micro-discharge. Stable and large-volume micro-discharges have been observed only for specific pore sizes such as 50 μm and 80 μm. The configuration chose in this work is similar to the experimental apparatus adopted by Hensel [24]. Moreover, Hensel [27] introduced two relatively new types of micro-discharges and found that applied voltage is also an important parameter. Above a certain voltage threshold, the discharge could propagate into the microporous ceramic foams from surface barrier discharge. By applying an AC voltage, Trinh et al. [28] proved experimentally that the combination of DBD plasma with annular porous multichannel monolithic ceramic-supported MnO2 catalysts could effectively enhance the decomposition of acetone while producing byproducts such as CO, CO2, HCHO, and CH3CHO. Given that CH4 is a powerful heat absorber and greenhouse gas, much research has been conducted on it. By combining dielectric barrier discharge and porous Ni/Al2O3 catalyst, Kameshima et al. [29] discovered a useful method for converting CH4 into value-added products such as H2 and CO.
Thus, experimental work has shed light on many electrical and optical properties of micro-discharge generation and propagation. Besides such experimental studies, many numerical simulations have been conducted to reveal the underlying mechanisms of micro-discharge [30,31,32,33,34]. Several methods could be used to study micro-discharge, including fluid and kinetics modeling as well as hybrid computational approaches. Most streamer dynamics are simulated by fluid models [35,36,37,38]. By adopting a fluid model of air at standard temperature and pressure, Luque et al. [35] simulated the propagation of double-headed (positive and negative) streamers in a homogeneous field of 50 kV cm−1 emerging from needle electrodes with voltages of 10–20 kV. Zhang et al. [36] implemented a two-dimensional fluid model for various pore sizes to investigate the generation and propagation of plasma catalysis micro-discharge. Their calculations indicated that the plasma could propagate into catalyst pores in the μm range and affect the plasma catalytic process. Moreover, they studied the effect of the material dielectric constant [37] and pore shape [38] on plasma catalysis. They found that plasma is intensive for dielectric constants below 300 for a pore size of 100 μm [37], and tip-like structures could enhance the electric field greatly [38].
On the other hand, dynamic or hybrid models are also widely adopted to reveal information about the kinetic features of the discharge. Using a three-dimensional hybrid computational model, Li et al. [39] studied streamer discharges in N2 and found that high-energy electrons were responsible for streamer propagation. The particle-in-cell [40]/Monte Carlo collision [41] model (PIC/MCC), a dynamic method, can efficiently simulate non-equilibrium state streamers. Zhang et al. [42] adopted a two-dimensional explicit PIC/MCC model to investigate micro-discharge in pore sizes in the micrometer and nanometer ranges. Streamers could propagate into pores, but it was difficult to differentiate between the volume and surface discharges in their work because the simulation area of the pores was too small. In our previous work [43], we also implemented a two-dimensional explicit PIC/MCC model to study surface and volume discharges in catalytic pores. We found that surface discharge is stronger than volume discharge. Zhang et al. [8,44] adopted a two-dimensional implicit PIC/MCC model to study plasma propagation in catalytic pores.
However, the effect of lateral voltages on streamer enhancement and streamer propagation control for different driving voltages in many pores of various shapes, sizes, and numbers has not been studied so far. Therefore, in this work, we use a two-dimensional explicit PIC/MCC model to investigate the effect of the lateral voltage on the properties of streamer formation and propagation in a DBD reactor containing numerous pores with smooth boundaries. Section 2 describes the simulation model. Section 3 presents the numerical results and discussion about the shape, size, numbers of the catalytic pores, the effects of the magnitude and direction of the applied voltage, and the effects of lateral voltage on the streamer enhancement phenomenon and streamer propagation control. Section 4 concludes this paper.
2. Simulation Model
2.1. Geometry and Physical Parameters
2.1.1. Geometry
Figure 1 displays the geometry of the DBD reactor used in this work. The simulated scale in the x and y directions is 2.0 mm and 1.65 mm, respectively. The yellow-colored area denotes the electrode. The blue and white-colored areas denote the dielectric material and discharge gap, respectively. The upper metal electrode ( mm, mm) is powered by a voltage of −8 to −32 kV. The left metal electrode ( mm, mm) and right metal electrode ( mm, mm) are powered by voltages of −5 to −60 kV. The voltage of the bottom metal electrode ( mm) is 0 kV. After a rise time of 0.1 ns, the applied voltage remains unchanged during the simulation period. Two dielectric plates, each of thickness 0.3 mm, cover the bottom and top electrodes, and several vertical pores (0–16) exist in the bottom dielectric plate. The dielectric coefficient of each dielectric plate is (the representative material is SiO2). The diameters and depths of these pores range from 0.0 to 0.1 mm and 0.0 to 0.2 mm, respectively. The pores and discharge gap ( mm, mm) are filled with air (N2:O2 = 80%:20%) at atmospheric pressure. N2 and O2 at a temperature of 300 K are considered to be the background and are evenly set in the simulation area. Streamers are easily generated under such circumstances.
2.1.2. Grid and Streamer
We divide the simulation space into 50,000 uniform grids, 1000 × 500. Each grid measures 2.0 × 3.3 μm. Under the applied voltage driving, seed electrons set under the top dielectric plate ( mm, mm) will spread down to the bottom dielectric plate and form streamers. The seed electrons are supplied by a current density of 105 am−2. Moreover, streamers formed from the seed electrons and propagating to the bottom dielectric plate give rise to electron and ion avalanches. Thus, we adopt a “particle merging algorithm” to merge the particles when their number in a grid exceeds 10. Rationally, the use of numerical parameters and consideration of numerical convergence are crucial to avoid incorrect results. To obtain the Debye length and electron frequency , it is important to use the correct time step and space step. These values were set to 10−14 s and 2.0 × 3.3 μm, respectively, in this work. As the results below show, we obtain the minimum Debye length and the maximum plasma frequency as approximately 10 μm and 3 × 10¹³ rad/s, respectively, for a maximum electron density of 1021 m−3. Thus, to ensure numerical convergence, the selected space step and time step should be ∼2 μm and 10−14 s, respectively. Otherwise, if the grid width exceeds 3, the PIC algorithm will become self-heating, leading to “fine grid instability”. In this work, self-heating is negligible as the grid width is not much larger than [45,46].
2.2. VSim
VSim [47,48], a widely tested technical commercial software product, is used to solve the electrostatic (ES) and electromagnetic fields and study the movements of individual particles [49,50,51,52]. The following two basic processes must be conducted to study the movement of streamers:
- (1)
- We need to obtain the charge-current density distribution and electromagnetic field distribution in the streamers to compute the particle movement paths.
- (2)
- Then, by summing the mean of all the particle paths, we can track the overall movement of the streamers.
Two numerical methods could be used to deal with streamers: the fluid and dynamic approaches. The PIC/MCC model is the basic model of VSim, a very useful dynamic method. The PIC/MCC model is preferred for simulation of non-equilibrium state streamers whose electron velocity distribution is typically non-Maxwellian. Therefore, the VSim model, including the ES solver and particle moving algorithm, could be used to investigate low-temperature plasma at atmospheric pressure. This work used VSim version 9.1.
2.3. Particle-In-Cell Algorithm
Unlike the fluid method, whose electron velocity follows a Maxwellian distribution, the PIC algorithm is adopted to simulate individual dynamic behavior, and the speeds of the electrons and ions are self-consistent. As per the logic of this algorithm, “macro particles” are set to denote various real charged particles, and the space is divided into computational grids. The PIC algorithm defines the electromagnetic field on grid points, and we adopt a uniform Cartesian mesh in this work.
2.3.1. Particle Moving: The Newton Equations
Briefly, the calculation process for particle moving is called the “particle moving procedure.” The time needed for one moving is known as the “time step” (t), and the particle moving process is conducted using the Newton equations, as follows:
n and denote the nth and th time step, respectively. The time step defined in this work is 10−14 s. The stability of the PIC algorithm and the Courant-Friedrichs-Lewy (CFL) condition limit the value range of t. The CFL condition is as follows:
2.3.2. Electric Field Solution: The Poisson Equation
In this work, we adopt the Poisson equation to solve the electric field. The Poisson equation is as follows:
To solve for electric potential in the Poisson equation, we adopt the Neumann boundary condition in the x direction and the Dirichlet boundary condition in the y direction. In this work, we define the PIC algorithm to solve the Poisson equation both in the discharge gap and the dielectric. However, we only need to solve the particle moving equation in the discharge gap given the dielectric barrier discharge properties. Moreover, should a charged particle arrive at the border or fall outside the simulation region, it will be absorbed, and a secondary electron will probably be emitted. The secondary electron emission coefficients for the dielectric surfaces of and are assumed to be the same as that of copper. In this work, we assume zero charge leak and zero electrical conductivity for the dielectric; specifically, we assume a perfect dielectric. The surface charge on the dielectric are calculated self-consistently by collecting all the charges deposited on it.
2.4. Reactions between Species: The Monte Carlo Collisions
This work considers several species: e, , , , N2, O2, and . “*” denotes the excitation states of both N2 and O2. We adopt the MCC method to deal with the reactions between the species. The reactions include electron-impact ionization, electron-impact excitation, elastic collision, and attachment, as seen in Table 1. The threshold energies data and cross sections are sourced from Ref. [53] and the LXCat database [54]. We consider molecules as the background and only trace the charged species.
3. Results and Discussion
In our previous works, we studied the filament discharge without pores [55] and with three pores [43]. We found that the surface discharge is enhanced on the surfaces of the catalyst pores compared with the micro-discharge inside the catalyst pores. However, the effect of a lateral voltage on the surface and volume discharge enhancement phenomena and the streamer propagation control for numerous pores of different shapes, sizes, and number were not considered. In this work, we investigate the effect law of these factors on the electron and ion densities, surface charge density, electric field, electron-impact ionization, and excitation rates in DBD with for both the top and bottom dielectric plates with pores. The effects of different dielectric constants are important. We have studied the effect of different dielectric constants of the dielectric barrier and found that streamers are difficult to propagate to the pores as the dielectric constants increasing from 2 to 100, which is similar to a published work [8]. Moreover, we cannot get any valuable information from it, so we did not put the results here.
3.1. Different Shapes of Catalytic Pores
Figure 2 and Figure 3 display the electron density (m−3) and surface charge density of (cm−2) for different catalyst pore shapes at 0.3 ns. The size of the catalyst pore is 0.2 mm in the depth direction, while the diameter is different for different pore shapes. The voltage of the upper electrode ( mm) is −20 kV, and the bottom electrode ( mm) is grounded. Before 0.3 ns, the streamer begins from the seed electron avalanches under the high driving voltage. The negative driving voltage drives the streamer to propagate from the upper plate to the lower plate, where a remarkable drift rate causes a new space-charge center at the streamer, thereby enlarging the streamer body [30,55]. Finally, the streamers propagate into the pores and produce plasma species inside the pores.
Some experiments have been operated to study porous dielectric discharge. Hensel et al. [24,25] reported stable discharge in porous dielectric material. As we know, it is difficult to experimentally measure discharge parameters such as electron and ion densities and reaction rates in detail. Thus, numerical simulations become indispensable in the study of porous dielectric discharge. It is worth mentioning that Zhang et al. [38] adopted a two-dimensional fluid model to study plasma properties for a steady glow discharge with one pore of different shapes. They found that the shape of the pore has a significant influence on electric field enhancement. Notably, tip-like structures could enhance the electric field significantly.
As shown in Figure 2 and Figure 3, the surface discharge is stronger than the volume discharge, which is in line with our previous study [43]. Note in this model, no symmetrical or periodical condition is assumed, which will produce non-symmetrical results, similar to [56]. The reason is that in this case, the streamers start from random seed electrons. Applied voltages push seed electrons moving to the bottom dielectric plate. During the process, the velocity and direction of seed electrons movement are random. The maximum value of surface charge () density occurs at the position where the streamer head arrives at in all cases. The maximum value is occurring in the vicinity of the pores or inside them, since streamers are propagating around the pores. The surface discharge and electric field are enhanced there, pushing the electrons and ions into the pores and generating more intensive plasma species along the surface of the pores. For example, the maximum value is approximately 2.8 × 10⁻³ cm−2 occurring between the trapezoidal and triangle pores in f1 in Figure 3.
Note even with different shapes of pores, the electron density and surface charge density are similar from our simulations. The reason is that the pores are small enough to enhance the local field, and thus the shapes will not affect the results significantly. However, the numerical schemes adopted in VSim [47,48] will treat the elliptical pores more accurate, as the shape is smoother. In order to compare with our previous work [43] better and reduce the possible numerical errors, in the following works we will all adopt elliptical pores.
3.2. Different Numbers of Catalytic Pores
As the number of pores increases, the surface discharge enhancement phenomenon becomes more significant. Figure 4 demonstrates the density (m−3) for different catalyst pore numbers (0, 1, 2, 3, 4, 6, 8, 12, and 16) at 0.3 ns. The diameter and depth of the catalyst pore are 0.1 mm and 0.2 mm, respectively. The voltage of the upper electrode ( mm) is −20 kV, and the bottom electrode ( mm) is grounded.
As the pore number increases from 0 to 16, more intensive surface and volume discharges occur in the pores. Thus, more reactive species are generated in the pores (such as electrons, , , and ), which are relevant for the active surface in plasma catalysis. To better understand this phenomenon, we present the density of for different catalyst pore numbers, as seen in Figure 4. Highly concentrated electrons and ions are generated in the catalyst pores, enhancing plasma catalysis and providing the advantages of highly efficient reactivity and selectivity [5,6]. Achieving such advantages would be challenging in porous catalyst experiments.
The maximum value of the density is 3.4 × 10²³ m−3. As in our previous study [43], the maximum value appears on the surfaces of the pores. Abundant ions on the surface of the porous catalyst could improve the efficiency of plasma catalysis. One example is the elimination of 2-heptanone [57], a hazardous gaseous waste produced by anthropogenic activities. Ayrault et al. [57] selected 2-heptanone as the VOC [58,59] model molecule. Using a plasma catalytic device, which combines the highly efficient reactivity of plasma technology and the selectivity of catalysis, they improved the dissociation efficiency of 2-heptanone from less than 50% to 97%.
3.3. Different Catalytic Pore Sizes
Figure 5 displays the densities (m−3) of different catalyst pore sizes at 0.3 ns with 16 pores in the bottom plate. The sizes of the catalyst pore are 0.0 × 0.0 (a), 0.01 × 0.02 (b), 0.02 × 0.04 (c), 0.04 × 0.08 (d), 0.06 × 0.12 (e), and 0.08 × 0.16 mm (f). The voltage of the upper electrode ( mm) is −20 kV, and the bottom electrode ( mm) is grounded.
Both volume discharge and surface discharge occur in the pores, which agrees with the predictions in Refs. [8,44]. The pore size increases from 0 × 0 mm to 0.08 × 0.16 mm, surface discharge becomes dominant, and the maximum value of the density is 1.3 × 10²³ m−3, all of which agree with the predictions in Ref. [60]. These high-density ions could be used for improving the efficiency of the plasma catalysis process.
3.4. Different Applications of Top Voltage
Figure 6 and Figure 7 demonstrate the distributions of the electron-impact O2 ionization rates (m−3s−1) and electric field distributions (Vm−1) for different driving voltages applied at the top. The bottom plate has 16 pores. The diameter and depth of the catalyst pore are 0.1 mm and 0.2 mm, respectively. The voltage of the upper electrode ( mm) varies from −8 kV to −32 kV, and the bottom electrode ( mm) is grounded.
At the top, the applied voltage first increases from −8 kV to −32 kV, and the surface discharge is dominant. Then, both the surface and volume discharges are enhanced with sufficiently large driving voltage. Similar to the prediction in Ref. [38], the electric field is significantly enhanced near tip-like structures. As shown in Figure 7, the maximum value of the electric field, 1.0 × 10⁸ Vm−1, appears at the bottom of the catalytic pores, consistent with our previous study [43]. As seen in Figure 6, the maximum value of the electron-impact O2 ionization rate is 7.5 × 10²² m−3 s−1. This value is as large as that in our previous work [43], 5.4 × 10²² m−3 s−1. Compared with the case without pores [43,55], the presence of pores likely enhances the ionization rate in a restricted region, which could effectively accelerate the chemical reaction rate and increase the surface discharge in the catalyst pores. The active surface of the catalyst could result in a stronger electric field along the pore sidewalls. In turn, the stronger electric field could further enhance the surface discharge. The electric field on the surfaces of the pores is much higher than that within their interiors. Thus, surface streamers could develop faster than volume streamers. However, when the external voltage is too large (over −20 kV), it is difficult to distinguish between surface discharge and volume discharge. Thus, this work adopted −20 kV as the appropriate external voltage to study plasma catalysis properties.
3.5. Effect of Lateral Voltage
Figure 8 demonstrates the distributions of the electron-impact N2 excitation rates (m−3s−1) for different left and right lateral voltages. The bottom plate has 16 pores. The diameter and depth of the catalyst pore are 0.1 mm and 0.2 mm, respectively. The voltage of the upper electrode ( mm) is −20 kV. The voltages of the left and right electrodes are varied from −5 to −60 kV. The bottom electrode ( mm) is grounded.
When lateral voltage is added to one side and its value increases from −10 to −60 kV, the direction of streamer propagation gradually biases to the other side. When the lateral voltage increases to −60 kV, the streamer does not even arrive at the bottom plate. However, irrespective of the change in the direction of the streamer, the surface discharge is always stronger than the volume discharge [43].
When lateral voltage is added to two sides and its value increases from −5 to −30 kV, the direction of streamer propagation is almost vertical. Moreover, the surface discharge and volume discharge are both enhanced. As the volume discharge increases sharply, it is quite difficult to differentiate between them. Notably, when the left and right voltages are −30 kV, the volume discharge is stronger than the surface discharge. As the lateral voltage restricts the streamer propagation in the vertical direction, the streamers cannot spread along the pore surface. The streamers propagate directly into the pores. Moreover, the lateral voltage is so powerful that the streamers propagate within a narrow propagation channel only, thus realizing streamer propagation control. When streamers arrive at the surfaces of the pores, surface ionization waves exert a weak effect in the transverse direction. The electrons and ions are rebounded back to the pores, which enhances volume discharge. Hence, our results reveal a stronger transfer of volume discharge than surface discharge in the catalyst pores. The propagation direction of the streamer is controlled by intense lateral voltage and spread within a narrow propagation aisle. Volume discharge and surface discharge are concentrated and intensive.
Plasma catalysis is generating much interest, given the combined advantages of selectivity from catalysis and highly efficient reactivity from the plasma process [5,6]. This kind of configuration could generate abundant plasma species, enhance the efficiency of plasma catalysis, and improve the plasma catalysis process. There are varies potential applications for such a configuration, such as significantly improving the conversion and energy efficiencies of the synthesis of materials [4] and the treatment of greenhouse gas [29]. Furthermore, with lateral voltage, the prorogation of streamers can be controlled, and it may be used for gas switches [61] and other industrial applications such as oxidation of acetone [28].
In general, the size and numbers of catalytic pores, size of the applied top voltage, and magnitude and direction of the applied lateral voltage could affect the surface discharge and volume discharge enhancement phenomena as well as the propagation direction of streamers.
- (1)
- As the number of pores increases, the discharge enhancement phenomenon becomes increasingly distinct.
- (2)
- As the pore size increases from 0 × 0 mm to 0.08 × 0.16 mm, the surface and volume discharges are more easily distinguished.
- (3)
- As the top applied voltage increases from −8 to −32 kV, the surface and volume discharge enhancement phenomena become apparent.
- (4)
- When the top voltage is −20 kV, as the left and right voltages (of the same size) increase from −5 to −30 kV, streamer propagation is restricted within a narrow channel.
As the volume discharge and surface discharge are both concentrated and intensive in catalyst pores, they could generate abundant plasma species, enhance the efficiency of plasma catalysis, and improve the plasma catalysis degradation process of pollutants.
4. Conclusions
Using a two-dimensional PIC/MCC model, we investigate the effect of lateral voltages on the surface and volume discharge enhancement phenomena and streamer propagation control in DBD with numerous micro-sized pores of different shapes, sizes, and numbers. We obtain the optimum discharge enhancement and propagation direction of streamers for different magnitudes of applied top and lateral voltage. The PIC model is a two-dimensional explicit and ES arithmetic model, while the MCC model is adopted to deal with the reactions of electrons and ions. The background gas is air (N2:O2 = 80%:20%) under atmospheric pressure. The external voltages vary from −5 to −60 kV, and the electrodes are covered by SiO2 with .
Our calculations indicate that the magnitude and direction of the applied lateral voltage could affect the streamer enhancement phenomenon and control the streamer propagation direction, and both surface discharge and volume discharge are enhanced. The streamer propagation is strongly restricted within a narrow channel with sufficiently large lateral voltages of the same value added on both sides. Notably, when the left and right voltages are applied, the volume discharge is stronger than the surface discharge. The streamer propagates directly into the pores. The volume discharge and surface discharge are both intensive, generate highly concentrated plasma species, enhance the efficiency of plasma catalysis, and improve the plasma catalysis process.
Moreover, the size and number of catalytic pores, as well as the magnitude of the top driving voltage could affect the surface and volume discharge enhancement phenomena: (1) As the number of pores increases from 0 to 16, more intensive surface and volume discharges occur on the pore surfaces and within the pores, and the surface and volume discharge enhancement phenomena become significant due to the increase in volume for ionization collisions. (2) As the pore size increases from 0 × 0 mm to 0.08 × 0.16 mm, the surface discharge enhancement phenomena become more obvious. (3) As the top applied voltage increases from −8 to −32 kV, many plasma species are generated on the pore surface and inside the pores, thus enhancing both surface discharge and volume discharge. Our results predict the mechanisms of the surface discharge and volume discharge enhancement phenomena, which are of great significance for deeper understanding of plasma catalysis and enhancing the efficiency of this process.
Author Contributions
Writing the original draft, J.-G.G.; Conceptualization, Y.Z.; Formal analysis, Y.Z., W.J.; Software, H.-Y.W.; Refining the draft, P.Z. All authors have read and agreed to the published version of the manuscript.
Funding
This research was funded by the National Natural Science Foundation of China (11775164 and 11775090), National Magnetic Confinement Fusion Energy Research Project (2017YFE0301805 and 2017YFE0301803), and Fundamental Research Funds for the Central Universities (WUT: 2017IVA79 and 2018IB011).
Acknowledgments
The authors are very grateful to Ming-Xiang Gao for providing assistance with the figures.
Conflicts of Interest
The authors declare no conflict of interest.
Abbreviations
The following abbreviations are used in this manuscript:
| DBD | dielectric barrier discharge |
| PIC | particle-in-cell |
| MCC | Monte Carlo collision |
| VOC | volatile organic compound |
| AC | alternating current |
| ES | electrostatic |
| CFL | Courant-Friedrichs-Lewy |
References
- Neyts, E.C.; Bogaerts, A. Understanding Plasma Catalysis through Modelling and Simulation—A Review. J. Phys. D Appl. Phys. 2014, 47, 224010. [Google Scholar] [CrossRef]
- Van Durme, J.; Dewulf, J.; Leys, C.; Van Langenhove, H. Combining Non-Thermal Plasma with Heterogeneous Catalysis in Waste Gas Treatment: A Review. Appl. Catal. B Environ. 2008, 78, 324–333. [Google Scholar] [CrossRef] [Green Version]
- Chen, H.L.; Lee, H.M.; Chen, S.H.; Chao, Y.; Chang, M.B. Review of Plasma Catalysis on Hydrocarbon Reforming for Hydrogen Production–Interaction, Integration, and Prospects. Appl. Catal. B Environ. 2008, 85, 1–9. [Google Scholar] [CrossRef]
- Neyts, E.C.; Ostrikov, K.K.; Sunkara, M.K.; Bogaerts, A. Plasma Catalysis: Synergistic Effects at the Nanoscale. Chem. Rev. 2015, 115, 13408–13446. [Google Scholar] [CrossRef]
- Holzer, F.; Roland, U.; Kopinke, F.D. Combination of Non-Thermal Plasma and Heterogeneous Catalysis for Oxidation of Volatile Organic Compounds: Part 1. Accessibility of the Intra-Particle Volume. Appl. Catal. B Environ. 2002, 38, 163–181. [Google Scholar] [CrossRef]
- Holzer, F.; Kopinke, F.D.; Roland, U. Influence of Ferroelectric Materials and Catalysts on the Performance of Non-Thermal Plasma (NTP) for the Removal of Air Pollutants. Plasma Chem. Plasma Process. 2005, 25, 595–611. [Google Scholar] [CrossRef]
- Whitehead, J.C. Plasma–Catalysis: The Known Knowns, the Known Unknowns and the Unknown Unknowns. J. Phys. D Appl. Phys. 2016, 49, 243001. [Google Scholar] [CrossRef]
- Zhang, Q.Z.; Wang, W.Z.; Bogaerts, A. Importance of Surface Charging during Plasma Streamer Propagation in Catalyst Pores. Plasma Sources Sci. Technol. 2018, 27, 065009. [Google Scholar] [CrossRef] [Green Version]
- Babaeva, N.Y.; Kushner, M.J. Self-Organization of Single Filaments and Diffusive Plasmas during a Single Pulse in Dielectric-Barrier Discharges. Plasma Sources Sci. Technol. 2014, 23, 065047. [Google Scholar] [CrossRef]
- Fan, W.L.; Sheng, Z.M.; Zhong, X.X.; Wang, W.M.; Li, Y.T.; Zhang, J. Particle Simulation of Filamentary Structure Formation in Dielectric Barrier Discharge. Appl. Phys. Lett. 2013, 102, 094103. [Google Scholar] [CrossRef]
- Fan, W.L.; Sheng, Z.M.; Liu, F.C.; Zhong, X.X.; Dong, L.F. Mechanisms of Fine Structure Formation in Dielectric Barrier Discharges. Phys. Plasmas 2018, 25, 023502. [Google Scholar] [CrossRef] [Green Version]
- Kushner, M.J. Modeling of Microdischarge Devices: Pyramidal Structures. J. Appl. Phys. 2004, 95, 846–859. [Google Scholar] [CrossRef] [Green Version]
- Bruggeman, P.; Brandenburg, R. Atmospheric Pressure Discharge Filaments and Microplasmas: Physics, Chemistry and Diagnostics. J. Phys. D Appl. Phys. 2013, 46, 464001. [Google Scholar] [CrossRef]
- Nikandrov, D.; Tsendin, L.D. Low-Frequency Dielectric-Barrier Discharge in the Townsend Mode. Tech. Phys. 2005, 50, 1284–1294. [Google Scholar] [CrossRef]
- Luque, A.; Ebert, U. Density Models for Streamer Discharges: Beyond Cylindrical Symmetry and Homogeneous Media. J. Comput. Phys. 2012, 231, 904–918. [Google Scholar] [CrossRef] [Green Version]
- Whitehead, J.C. Plasma Catalysis: A Solution for Environmental Problems. Pure Appl. Chem. 2010, 82, 1329–1336. [Google Scholar] [CrossRef]
- Kim, H.H.; Ogata, A.; Futamura, S. Oxygen Partial Pressure-Dependent Behavior of Various Catalysts for the Total Oxidation of VOCs Using Cycled System of Adsorption and Oxygen Plasma. Appl. Catal. B Environ. 2008, 79, 356–367. [Google Scholar] [CrossRef]
- Morent, R.; Leys, C.; Dewulf, J.; Neirynck, D.; Durme, J.; Van Langenhove, H. DC-Excited Non-Thermal Plasmas for VOC Abatement. J. Adv. Oxid. Technol. 2007, 10, 127–136. [Google Scholar]
- Kogelschatz, U. Collective Phenomena in Volume and Surface Barrier Discharges. J. Phys. Conf. Ser. 2010, 257, 012015. [Google Scholar] [CrossRef] [Green Version]
- Narengerile; Watanabe, T. Acetone Decomposition by Water Plasmas at Atmospheric Pressure. Chem. Eng. Sci. 2012, 69, 296–303. [Google Scholar] [CrossRef]
- Van Durme, J.; Dewulf, J.; Sysmans, W.; Leys, C.; Van Langenhove, H. Efficient Toluene Abatement in Indoor Air by a Plasma Catalytic Hybrid System. Appl. Catal. B Environ. 2007, 74, 161–169. [Google Scholar] [CrossRef]
- Koo, I.G.; Choi, M.Y.; Kim, J.H.; Cho, J.H.; Lee, W.M. Microdischarge in Porous Ceramics with Atmospheric Pressure High Temperature H2O/SO2 Gas Mixture and Its Application for Hydrogen Production. Jpn. J. Appl. Phys. 2008, 47, 4705–4709. [Google Scholar] [CrossRef]
- Roland, U.; Holzer, F.; Kopinke, F.D. Combination of Non-Thermal Plasma and Heterogeneous Catalysis for Oxidation of Volatile Organic Compounds: Part 2. Ozone decomposition and deactivation of λ-Al2O3. Appl. Catal. B Environ. 2005, 58, 217–226. [Google Scholar] [CrossRef]
- Hensel, K.; Matsui, Y.; Katsura, S.; Mizuno, A. Generation of Microdischarges in Porous Materials. Czechoslov. J. Phys. 2004, 54, C683. [Google Scholar] [CrossRef]
- Hensel, K.; Katsura, S.; Mizuno, A. DC Microdischarges inside Porous Ceramics. IEEE Trans. Plasma Sci. 2005, 33, 574–575. [Google Scholar] [CrossRef]
- Hensel, K.; Martišovitš, V.; Machala, Z.; Janda, M.; Leštinský, M.; Tardiveau, P.; Mizuno, A. Electrical and Optical Properties of AC Microdischarges in Porous Ceramics. Plasma Process. Polym. 2007, 4, 682–693. [Google Scholar] [CrossRef]
- Hensel, K. Microdischarges in Ceramic Foams and Honeycombs. Eur. Phys. J. D 2009, 54, 141–148. [Google Scholar] [CrossRef]
- Trinh, H.Q.; Mok, Y.S. Plasma-Catalytic Oxidation of Acetone in Annular Porous Monolithic Ceramic- Supported Catalysts. Chem. Eng. J. 2014, 251, 199–206. [Google Scholar] [CrossRef]
- Kameshima, S.; Mizukami, R.; Yamazaki, T.; Prananto, L.A.; Nozaki, T. Interfacial Reactions between DBD and Porous Catalyst in Dry Methane Reforming. J. Phys. D Appl. Phys. 2018, 51, 114006. [Google Scholar] [CrossRef]
- Wang, M.C.; Kunhardt, E.E. Streamer Dynamics. Phys. Rev. A 1990, 42, 2366. [Google Scholar] [CrossRef]
- Kulikovsky, A.A. Two-Dimensional Simulation of the Positive Streamer in N2 between Parallel-Plate Electrodes. J. Phys. D Appl. Phys. 1995, 28, 2483–2493. [Google Scholar] [CrossRef]
- Kang, W.S.; Park, J.M.; Kim, Y.; Hong, S.H. Numerical Study on Influences of Barrier Arrangements on Dielectric Barrier Discharge Characteristics. IEEE Trans. Plasma Sci. 2003, 31, 504–510. [Google Scholar] [CrossRef]
- Montijn, C.; Hundsdorfer, W.; Ebert, U. An Adaptive Grid Refinement Strategy for the Simulation of Negative Streamers. J. Comput. Phys. 2006, 219, 801–835. [Google Scholar] [CrossRef] [Green Version]
- Chanrion, O.; Neubert, T. A PIC-MCC Code for Simulation of Streamer Propagation in Air. J. Comput. Phys. 2008, 227, 7222–7245. [Google Scholar] [CrossRef]
- Luque, A.; Ratushnaya, V.; Ebert, U. Positive and Negative Streamers in Ambient Air: Modelling Evolution and Velocities. J. Phys. D Appl. Phys. 2008, 41, 234005. [Google Scholar] [CrossRef] [Green Version]
- Zhang, Y.R.; Van Laer, K.; Neyts, E.C.; Bogaerts, A. Can Plasma Be Formed in Catalyst Pores? A Modeling Investigation. Appl. Catal. B Environ. 2016, 185, 56–67. [Google Scholar] [CrossRef]
- Zhang, Y.R.; Neyts, E.C.; Bogaerts, A. Influence of the Material Dielectric Constant on Plasma Generation inside Catalyst Pores. J. Phys. Chem. C 2016, 120, 25923–25934. [Google Scholar] [CrossRef]
- Zhang, Y.R.; Neyts, E.C.; Bogaerts, A. Enhancement of Plasma Generation in Catalyst Pores with Different Shapes. Plasma Sources Sci. Technol. 2018, 27, 055008. [Google Scholar] [CrossRef]
- Li, C.; Ebert, U.; Hundsdorfer, W. 3D Hybrid Computations for Streamer Discharges and Production of Run-Away Electrons. J. Phys. D Appl. Phys. 2009, 42, 202003. [Google Scholar] [CrossRef] [Green Version]
- Soria-Hoyo, C.; Pontiga, F.; Castellanos, A. Two Dimensional Numerical Simulation of Gas Discharges: Comparison between Particle-in-Cell and FCT Techniques. J. Phys. D Appl. Phys. 2008, 41, 205206. [Google Scholar] [CrossRef]
- Zhang, Y.; Huang, J.L.; Yi, L.; Wang, H.Y.; Jiang, W. Electron Energy Probability Function Modulation with External Electron Beam in Capacitive Coupled Radio Frequency Discharges. Plasma Process. Polym. 2018, 15, 1700169. [Google Scholar] [CrossRef]
- Zhang, Y.; Wang, H.Y.; Zhang, Y.R.; Bogaerts, A. Formation of Microdischarges inside a Mesoporous Catalyst in Dielectric Barrier Discharge Plasmas. Plasma Sources Sci. Technol. 2017, 26, 054002. [Google Scholar] [CrossRef]
- Gu, J.G.; Zhang, Y.; Gao, M.X.; Wang, H.Y.; Zhang, Q.Z.; Yi, L.; Jiang, W. Enhancement of Surface Discharge in Catalyst Pores in Dielectric Barrier Discharges. J. Appl. Phys. 2019, 125, 153303. [Google Scholar] [CrossRef]
- Zhang, Q.Z.; Bogaerts, A. Propagation of a Plasma Streamer in Catalyst Pores. Plasma Sources Sci. Technol. 2018, 27, 035009. [Google Scholar] [CrossRef]
- Matyash, K.; Schneider, R.; Taccogna, F.; Hatayama, A.; Longo, S.; Capitelli, M.; Tskhakaya, D.; Bronold, F.X. Particle in Cell Simulation of Low Temperature Laboratory Plasmas. Contrib. Plasma Phys. 2007, 47, 595–634. [Google Scholar] [CrossRef]
- Wang, H.Y.; Jiang, W.; Sun, P.; Kong, L.B. On the Energy Conservation Electrostatic Particle-in-Cell/Monte Carlo Simulation: Benchmark and Application to the Radio Frequency Discharges. Chin. Phys. B 2014, 23, 035204. [Google Scholar] [CrossRef] [Green Version]
- Nieter, C.; Cary, J.R. VORPAL: A Versatile Plasma Simulation Code. J. Comput. Phys. 2004, 196, 448–473. [Google Scholar] [CrossRef]
- Tech-X Corporation. VSim Reference Manual. 2018. Available online: www.txcorp.com (accessed on 30 January 2018).
- Pearlman, M.; Browning, J. Simulation of a Distributed Cathode in a Linear-Format Crossed-Field Amplifier. IEEE Trans. Plasma Sci. 2018, 46, 2497–2504. [Google Scholar] [CrossRef]
- Lécz, Z.; Andreev, A.; Konoplev, I.; Seryi, A.; Smith, J. Trains of Electron Micro-Bunches in Plasma Wake-Field Acceleration. Plasma Phys. Control. Fusion 2018, 60, 075012. [Google Scholar] [CrossRef]
- Zhang, H.; Konoplev, I.V.; Doucas, G.; Smith, J. Concept of a Tunable Source of Coherent THz Radiation Driven by a Plasma Modulated Electron Beam. Phys. Plasmas 2018, 25, 043111. [Google Scholar] [CrossRef]
- Likhanskii, A. Particle-in-Cell Modeling of the Pulsed DBD Plasma Actuator. In Proceedings of the 40th Fluid Dynamics Conference and Exhibit, Chicago, IL, USA, 28 June–1 July 2010. [Google Scholar] [CrossRef]
- Pancheshnyi, S.; Biagi, S.; Bordage, M.C.; Hagelaar, G.J.M.; Morgan, W.L.; Phelps, A.V.; Pitchford, L.C. The LXCat Project: Electron Scattering Cross Sections and Swarm Parameters for Low Temperature Plasma Modeling. Chem. Phys. 2012, 398, 148–153. [Google Scholar] [CrossRef]
- Plasma Data Exchange Project. Itikawa Database, Morgan Database. Retrieved on 11 June 2015. Available online: www.lxcat.net (accessed on 11 June 2015).
- Zhang, Y.; Wang, H.Y.; Jiang, W.; Bogaerts, A. Two-Dimensional Particle-in Cell/Monte Carlo Simulations of a Packed-Bed Dielectric Barrier Discharge in Air at Atmospheric Pressure. New J. Phys. 2015, 17, 083056. [Google Scholar] [CrossRef] [Green Version]
- Levko, D.; Pachuilo, M.; Raja, L.L. Particle-in-cell modeling of streamer branching in CO2 gas. J. Phys. D Appl. Phys. 2014, 50, 354004. [Google Scholar] [CrossRef]
- Ayrault, C.; Barrault, J.; Blin-Simiand, N.; Jorand, F.; Pasquiers, S.; Rousseau, A.; Tatibouët, J.M. Oxidation of 2-Heptanone in Air by a DBD-Type Plasma Generated within a Honeycomb Monolith Supported Pt-Based Catalyst. Catal. Today 2004, 89, 75–81. [Google Scholar] [CrossRef]
- Veerapandian, S.K.P.; Leys, C.; De Geyter, N.; Morent, R. Abatement of VOCs Using Packed Bed Non-Thermal Plasma Reactors: A Review. Catalysts 2017, 7, 113. [Google Scholar] [CrossRef]
- Sultana, S.; Vandenbroucke, A.M.; Leys, C.; De Geyter, N.; Morent, R. Abatement of VOCs with Alternate Adsorption and Plasma-Assisted Regeneration: A Review. Catalysts 2015, 5, 718–746. [Google Scholar] [CrossRef]
- Gao, M.; Zhang, Y.; Wang, H.; Guo, B.; Zhang, Q.; Bogaerts, A. Mode Transition of Filaments in Packed-Bed Dielectric Barrier Discharges. Catalysts 2018, 8, 248. [Google Scholar] [CrossRef] [Green Version]
- Thoma, C.; Welch, D.R.; Rose, D.V.; Zimmerman, W.R.; Miller, C.L.; Clark, R.E.; Schwarz, J.; Rambo, P.; Savage, M.E.; Woodworth, J.R. Fully Kinetic Particle-in-Cell Simulations of Triggered Three-Electrode Gas Switches. In Proceedings of the 2013 19th IEEE Pulsed Power Conference (PPC), San Francisco, CA, USA, 16–21 June 2013; pp. 1–6. [Google Scholar] [CrossRef]
Figure 1.
Geometry used in the model.
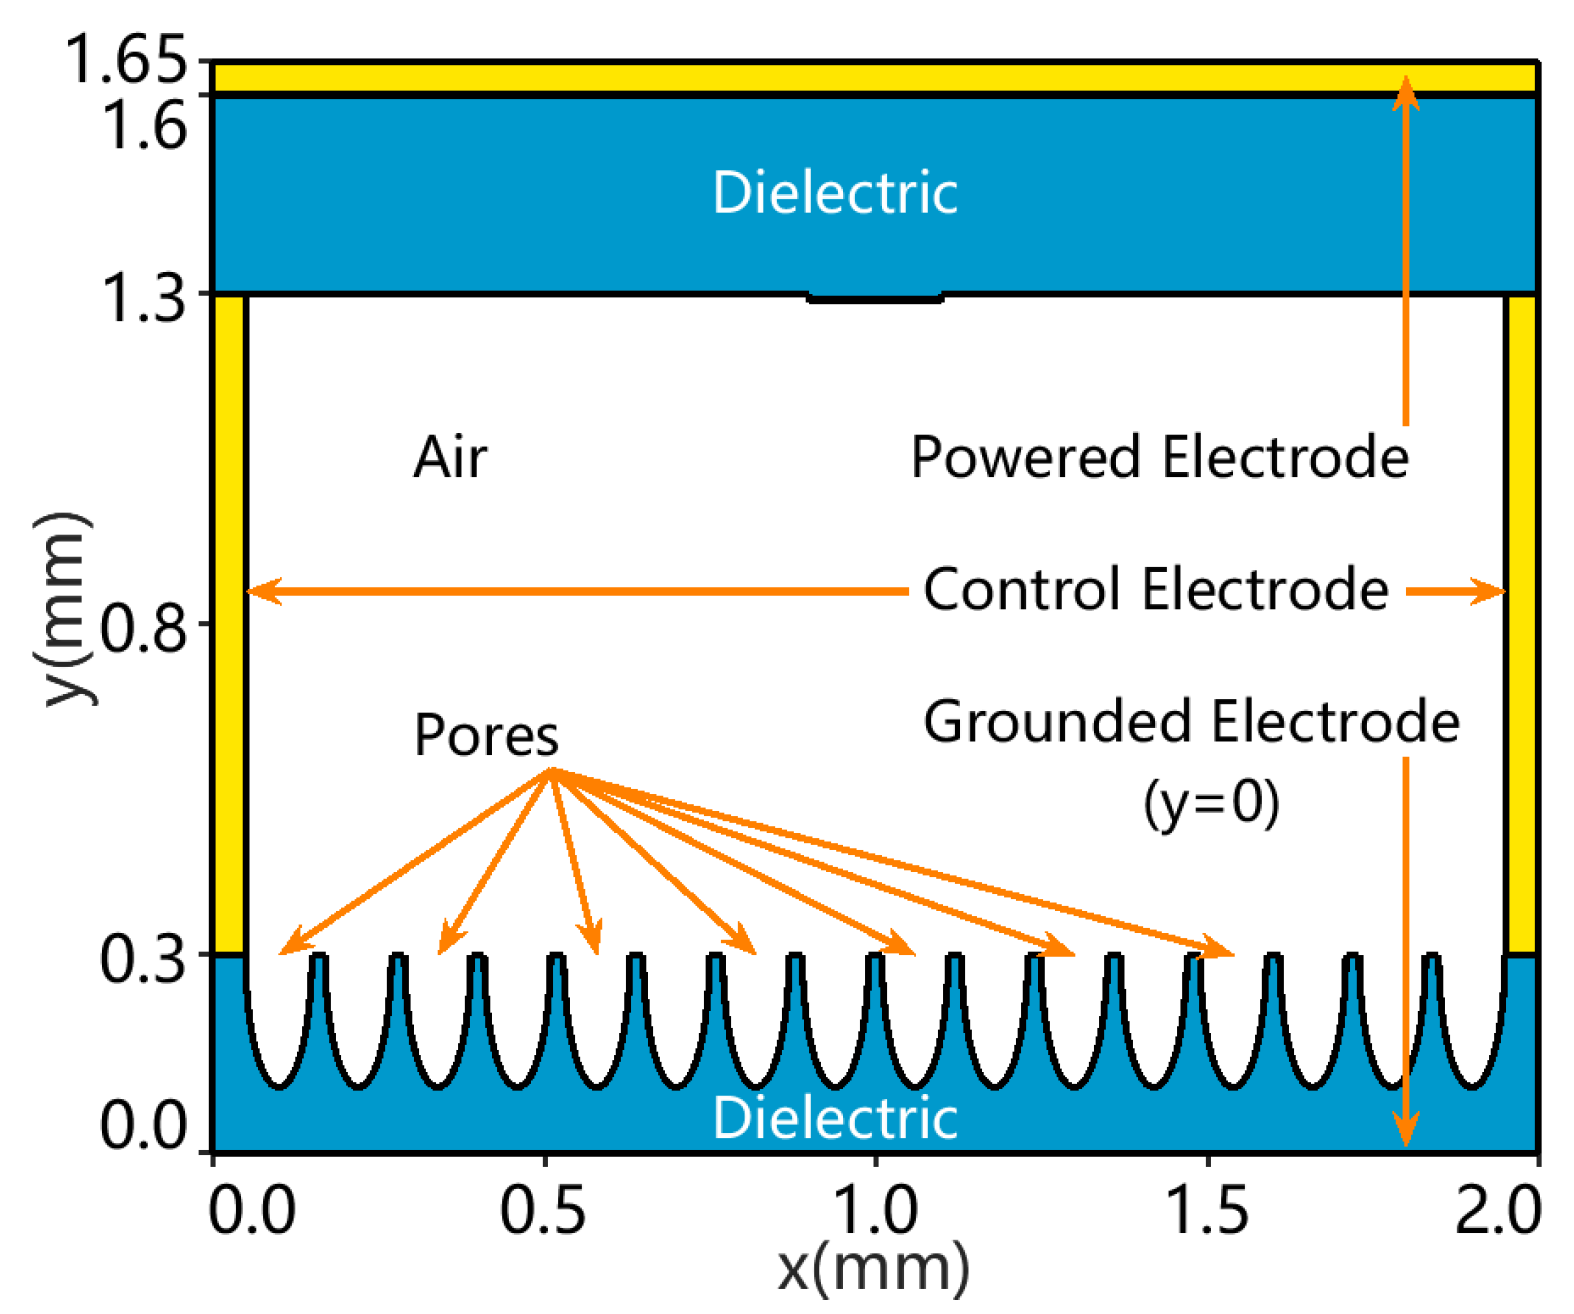
Figure 2.
Electron densities (m−3) of different catalyst pore shapes at 0.3 ns in DBD with for both the top and bottom dielectric plates. The shapes of catalyst pores are ellipse and rectangle (a1,a2), ellipse and trapezoid (b1,b2), ellipse and triangle (c1,c2), rectangle and trapezoid (d1,d2), rectangle and triangle (e1,e2), trapezoid and triangle (f1,f2). The size of the catalyst pore is 0.2 mm in the depth direction. The voltage of the upper electrode ( mm) is −20 kV, and the bottom electrode ( mm) is grounded.

Figure 3.
Surface charge densities of (cm−2) for different catalyst pore shapes at 0.3 ns for the same conditions as in Figure 2.
Figure 3.
Surface charge densities of (cm−2) for different catalyst pore shapes at 0.3 ns for the same conditions as in Figure 2.

Figure 4.
densities (m−3) with different catalyst pore numbers at 0.3 ns in DBD with for both the top and bottom dielectric plates. The numbers of catalyst pores are 0 (a), 1 (b), 2 (c), 3 (d), 4 (e), 6 (f), 8 (g), 12 (h), and 16 (i). The diameter and depth of the catalyst pore are 0.1 mm and 0.2 mm, respectively. The voltage of the upper electrode ( mm) is −20 kV, and the bottom electrode ( mm) is grounded.
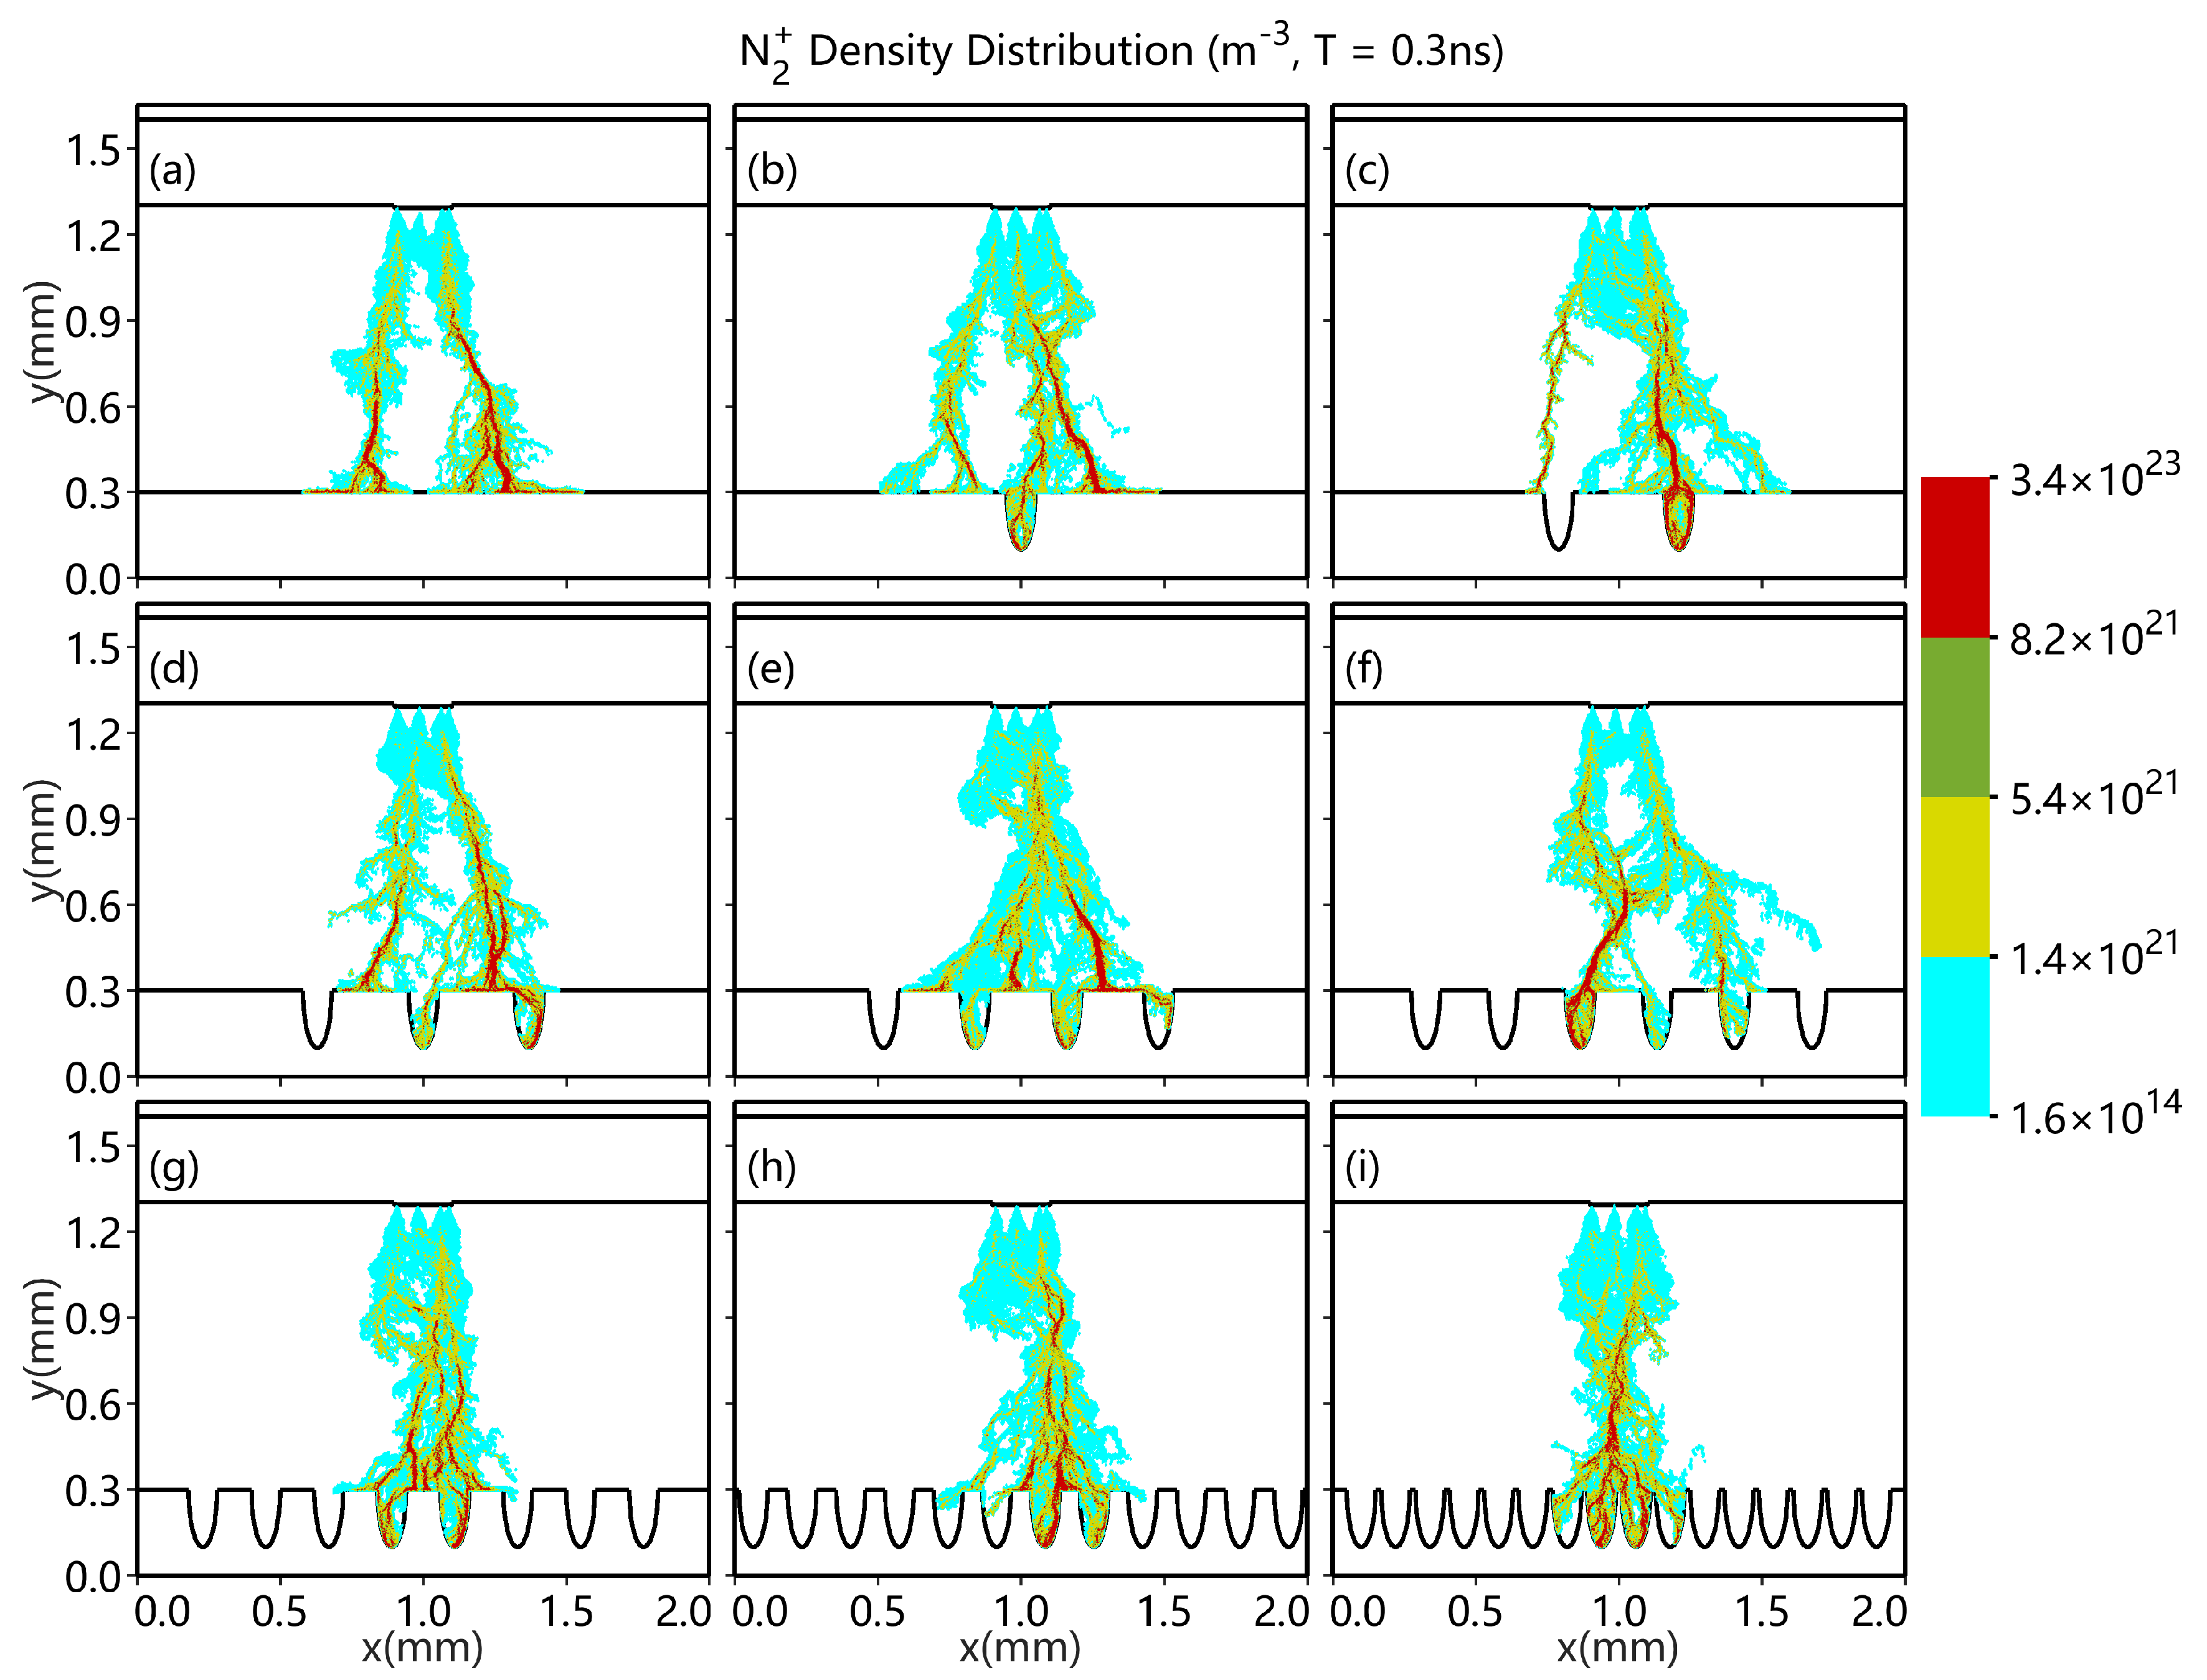
Figure 5.
densities (m−3) of different catalyst pore sizes at 0.3 ns in DBD with for both the top and bottom dielectric plates. The bottom dielectric plate has 16 pores. The sizes of the catalyst pores are 0.0 × 0.0 (a), 0.01 × 0.02 (b), 0.02 × 0.04 (c), 0.04 × 0.08 (d), 0.06 × 0.12 (e), and 0.08 × 0.16 mm (f). The voltage of the upper electrode ( mm) is −20 kV, and the bottom electrode ( mm) is grounded.
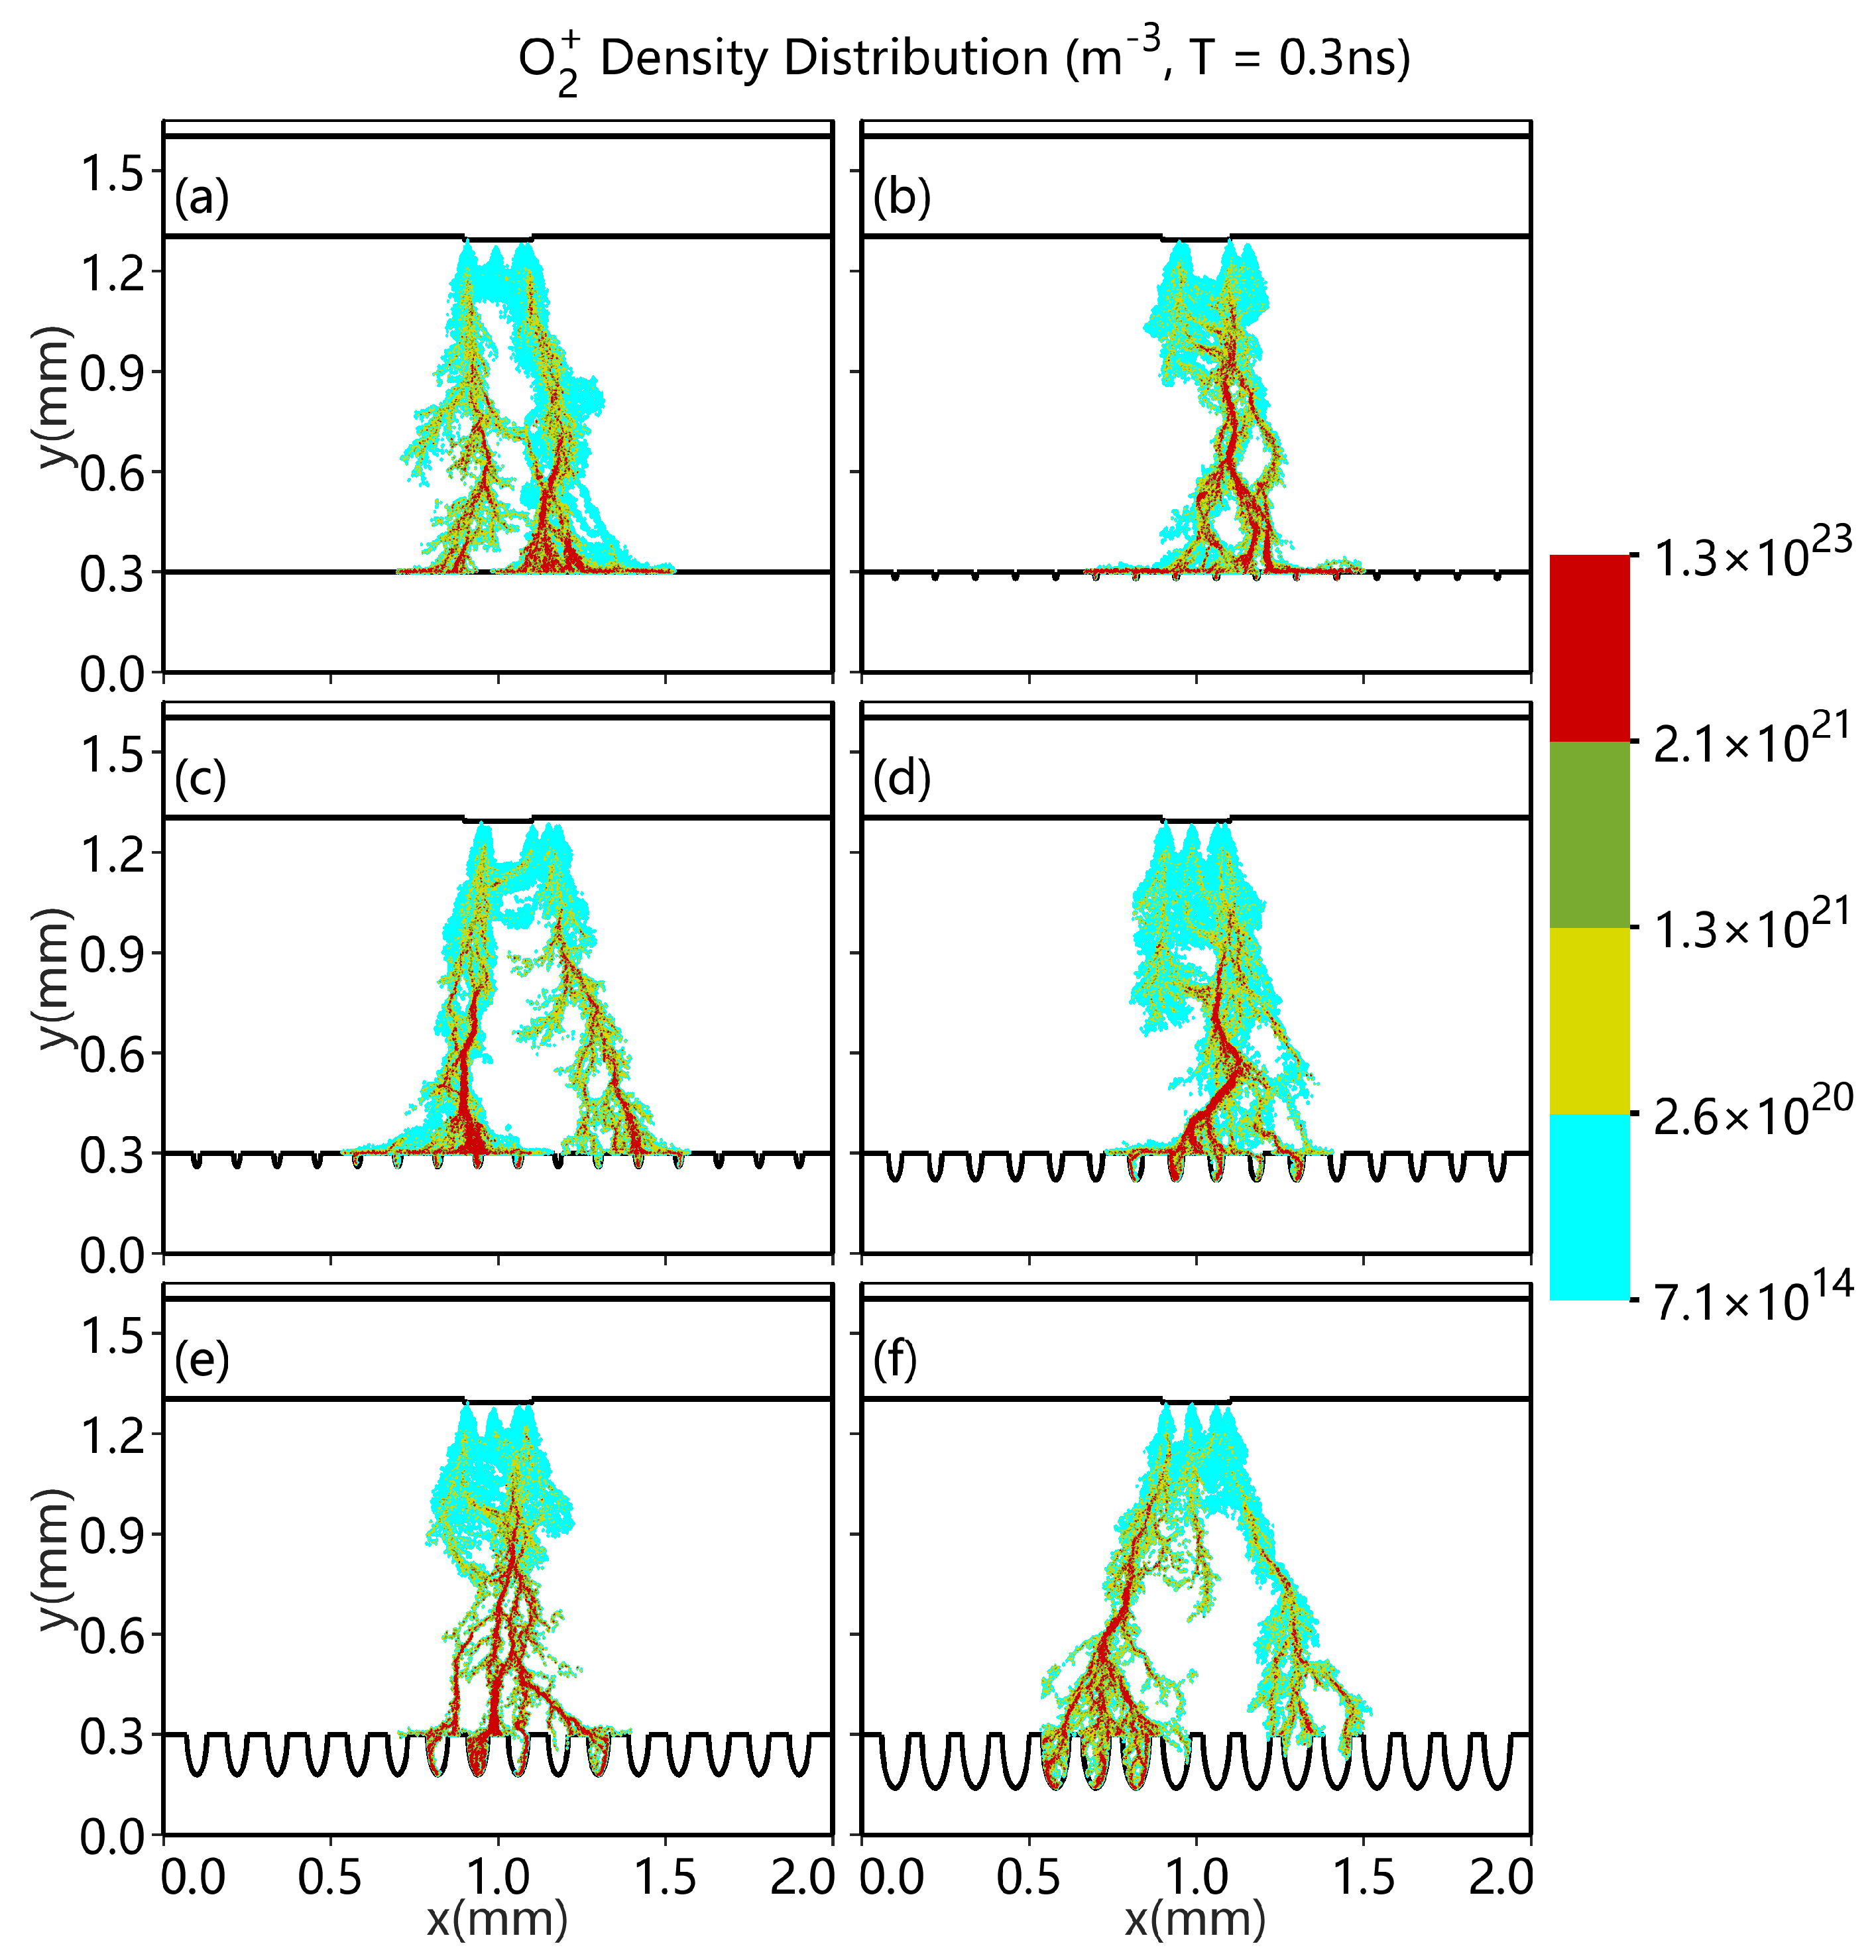
Figure 6.
Distributions of the electron-impact O2 ionization rates (m−3s−1) for different voltages in DBD with for both the top and bottom dielectric plates. The bottom dielectric plate has 16 pores. The diameter and depth of the catalyst pore are 0.1 mm and 0.2 mm, respectively. The voltage of the upper electrode ( mm) varies from −8 kV to −32 kV, and the bottom electrode ( mm) is grounded.
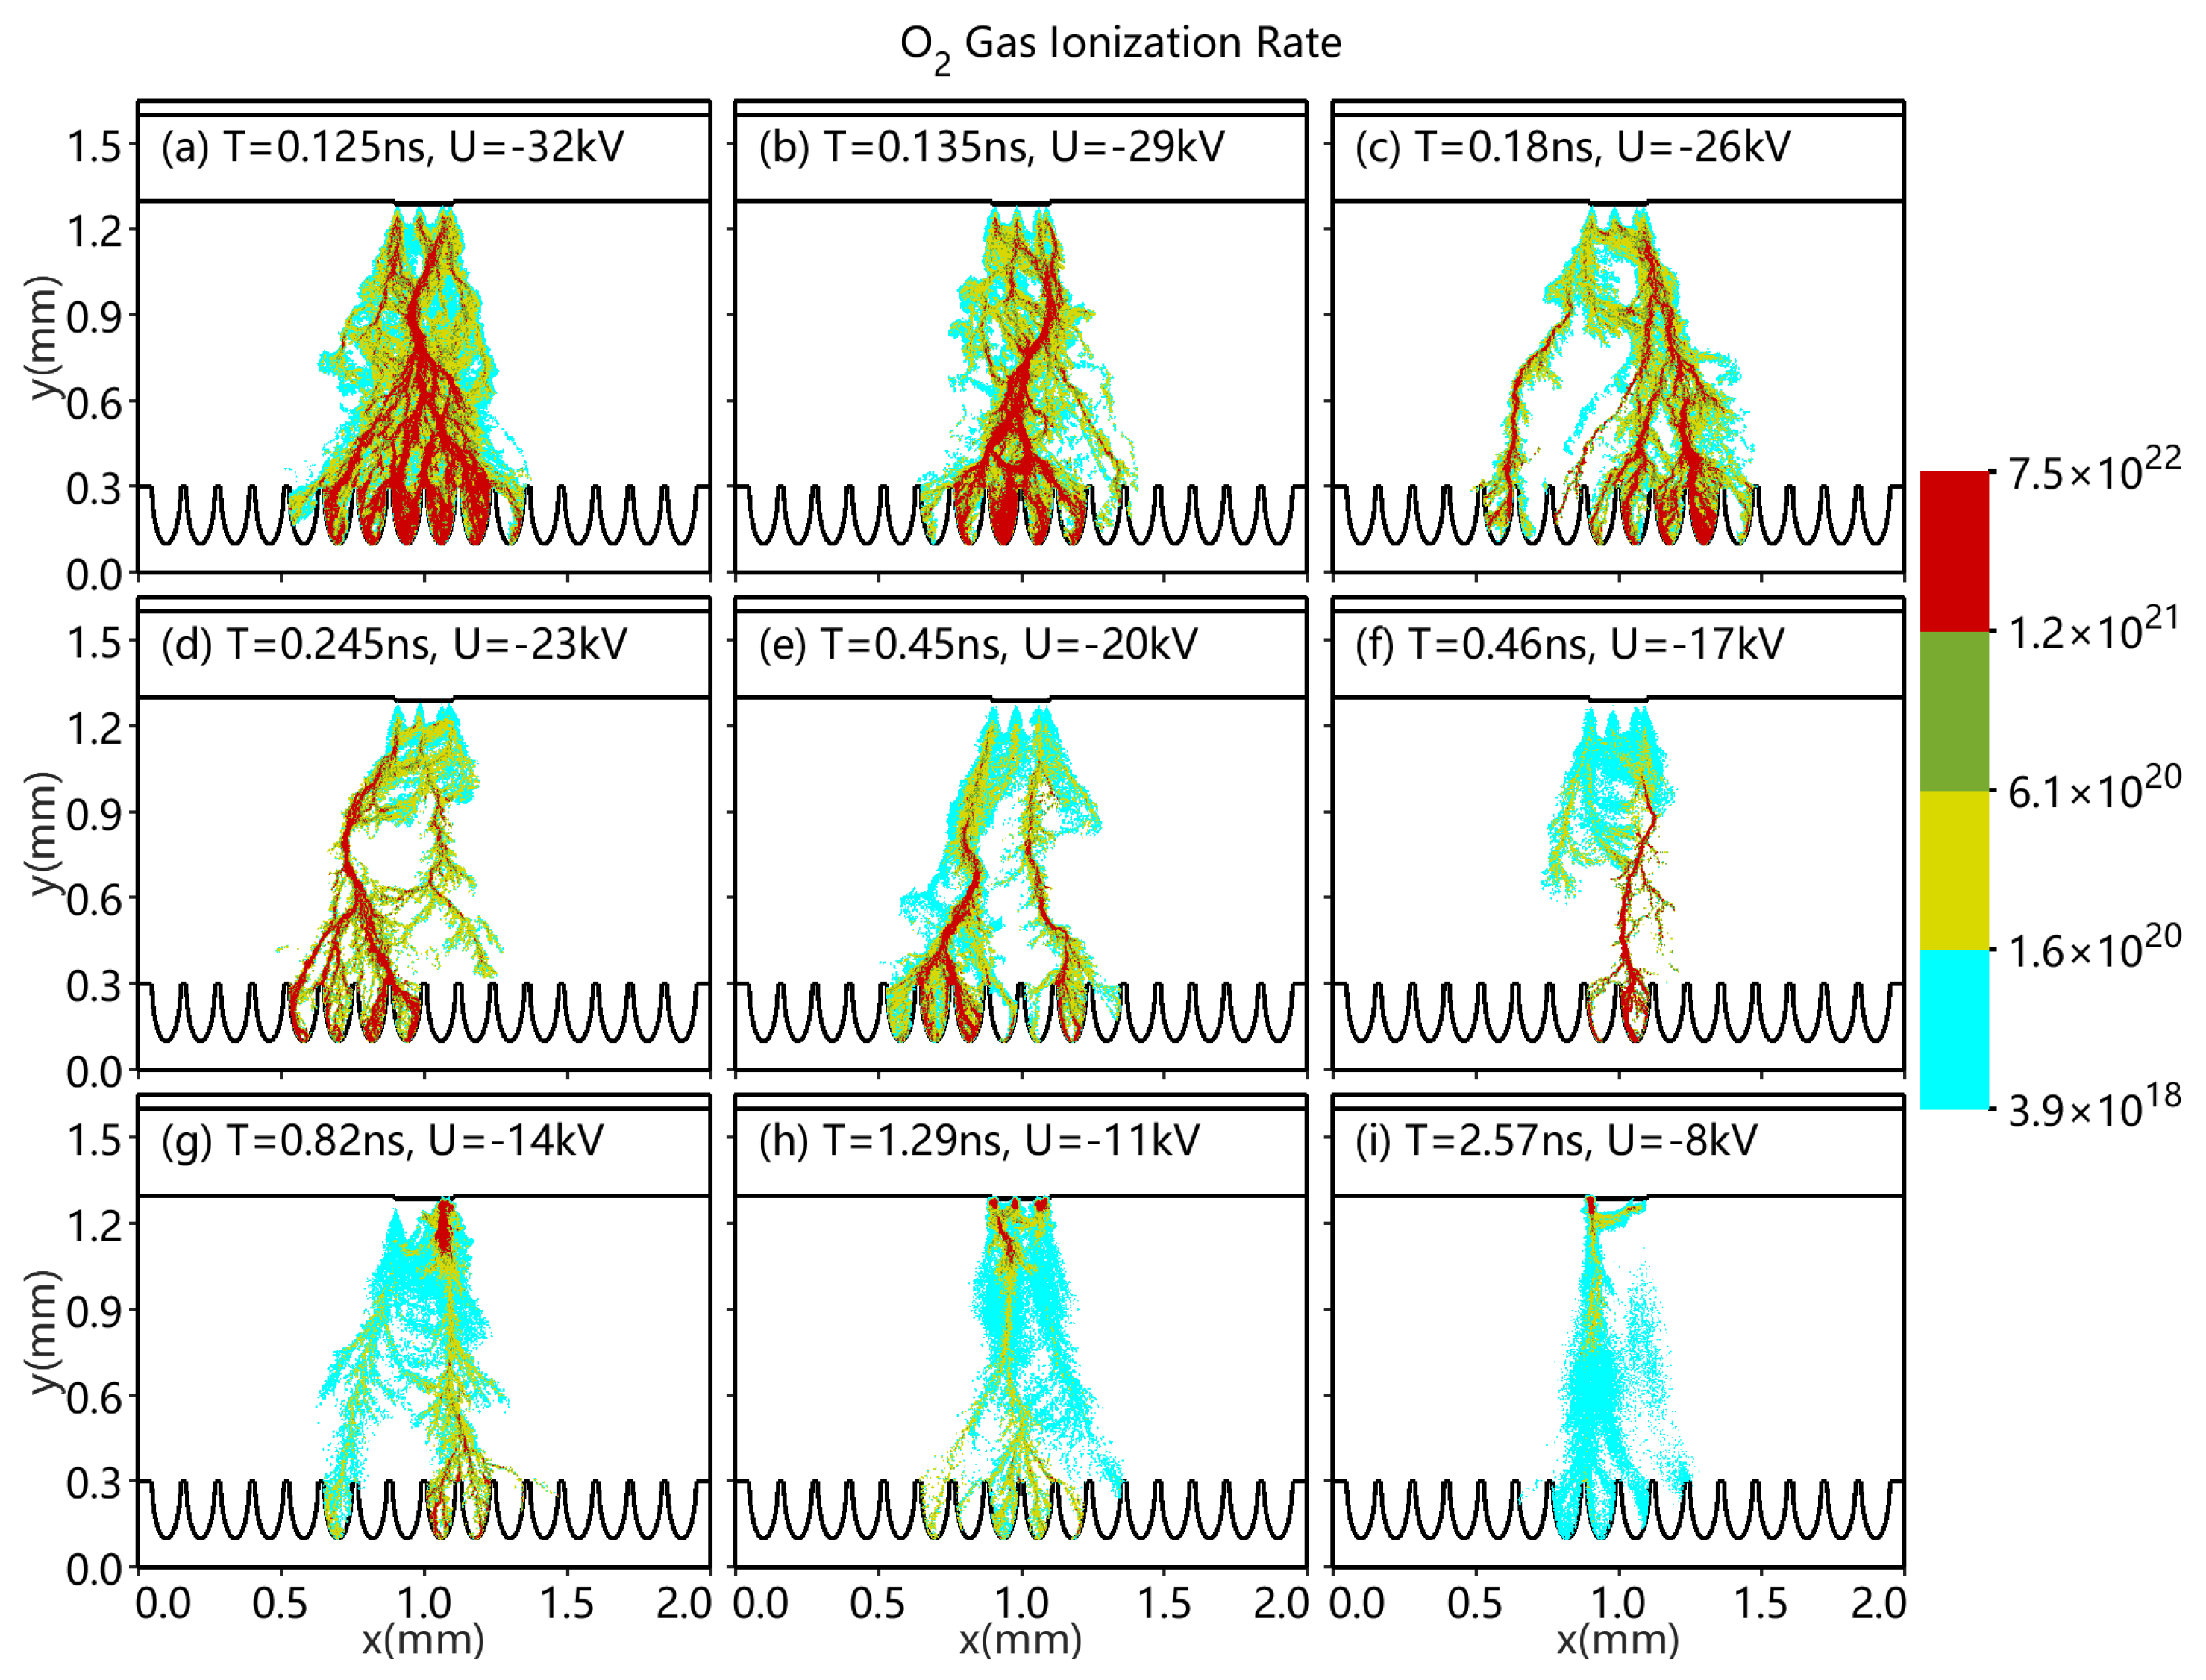
Figure 7.
Electric field distributions (Vm−1) of different voltages for the same conditions as in Figure 6.
Figure 7.
Electric field distributions (Vm−1) of different voltages for the same conditions as in Figure 6.
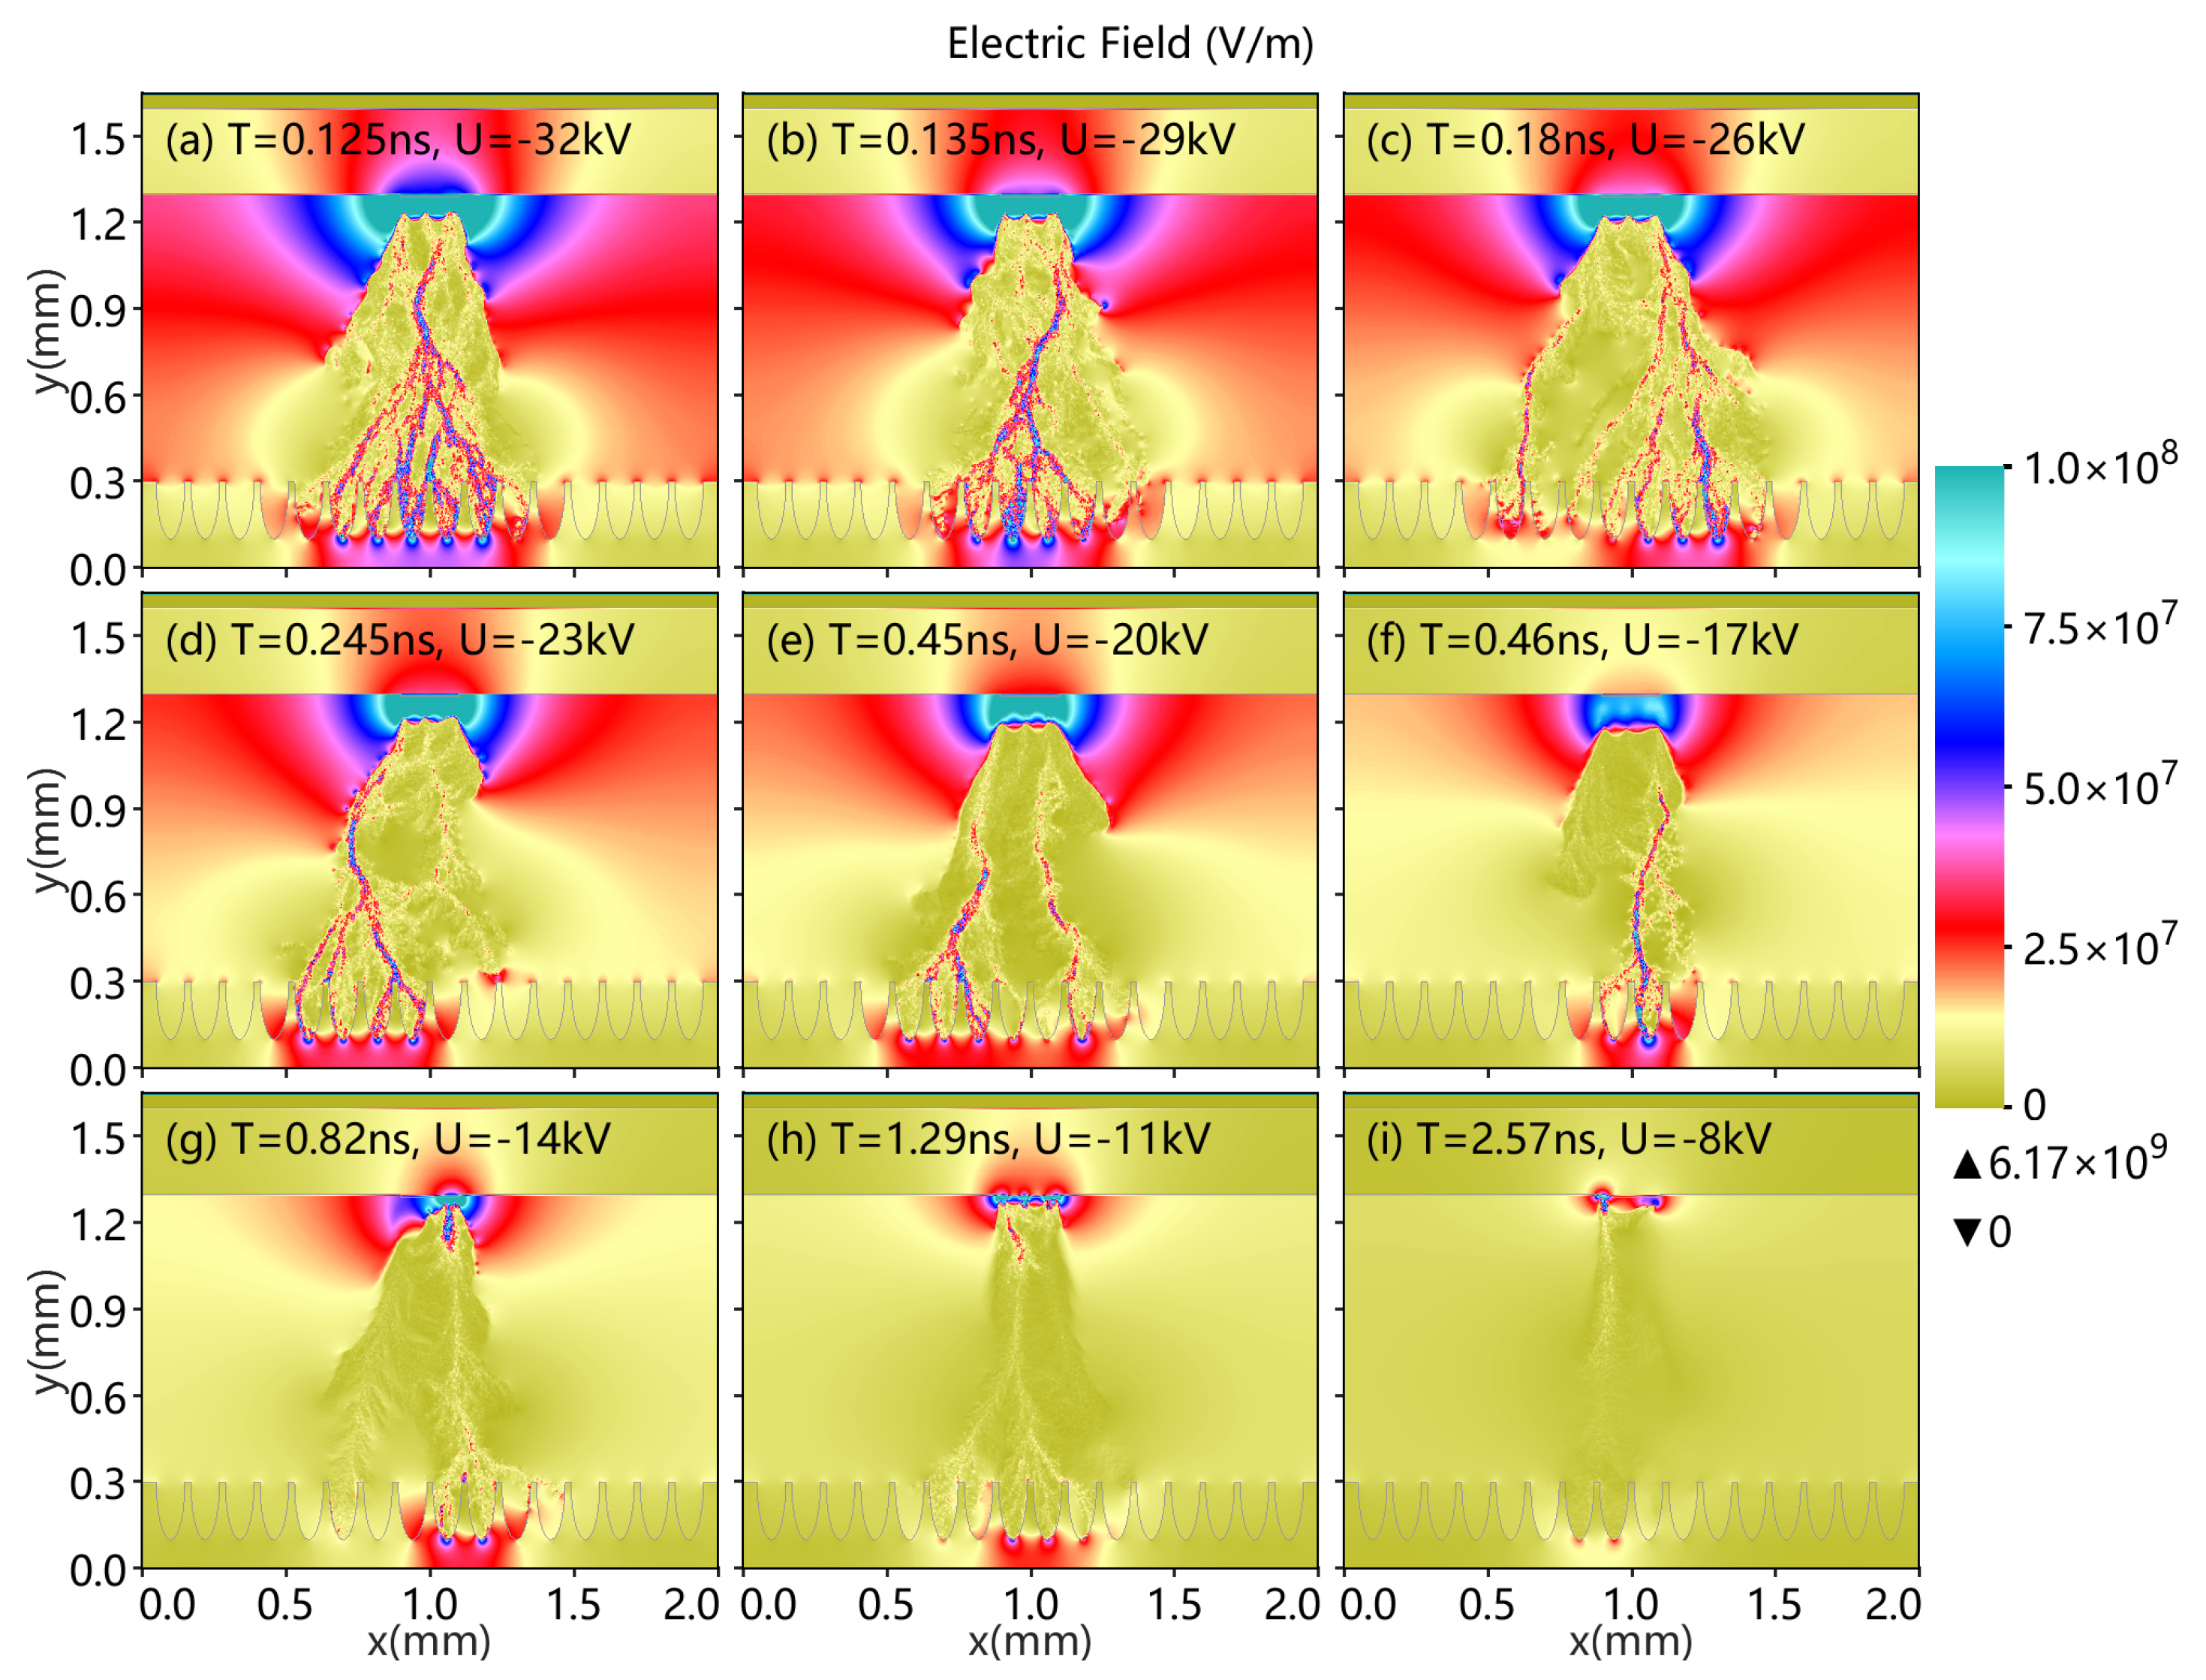
Figure 8.
Distributions of electron-impact N2 excitation rates (m−3s−1) for different left and right voltages in DBD with for both the top and bottom dielectric plates. The bottom dielectric plate has 16 pores. The diameter and depth of the catalyst pores are 0.1 mm and 0.2 mm, respectively. The voltage of the upper electrode ( mm) is −20 kV. The voltages of left and right electrodes range from −5 to −60 kV. The bottom electrode ( mm) is grounded.


Table 1.
Electron-impact ionization, electron-impact excitation, elastic collision, and attachment reactions between species. The threshold energies data and cross sections are sourced from Ref. [53] and the LXCat database [54].
| Reaction | Threshold (eV) |
|---|---|
| Electron-impact ionization | |
| e + → e + + e | 12.06 |
| e + → e + + e | 15.58 |
| Electron-impact excitation | |
| e + → e + | 0.98 |
| e + → e + | 1.63 |
| e + → e + O+O | 6.0 |
| e + → e + O+ | 8.4 |
| e + → e + + | 10.0 |
| e + → e + | 6.169 |
| e + → e + | 7.353 |
| e + → e + → e + | 7.362 |
| e + → e + → e + | 8.165 |
| e + → e + | 8.399 |
| e + → e + → e + | 8.549 |
| e + → e + → e + | 8.89 |
| e + → e + N + N | 9.7537 |
| e + → e + | 11.032 |
| Elastic collision | |
| e + → e+ | |
| e + → e+ | |
| Attachment | |
| e + → |
© 2020 by the authors. Licensee MDPI, Basel, Switzerland. This article is an open access article distributed under the terms and conditions of the Creative Commons Attribution (CC BY) license (http://creativecommons.org/licenses/by/4.0/).
Share and Cite
MDPI and ACS Style
Gu, J.-G.; Zhao, P.; Zhang, Y.; Wang, H.-Y.; Jiang, W. Discharge Enhancement Phenomenon and Streamer Control in Dielectric Barrier Discharge with Many Pores. Catalysts 2020, 10, 68. https://doi.org/10.3390/catal10010068
AMA Style
Gu J-G, Zhao P, Zhang Y, Wang H-Y, Jiang W. Discharge Enhancement Phenomenon and Streamer Control in Dielectric Barrier Discharge with Many Pores. Catalysts. 2020; 10(1):68. https://doi.org/10.3390/catal10010068
Chicago/Turabian StyleGu, Jian-Guo, Pan Zhao, Ya Zhang, Hong-Yu Wang, and Wei Jiang. 2020. "Discharge Enhancement Phenomenon and Streamer Control in Dielectric Barrier Discharge with Many Pores" Catalysts 10, no. 1: 68. https://doi.org/10.3390/catal10010068
Note that from the first issue of 2016, this journal uses article numbers instead of page numbers. See further details here.