Peer-Punishment in a Cooperation and a Coordination Game

Abstract
1. Introduction
2. Design and Implementation
2.1. VCM Game
2.2. WL Game
2.3. Implementation
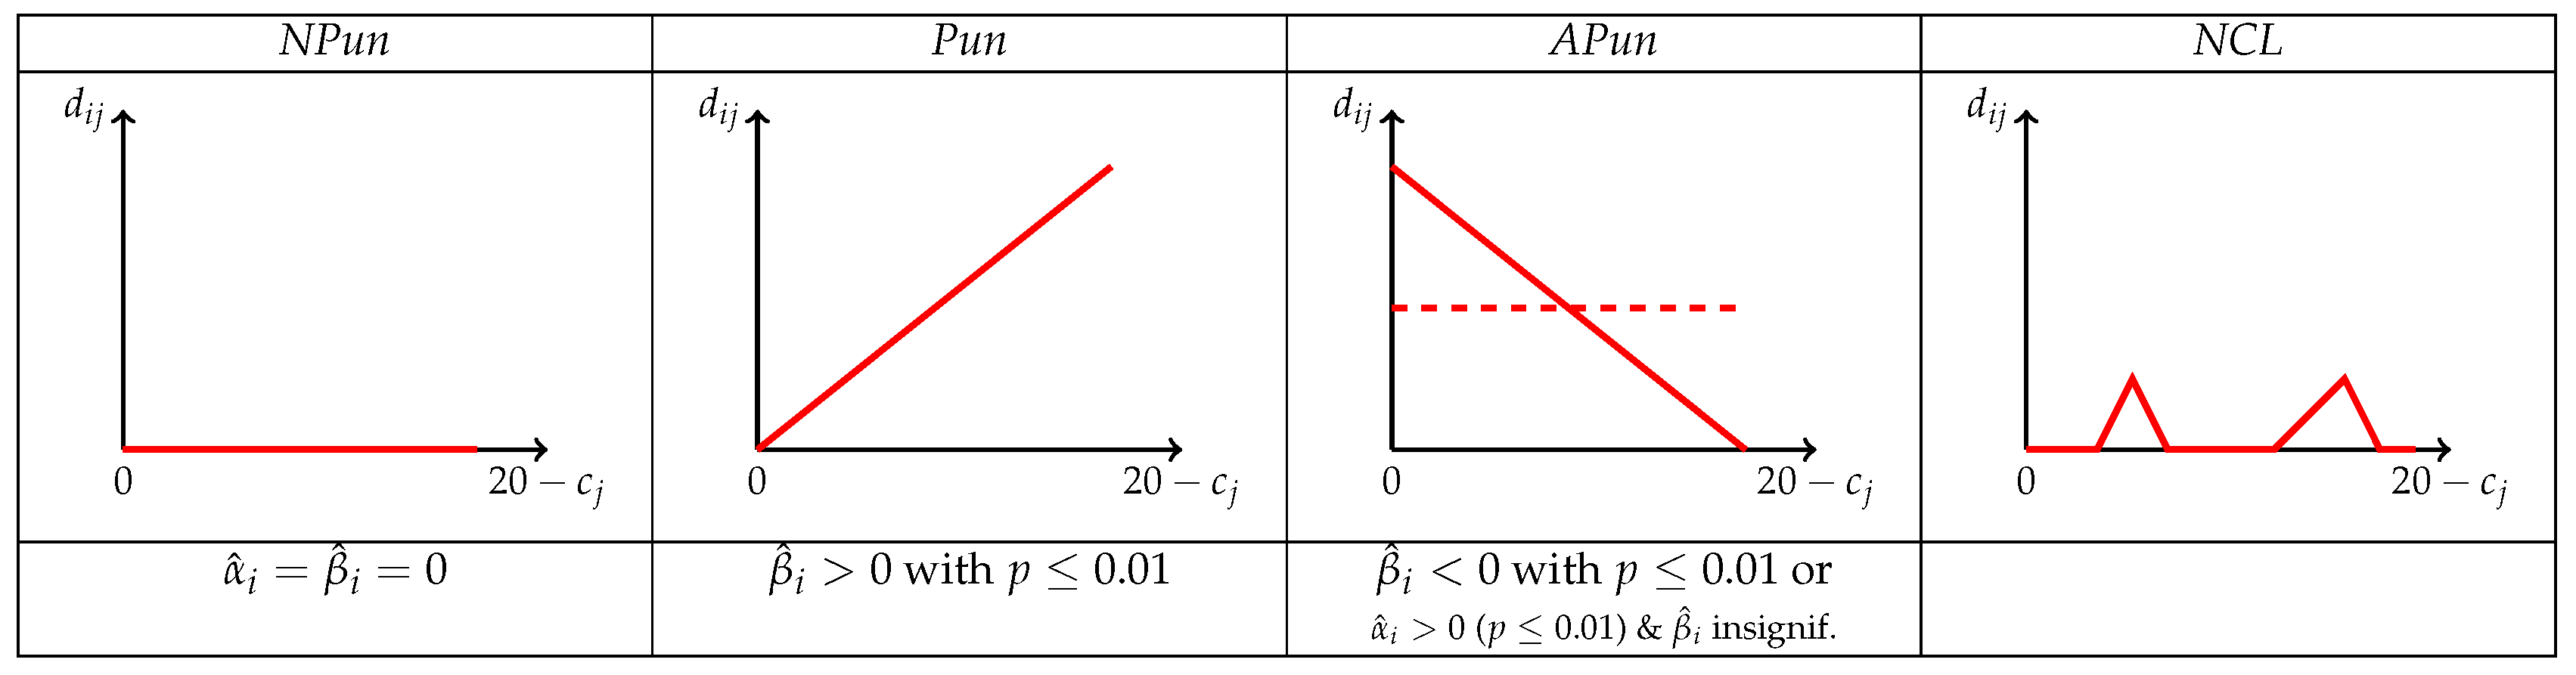
3. Punishment Types
- A subject is classified as a “non-punisher” (NPun) if zero punishment points are assigned in each of the 30 punishment decisions, i.e., for all . In Equation (3), this is depicted by .
- Subjects that target their punishment primarily towards those that contribute little or nothing to the public good have a punishment pattern that is upward sloping in . These subjects, with and , are classified as “pro-social punishers” (Pun).
- Subjects are classified as “anti-social punishers” (APun) if their punishment is either increasing in the other’s contribution , i.e., if and , or if they display a significant positive but otherwise unsystematic level of punishment, i.e., with and an insignificant slope coefficient with .7
4. Results
5. Summary
Supplementary Materials
Author Contributions
Funding
Acknowledgments
Conflicts of Interest
Abbreviations
| VCM | Repeated public goods games with peer-punishment |
| WL | Repeated weakest link game with peer-punishment |
| Pun | Individual exhibiting pro-social peer-punishment behavior |
| NPun | Individual who does not punish during a strategy method |
| APun | Individual exhibiting anti-social peer-punishment behavior |
| NCL | Individual whose peer-punishment behavior does not fit into Pun, NPun, or APun categories |
Appendix A. Contribution Triples
| (1) | (2) | (3) | (4) | (5) | (6) | (7) | (8) | ||
| (1) | (, , ): | (0, 0, 0) | (0, 2, 3) | (1, 1, 3) | (1, 2, 2) | (1, 2, 3) | (1, 2, 4) | (1, 3, 3) | (1, 3, 4) |
| (2) | (, , ): | (0, 1, 5) | (0, 2, 8) | (0, 2, 14) | (1, 2, 10) | (1, 2, 12) | (1, 3, 14) | (2, 2, 6) | (2, 3, 12) |
| (3) | (, , ): | (0, 3, 18) | (1, 2, 20) | (1, 3, 19) | (1, 4, 20) | (2, 2, 18) | (2, 2, 19) | (3, 3, 18) | (4, 4, 17) |
| (4) | (, , ): | (0, 9, 11) | (0, 5, 12) | (0, 13, 14) | (1, 10, 15) | (2, 6, 8) | (2, 9, 11) | (2, 10, 15) | (3, 13, 14) |
| (5) | (, , ): | (0, 6, 19) | (0, 14, 17) | (2, 6, 17) | (2, 8, 20) | (2, 11, 19) | (3, 7, 18) | (4, 8, 17) | (4, 10, 20) |
| (6) | (, , ): | (0, 18, 19) | (1, 19, 19) | (2, 18, 19) | (2, 18, 20) | (2, 19, 19) | (3, 18, 20) | (3, 19, 19) | (4, 19, 20) |
| (7) | (, , ): | (5, 7, 12) | (5, 14, 16) | (6, 6, 9) | (6, 10, 10) | (7, 8, 9) | (7, 10, 13) | (7, 14, 16) | (8, 9, 11) |
| (8) | (, , ): | (5, 5, 17) | (5, 8, 18) | (6, 11, 20) | (8, 15, 17) | (9, 12, 18) | (9, 15, 18) | (11, 15, 19) | (12, 15, 19) |
| (9) | (, , ): | (5, 18, 20) | (7, 18, 19) | (9, 18, 20) | (11, 17, 17) | (12, 17, 18) | (12, 18, 18) | (14, 17, 20) | (15, 17, 19) |
| (10) | (, , ): | (17, 17, 19) | (17, 18, 19) | (17, 18, 20) | (17, 19, 19) | (17, 19, 20) | (18, 18, 19) | (18, 18, 20) | (20, 20, 20) |
Appendix B. Additional Analyses

| Assigned Punishment | ||||||||||
|---|---|---|---|---|---|---|---|---|---|---|
| VCM | WL | Joint | Consistent | Inconsistent | VCM | WL | Joint | Consistent | Inconsistent | |
| (1) | (2) | (3) | (4) | (5) | (6) | (7) | (8) | (9) | (10) | |
| 0.068 *** | 0.085 *** | 0.068 *** | 0.086 *** | 0.031 *** | 0.054 *** | 0.072 *** | 0.051 *** | 0.072 *** | 0.012 | |
| (0.007) | (0.007) | (0.007) | (0.009) | (0.008) | (0.007) | (0.007) | (0.007) | (0.009) | (0.007) | |
| −0.017 | 0.030 | −0.114 | −0.030 | 0.024 | −0.140 * | |||||
| (0.031) | (0.029) | (0.070) | (0.031) | (0.030) | (0.072) | |||||
| 0.017 ** | 0.001 | 0.050 *** | 0.020 *** | 0.001 | 0.055 *** | |||||
| (0.007) | (0.006) | (0.018) | (0.007) | (0.006) | (0.017) | |||||
| 0.381 *** | 0.340 *** | 0.460 *** | 0.377 *** | 0.557 *** | ||||||
| (0.040) | (0.042) | (0.051) | (0.050) | (0.113) | ||||||
| −0.094 | −0.007 | −0.186 | ||||||||
| (0.064) | (0.063) | (0.153) | ||||||||
| Intercept | −0.005 | −0.019 | −0.000 | −0.055 | 0.114 | 0.023 | 0.001 | 0.034 | −0.032 | 0.168 ** |
| (0.067) | (0.070) | (0.062) | (0.083) | (0.077) | (0.066) | (0.070) | (0.061) | (0.082) | (0.075) | |
| Observations | 6840 | 6840 | 13,680 | 9240 | 4440 | 6840 | 6840 | 13,680 | 9240 | 4440 |
| adj. | 0.222 | 0.251 | 0.201 | 0.263 | 0.135 | 0.239 | 0.262 | 0.217 | 0.276 | 0.151 |
| AIC | 18,036 | 19,974 | 41,357 | 26,656 | 14,270 | 17,886 | 19,874 | 41,096 | 26,488 | 14,189 |
| BIC | 18,043 | 19,980 | 41,379 | 26,677 | 14,289 | 17,899 | 19,888 | 41,134 | 26,524 | 14,221 |
References
- Fehr, E.; Gächter, S. Cooperation and Punishment in Public Goods Experiments. Am. Econ. Rev. 2000, 90, 980–994. [Google Scholar] [CrossRef]
- Fehr, E.; Fischbacher, U.; Gächter, S. Strong reciprocity, human cooperation, and the enforcement of social norms. Hum. Nat. 2002, 13, 1–25. [Google Scholar] [CrossRef] [PubMed]
- Reuben, E.; Riedl, A. Enforcement of contribution norms in public good games with heterogeneous populations. Games Econ. Behav. 2013, 77, 122–137. [Google Scholar] [CrossRef]
- Fischbacher, U.; Gächter, S.; Fehr, E. Are people conditionally cooperative? Evidence from a public goods experiment. Econ. Lett. 2001, 71, 397–404. [Google Scholar] [CrossRef]
- Gächter, S.; Thöni, C. Social Learning and Voluntary Cooperation Among Like-Minded People. J. Eur. Econ. Assoc. 2005, 3, 303–314. [Google Scholar] [CrossRef]
- Chaudhuri, A. Sustaining cooperation in laboratory public goods experiments: A selective survey of the literature. Exp. Econ. 2011, 14, 47–83. [Google Scholar] [CrossRef]
- Kosfeld, M.; Okada, A.; Riedl, A. Institution Formation in Public Goods Games. Am. Econ. Rev. 2009, 99, 1335–1355. [Google Scholar] [CrossRef]
- Ostrom, E.; Walker, J.M.; Gardner, R. Covenants with and without a Sword: Self-Governance is Possible. Am. Political Sci. Rev. 1992, 86, 404. [Google Scholar] [CrossRef]
- Milinski, M.; Semmann, D.; Krambeck, H.J. Reputation helps solve the ‘tragedy of the commons’. Nature 2002, 415, 424–426. [Google Scholar] [CrossRef] [PubMed]
- Berg, J.; Dickhaut, J.; McCabe, K. Trust, Reciprocity, and Social History. Games Econ. Behav. 1995, 10, 122–142. [Google Scholar] [CrossRef]
- Bochet, O.; Page, T.; Putterman, L. Communication and punishment in voluntary contribution experiments. J. Econ. Behav. Org. 2006, 60, 11–26. [Google Scholar] [CrossRef]
- Rustagi, D.; Engel, S.; Kosfeld, M. Conditional cooperation and costly monitoring explain success in forest commons management. Science 2010, 330, 961–965. [Google Scholar] [CrossRef] [PubMed]
- Falk, A.; Fehr, E.; Fischbacher, U. Driving Forces behind Informal Sanctions. Econometrica 2005, 73, 2017–2030. [Google Scholar] [CrossRef]
- Fischbacher, U.; Gaechter, S. Heterogeneous Social Preferences And The Dynamics Of Free Riding In Public Good Experiments. Am. Econ. Rev. 2010, 100, 541–556. [Google Scholar] [CrossRef]
- Albrecht, F.; Kube, S.; Traxler, C. Cooperation and norm enforcement—The individual-level perspective. J. Public Econ. 2018, 165, 1–16. [Google Scholar] [CrossRef]
- Yamagishi, T. The provision of a sanctioning system as a public good. J. Pers. Soc. Psychol. 1986, 51, 110–116. [Google Scholar] [CrossRef]
- Yamagishi, T. The provision of a sanctioning system in the United States and Japan. Soc. Psychol. Q. 1988, 51, 265–271. [Google Scholar] [CrossRef]
- Kube, S.; Traxler, C. The Interaction of Legal and Social Norm Enforcement. J. Public Econ. Theory 2011, 13, 639–660. [Google Scholar] [CrossRef]
- Van Huyck, J.B.; Battalio, R.C.; Beil, R.O. Tacit Coordination Games, Strategic Uncertainty, and Coordination Failure. Am. Econ. Rev. 1990, 80, 234–248. [Google Scholar]
- Brandts, J.; Cooper, D.J. A Change Would Do You Good—An Experimental Study on How to Overcome Coordination Failure in Organisations. Am. Econ. Rev. 2006, 96, 669–693. [Google Scholar] [CrossRef]
- Blume, A.; Ortmann, A. The effects of costless pre-play communication: Experimental evidence from games with Pareto-ranked equilibria. J. Econ. Theory 2007, 132, 274–290. [Google Scholar] [CrossRef]
- Le Lec, F.; Rydval, O.O.; Matthey, A.; Lec, F.L.; Rydval, O.O.; Matthey, A.; Rydval, O.O. Efficiency and Punishment in a Coordination Game: Voluntary Sanctions in the Minimum Effort Game. Available online: https://ssrn.com/abstract=2555451 (accessed on 16 June 2016).
- Herrmann, B.; Thöni, C.; Gächter, S. Antisocial punishment across societies. Science 2008, 319, 1362–1367. [Google Scholar] [CrossRef] [PubMed]
- Peysakhovich, A.; Nowak, M.A.; Rand, D.G. Humans Display a ‘Cooperative Phenotype’ that is Domain General and Temporally Stable. Nat. Commun. 2014, 5, 4939. [Google Scholar] [CrossRef] [PubMed]
- Cheung, S.L. New insights into conditional cooperation and punishment from a strategy method experiment. Exp. Econ. 2014, 17, 129–153. [Google Scholar] [CrossRef]
- Kamei, K. Conditional punishment. Econ. Lett. 2014, 124, 199–202. [Google Scholar] [CrossRef]
- Selten, R. Die Strategiemethode zur Erforschung des eingeschränkt rationalen Verhaltens im Rahmen eines Oligopolexperimentes. In Beiträge zur Experimentellen Wirtschaftsforschung; Sauerman, H., Ed.; JCB Mohr (Paul Siebeck): Tübingen, Germany, 1967; pp. 136–138. [Google Scholar]
- Guala, F. Reciprocity: Weak or strong? What punishment experiments do (and do not) demonstrate. Behav. Brain Sci. 2012, 35, 1–15. [Google Scholar] [CrossRef] [PubMed]
- Bardsley, N. Control Without Deception: Individual Behaviour in Free-Riding Experiments Revisited. Exp. Econ. 2000, 3, 215–240. [Google Scholar] [CrossRef]
- Carpenter, J.P. The demand for punishment. J. Econ. Behav. Org. 2007, 62, 522–542. [Google Scholar] [CrossRef]
- Fischbacher, U. Z-Tree: Zurich Toolbox for Ready-made Economic Experiments. Exp. Econ. 2007, 10, 171–178. [Google Scholar] [CrossRef]
- Bock, O.; Baetge, I.; Nicklisch, A. Hroot: Hamburg Registration and Organization Online Tool. Eur. Econ. Rev. 2014, 71, 117–120. [Google Scholar] [CrossRef]
| 1. | Subjects played two additional treatments during the sessions, a one-shot public goods game without punishment implemented as a strategy method in the tradition of Fischbacher et al. [4] and a one-shot public goods game with punishment as implemented first by Kube and Traxler [18]. Both games are not part of this analysis as they do not allow for a direct comparison with the WL implemented here. |
| 2. | The procedure was first applied by Kube and Traxler [18] as a one-shot implementation and later used by Albrecht et al. [15]. A similar approach—called “Conditional Information Lottery (CIL)”—is used in [29]. However, the CIL was applied at the contribution rather than the punishment stage. Cheung [25] used a strategy method on the punishment stage in a public goods games but reduced the group size to three subjects and drastically truncated the range of contribution decisions. Similarly, Kamei [26] used a strategy method on the punishment stage with a four-player setup and a reduced choice set to elicit punishment patterns conditional on observed punishment by others. |
| 3. | Pre-defined sets of triples are reported in the Appendix A. |
| 4. | If, by chance, a triple would match to the real combination of contributions, the subject would not face this triple. Instead, a different triple from the corresponding pre-defined set of contribution triples would be randomly drawn. |
| 5. | For a technical discussion see [15]. |
| 6. | We differentiated the terminology for transfers to the group project, using the respective German term for “contribute to” in VCM and “spend effort on” in WL. Section 1 in the Supplementary Materials provides the instructions for both games, translated into English. The German original is available from the authors upon request. Pre-play questionnaires thoroughly tested understanding of the respective payoff functions. |
| 7. | The literature typically defines anti-social punishment in reference to a subject’s own contribution, i.e., if the punishment-receiving subject contributed a larger or equal amount to the public good compared to the punishing individual (e.g., [23]). Since our classification does not consider a punisher’s own contribution , it deviates from this self-centered notion of anti-social punishment. It nevertheless captures patterns of punishment that are targeted towards high contributors. |
| 8. | The individual fixed effects capture individually constant level differences, including the individual differences in initial contributions . Subjects only make a single contribution decision during each strategy method, resulting in a constant difference in contributions between the two games. |


| Hypothetical: | ||||
|---|---|---|---|---|
| + Real: | ||||
| WL-Game | |||||
|---|---|---|---|---|---|
| VCM↓ | Pun | NPun | APun | NCL | Total |
| Pun | 90 | 9 | 0 | 12 | 111 |
| % | [39.5] | [3.9] | [0.0] | [5.3] | [48.7] |
| NPun | 21 | 57 | 0 | 10 | 88 |
| % | [9.2] | [25.0] | [0.0] | [4.4] | [38.6] |
| APun | 2 | 1 | 7 | 3 | 13 |
| % | [0.9] | [0.4] | [3.1] | [1.3] | [5.7] |
| NCL | 8 | 2 | 0 | 6 | 16 |
| % | [3.5] | [0.9] | [0.0] | [2.6] | [7.0] |
| Total | 121 | 69 | 7 | 31 | 228 |
| % | [53.1] | [30.3] | [3.1] | [13.6] | [100.0] |
| Assigned Punishment | |||||
|---|---|---|---|---|---|
| All | Intensive | Extensive | |||
| (1) | (2) | (3) | (4) | ||
| 0.068 *** | 0.086 *** | 0.031 *** | 0.051 *** | ||
| (0.007) | (0.009) | (0.008) | (0.007) | ||
| −0.017 | 0.030 | −0.114 | −0.030 | ||
| (0.031) | (0.029) | (0.070) | (0.031) | ||
| 0.017 ** | 0.001 | 0.050 *** | 0.020 *** | ||
| (0.007) | (0.006) | (0.018) | (0.007) | ||
| 0.460 *** | |||||
| (0.051) | |||||
| −0.094 | |||||
| (0.064) | |||||
| Constant | −0.000 | −0.055 | 0.114 | 0.034 | |
| (0.062) | (0.083) | (0.077) | (0.061) | ||
| N | 228 | 154 | 74 | 228 | |
| Obs. | 13,680 | 9240 | 4440 | 13,680 | |
| adj. | 0.201 | 0.263 | 0.135 | 0.217 | |
© 2018 by the authors. Licensee MDPI, Basel, Switzerland. This article is an open access article distributed under the terms and conditions of the Creative Commons Attribution (CC BY) license (http://creativecommons.org/licenses/by/4.0/).
Share and Cite
Albrecht, F.; Kube, S. Peer-Punishment in a Cooperation and a Coordination Game. Games 2018, 9, 54. https://doi.org/10.3390/g9030054
Albrecht F, Kube S. Peer-Punishment in a Cooperation and a Coordination Game. Games. 2018; 9(3):54. https://doi.org/10.3390/g9030054
Chicago/Turabian StyleAlbrecht, Felix, and Sebastian Kube. 2018. "Peer-Punishment in a Cooperation and a Coordination Game" Games 9, no. 3: 54. https://doi.org/10.3390/g9030054
APA StyleAlbrecht, F., & Kube, S. (2018). Peer-Punishment in a Cooperation and a Coordination Game. Games, 9(3), 54. https://doi.org/10.3390/g9030054