Choices in the 11–20 Game: The Role of Risk Aversion

1
College of Business, Department of Economics and Finance, and CityU HK Experimental Economics Lab, City University of Hong Kong, Tat Chee Avenue, Hong Kong, China
2
School of Economics, Shanghai University of Finance and Economics, 777 Guoding Road, Shanghai 200433, China
*
Author to whom correspondence should be addressed.
Games 2018, 9(3), 53; https://doi.org/10.3390/g9030053
Submission received: 29 May 2018
/
Revised: 3 July 2018
/
Accepted: 12 July 2018
/
Published: 24 July 2018
Abstract
:Arad and Rubinstein (2012, AER) proposed the 11–20 money request game as an alternative to the P beauty contest game for measuring the depth of thinking. In this paper, we show theoretically that in the Nash equilibrium of the 11–20 game players are more likely to choose high numbers if they are risk-averse rather than risk neutral. Hence, the depth of thinking measured in the 11–20 game is biased by risk aversion. Based on a lab experiment, we confirm this hypothesis empirically.
1. Introduction
Game theory models often make assumptions about the rationality of decision makers. One common form of rationality assumed is that decision makers have the ability to perform strategic reasoning such as iterative reasoning. In fact, most equilibrium concepts rely on the assumption that decision makers have an infinite reasoning capacity. Thus, it is important to check whether decision makers indeed exhibit such a degree of rationality in reality. The idea that individuals may exhibit a finite degree of rationality can be at least traced back to the newspaper game proposed by Keynes (1936) [1]. Based on the newspaper game, Nagel (1995) [2] proposed the P beauty contest game as a method of experimentally measuring the depth of thinking. Since then, the P beauty contest game has become the main vehicle for measuring the depths of thinking of decision makers.
The P beauty contest game is structured as follows:
Each player is asked to choose a number between 0 and 100 (0 and 100 inclusive). The player with the chosen number that is the closest to p times the average guess wins a prize.
When p < 1, the game can be solved using iterated elimination of weakly dominated strategies, which can be seen as follows. First, eliminate any strategies larger than p × 100, then eliminate those that are greater than p2 × 100, and so on. The unique equilibrium is to guess 0.
More recently, Arad and Rubinstein (2012) [3] proposed the 11–20 money request game as a more effective alternative to the P beauty contest game for measuring the depth of thinking. Their main critiques of the P beauty contest game are that (1) it is difficult to understand and (2) the choice of reference point for counting the level of thinking is often somewhat arbitrary. They argue that the 11–20 game does not suffer from these shortcomings.
The 11–20 game is as follows:
“You and another player are playing a game in which each player requests an amount of money. The amount must be (an integer) between 11 and 20 shekels. Each player will receive the amount that he requests. A player will receive an additional amount of 20 shekels if he asks for exactly one shekel less than the other player. What amount of money would you request?”
Arad and Rubinstein (2012) [3] run the 11–20 game experiment and analyze the choice patterns. However, they do not run the P beauty contest game experiment for purposes of comparison. Thus, their argument regarding the advantage of the 11–20 game is mainly based on logical argument rather than empirical evidence.
Although the 11–20 game has its own advantages over the P beauty contest game, in our view, it may also come with an additional cost: an individual’s choice may be correlated with his level of risk aversion. The intuition is that an individual may choose a high number, say, 19, rather than a low number, say, 16, not because he is less sophisticated at strategic reasoning (i.e., lower level) but because he is more risk-averse. In this paper, we theoretically show that risk aversion will induce players to avoid choosing low numbers in the game. We experimentally test the hypothesis. The important implication of this hypothesis is that, if risk aversion is the main driving force of the subjects’ choices in the 11–20 game, then we can no longer conclude that someone who chooses 19 is less sophisticated than another person who chooses 16. Thus, it is important to empirically verify whether the choices in the 11–20 game are correlated with risk aversion. In other words, whether choices in the 11–20 game are correlated with risk attitudes is our main research question.
We conduct experiments in which the subjects play both games. After the experiment, the subjects complete a questionnaire on how they made their choices under the P beauty contest game and the 11–20 game. We also elicit their risk attitudes using the Holt and Laury (2002) [4] task.
Our experiment design has several attractive features. First, we elicit the subjects’ risk attitudes using the Holt and Laury (2002) [4] task. With this information in hand, we can test our main hypothesis that, in the 11–20 game, the subjects’ choices are mainly influenced by risk aversion rather than strategic reasoning and that, in the P beauty contest game, the subjects’ choices are not influenced by risk aversion.
Second, in our experiment, subjects play both games. Having the subjects’ choices in both games allows us to examine whether there is any correlation between their choices in these two games and to check for any systematic patterns.
Our experimental results largely support our hypotheses. In particular, the subjects’ choices in the 11–20 game are correlated with risk aversion. Risk-averse subjects are much more likely to choose high numbers (i.e., exhibiting low depths of thinking if one literally uses the chosen number to infer the level of strategic reasoning) in the 11–20 game. The key message is that the number chosen in the 11–20 game may not effectively reflect an individual’s depth of thinking but rather the individual’s risk attitude. On the other hand, we find that choices in the P beauty contest game are not correlated with risk aversion.
2. Related Literature
In a recent experimental study on the 11–20 game by Goeree, Louis, and Zhang (2018) [5], the authors found that the choices made in the 11–20 game can be best explained by the idea that subjects make mistakes. They conducted the 11–20 game and also variants of the game. They estimated the 11–20 game using the noisy introspection model developed by Goeree and Holt (2004) [6]. They found that “data from these additional treatments clearly refute the level-k model, which predicts no better than the Nash equilibrium in these games”. Note that they assume players to be risk-neutral. Our study complements the study by Goeree, Louis, and Zhang (2018) [5] by showing that subjects’ aversion to choosing low numbers can be potentially explained by risk aversion.
3. Theoretical Analysis
In our experiment, the P beauty contest game and the 11–20 game are structured as follows:
P beauty contest game: Each player is asked to choose a number between 0 and 100 (0 and 100 inclusive, up to two decimal places). The player with the chosen number being closest to 0.7 times the average guess wins a prize of RMB 50. If two or more players win, the winner will be randomly chosen.
11–20 game: Every player writes down a number that must be between 11 and 20 (11 and 20 inclusive) and also be an integer. Every player is matched with another player to form a pair. The payoff is determined as follows: First, each player in each pair receives the amount equal to the number that he/she specified. Second, in each pair, the player whose number is exactly one less than the other player receives an additional amount of RMB 20.
We next study the theoretical prediction of the equilibrium behavior of the two games.
For the P beauty contest game, it can be solved using iterated elimination of weakly dominated strategies, which can be seen as follows. First, eliminate any strategies larger than 0.7 × 100. Then, eliminate those greater than 0.72 × 100, and so on. The unique equilibrium is to choose 0 for every player.
For the 11–20 game, there is no pure strategy Nash equilibrium, but there is a unique (symmetric) mixed strategy Nash equilibrium (see Arad and Rubinstein (2012) [3]). According to Arad and Rubinstein (2012) [3], in the unique mixed strategy Nash equilibrium the numbers 20, 19, 18, 17, 16, and 15 are chosen with probability 5%, 10%, 15%, 20%, 25%, and 25%, respectively. The experimental results reported by Arad and Rubinstein (2012) [3] deviate considerably from the mixed strategy Nash equilibrium in the sense that there seems to be a shift of the distribution of choices towards high numbers (see also Table 1). However, the theoretical prediction of Arad and Rubinstein (2012) [3] is based on the assumption that players are risk neutral. What if players are risk-averse? Similar to the risk-neutral case analyzed in Arad and Rubinstein (2012) [3], when players are risk-averse, there is no pure strategy Nash equilibrium. However, there is a symmetric mixed strategy Nash equilibrium in the game, in which players choose large numbers with larger probability than the equilibrium of the risk-neutral case. Indeed, in our experiment, we find that 79 percent of the subjects are risk-averse. This may explain why the low numbers are chosen much less frequently than the equilibrium prediction in Arad and Rubinstein (2012) [3]. 1
More particularly, the mixed strategy Nash equilibrium for the case where players are risk averse is analyzed as follows. Suppose that both players’ utility functions are . Observe that, in any symmetric mixed strategy Nash equilibrium of the game, the highest number that is chosen with a positive probability must be 20 (otherwise, a player can assign 20 with probability one and obtain a higher payoff). However, 20 cannot be chosen with probability one because, otherwise, a player will obtain a higher payoff by deviating to 19. Let denote the probability that 20 is chosen by a player. Thus, must be such that the player’s opponent is indifferent to choosing between 20 and 19. That is, , i.e., . We say that a utility function is more risk-averse than if there exists a strictly concave and increasing function such that for any . If is more risk-averse than , then we have for any (refer to Figure 1, where is more risk-averse than and, for purposes of illustration, the two utility functions are normalized such that and ). This implies that, when the utility function becomes more risk-averse, the ratio will increase, meaning that will increase. Actually, it can be shown that, as becomes more risk-averse, for any , the probability that a number that is equal to or greater than is chosen will increase. In particular, we have the following result.
Proposition 1: Consider the symmetric mixed strategy Nash equilibrium of the 11–20 game. For any , the probability that a player chooses a number that is greater than or equal to when players are risk-averse is larger than the corresponding probability when players are risk-neutral.
We can compute the mixed strategy Nash equilibrium for the case where players have constant relative risk aversion (CRRA) utilities; i.e., players have utility functions u(x) = x1−r/(1 − r), where r is the degree of (relative) risk aversion and x is the amount of money obtained. When r=1.37, the predicted percentages are as follows: 20 (8%), 19 (16%), 18 (23.3%), 17 (30.5%), 16 (22.2%), and 15 and below (0%). We can also compute the mixed strategy equilibrium for the case where players have constant absolute risk aversion (CARA) utilities; i.e., players have utility functions u(x) = 1 ‒ e−αx, where α is the degree of (absolute) risk aversion. When α = 0.15, the predicted percentages are as follows: 20 (14.7%), 19 (27.2%), 18 (38.1%), 17 (20%), and 16 and below (0%). Evidently, as we can see from Table 1, the prediction of the choice of levels 1, 2, and 3 are closer to the data in Arad and Rubinstein (2012) [3] and our experiment than the prediction based on the equilibrium of risk neutral players.
Hitherto, we have assumed that subjects have the same utility functions and thus subjects have the same risk aversion levels. We may also allow heterogeneity of risk aversion, and consider the Bayesian (pure-strategy) Nash equilibrium of the game. Suppose, for example, the players’ utilities are u = x1−r/(1 − r), where each player’s risk aversion level r is the player’s private information. Assume that each player’s r is drawn from a uniform distribution on [0, 2], which is common knowledge. It can be verified that the equilibrium is that the player with 1.815 < r < 2 will choose 20; the player with 1.4708 < r < 1.815 will choose 19; the player with 0.9933 < r < 1.4708 will choose 18; the player with 0.4051 < r < 0.9933 will choose 17; and the player with 0 < r < 0.4051 will choose 16 (see the Appendix for a proof). Thus, the more risk-averse the player is, the more likely the higher number will be chosen.2 The choice probabilities of 20, 19, 18, 17, and 16 are roughly 9%, 17%, 24%, 29.5%, and 20.5%, respectively.
4. Experimental Design
We conducted four sessions, and subjects participated in both the P beauty contest and the 11–20 game. A total of 96 subjects (24 subjects in each of the four sessions) participated in the experiment. The subjects were randomly recruited undergraduate students from a major university in Shanghai. In two of the sessions, the P beauty contest game was run before the 11–20 game, and vice versa for the other two sessions. There was no feedback between these two games. After the subjects completed the games and before the outcomes were revealed, they completed a questionnaire that asked them to specify how they chose the numbers in these two games. Their risk attitudes were also elicited using the Holt and Laury (2002) [4] procedure after they played the two games. Other demographic information such as gender, blood type, and horoscope sign was also collected.
In the 11–20 game, a subject’s payment is the sum of the following two parts: an amount that is equal to the number he/she chooses and a reward of RMB 20 if the number chosen is 1 less than the number chosen by the matched player. In the P beauty contest game, a subject’s payment is RMB 50 if his chosen number is closest to 0.7 times the average guess, and is zero otherwise. In addition to the payments from the games, the subjects also received a participation fee of RMB 5.
5. Experimental Results
5.1. Measurement of the Depth of Thinking
The depth of thinking in the P beauty contest game can be estimated as follows. A player who submitted a number larger than 70 is classified as level 0. In general, a level n player submits a number in the range of .3
In the 11–20 game, Arad and Rubinstein (2012) [3] use the following method to measure the depth of thinking in the 11–20 game.
A player who writes down 20 is classified as level 0, and a player who writes down 19, which is the best response to 20, is classified as level 1, and so on. In general, a player who submitted the number 20–x is classified as level x, where and x is an integer.
Note that one may have an objection to Arad and Rubinstein’s (2012) [3] measurement of the depth of thinking in the 11–20 game. The reason is that, in the 11–20 game, although there is no pure strategy Nash equilibrium, there is a mixed strategy Nash equilibrium, which means that it is unclear to infer the depth of thinking of the players because they may be playing the mixed strategy Nash equilibrium. In this sense, one may also argue that the 11–20 game is even more complicated than the P beauty contest game. In the current paper, we acknowledge this view. However, we use Arad and Rubinstein’s (2012) [3] method of measuring so that we can compare our findings with those of Arad and Rubinstein (2012) [3] and other related studies.
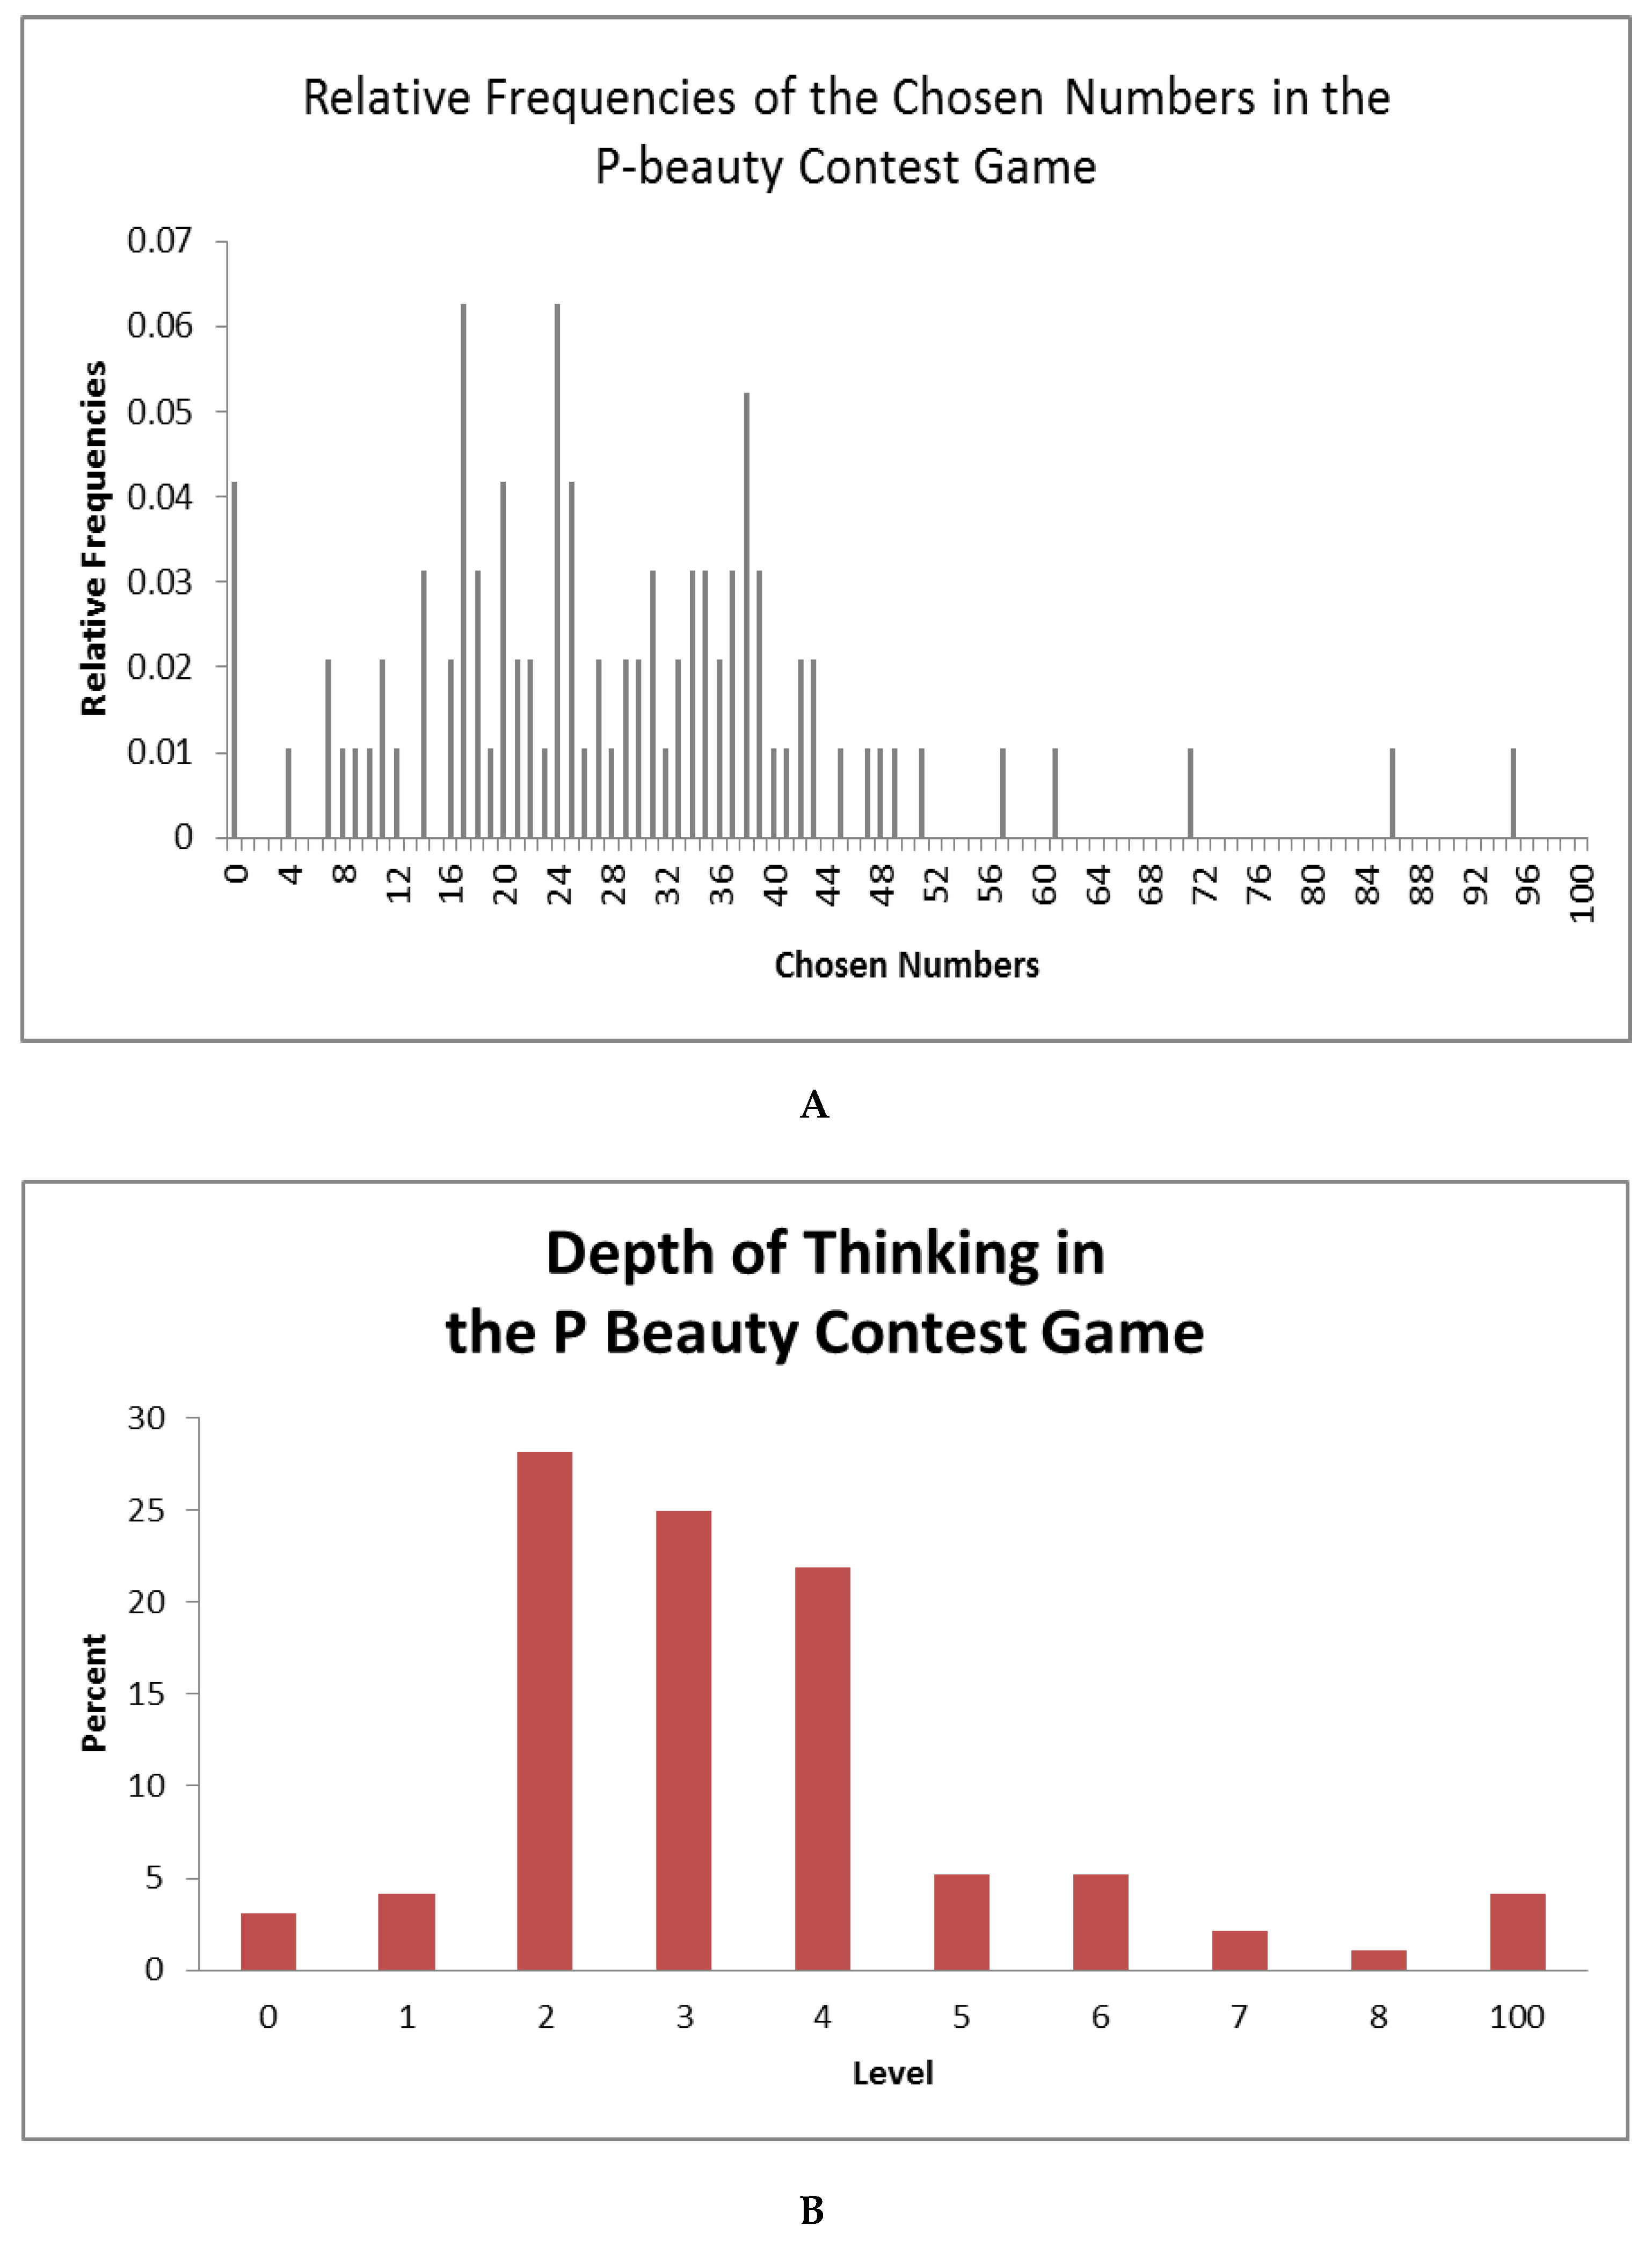
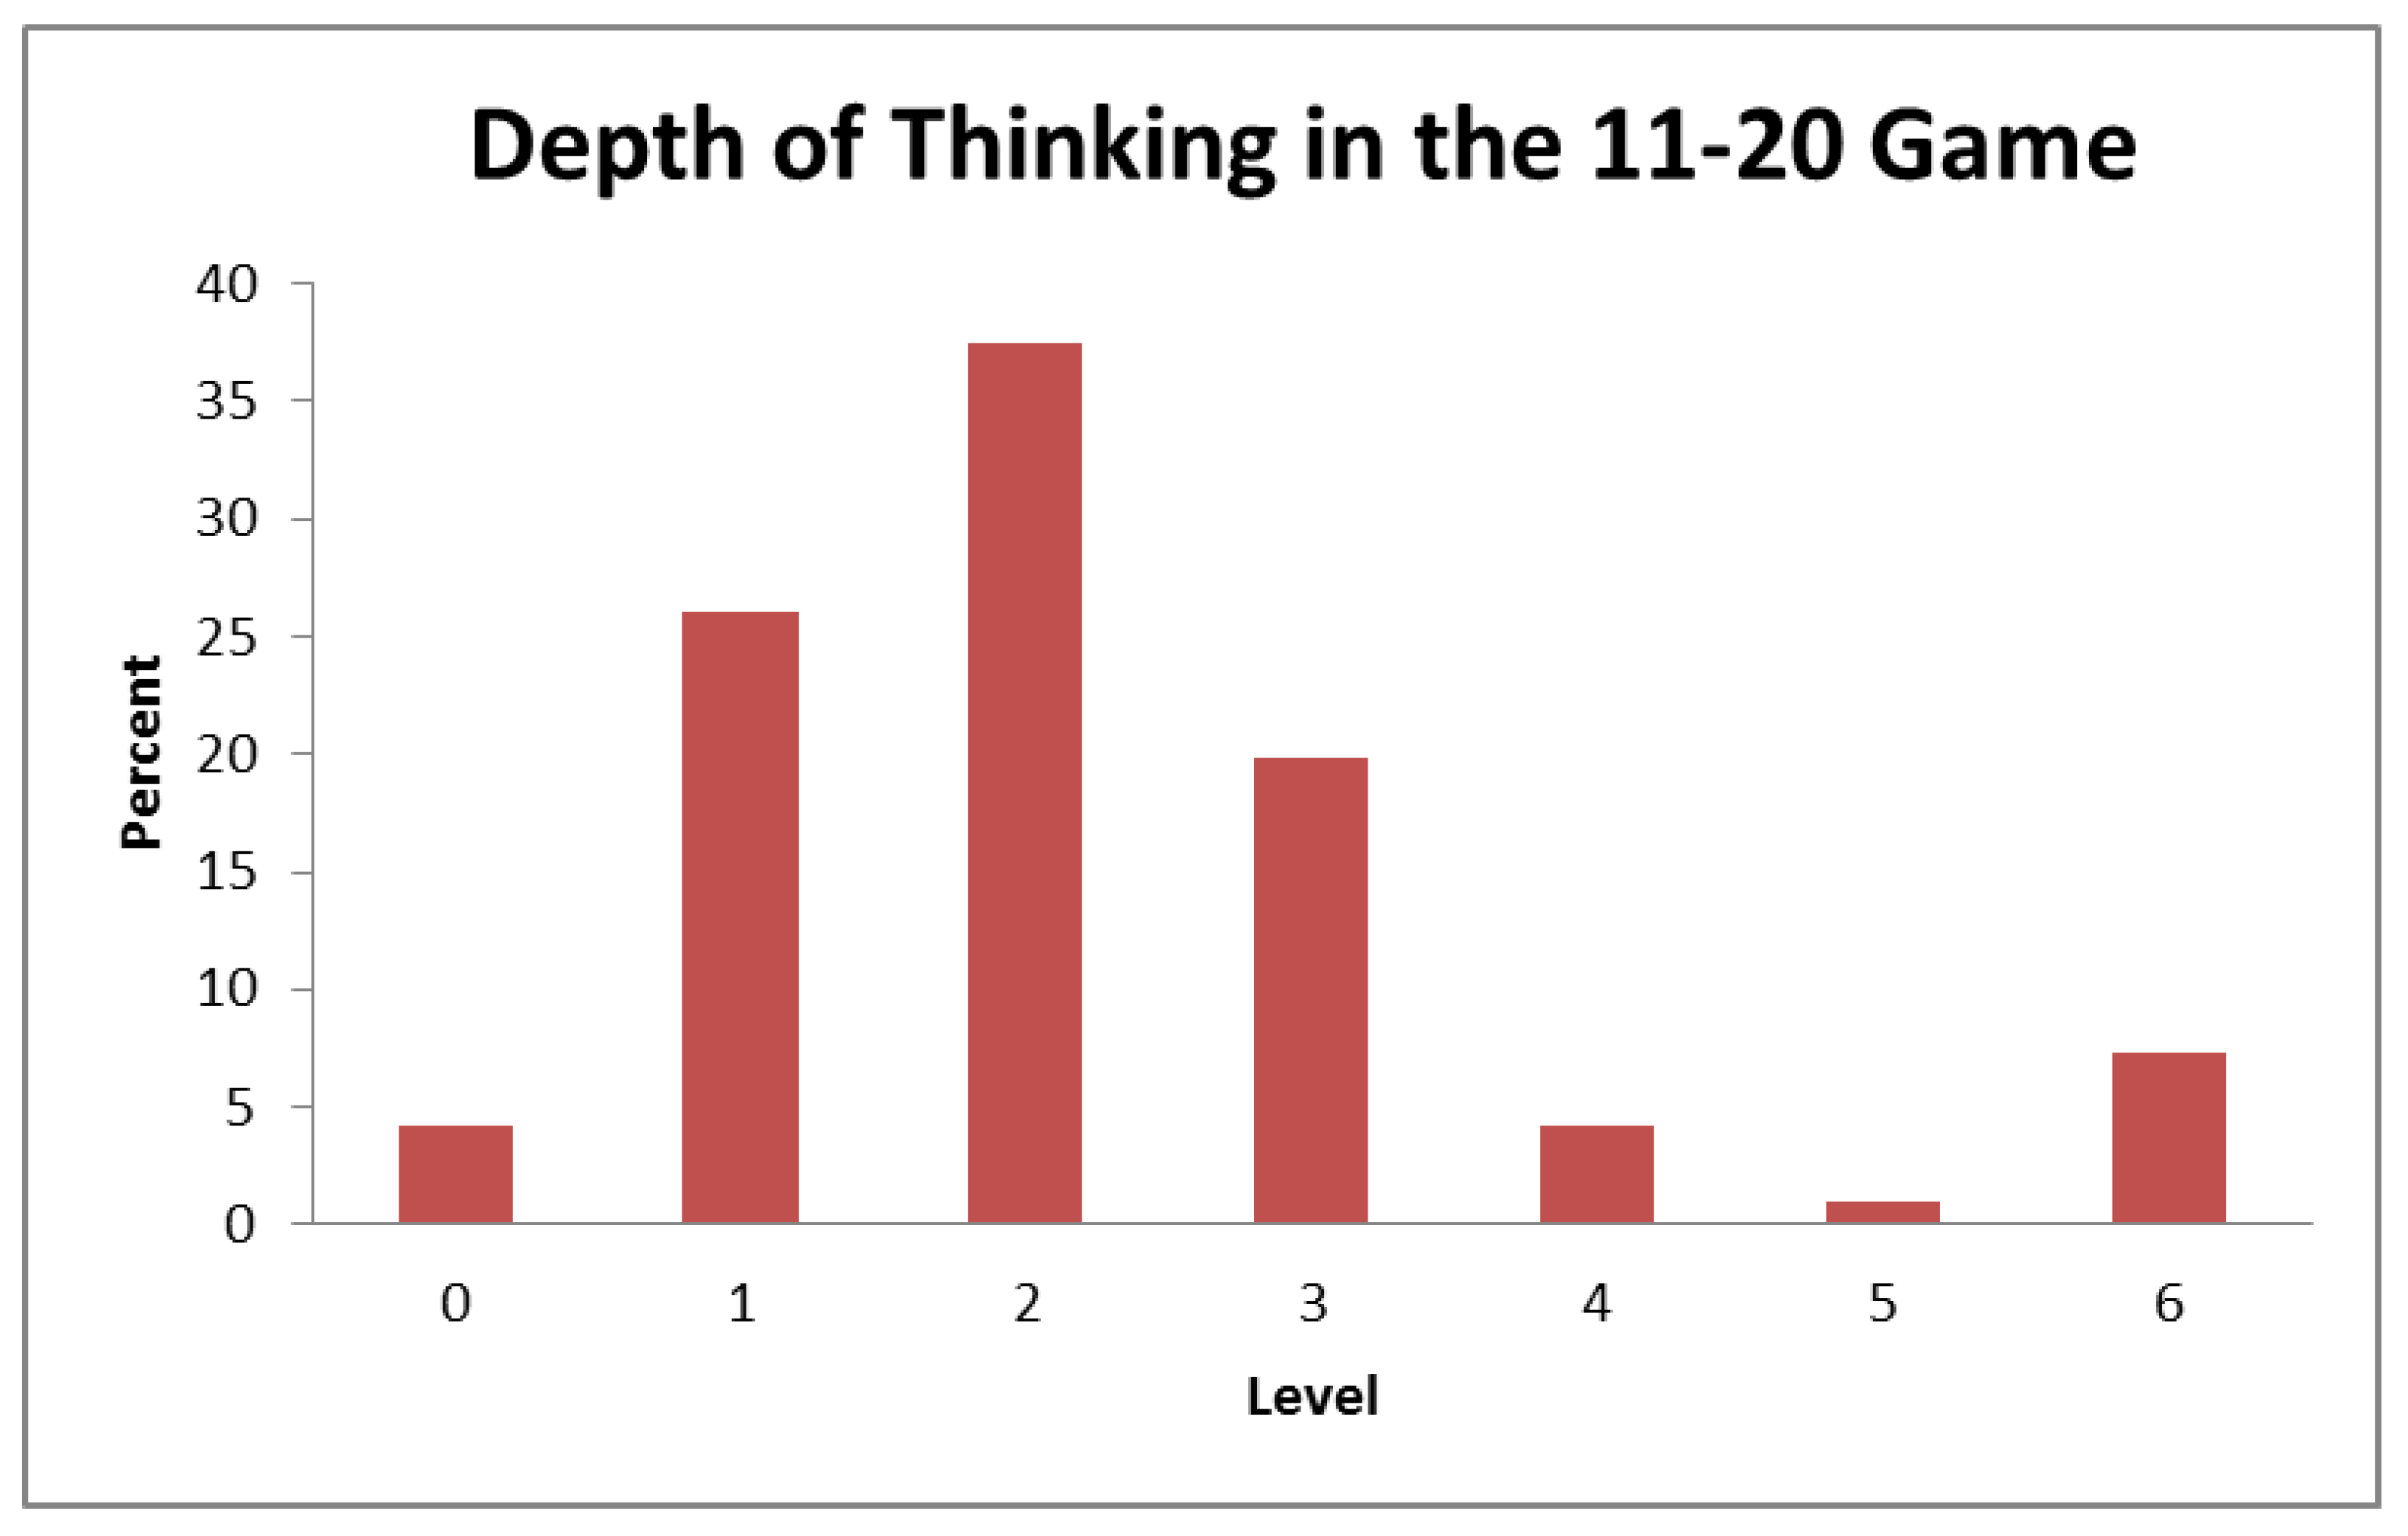
Panel A of Figure 2 reports the relative frequencies of the chosen numbers in the P beauty contest game, and Panel B of Figure 2 reports the inferred depth of thinking. Figure 2 reports the distribution of the chosen numbers in the 11–20 game. Figure 3 reports the distribution of the inferred depth of thinking in the 11–20 game. We can observe that the proportions of choices of low numbers (15 and 16) in our paper are 4% and 1%, respectively, which is much lower than the predicted proportion of 25% in the mixed strategy equilibrium. Note that the equilibrium proportions are calculated based on the assumption that the subjects are risk neutral.
5.2. Risk aversion and choice in the 11–20 Game
We hypothesize that choices made in the 11–20 game are highly influenced by individuals’ risk attitudes. More specifically, we hypothesize that the more risk-averse the individuals are, the more likely it is that they will choose high numbers such as 18, 19 and 20.
Table A2 of the appendix reports the distribution of choices in the Holt and Laury task. We compared the proportion of highly risk-averse subjects among the subjects who chose the high numbers of 18, 19, and 20 with those who chose the low numbers (i.e., 17, 16, 15, 14, 13, 12, and 11).4 We found that 89 percent of the subjects in the high number group are highly risk-averse, which is higher than the 63 percent observed in the low number group. The difference in proportion is significant, with a p-value equal to 0.03, based on the two-sample test of proportions.
Panel A of Figure A1 reports the distribution of the depth of thinking in the 11–20 game conditional on low risk aversion and high risk aversion. Evidently, the two groups have different distributions; the high risk aversion group is more concentrated on low levels. In particular, it is found that the two distributions are significantly different from each other, with a p-value equal to 0.05, based on the Mann–Whitney test.
Column 2 of Table 2 reports the probit regression, where the dependent variable is low depth of thinking in the 11–20 game. The subjects are classified as having a low depth of thinking if they chose high numbers (i.e., 20, 19, and 18) in the game. The estimated coefficients represent the marginal impacts of the independent variables on the probability of exhibiting a low level of thinking. It is found that high risk aversion increases the probability of a low depth of thinking by 27 percent. Hence, our hypothesis is supported. That is, the inferred depth of thinking in the 11–20 game is biased by risk aversion.
Column 4 of Table 2 reports the ordinary least squares (OLS) regression, where the dependent variable is the depth of thinking in the 11–20 game and the independent variable is risk premium5. 5 It is found that the depth of thinking is negatively correlated with risk premium. The result also suggests that there is a non-linear effect on the relationship between risk premium and depth of thinking in the 11–20 game. In particular, the higher is the risk aversion, the larger is the marginal effect.
Columns 1 and 3 of Table 2 report the same set of regressions for the P beauty contest game. It is confirmed that the depth of thinking in the P beauty contest game is not correlated with risk aversion.
In summary, the choices in the 11–20 game are biased by risk aversion.
In Arad and Rubinstein (2012) [3], the authors also conducted a costless iteration version in which a subject who chooses a number in the range 11-19 will receive 17 shekels, while he will receive an additional amount of 20 shekels if the chosen number is one less than the number chosen by the other player. They found that the proportion of subjects corresponding to level 0, 1, 2, and 3 is not significantly different between the costless iteration version treatment and their baseline treatment. They concluded that “the cost of performing an additional iteration (i.e., losing an additional certain shekel) is not the reason that subjects perform no more than three iterations…” In contrast to Arad and Rubinstein (2012) [3], we explicitly investigate the effect of risk aversion on the depth of thinking by measuring subject’s risk aversion and observe its correlation with the depth of thinking. Arguably, our approach is a more direct test on the possible link. Further, it can be shown theoretically that even in the costless iterations version, it is also true that as players become more risk averse, players are more likely to choose high numbers.
5.3. The relationship between choices in the P beauty contest game and the 11–20 game
We find that there is a significantly higher proportion of subjects with a low depth of thinking in the 11–20 game. More specifically, the proportions are 0.68 in the 11–20 game and 0.35 in the P beauty contest game. The difference in proportion is significant, with a p-value equal to 0.00.
One may wonder whether there is any relationship between the choices in the P beauty contest game and the choices in the 11–20 game at the within-subject level. This question is important because, even if the 11–20 game is biased by risk aversion, the problem may not be a serious concern if the ranking of the depth of thinking from the P beauty contest game is preserved in the 11–20 game. That is, there is a shift rather than a re-ordering. It turns out that there is no systematic relationship between the depths of thinking in these two games, except that the level is on average higher in the P beauty contest game. Table A3 (online appendix) reports the OLS regression, where we regress the inferred level of thinking in the P beauty contest game on the inferred level of thinking in the 11–20 game. The result shows that there is no significant relationship between these two levels. Our finding complements a recent finding by Georganas, Healy, and Weber (2015) [8] in which they found no relationship between subjects’ levels observed in the two-person guessing game (Costa-Gomes & Crawford, 2006) [9] and the undercutting game. Our finding provides further evidence on the idea that there is no cross-game correlation between subjects’ levels.
5.4. Comparison of results in P Beauty to Nagel (1995)
The mean number chosen in the P beauty contest game was 28.8. Players tended to guess between 20 and 40, though there were also higher and lower guesses. Choices higher than 100×0.7 and choices lower than 10 were relatively infrequent. Overall, these patterns were similar to those found by Nagel (1995) [2].
5.5. Comparison of results in 11–20 to Arad and Rubinstein (2012)
The pattern of choices observed in our experiment is similar to Arad and Rubinstein (2012) [3]. The vast majority of subjects in our experiment, 83.33 percent, belong to levels 1, 2, and 3 (corresponding to 19, 18, and 17, respectively), which is similar to the 77 percent observed in Arad and Rubinstein (2012) [3]. The difference is not significant under the proportion test. Similarly, only 4.17 percent of subjects are at level 0, which is similar to the 6 percent observed in Arad and Rubinstein (2012). Only 12.5 percent of the subjects exhibit level 4 or higher, which is similar to the 12.5 percent observed in Arad and Rubinstein (2012) [3].
6. Discussion
Arad and Rubinstein (2012) [3] found that the choices in the 11–20 game cannot be explained by a mixed strategy Nash equilibrium (they assume the players to be risk-neutral). In particular, they found that the proportion of subjects choosing the low numbers of 15 and 16 is much lower than their theoretical prediction, in which the subjects are assumed to be risk-neutral. In this paper, first, we theoretically show that when players are risk averse, players will choose large numbers with larger probabilities than the risk-neutral case. Hence, our theory can explain why the low numbers are chosen less frequently, and subsequently, the mixed strategy equilibrium with risk-averse players can explain the choices in the 11–20 game.
Further, we experimentally show that the choices in the 11–20 game are biased by risk aversion in the sense that the more risk-averse the player is, the more likely the higher number will be chosen. On the other hand, the choices in the P beauty contest game are not biased by risk aversion.
Appendix A
Figure A1.
Depth of Thinking and Risk Aversion. (A) Depth of Thinking in the P-beauty Contest Game and Risk Aversion; (B) Depth of Thinking in the 11–20 Game and Risk Aversion.
Figure A1.
Depth of Thinking and Risk Aversion. (A) Depth of Thinking in the P-beauty Contest Game and Risk Aversion; (B) Depth of Thinking in the 11–20 Game and Risk Aversion.


Table A1.
The Gambles.
| Choice | Gamble A | Gamble B | Expected Value of Gamble A | Expected Value of Gamble B |
|---|---|---|---|---|
| 1 | 1/10 , RMB 20 ; 9/10, RMB 16 | 1/10 , RMB 38.5 ; 9/10, RMB 1 | 16.4 | 4.75 |
| 2 | 2/10 , RMB20 ; 8/10, RMB16 | 2/10 , RMB 38.5 ; 8/10, RMB 1 | 16.8 | 8.5 |
| 3 | 3/10 , RMB20 ; 7/10, RMB16 | 3/10 , RMB 38.5 ; 7/10, RMB 1 | 17.2 | 12.25 |
| 4 | 4/10 , RMB20 ; 6/10, RMB16 | 4/10 , RMB 38.5 ; 6/10, RMB 1 | 17.6 | 16 |
| 5 | 5/10 , RMB20 ; 5/10, RMB16 | 5/10 , RMB 38.5 ; 5/10, RMB 1 | 18 | 19.75 |
| 6 | 6/10 , RMB20 ; 4/10, RMB16 | 6/10 , RMB 38.5 ; 4/10, RMB 1 | 18.4 | 23.5 |
| 7 | 7/10 , RMB20 ; 3/10, RMB16 | 7/10 , RMB 38.5 ; 3/10, RMB 1 | 18.8 | 27.25 |
| 8 | 8/10 , RMB20 ; 2/10, RMB16 | 8/10 , RMB 38.5 ; 2/10, RMB 1 | 19.2 | 31 |
| 9 | 9/10 , RMB20 ; 1/10, RMB16 | 9/10 , RMB 38.5 ; 1/10, RMB 1 | 19.6 | 34.75 |
| 10 | 10/10 , RMB20 ; 0/10, RMB16 | 10/10 , RMB 38.5 ; 0/10, RMB 1 | 20 | 38.5 |
Table A2.
Choice in the Gambles.
| Choice in which Subject Switched to Gamble B | Proportion of Choices |
|---|---|
| 1 | 0 |
| 2 | 0 |
| 3 | 0.07 |
| 4 | 0.15 |
| 5 | 0.25 |
| 6 | 0.16 |
| 7 | 0.26 |
| 8 | 0.08 |
| 9 | 0.04 |
| 10 | 0 |
Table A3.
The Relationship between the Depth of Thinking in the P Beauty Contest Game and the 11–20 Game.
Table A3.
The Relationship between the Depth of Thinking in the P Beauty Contest Game and the 11–20 Game.
| Dependent Variable: Depth of Thinking in P Beauty Contest game | |
|---|---|
| Depth of Thinking in the 11–20 Game | −0.02 |
| (0.11) | |
| Constant | 3.31 *** |
| (0.32) | |
| R-squared | 0.001 |
| Number of Observations | 92 |
Notes: This table reports the OLS regression on the relationship between the depth of thinking in the P beauty contest game and the 11–20 game. We exclude 4 observations with a level equal to 100 in the P Beauty game to prevent the regression from being affected by these extreme values. Robust standard errors are in parentheses. *, **, and *** represent significance at the10 percent, 5 percent, and 1 percent levels, respectively.
Appendix B
Suppose both players’ utilities have the form , where x is the money that a player obtains and r is the player’s risk aversion level. We assume that for each player, r is randomly and independently drawn from a uniform distribution on [0, 2]. Each player’s risk aversion level r is the player’s private information, while the distribution of r is common knowledge among players.
Let be such that , where . It can be shown that and it can be verified that if and only if .
Let be such that , where and . It can be shown that and it can be verified that , if and only if .
Let be such that , where and . It can be shown that and it can be verified that if and only if .
Let be such that , where and . It can be shown that and it can be verified that if and only if .
Finally, it can be verified that for all , we have , where and .
The above analysis implies that in equilibrium, the player with 1.815 < r < 2 will choose 20; the player with 1.4708 < r < 1.815 will choose 19; the player with 0.9933 < r < 1.4708 will choose 18; the player with 0.4051 < r < 0.9933 will choose 17; and the player with 0 < r < 0.4051 will choose 16.
Finally, note that the above analysis is based on the assumption that r is drawn from [0, 2], which implies that players are risk neutral or risk averse. We can also allow r to be drawn from an interval that contains r < 0 so that players can be risk loving. This will not change the above result qualitatively; i.e., it is still true that as players become less and less risk averse (and more and more risk loving), players are more and more likely to choose low numbers.
Appendix C
Experimental Instructions
The experiment was conducted in Chinese, and the original instructions were also in
Chinese (available upon request). The treatment names in brackets were not shown.
Instructions [P Beauty Contest Game]
Welcome to our experimental study on decision-making. You will receive a show-up fee of RMB 5. In addition, you can gain more money as a result of your decisions in the experiment.
You will be given a subject ID number. Please keep it confidential. Your decisions will be anonymous and kept confidential. Thus, other participants will not be able to link your decisions with your identity. You will be paid in private, using your subject ID, and in cash at the end of the experiment.
If you have any questions, please feel free to ask by raising your hand, and one of our assistants will come to answer your questions. Please DO NOT communicate with any other participants.
The rule of the game is as follows:
Each player is asked to choose a number between 0 and 100 (0 and 100 inclusive, up to two decimal places). The player with the chosen number being closest to 0.7 times the average guess wins a prize of RMB 50. If two or more players win, the winner will be randomly chosen.
My Decision
Number:
Subject ID:
Instructions [11–20 Game]
Welcome to our experimental study on decision-making. You will receive a show-up fee of RMB 5. In addition, you can gain more money as a result of your decisions in the experiment.
You will be given a subject ID number. Please keep it confidential. Your decisions will be anonymous and kept confidential. Thus, other participants will not be able to link your decisions with your identity. You will be paid in private, using your subject ID, and in cash at the end of the experiment.
If you have any questions, please feel free to ask by raising your hand, and one of our assistants will come to answer your questions. Please DO NOT communicate with any other participants.
The rule of the game is as follows:
Every player writes down a number that must be between 11 and 20 (11 and 20 inclusive) and also be an integer. Every player is matched with another player to form a pair. Your payoff will be determined as follows: First, each player in each pair receives the amount equal to the number that he/she specified. Second, in each pair, the player whose number is exactly one less than the other player receives an additional amount of RMB 20.
My Decision
Number:
Subject ID:
References
- Keynes, J.M. The General Theory of Interest, Employment and Money; Palgrave Macmillan: London, UK, 1936. [Google Scholar]
- Nagel, R. Unraveling in guessing games: An experimental study. Am. Econ. Rev. 1995, 1313–1326. [Google Scholar]
- Arad, A.; Rubinstein, A. The 11–20 money request game: A level-k reasoning study. Am. Econ. Rev. 2012, 102, 3561–3573. [Google Scholar] [CrossRef]
- Holt, C.A.; Laury, S.K. Risk aversion and incentive effects. Am. Econ. Rev. 2002, 92, 1644–1655. [Google Scholar] [CrossRef]
- Goeree, J.K.; Louis, P.; Zhang, J. Noisy introspection in the “11–20” game. Econ. J. 2018, 128, 1509–1530. [Google Scholar] [CrossRef]
- Goeree, J.K.; Holt, C.A. A model of noisy introspection. Games Econ. Behav. 2004, 46, 365–382. [Google Scholar] [CrossRef] [Green Version]
- Alaoui, L.; Penta, A. Endogenous depth of reasoning. Rev. Econ. Stud. 2015, 83, 1297–1333. [Google Scholar] [CrossRef]
- Georganas, S.; Healy, P.J.; Weber, R.A. On the persistence of strategic sophistication. J. Econ. Theory 2015, 159, 369–400. [Google Scholar] [CrossRef] [Green Version]
- Costa-Gomes, M.A.; Crawford, V.P. Cognition and behavior in two-person guessing games: An experimental study. Am. Econ. Rev. 2006, 96, 1737–1768. [Google Scholar] [CrossRef]
| 1 | Alaoui and Penta (2015) [7] present a model in which the player’s depth of thinking is endogenously determined. In their approach, individuals act as if they follow a cost-benefit analysis. Our approach is related to their approach in the sense that players face a trade-off over whether to forego a higher fixed payoff (cost) for the possibility of obtaining the reward (benefit). |
| 2 | Unfortunately, this result cannot be generalized to the general case that allows arbitrary utility functions or allows arbitrary distribution of the risk aversion level. For example, for the CARA utility, it can be verified that the equilibrium thresholds may not be monotonic. |
| 3 | In the literature, an alternative method for classifying the depth of thinking is to use 50 as a reference point for level 0. We do not use 50 as the reference point because doing so would require dropping data points above 50. Nevertheless, our result remains qualitatively the same, and significant, if we use 50 as the reference point. |
| 4 | Highly risk-averse subjects are defined as those who switch from gamble A to gamble B in choice 8 or later (i.e., the subject has chosen 7 safe choices (gamble A)). Our design very closely follows that of Holt and Laury (2002) [4]. This group of subjects is also described as very risk averse by Holt and Laury (2002) [4]. Table A1 (online appendix) reports the expected value of the gambles, assuming that the subjects take the objective probability as given. We can observe that, if a subject is risk neutral, then he should switch from gamble A to gamble B starting with choice 5. Thus, an individual who switched to gamble B at choice 8 or later must be highly risk averse. Holt and Laury (2002) [3] estimate the coefficient of relative risk aversion of their subjects using the utility function u(x) = x1 − r/(1−r) for x > 0. It is found that the coefficient of relative risk aversion increases with the number of safe choices. For example, when the subject switched at choice 8, the implied range of relative risk aversion is 0.68 < r < 0.97; thus, they classify the subject as “very risk averse”. |
| 5 | The risk premium of subjects who switched to gamble B in choice n is equal to [(the expected value of gamble A in choice n—the expected value of gamble B in choice n) + (the expected value of gamble A in choice (n−1)—the expected value of gamble B in choice (n−1))]/2. |
Figure 1.
Illustration of “More Risk-Aversion”.

Figure 2.
The Relative Frequencies of the Chosen Numbers and the Depth of Thinking in the P Beauty Contest Game. (A) The Relative Frequencies of the Chosen Numbers in the P-beauty Contest Game; (B) The Depth of Thinking in the P Beauty Contest Game.
Figure 2.
The Relative Frequencies of the Chosen Numbers and the Depth of Thinking in the P Beauty Contest Game. (A) The Relative Frequencies of the Chosen Numbers in the P-beauty Contest Game; (B) The Depth of Thinking in the P Beauty Contest Game.

Figure 3.
The Depth of Thinking in the 11–20 Game.

Table 1.
Distribution of Choices.
| Number | 11 | 12 | 13 | 14 | 15 | 16 | 17 | 18 | 19 | 20 |
|---|---|---|---|---|---|---|---|---|---|---|
| Equilibrium when players are risk neutral (%) | 0 | 0 | 0 | 0 | 25 | 25 | 20 | 15 | 10 | 5 |
| Equilibrium when players have utility u(x) = x1−r/(1 − r) with r = 1.37 (%) | 0 | 0 | 0 | 0 | 0 | 22.2 | 30.5 | 23.3 | 16 | 8 |
| Equilibrium when players have utility u(x)=1−eαx with α = 0.15 (%) | 0 | 0 | 0 | 0 | 0 | 0 | 20 | 38.1 | 27.2 | 14.7 |
| Experimental Results by Arad and Rubinstein (2012) (%) | 4 | 0 | 3 | 6 | 1 | 6 | 32 | 30 | 12 | 6 |
| Our Experimental Results (%) | 0 | 0 | 0 | 7.3 | 1 | 4.2 | 19.8 | 37.5 | 26 | 4.2 |
Table 2.
The Determinants of Depth of Thinking.
| Dependent Variable: Low Depth of Thinking | Dependent Variable: Depth of Thinking | |||
|---|---|---|---|---|
| (1) P Beauty Contest Game | (2)11–20 Game | (3)P Beauty Contest Game | (4)11–20 Game | |
| Risk Premium5 | 0.00004 | −1.99e−06 *** | ||
| (0.00005) | (7.27e−07) | |||
| High Risk Aversion | 0.04 | 0.27 *** | ||
| (0.13) | (0.09) | |||
| Constant | 6.34 *** | 2.34 *** | ||
| (2.10) | (0.16) | |||
| R-squared | 0.04 | 0.02 | ||
| Pseudo R-squared | 0.001 | 0.03 | ||
| Number of Observations | 96 | 96 | 89 | 89 |
Notes: Columns 1 and 2 report the marginal impact of risk premium on the exhibition of a low depth of thinking. The marginal impacts are estimated using probit regression. In both the P beauty contest game and the 11–20 game, the subjects who exhibited a low depth of thinking are those with level 0, 1, or 2. High risk aversion is a dummy that takes the value of 1 if the subject switches from gamble A to gamble B from choice 8 or later in the lottery task. Columns 3 and 4 report the OLS regression estimates on the depth of thinking. The risk premium of subjects who switched to gamble B in choice n is equal to [(the expected value of gamble A in choice n—the expected value of gamble B in choice n) + (the expected value of gamble A in choice (n−1)—the expected value of gamble B in choice (n-1))]/2. Robust standard errors are in parentheses. The number of subjects in regression 3 and 4 is 89 because 7 subjects always chose gamble B, and hence these subjects are not included as their risk premium cannot be estimated. *, **, and *** represent significance at the 10 percent, 5 percent, and 1 percent levels, respectively.
© 2018 by the authors. Licensee MDPI, Basel, Switzerland. This article is an open access article distributed under the terms and conditions of the Creative Commons Attribution (CC BY) license (http://creativecommons.org/licenses/by/4.0/).
Share and Cite
MDPI and ACS Style
Li, K.K.; Rong, K. Choices in the 11–20 Game: The Role of Risk Aversion. Games 2018, 9, 53. https://doi.org/10.3390/g9030053
AMA Style
Li KK, Rong K. Choices in the 11–20 Game: The Role of Risk Aversion. Games. 2018; 9(3):53. https://doi.org/10.3390/g9030053
Chicago/Turabian StyleLi, King King, and Kang Rong. 2018. "Choices in the 11–20 Game: The Role of Risk Aversion" Games 9, no. 3: 53. https://doi.org/10.3390/g9030053
Note that from the first issue of 2016, this journal uses article numbers instead of page numbers. See further details here.