
Salience and Strategy Choice in 2 × 2 Games

Abstract
:1. Introduction

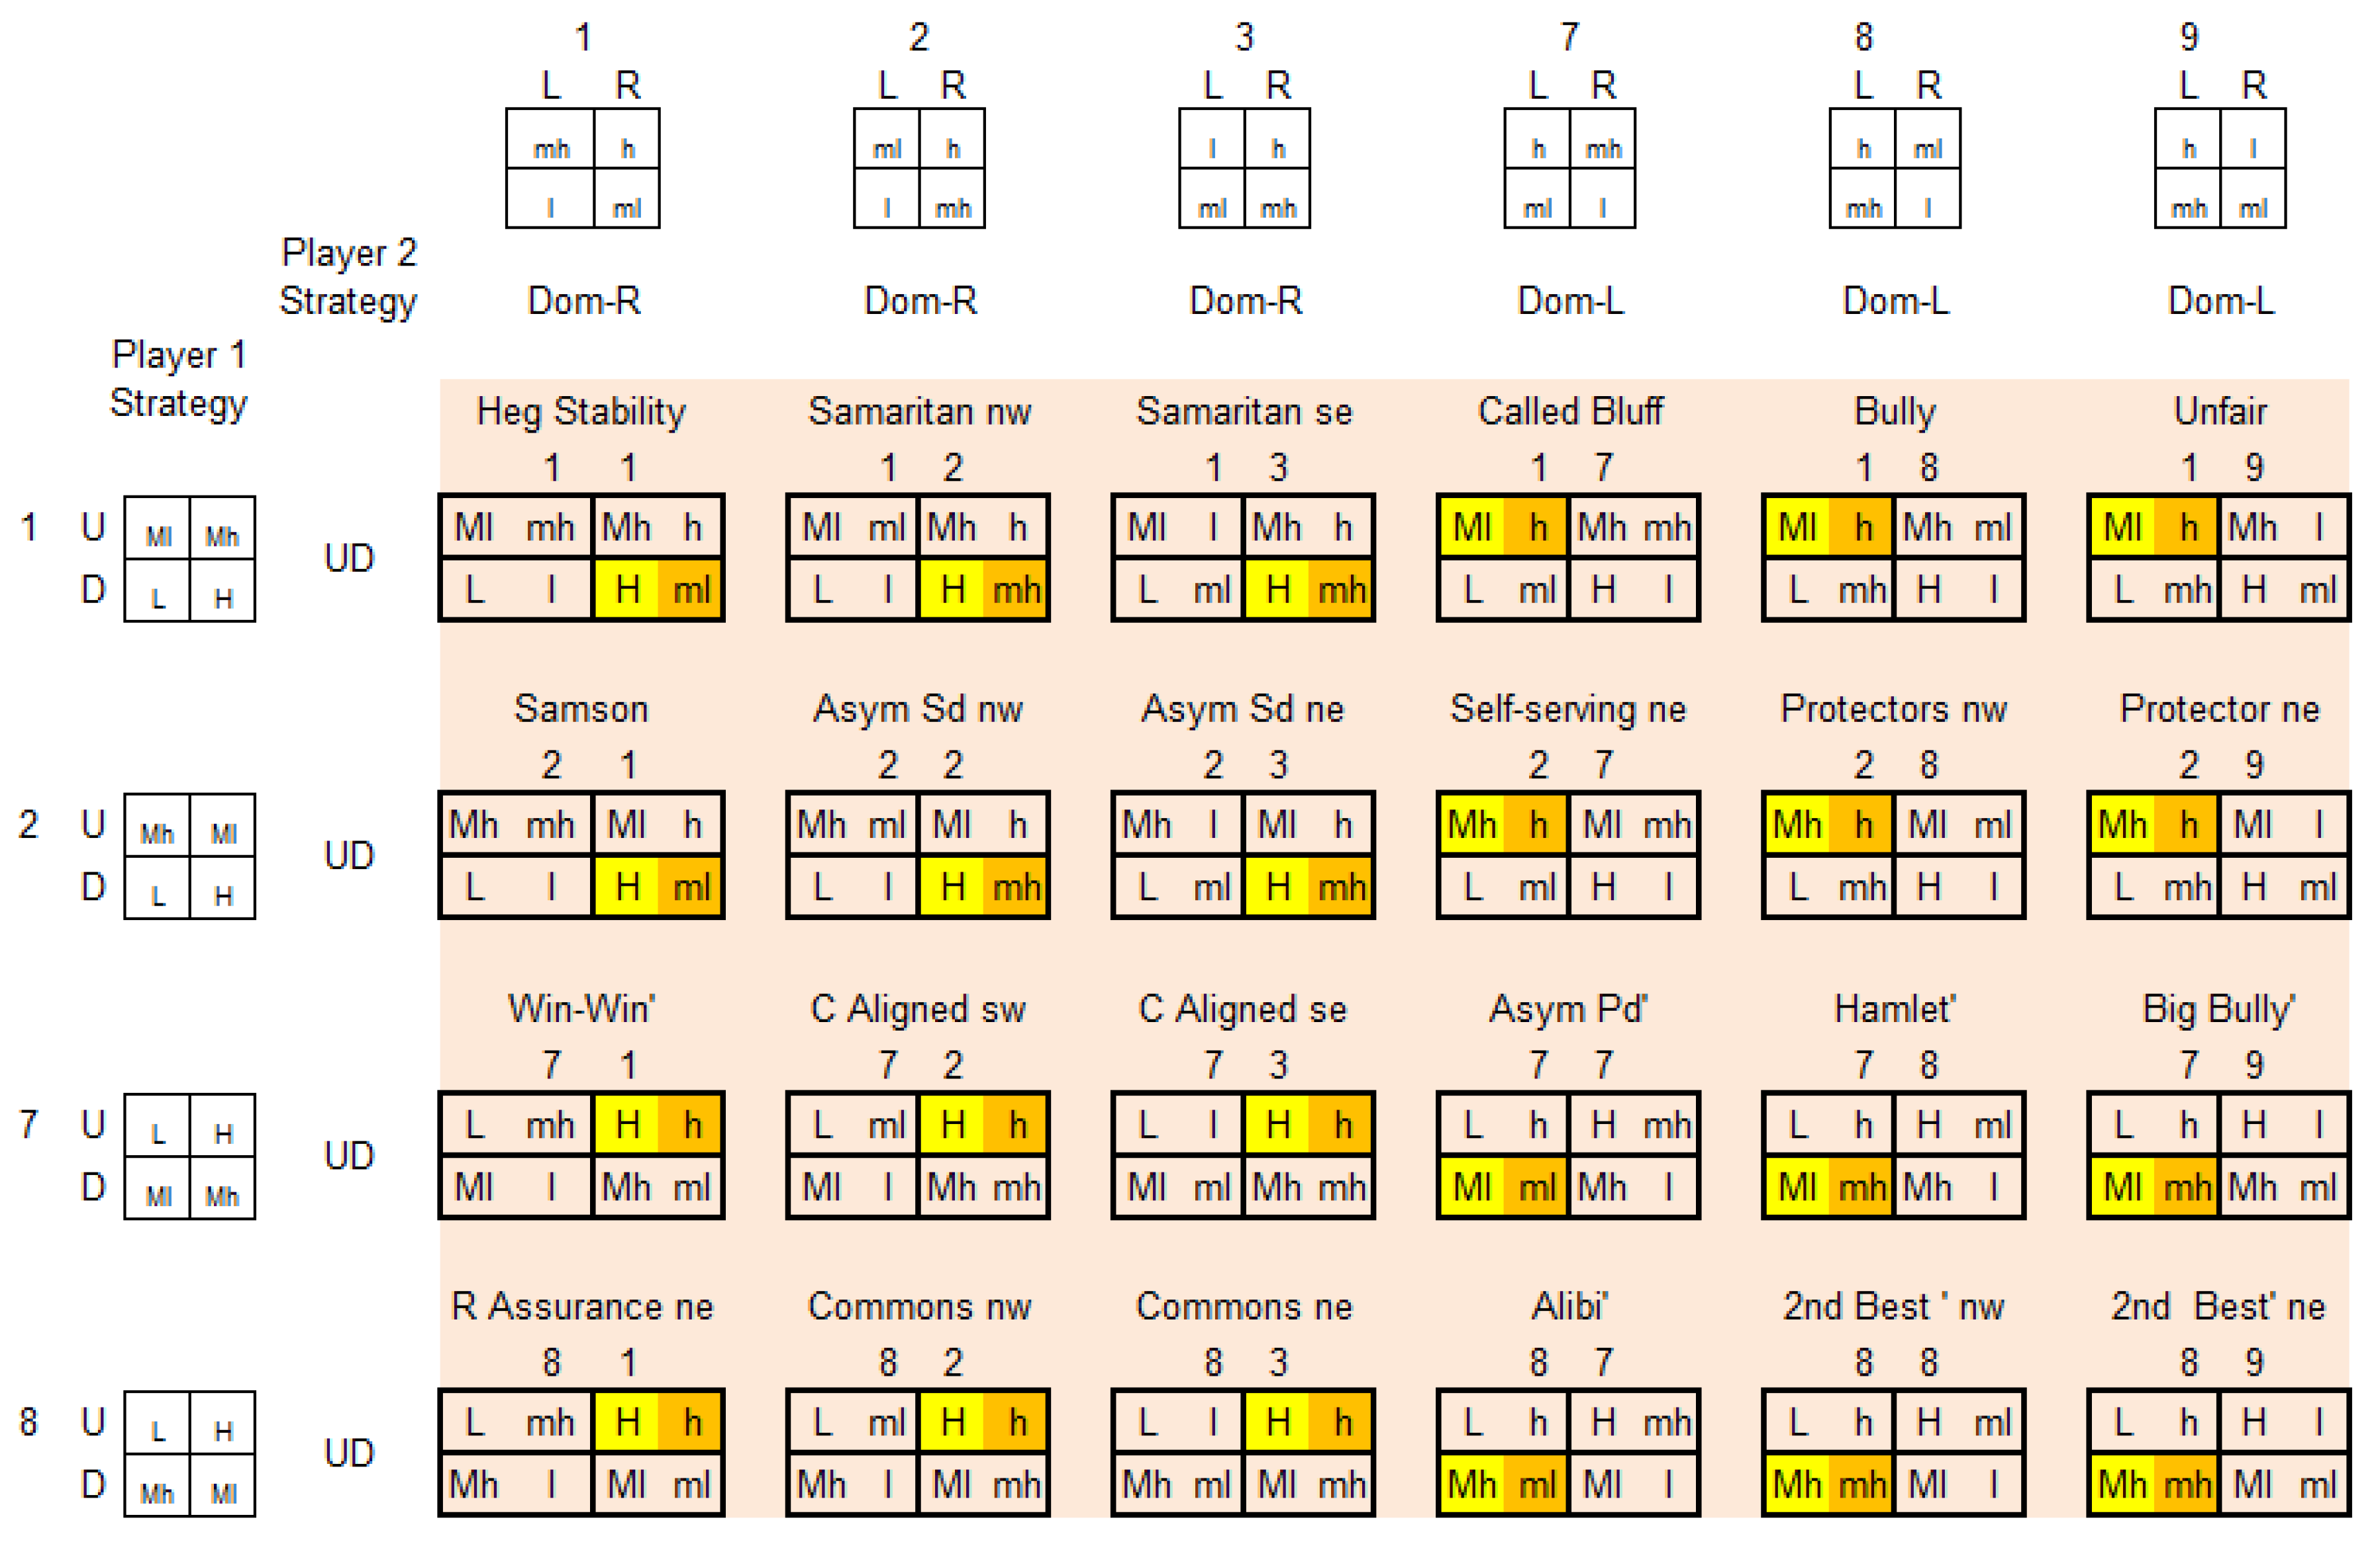
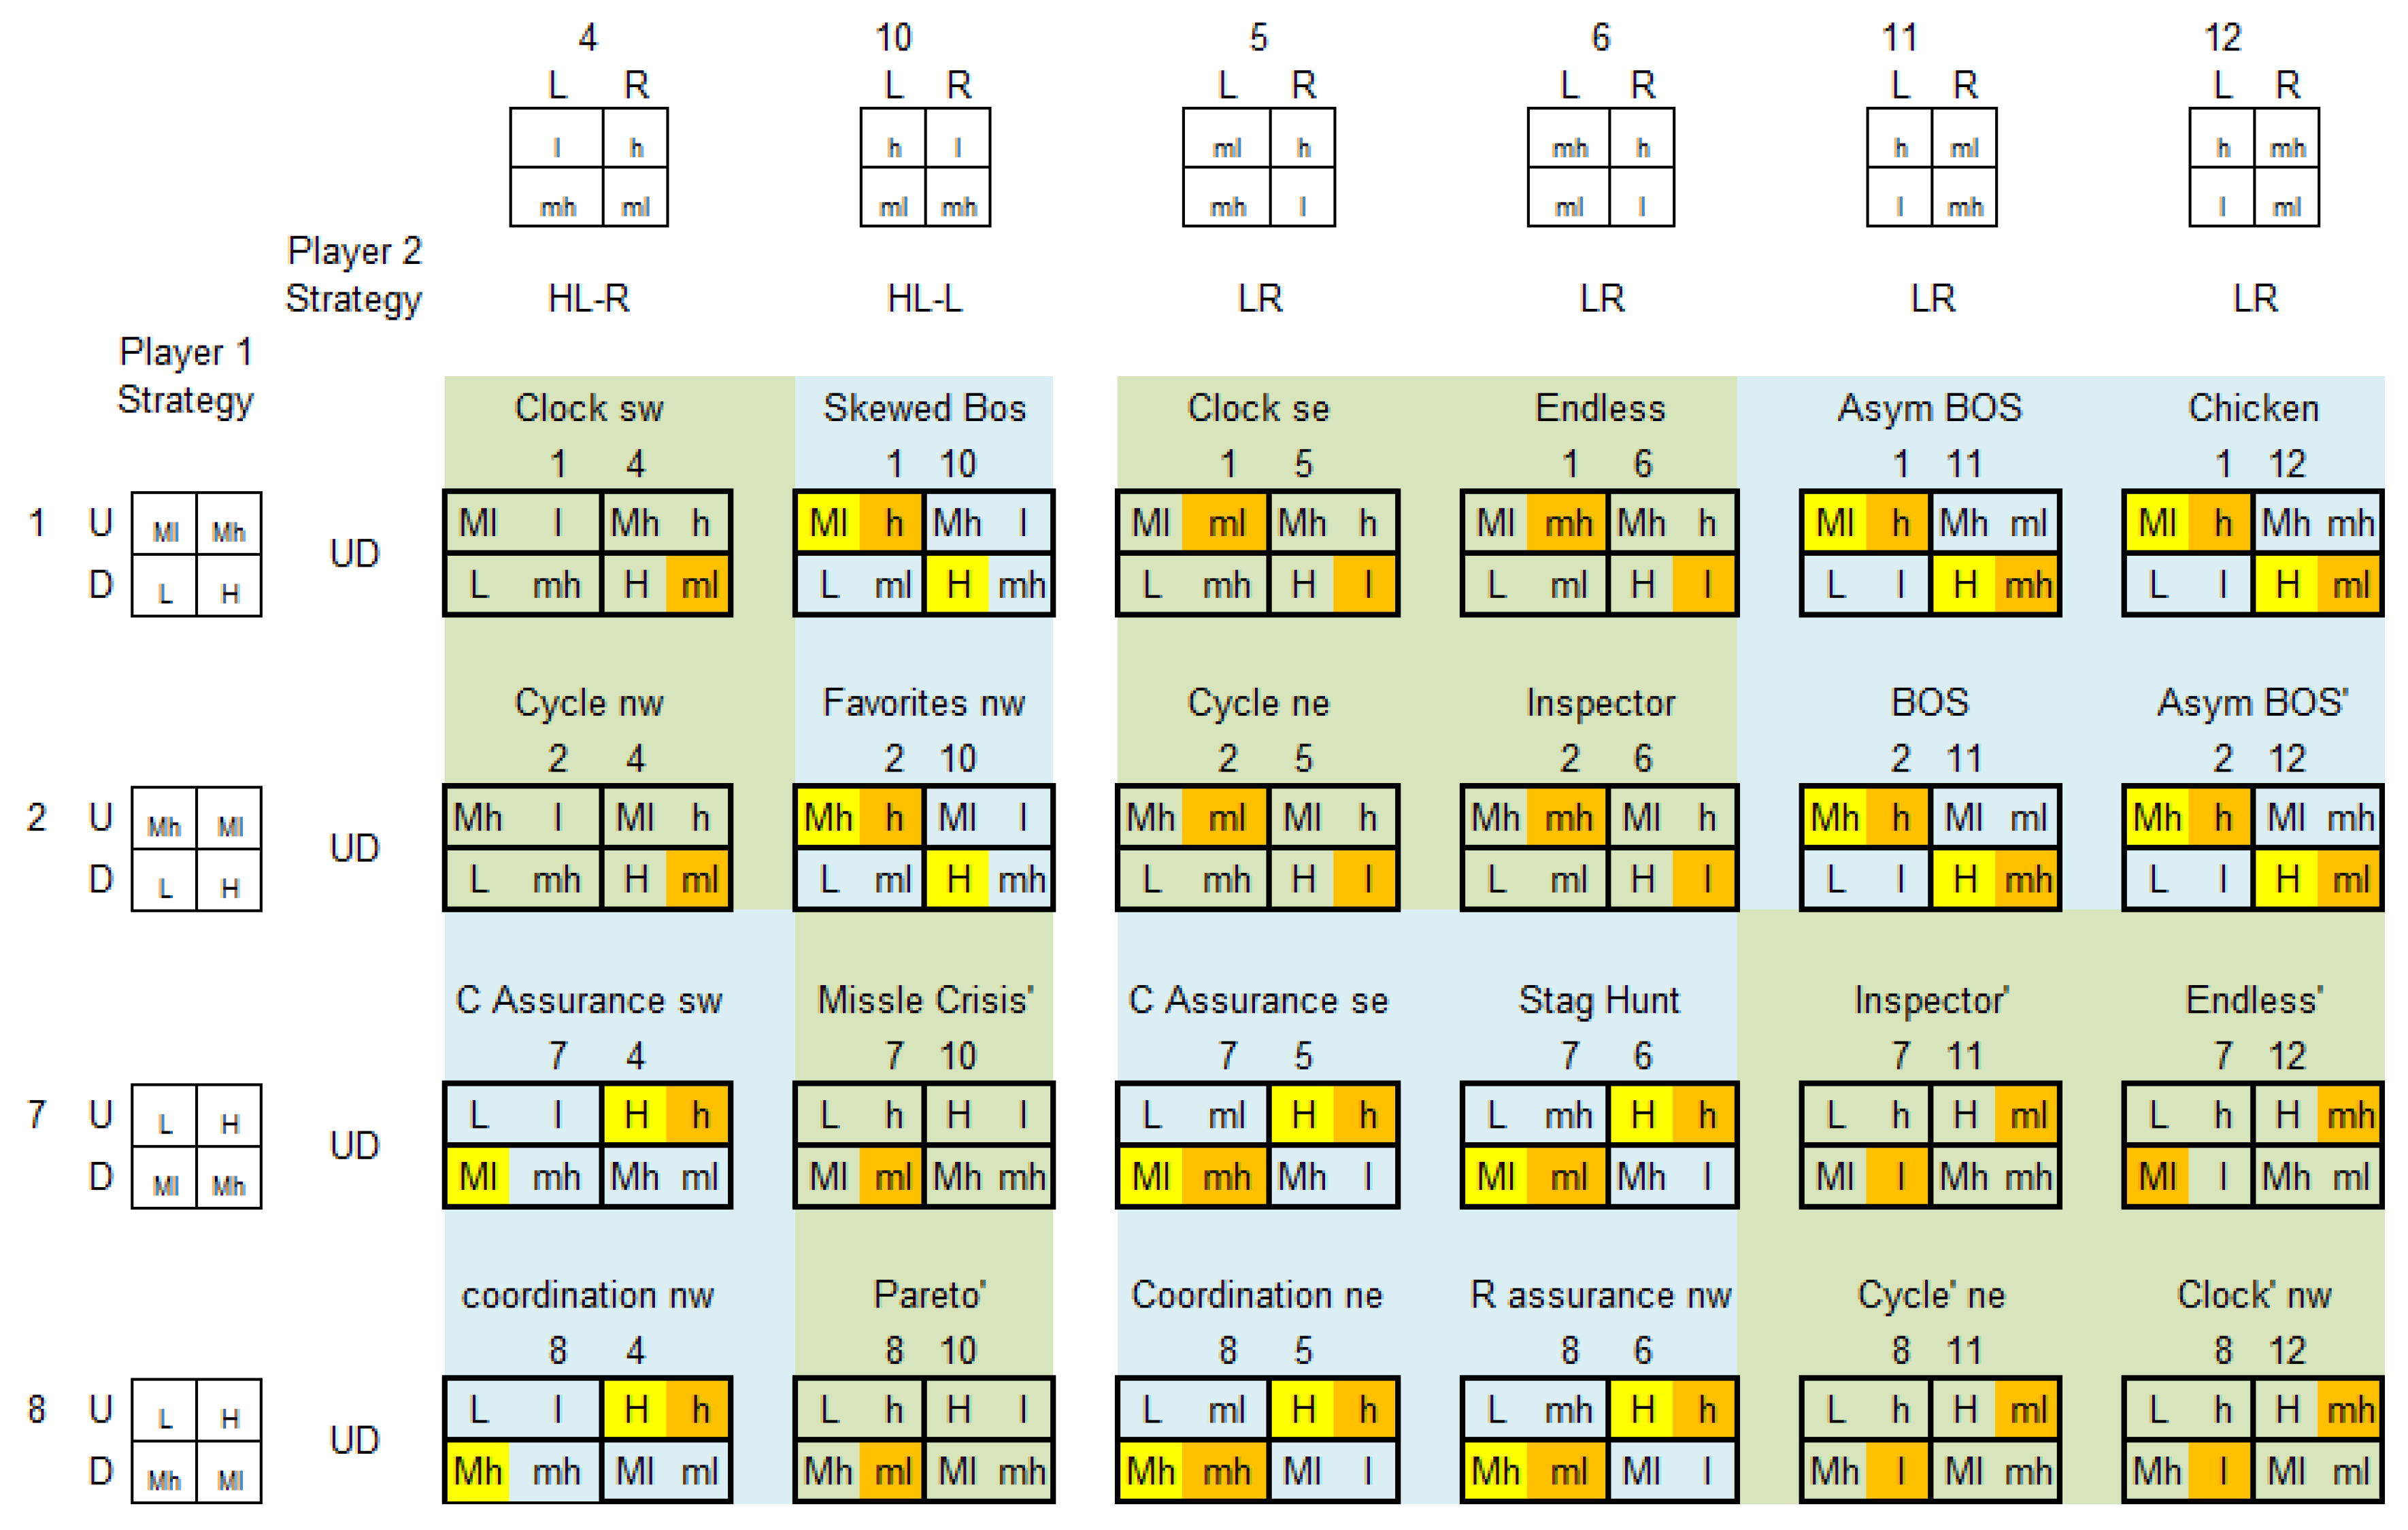
2. Salience and Play in 2 × 2 Games

| Left | Right | |
|---|---|---|
| Up | ||
| Down |
2.1. Implications of Own-Payoff Salience


- (i)
- HL-U/HL-R
- (ii)
- HL-D/Dom-R
- (iii)
- HL-U/Dom-R
- (iv)
- Dom-U/HL-R
- (v)
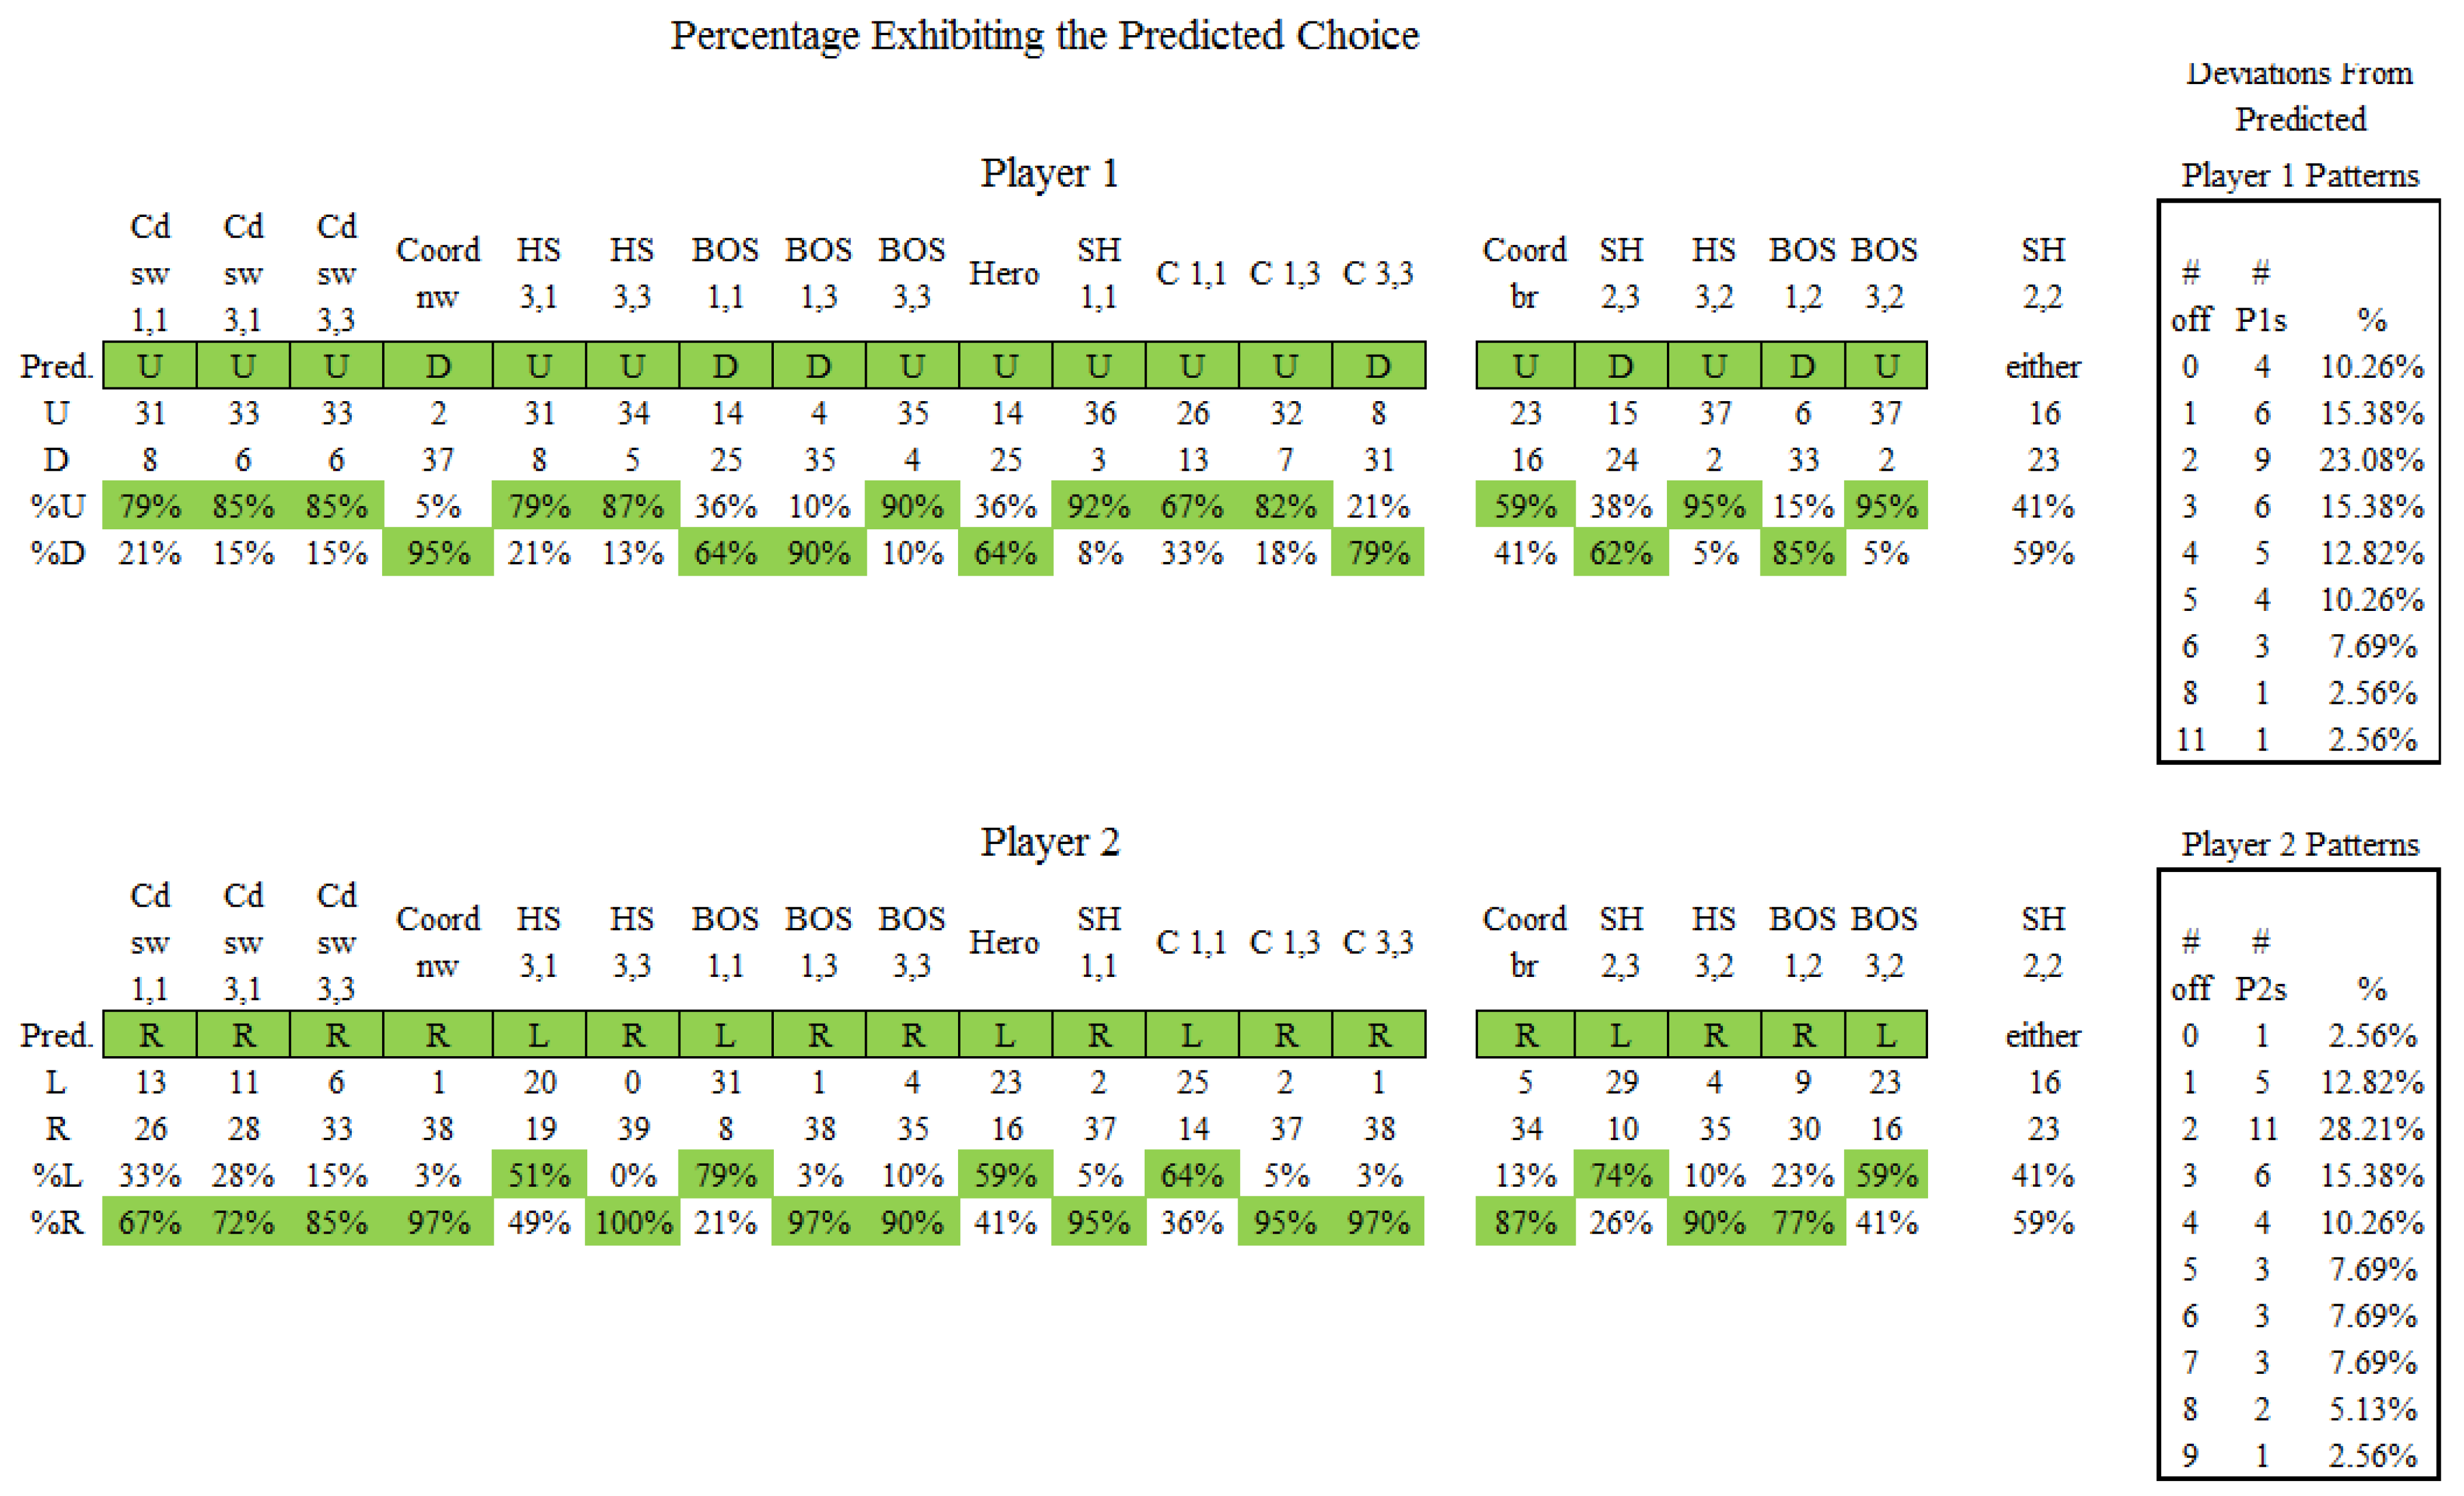
- Dom-U/HL-L
- (i)
- HL-D/HL-L
- (ii)
- HL-D/Dom-L
- (iii)
- HL-U/Dom-L
- (iv)
- Dom-D/HL-R
- (v)
- Dom-D/HL-L
2.2. Implications of Other-Payoff Salience


3. Experimental Results
3.1. Design and Implementation
3.2. Results and Analysis
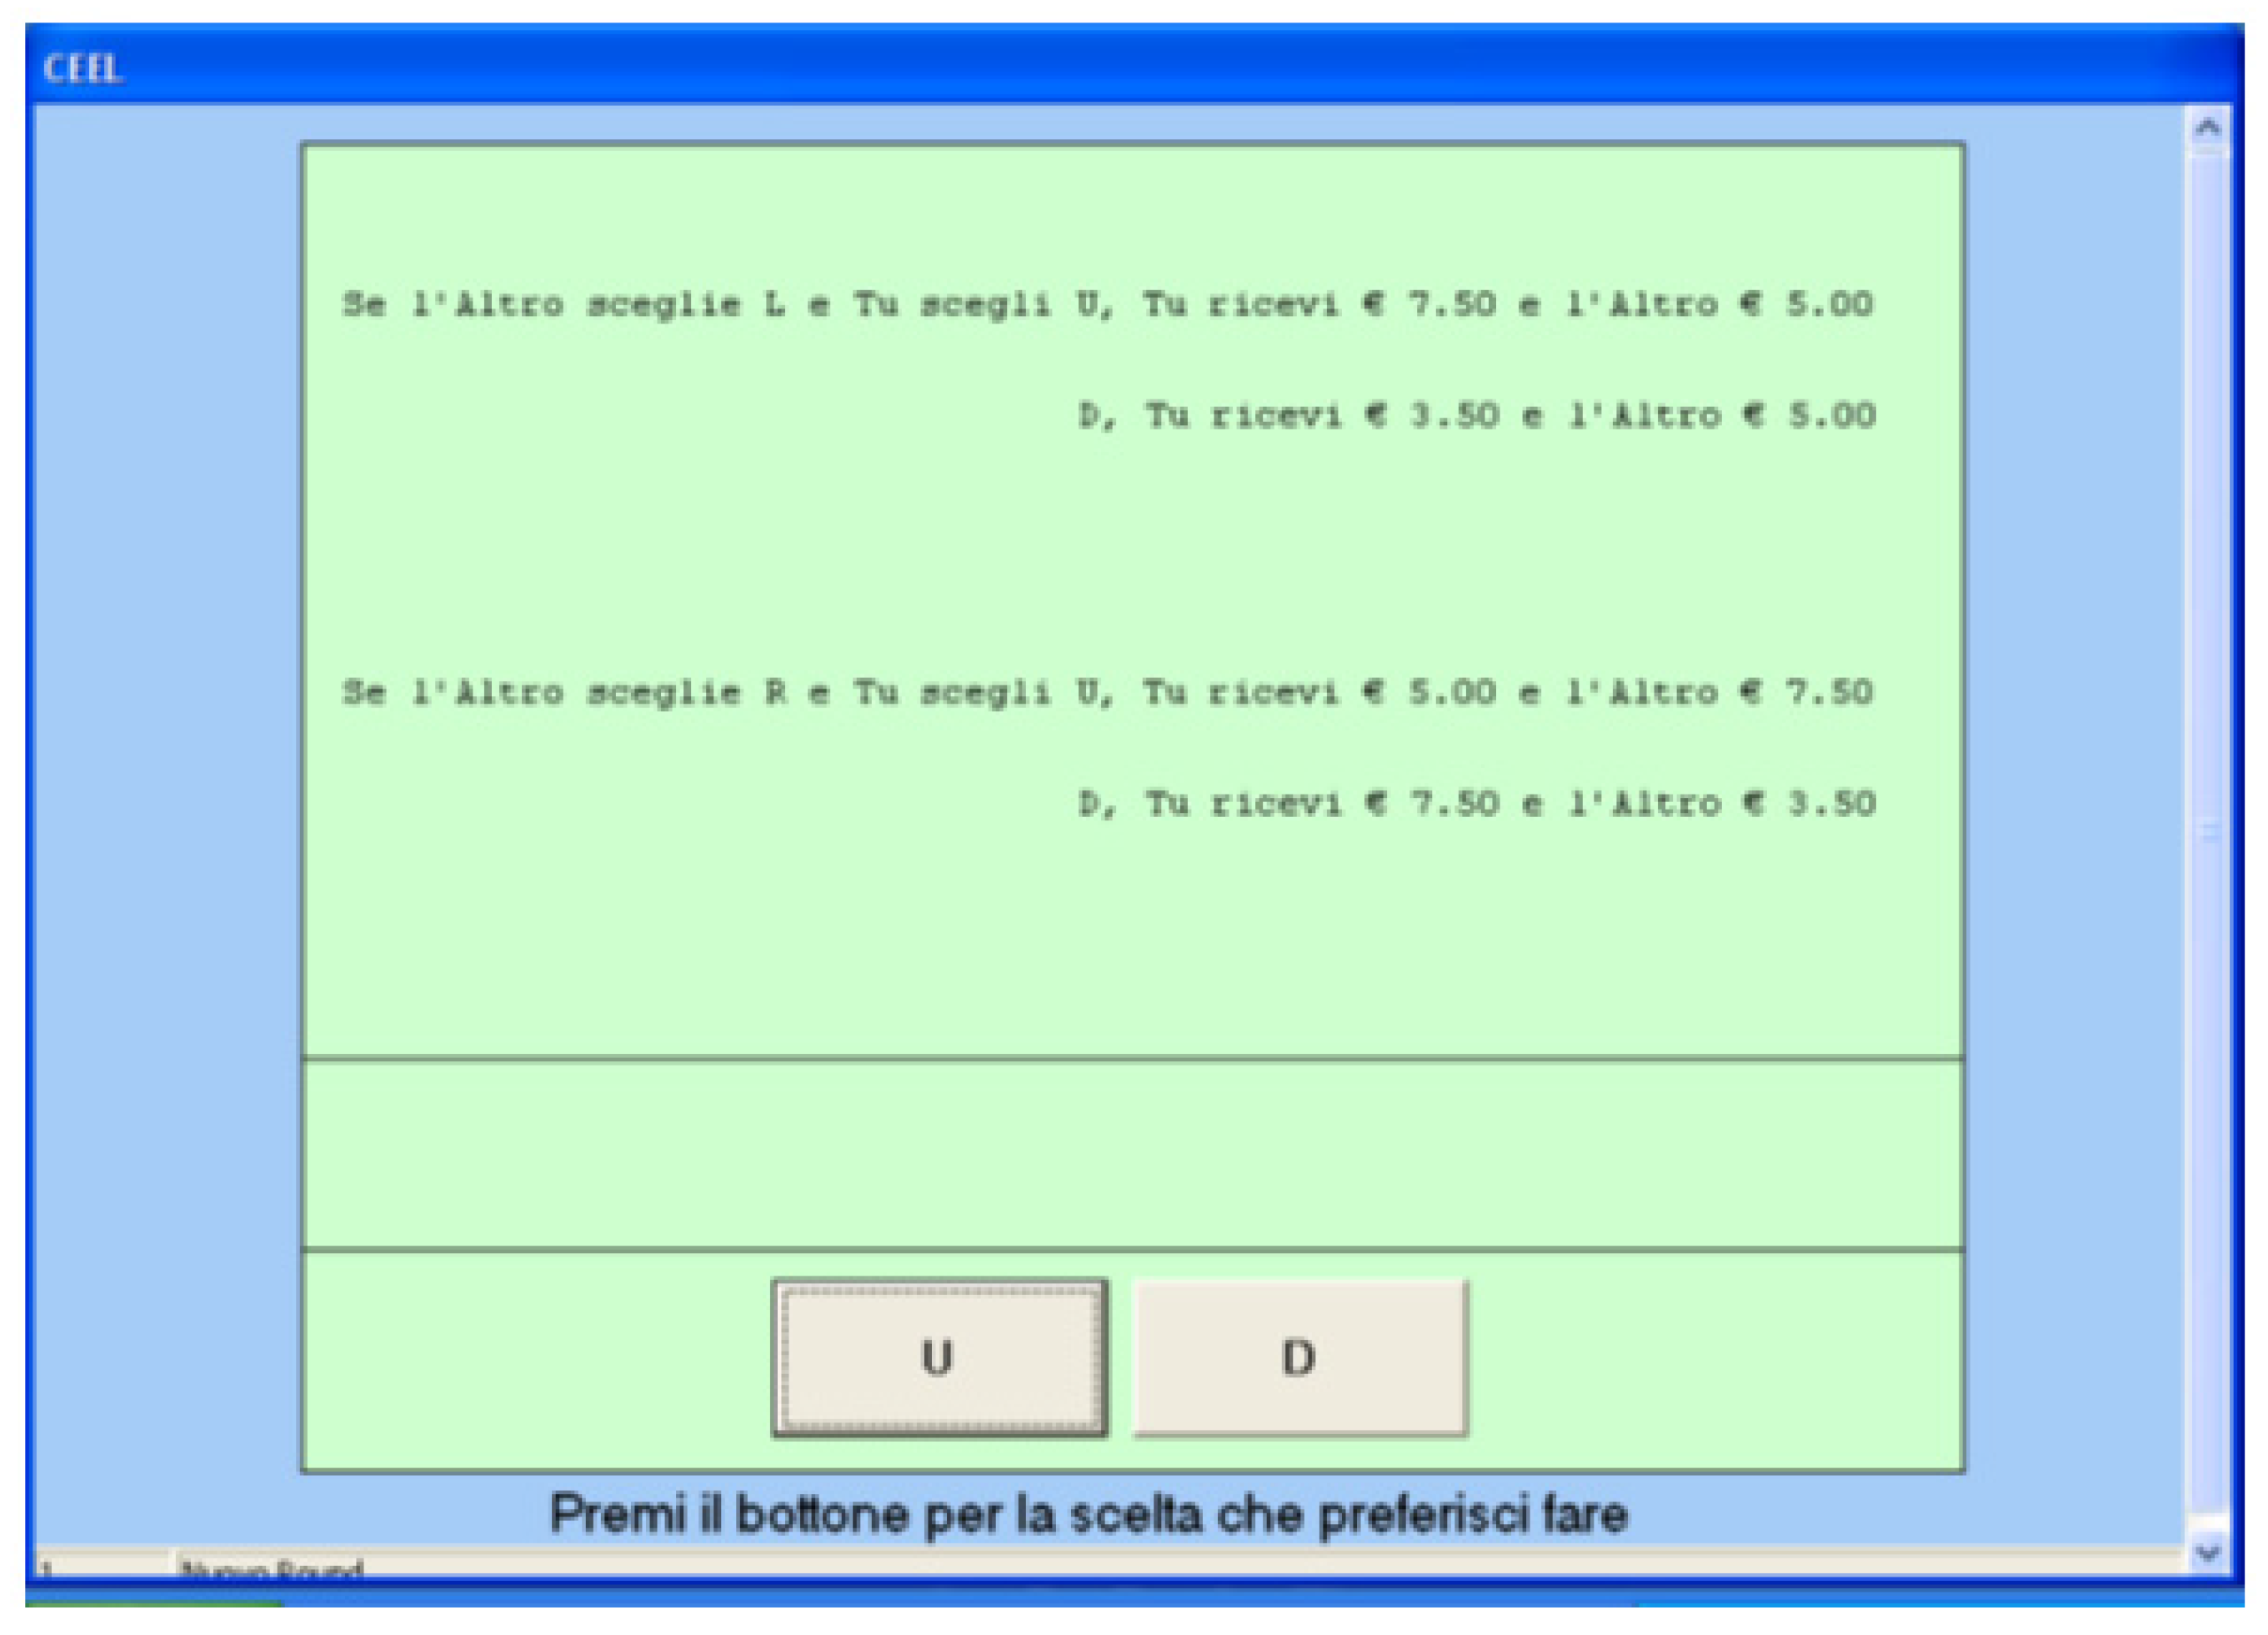
| For each of the following screens you are randomly paired with another participant in the experiment referred to as “Other”. For each screen, you are presented with a choice between two options U or D. Simultaneously, Other is presented with a choice between two options L and R. You and Other will receive payoffs depending on the decision you make and the decision Other makes. Information about what you and Other will receive depending on the choices you both make will be provided in a table like the one shown below. For this table, if Other chooses his or her option L and you choose your option U, you receive 5 and Other receives 2. If instead you choose your option D, you receive 7 Euros and Other received 7 Euros. If Other chooses his or her option R and you choose your option U, you receive 5 Euros and Other receives 4 Euros. If you instead choose your option D, you receive 1 Euro and Other receives 2 Euros. | |
| If Other Choose L and you choose U | You receive 5.00 and Other receives 2.00 |
| D | You receive 7.00 and Other receives 7.00 |
| If Other Choose R and you choose U | You receive 5.00 and Other receives 4.00 |
| D | You receive 1.00 and Other receives 2.00 |
| For each question please indicate the option you would rather have. At the end of the experiment, one of these situations will be selected at random and you and the person with whom you are matched will be paid according to the decisions you both made. As such, in addition to the 5 Euro participation fee you can earn an additional amount between 0 and 13 Euros. | |


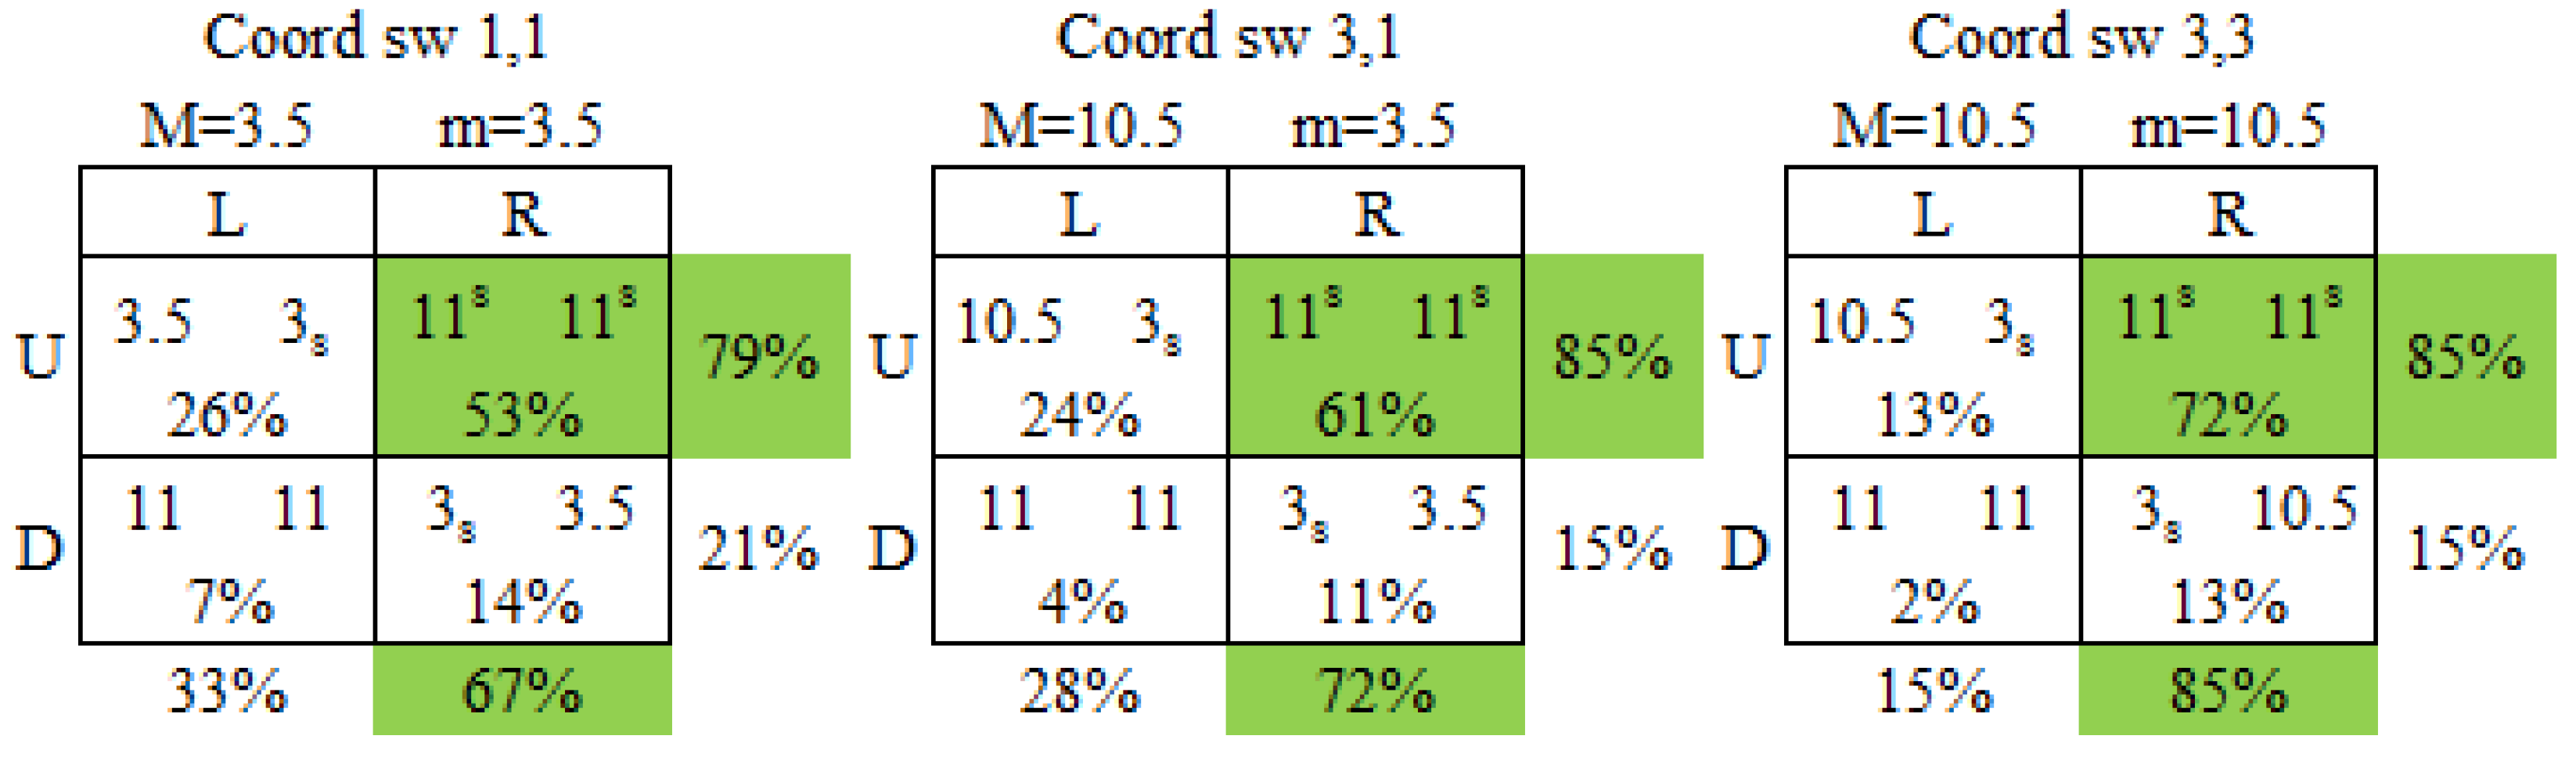
3.2.1. Own-Payoff Solvable Games with Payoff Invariant Structures

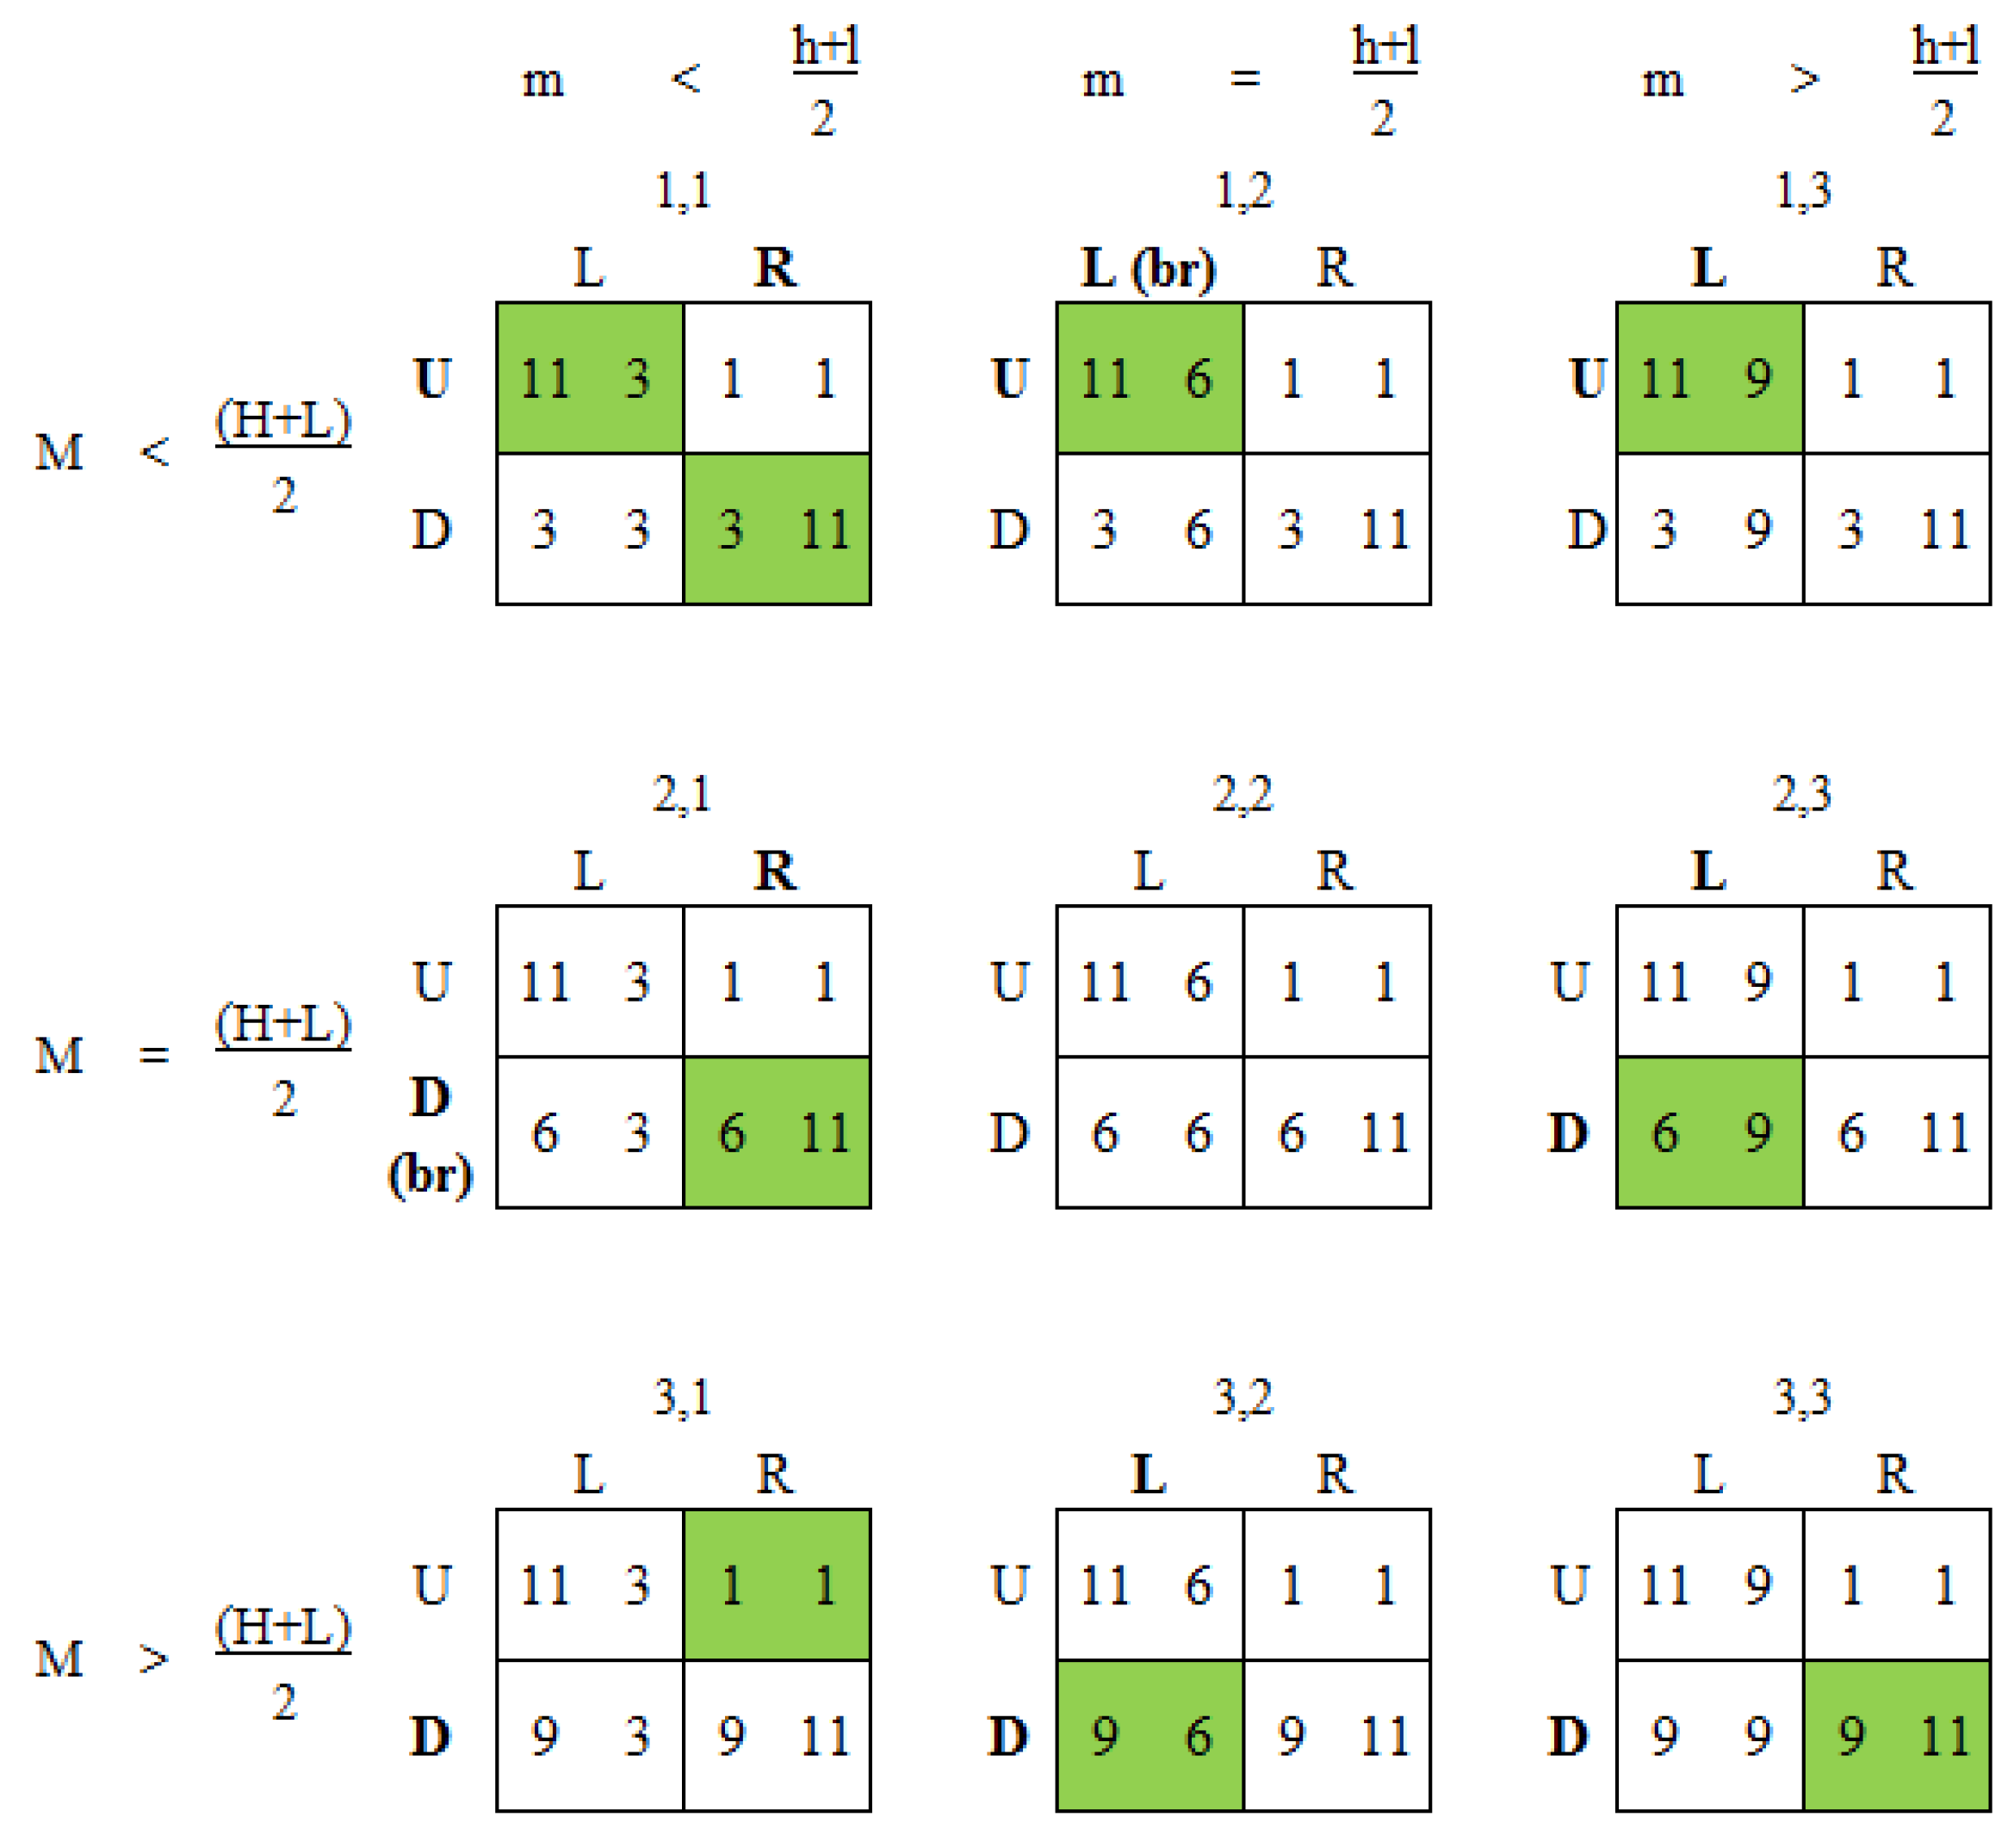
3.2.2. Payoff Variant Games


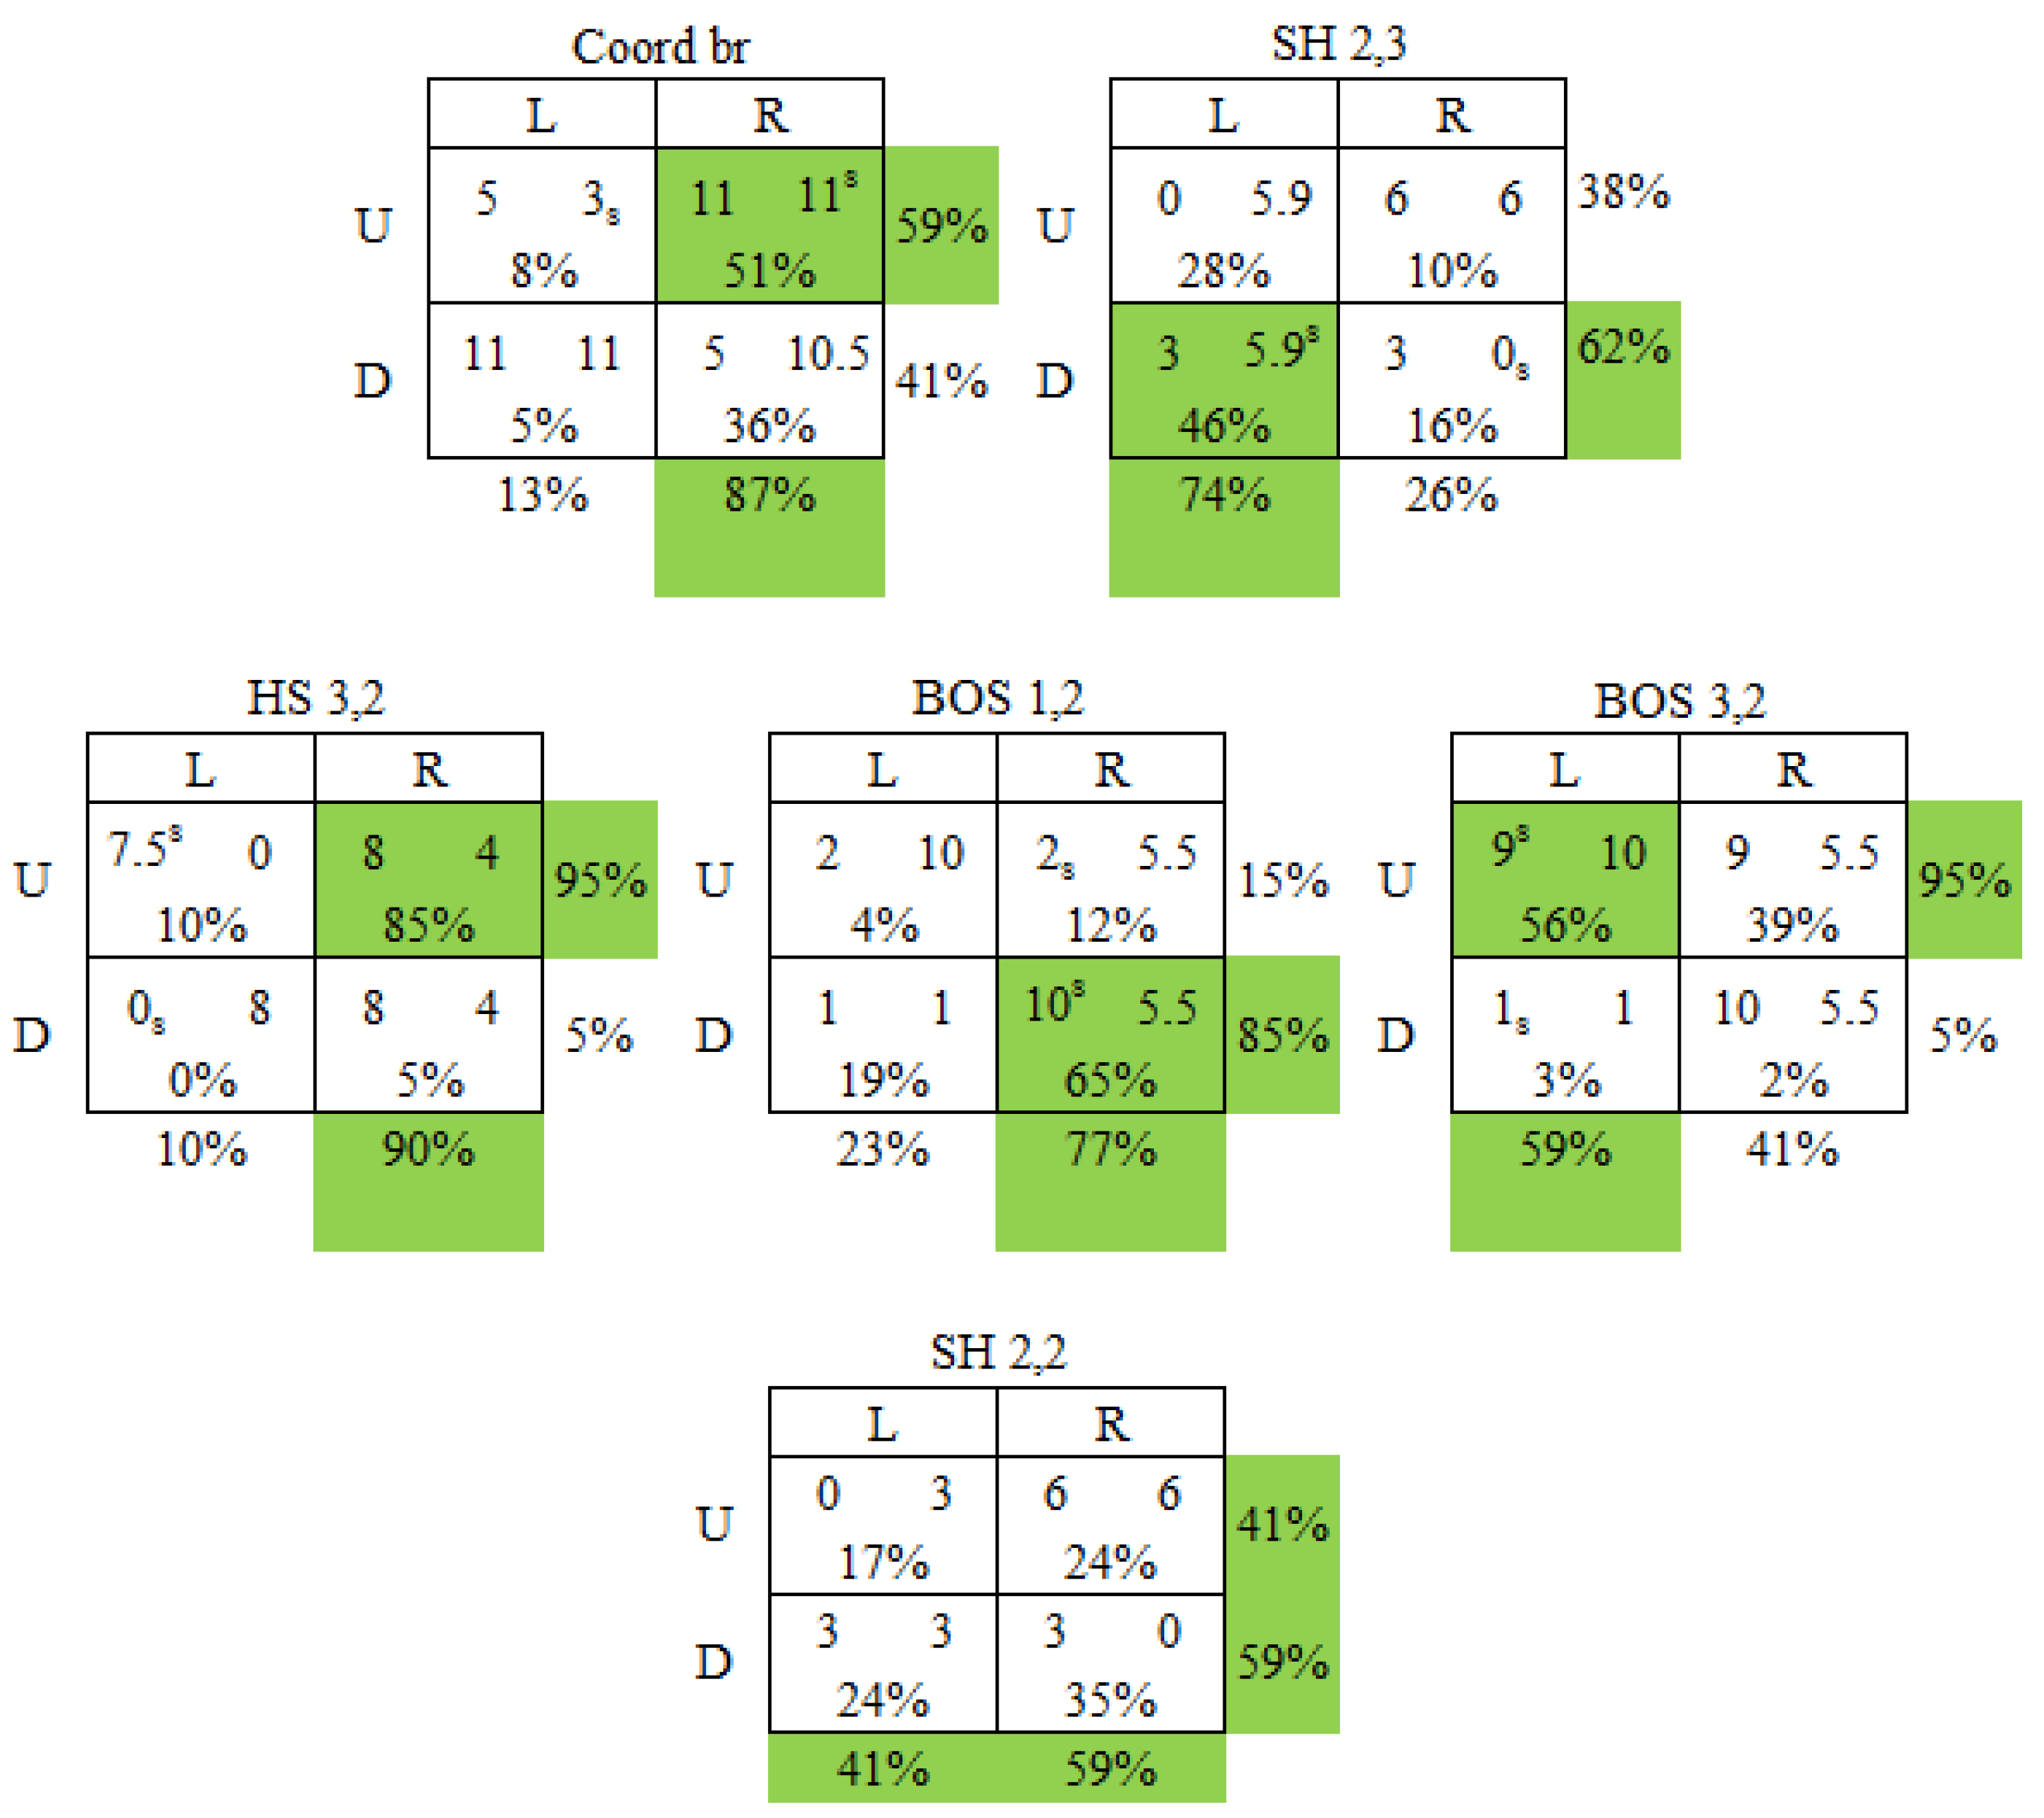
3.2.3. “Other-Payoff” Solvable Games

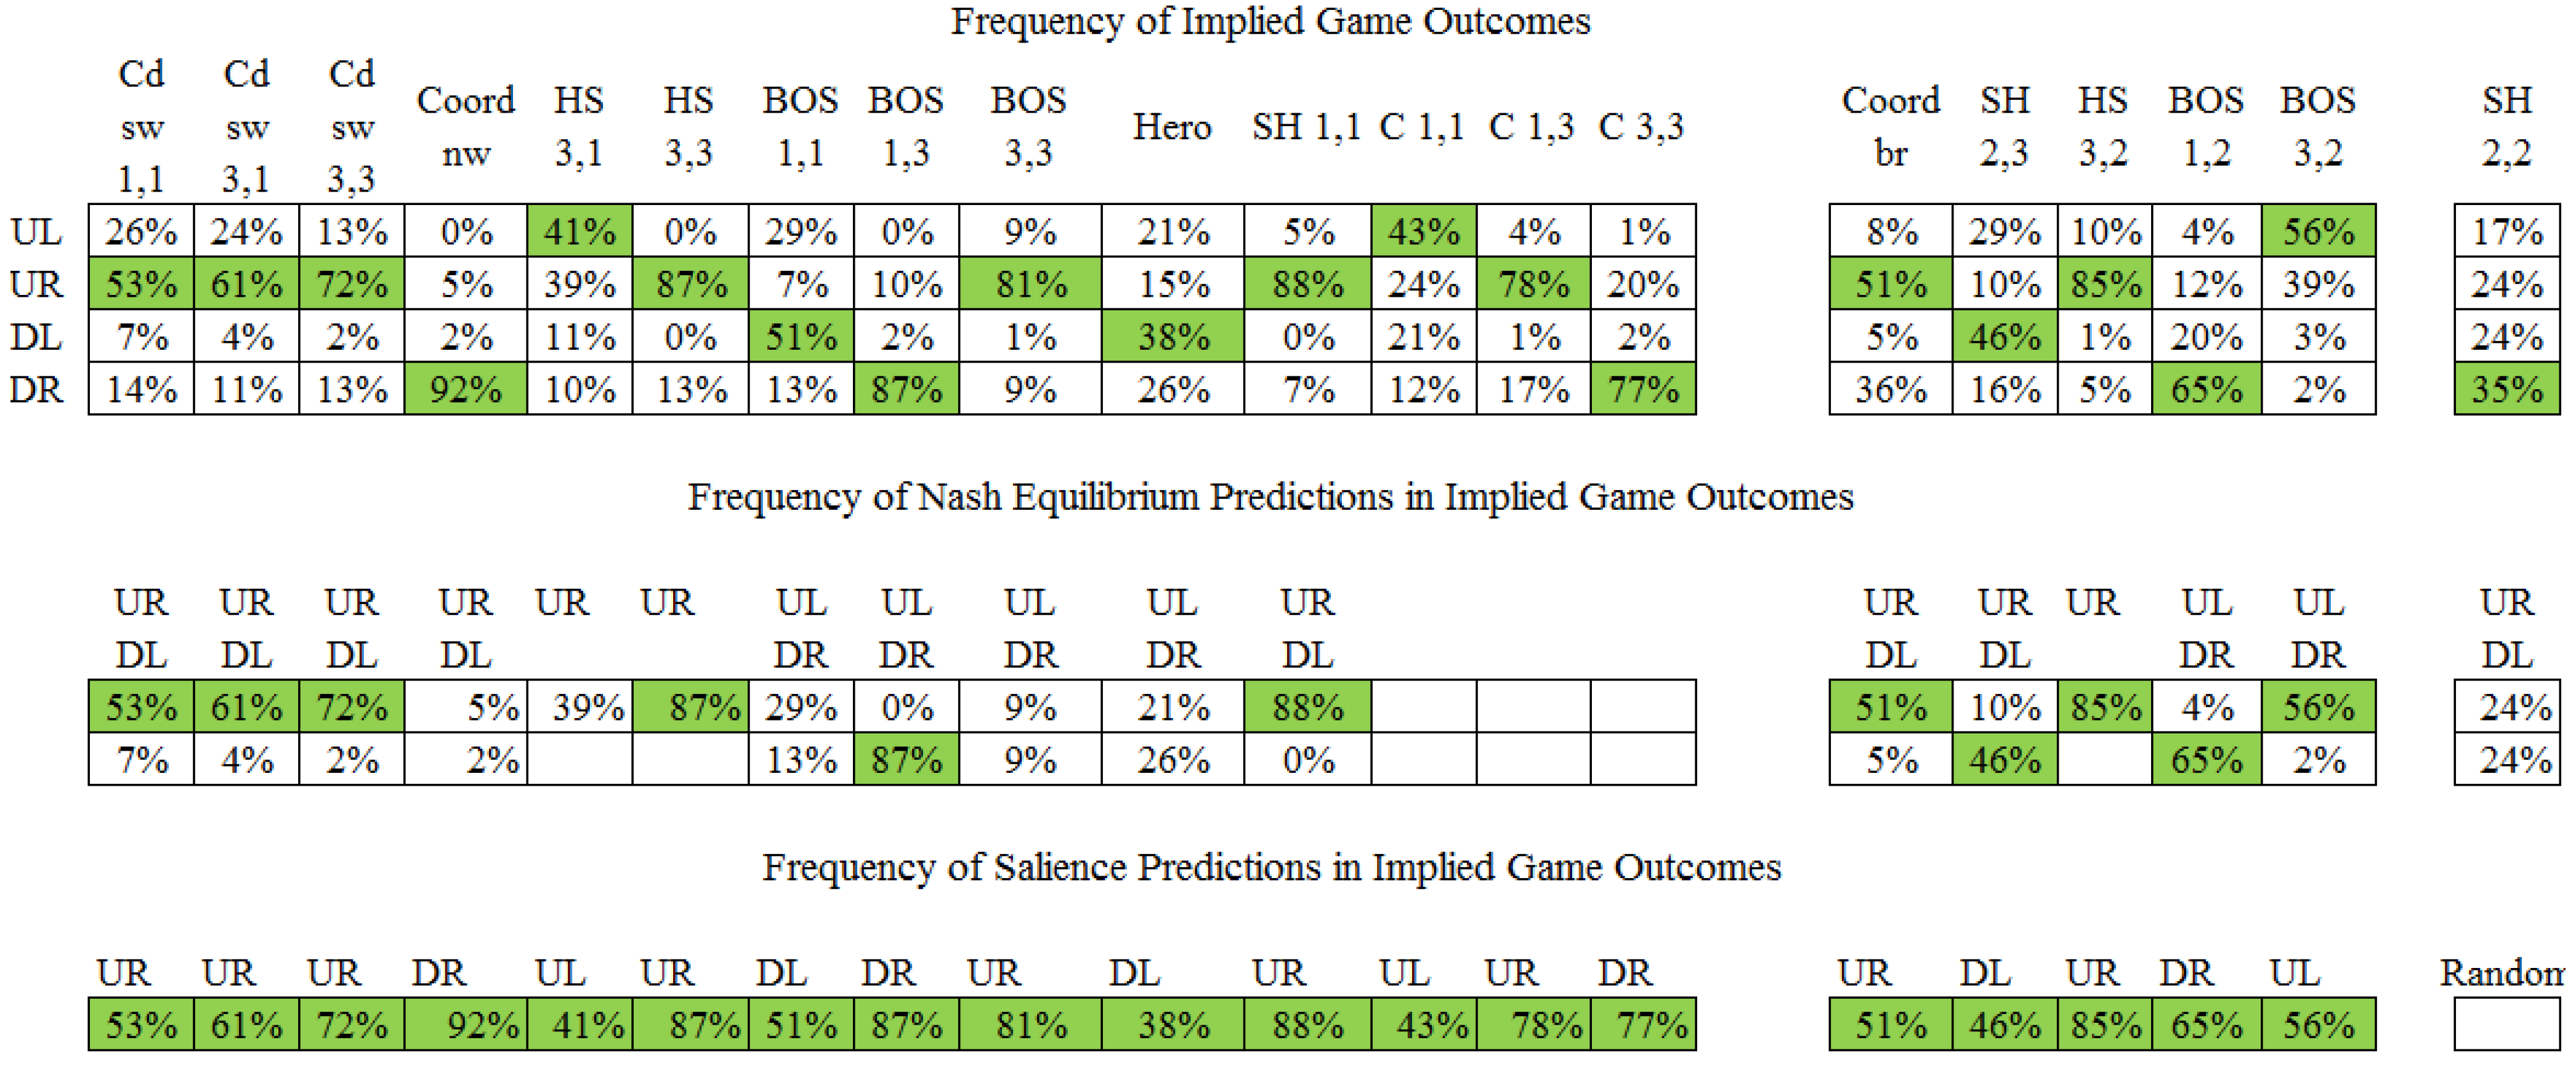
3.3. Overall Response Patterns and Game Outcomes

4. Extensions to Other Two-Person Games
4.1. The Traveler’s Dilemma
| Player 2 | |||
|---|---|---|---|
| Player 1 | Strategy | 180 | 300 |
| 300 | 175, 185 | 300, 300 | |
| 180 | 180, 180 | 185, 175 | |
| Player 2 | |||
|---|---|---|---|
| Player 1 | Strategy | 180 | 300 |
| 300 | 0, 360 | 300, 300 | |
| 180 | 180, 180 | 360, 0 | |
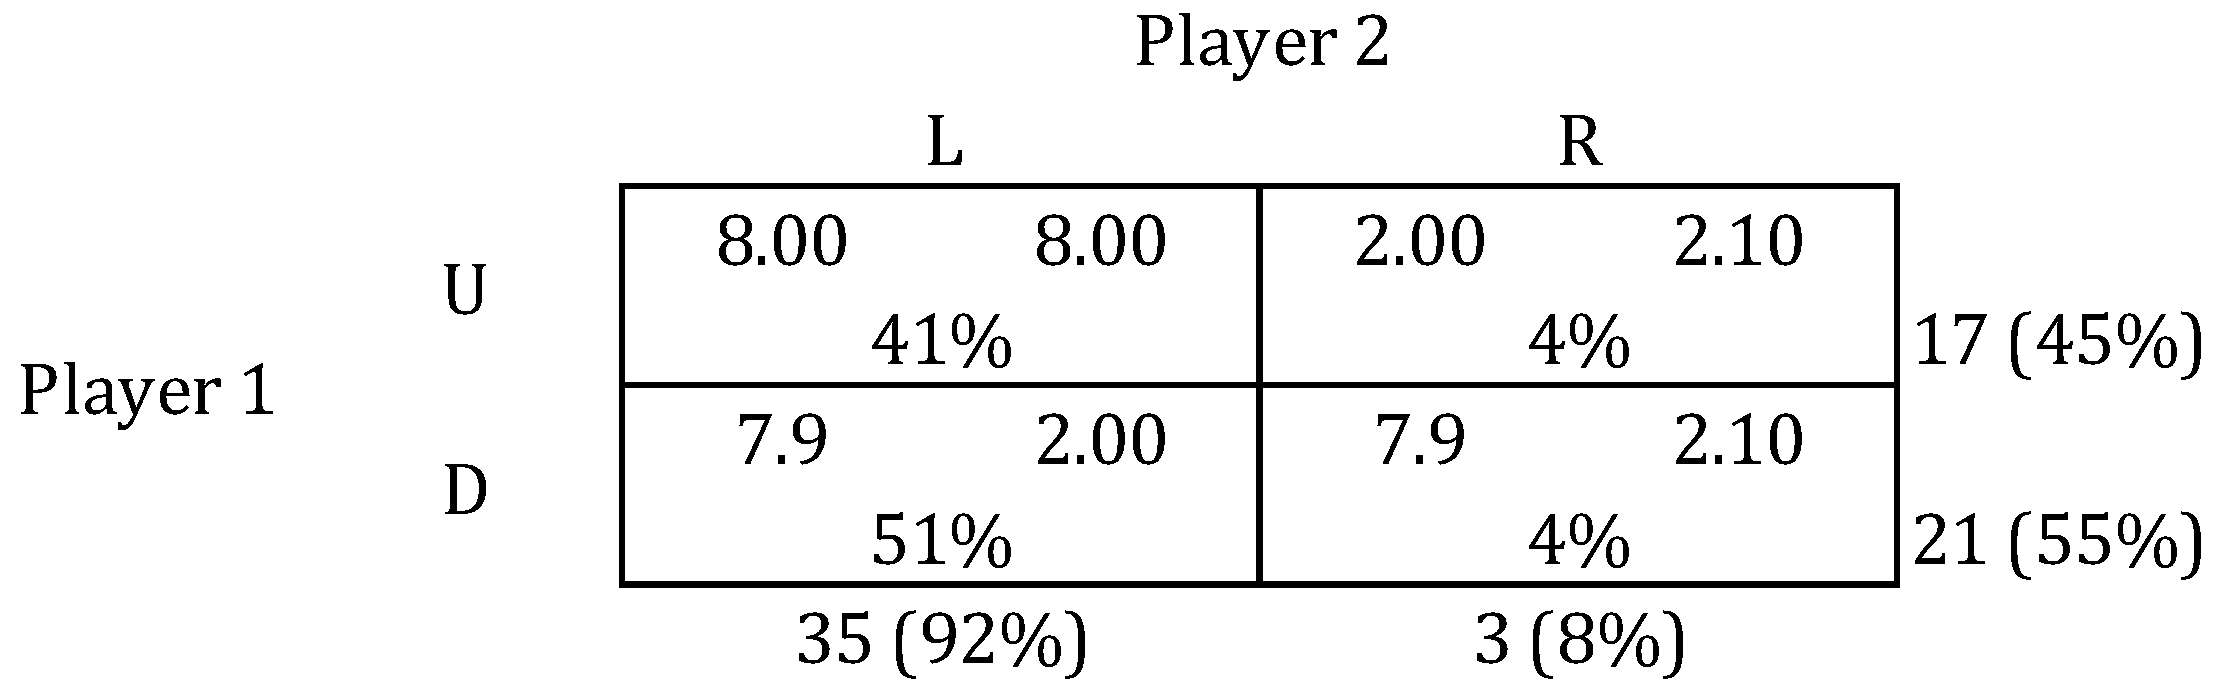
4.2. A Minimum Effort Coordination Game
| Player 2 | |||
|---|---|---|---|
| Player 1 | Strategy | 110 | 170 |
| 110 | 99, 99 | 99, 93 | |
| 170 | 93, 99 | 153, 153 | |
| Player 2 | |||
|---|---|---|---|
| Player 1 | Strategy | 110 | 170 |
| 110 | 11, 11 | 11, -43 | |
| 170 | -43, 11 | 17, 17 | |
5. Discussion
Acknowledgements
Author Contributions
Conflicts of Interest
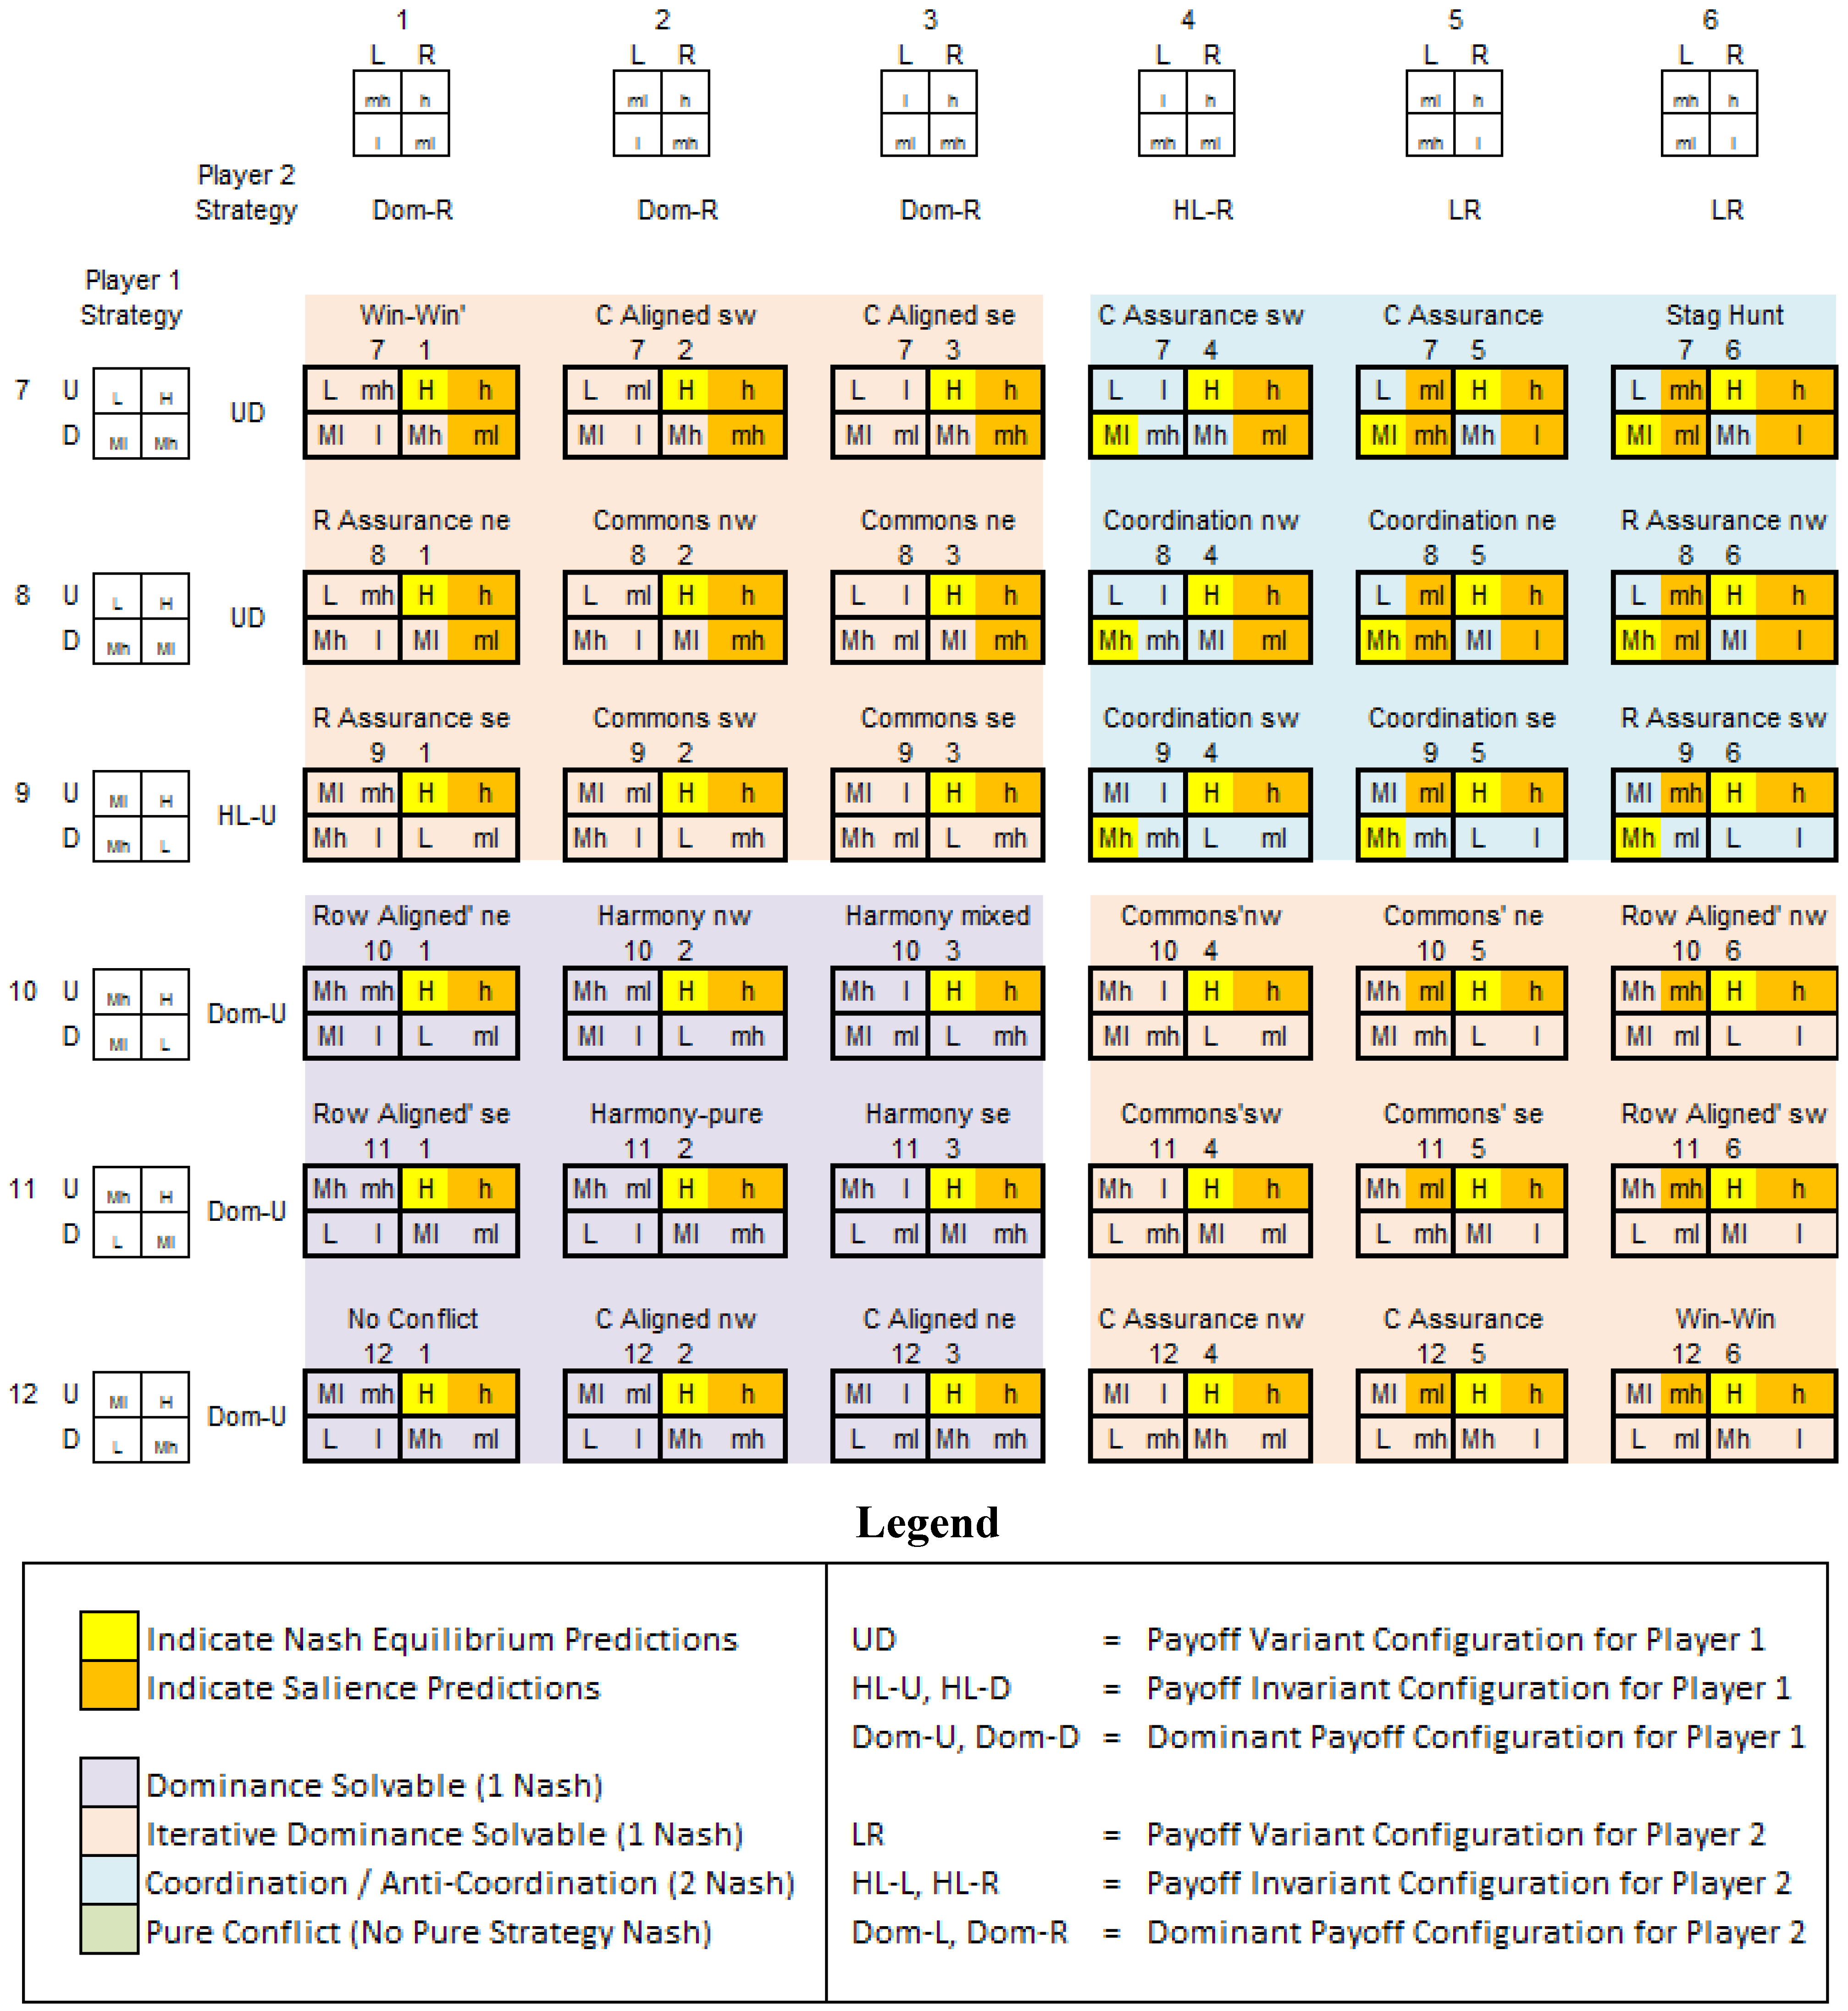
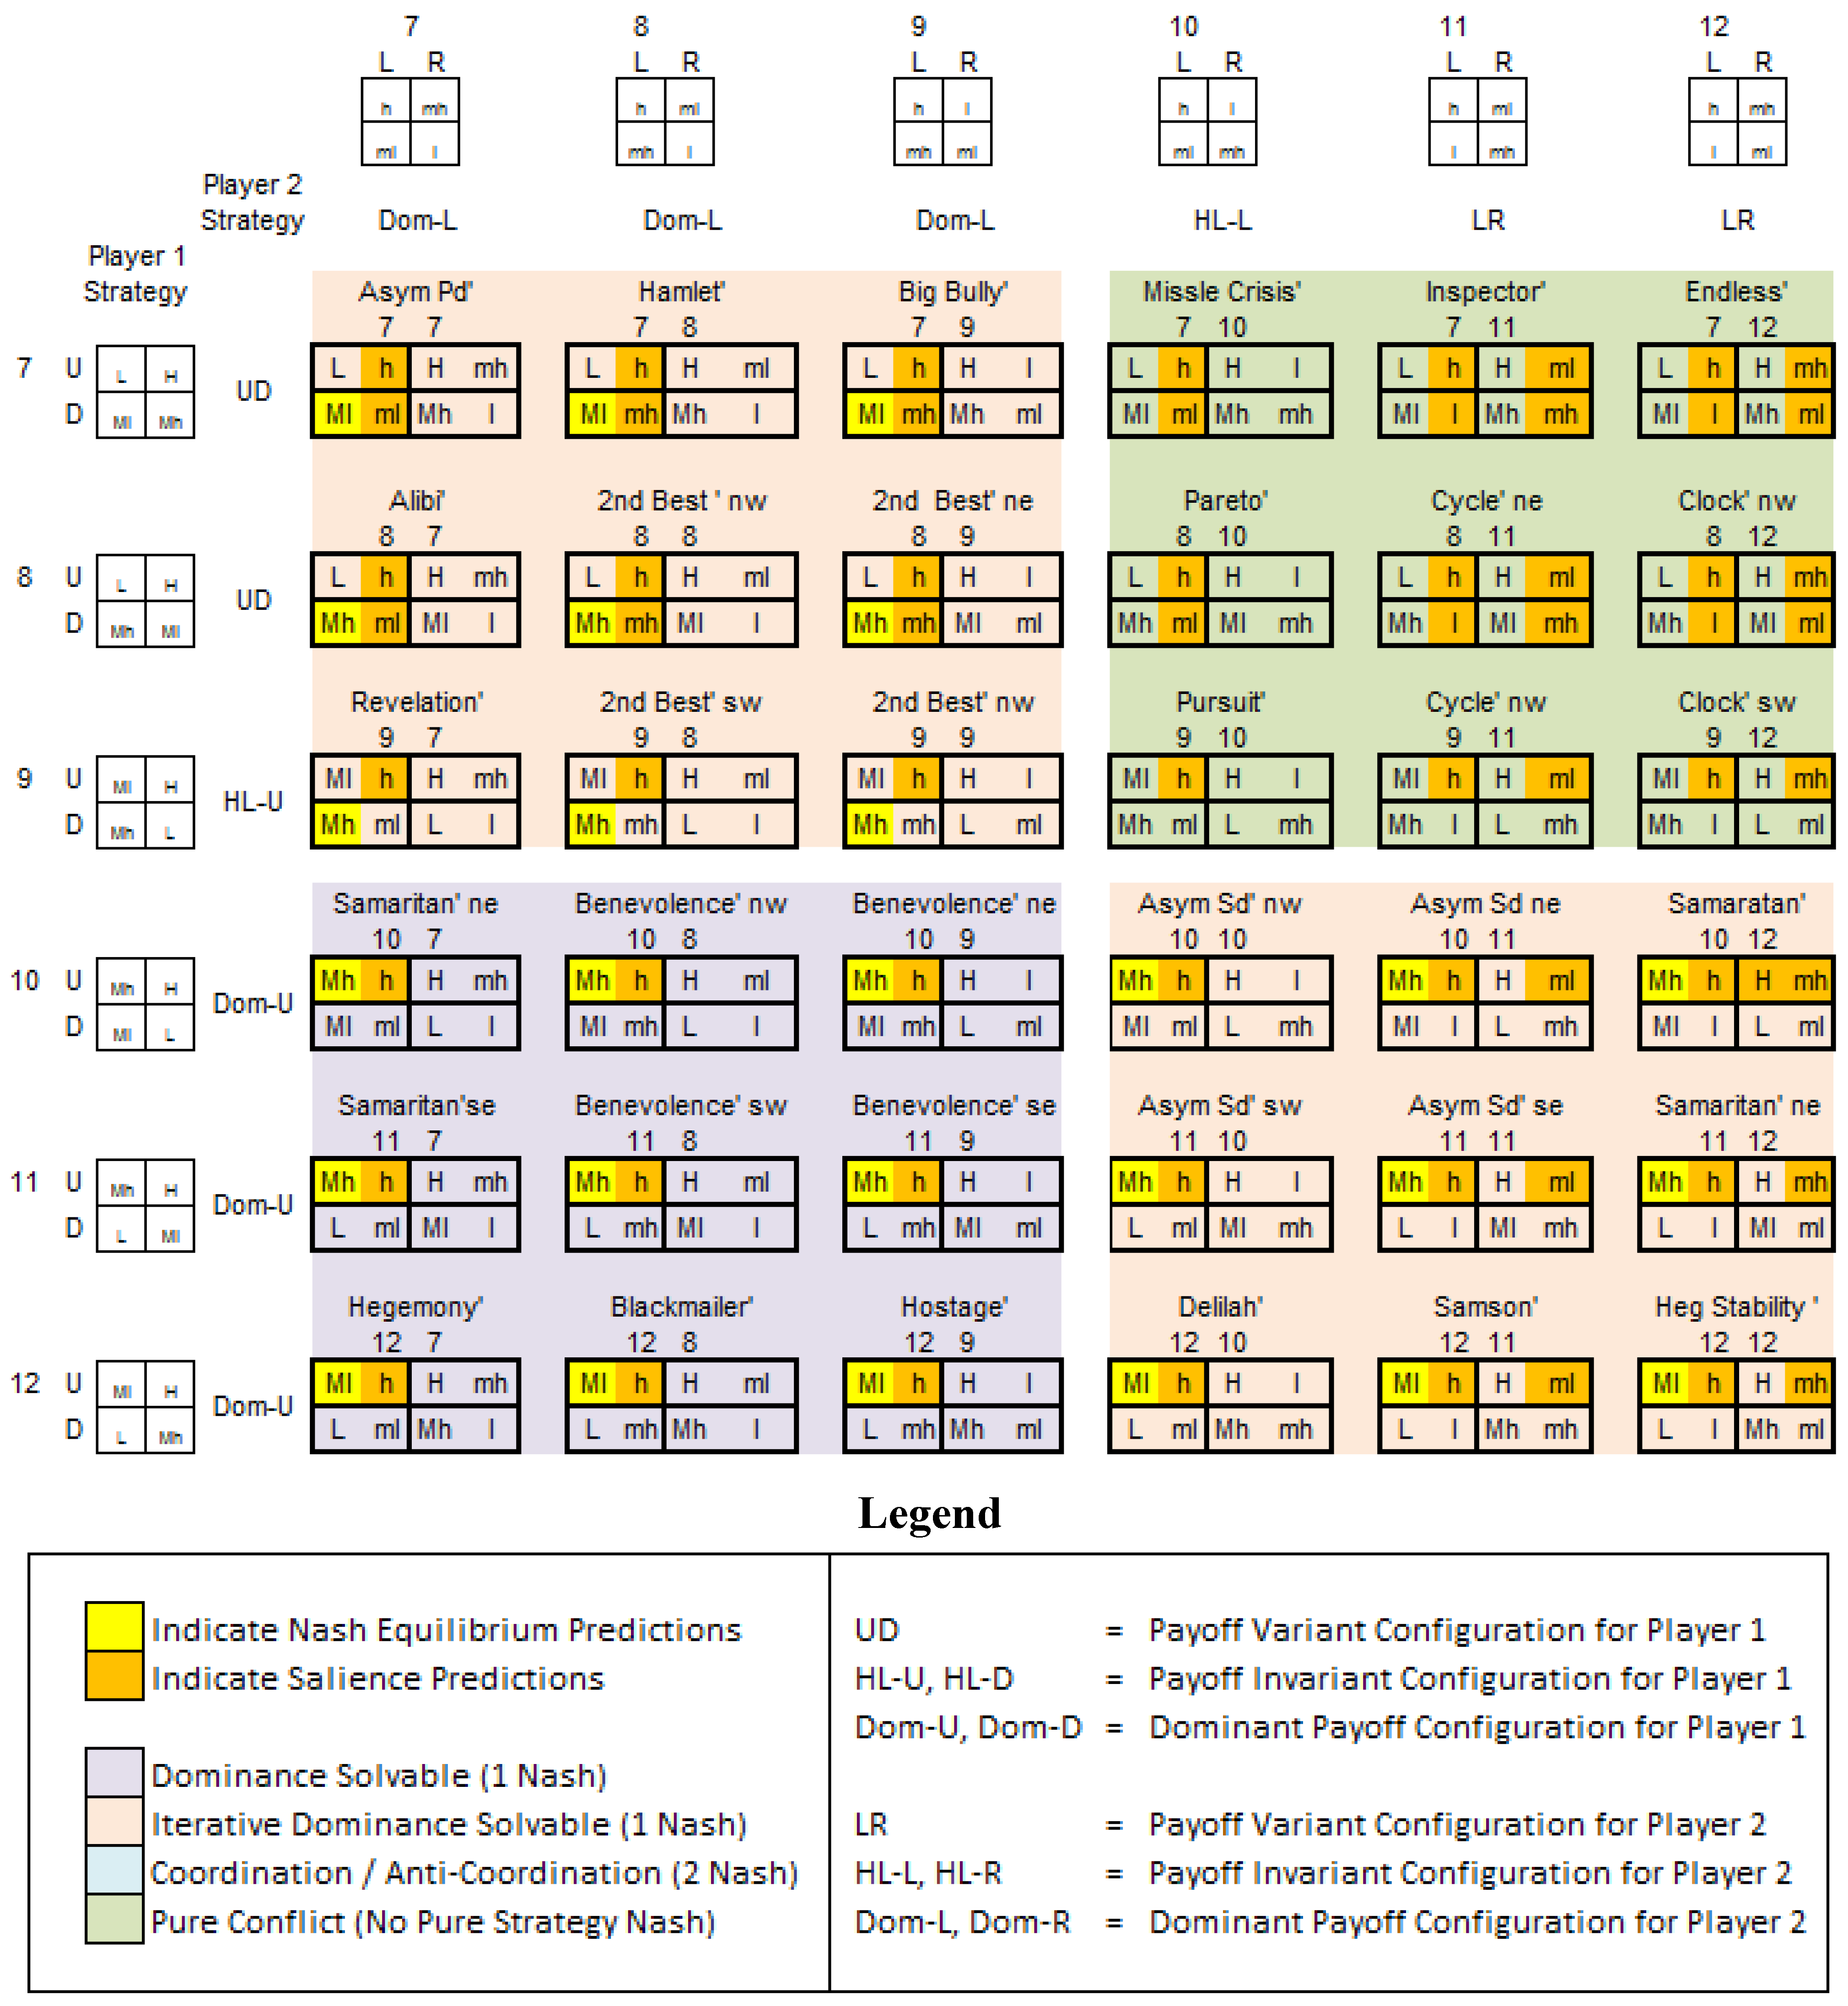
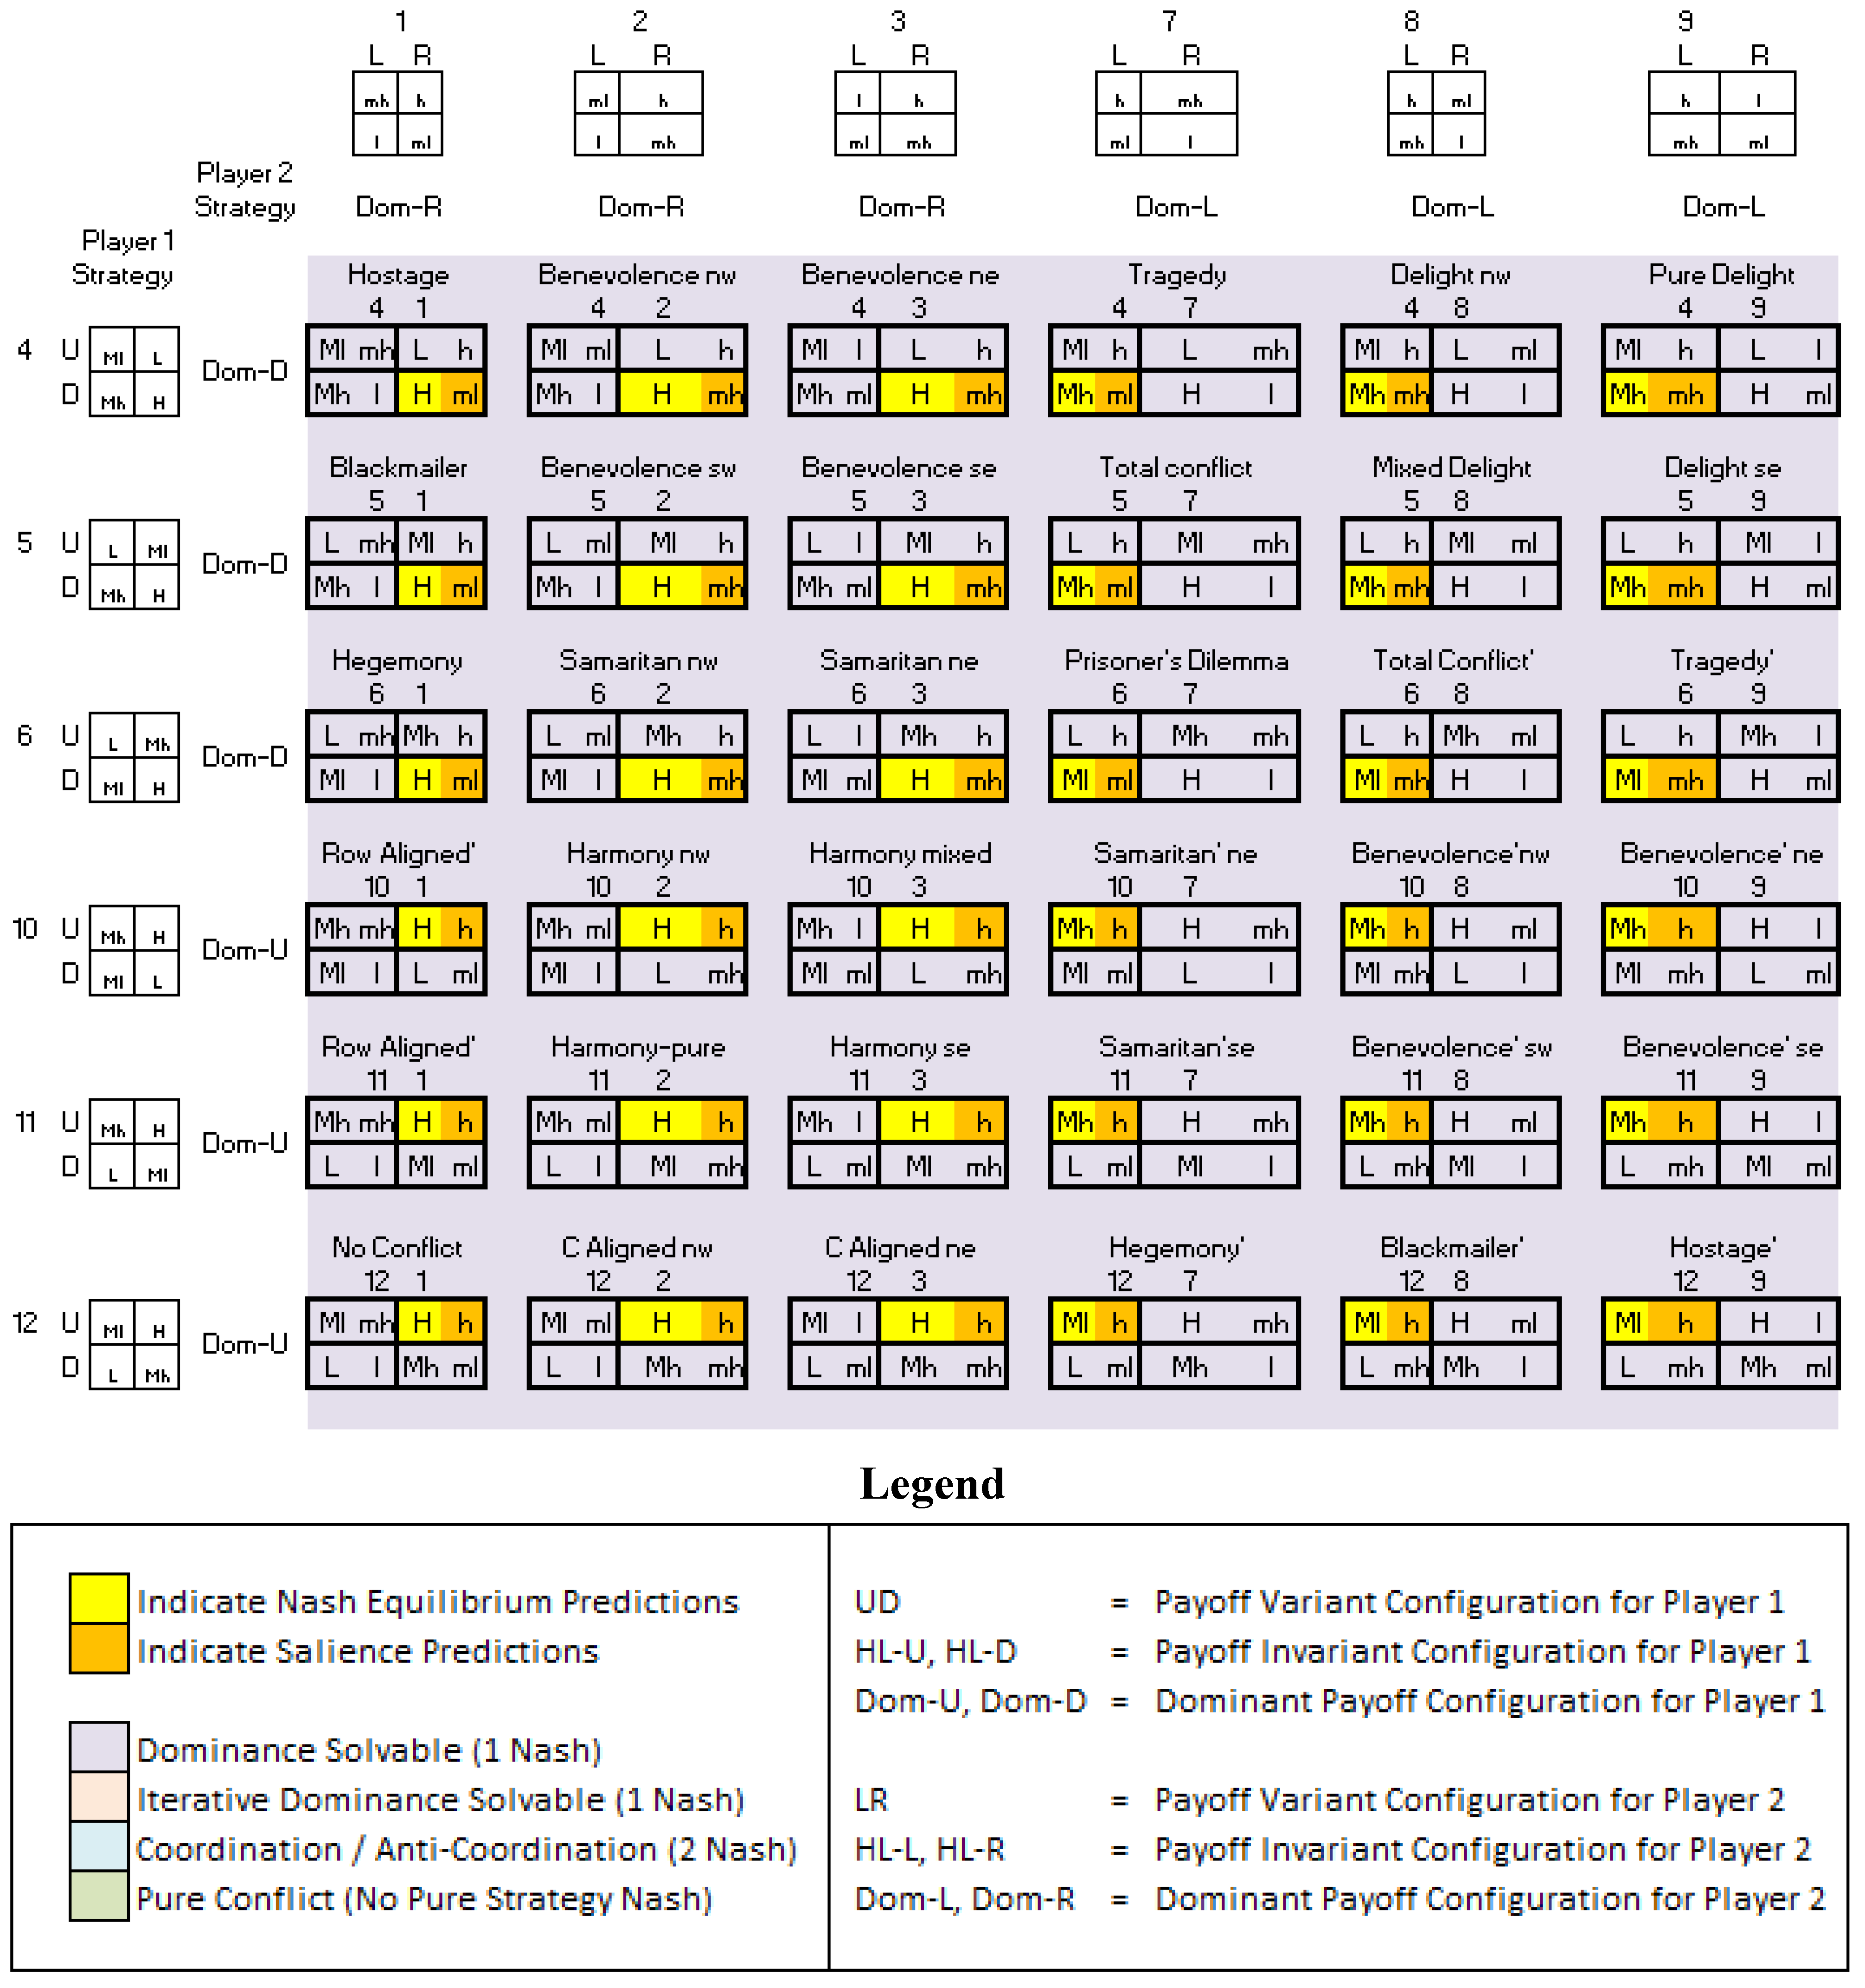
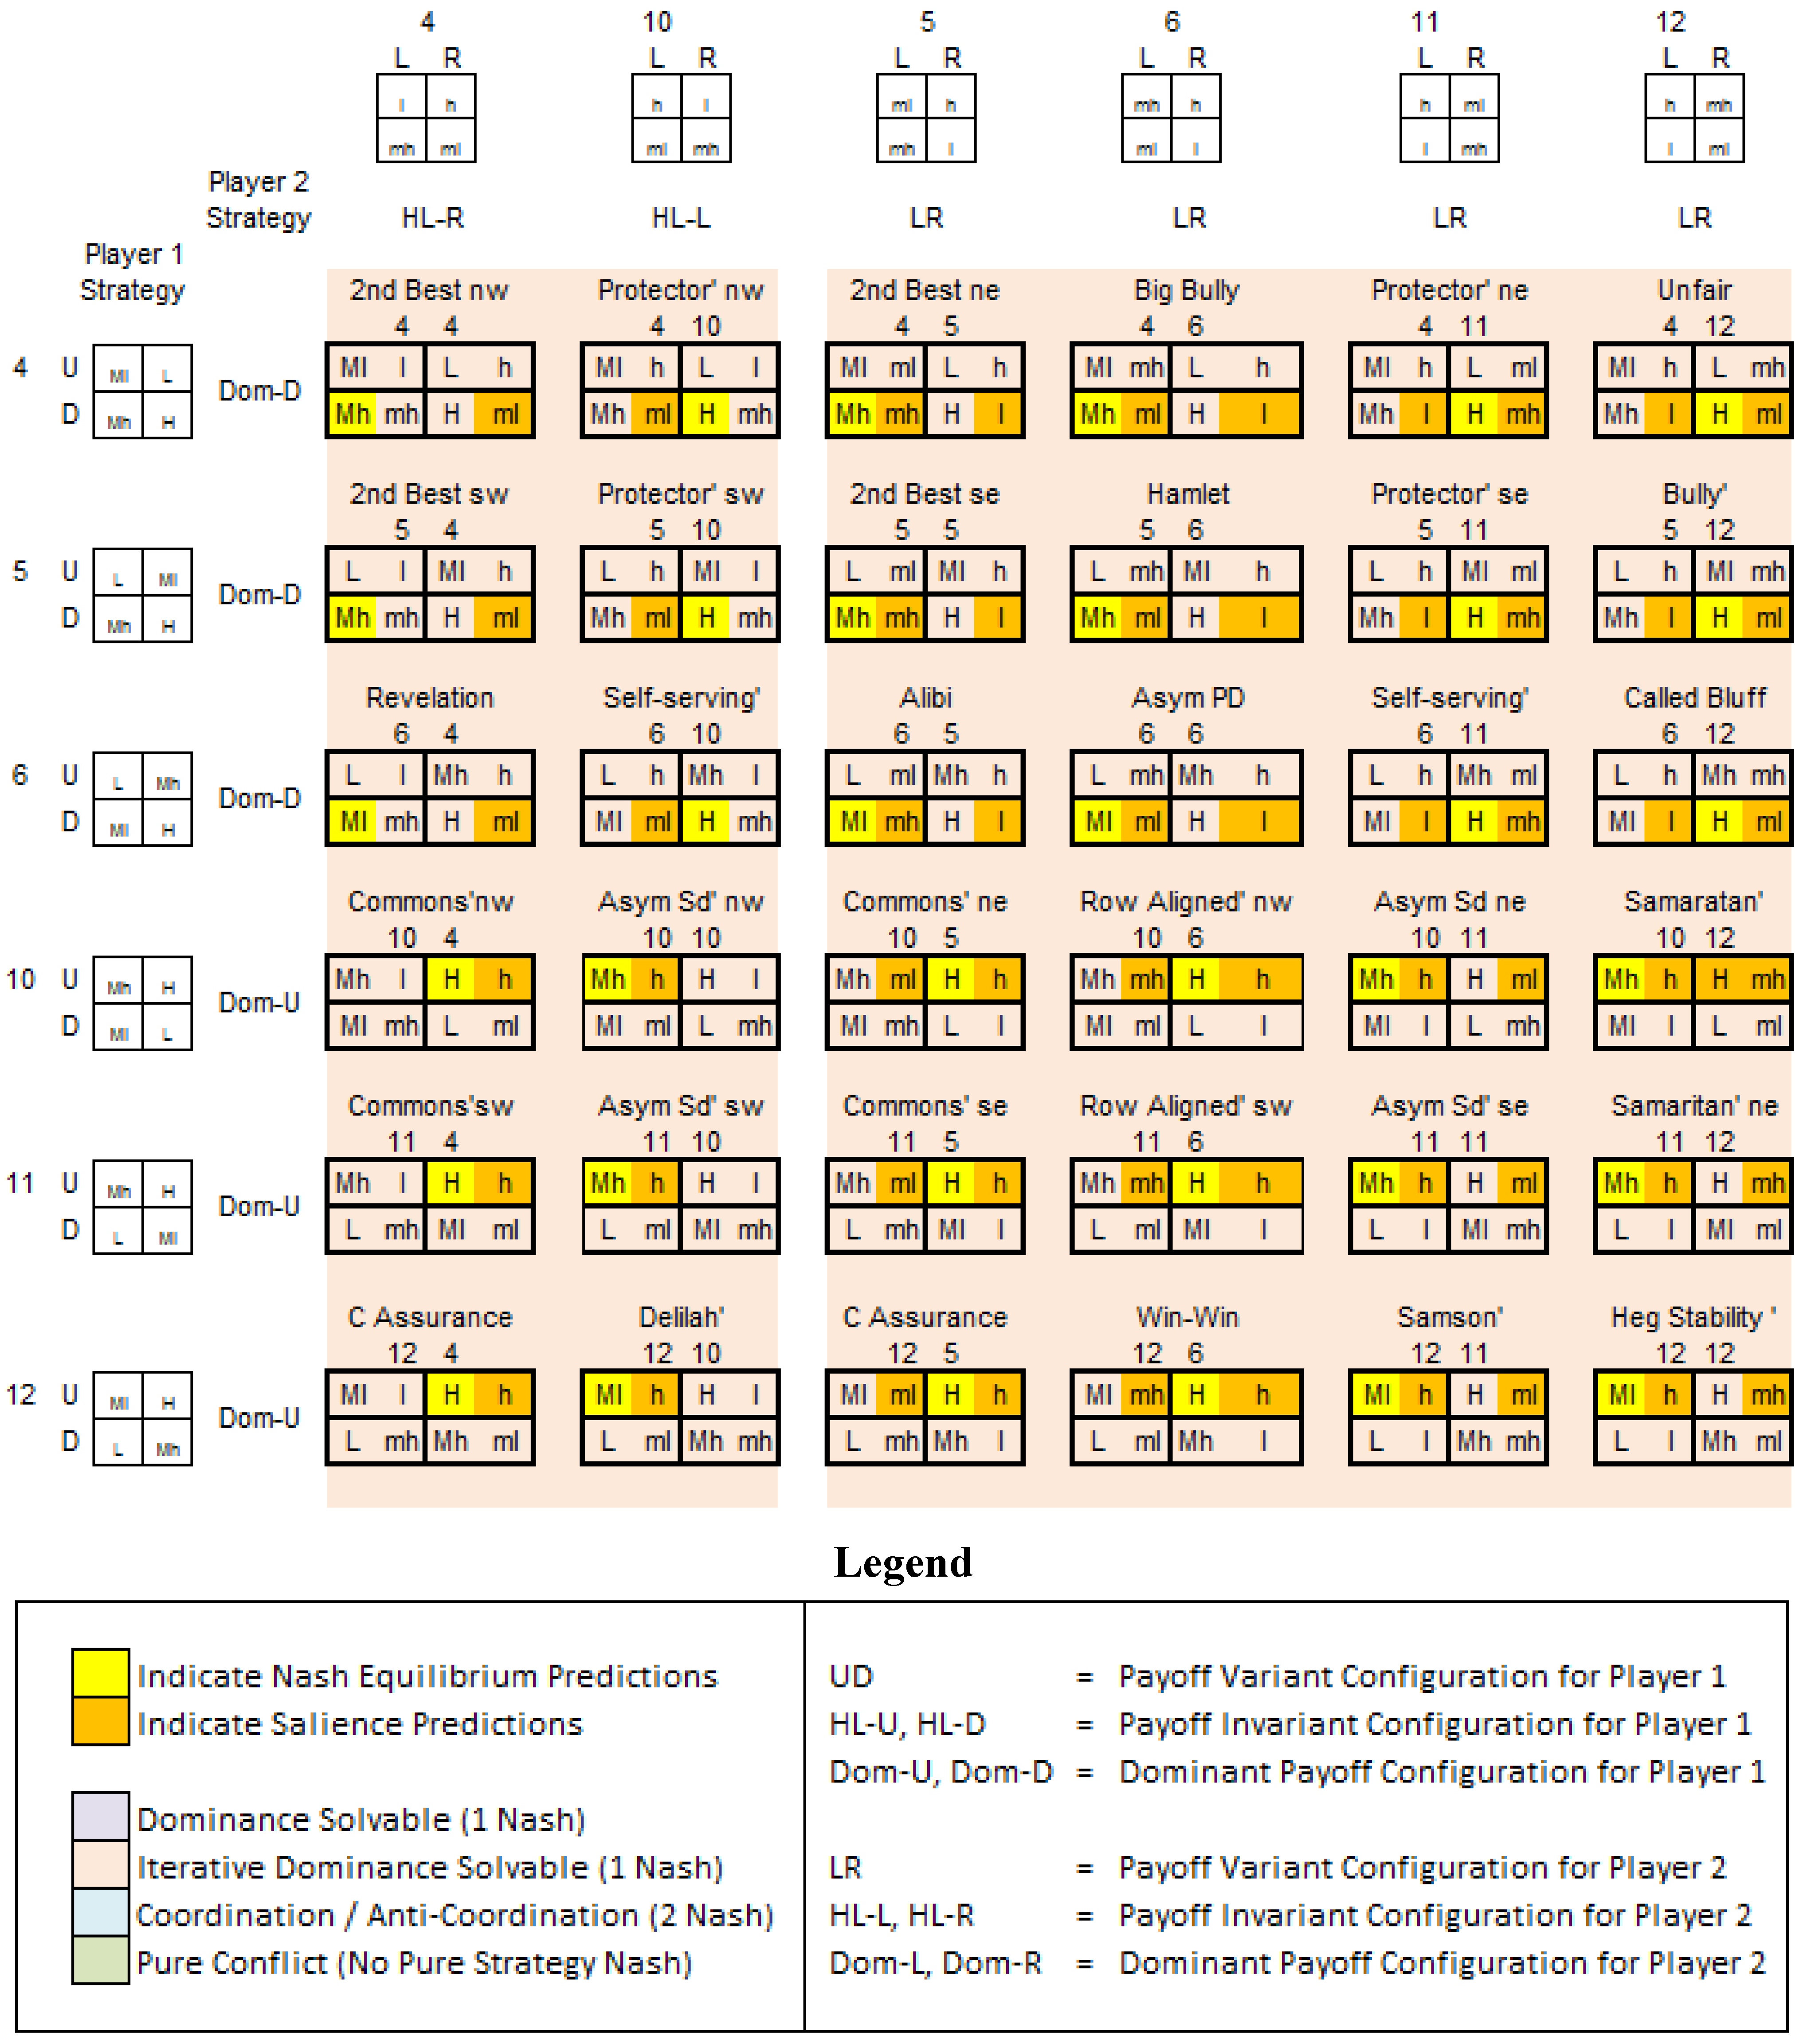
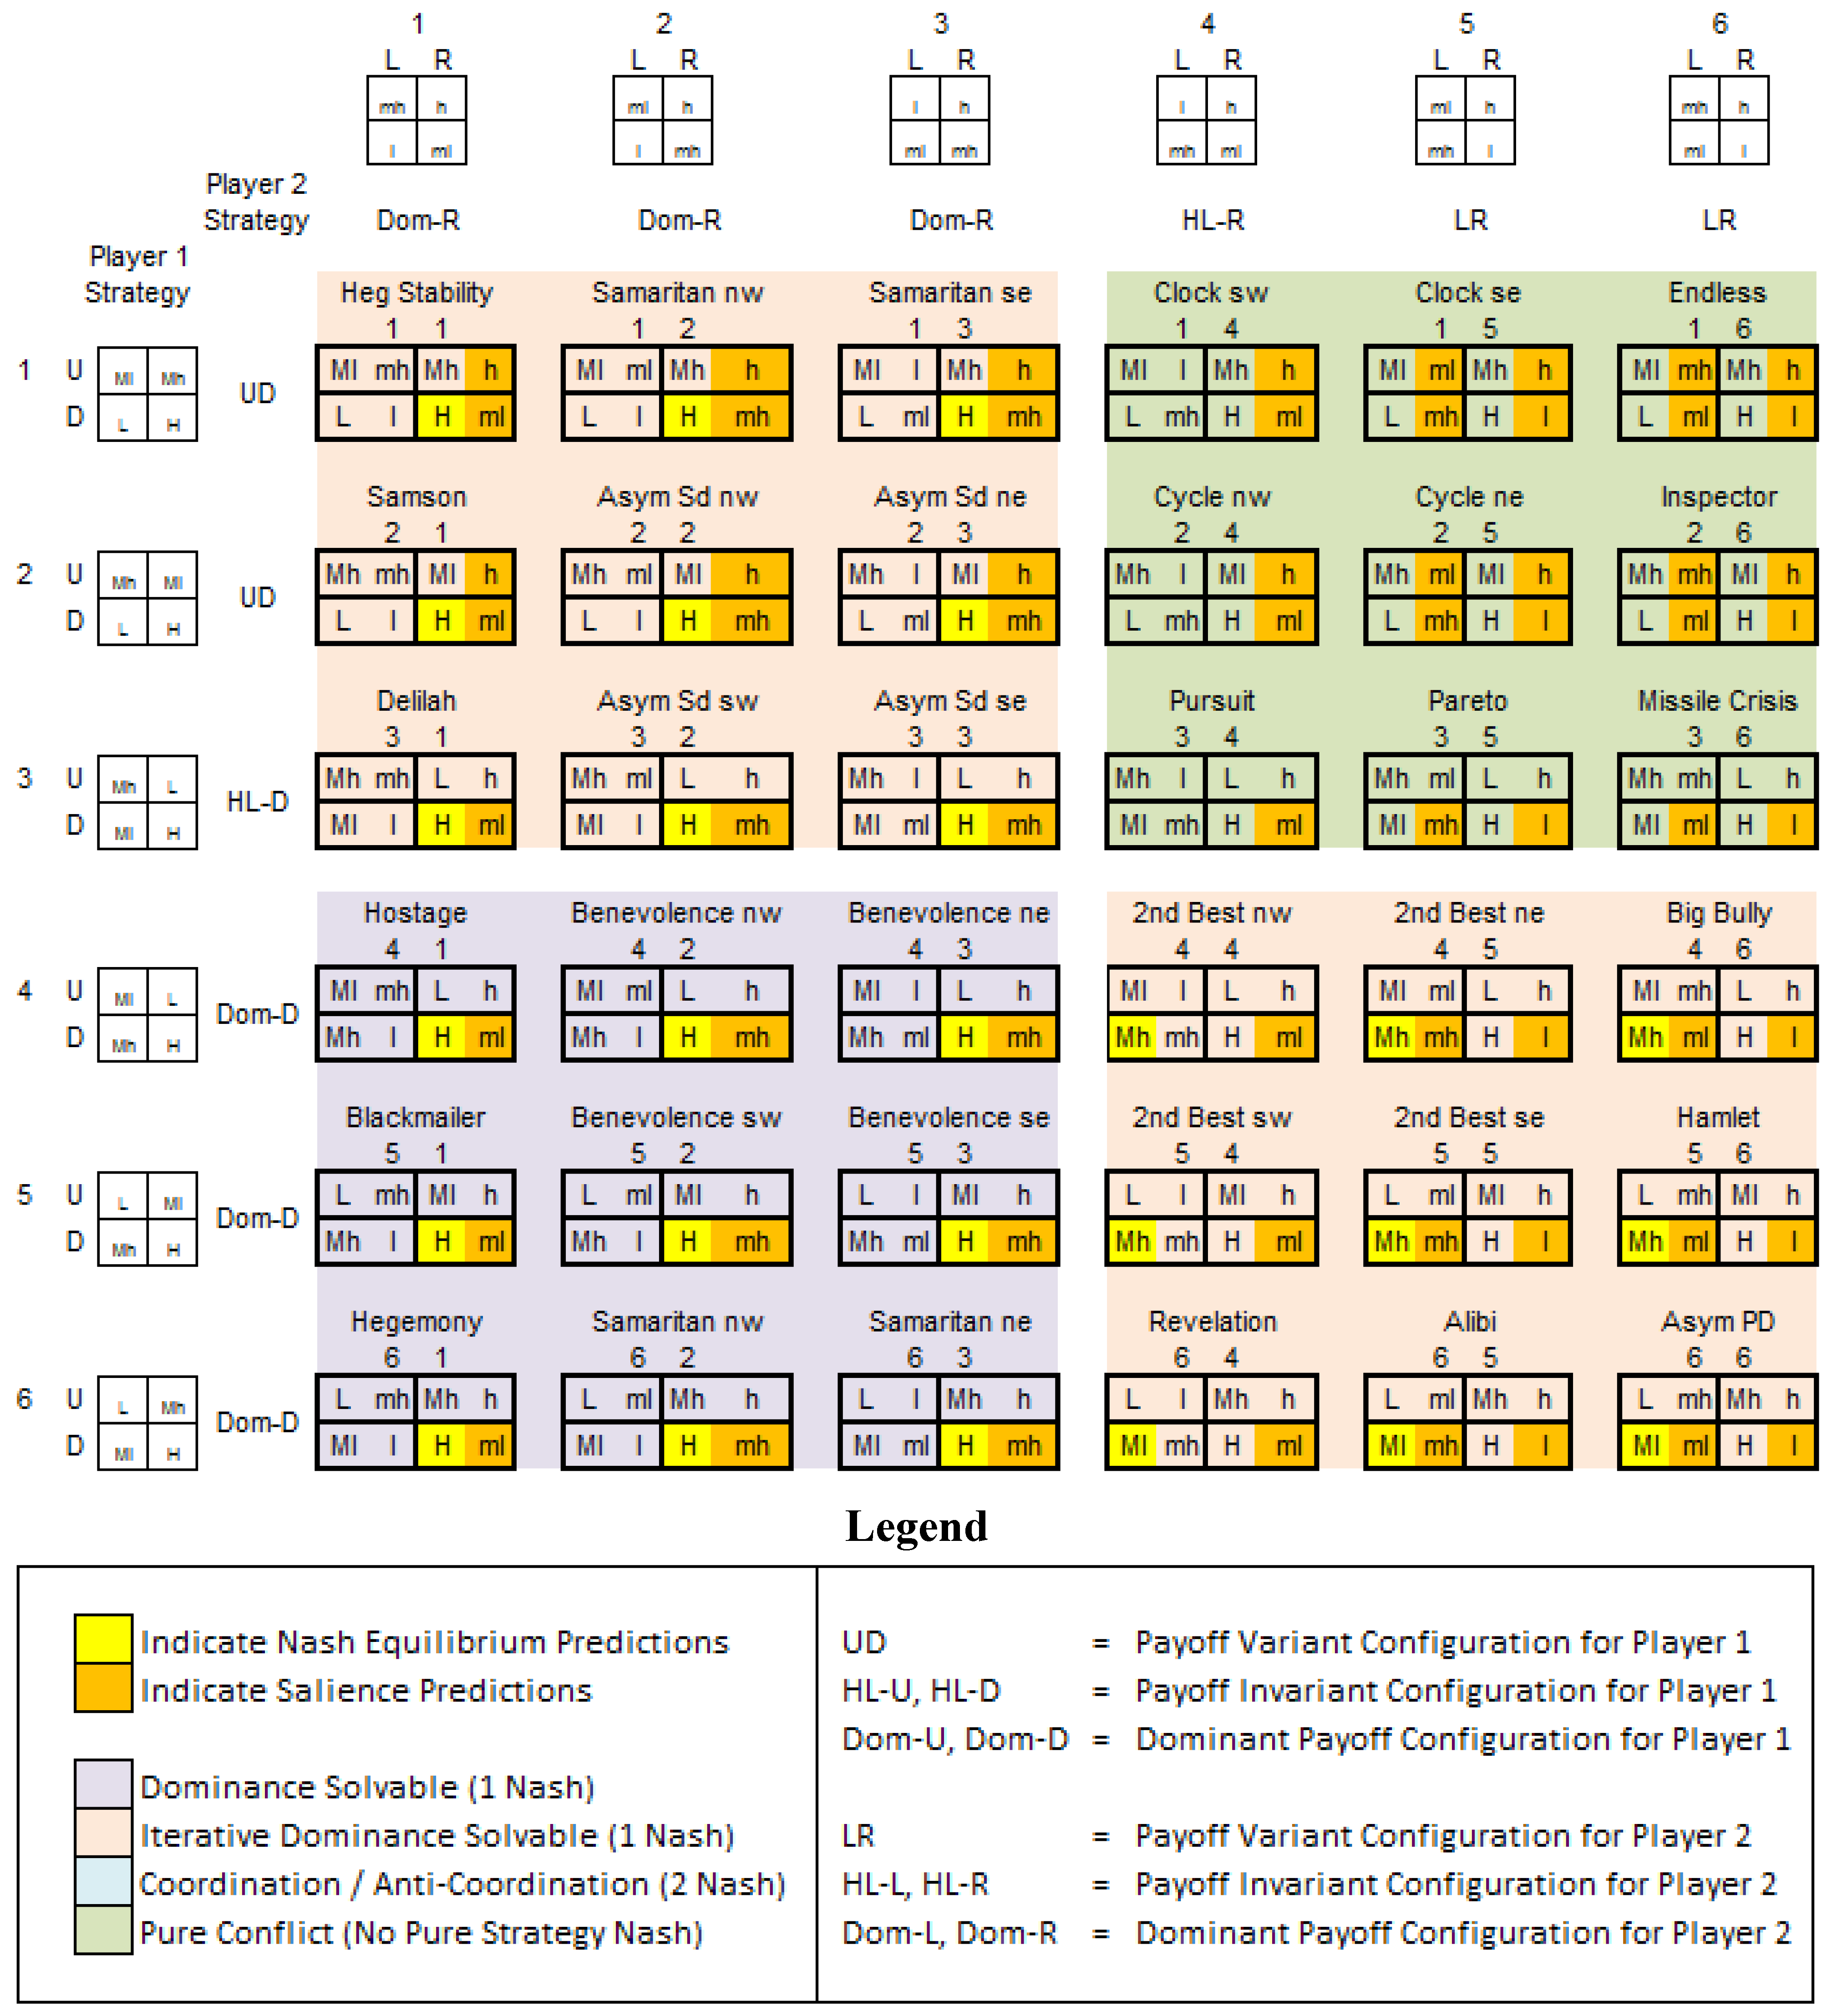
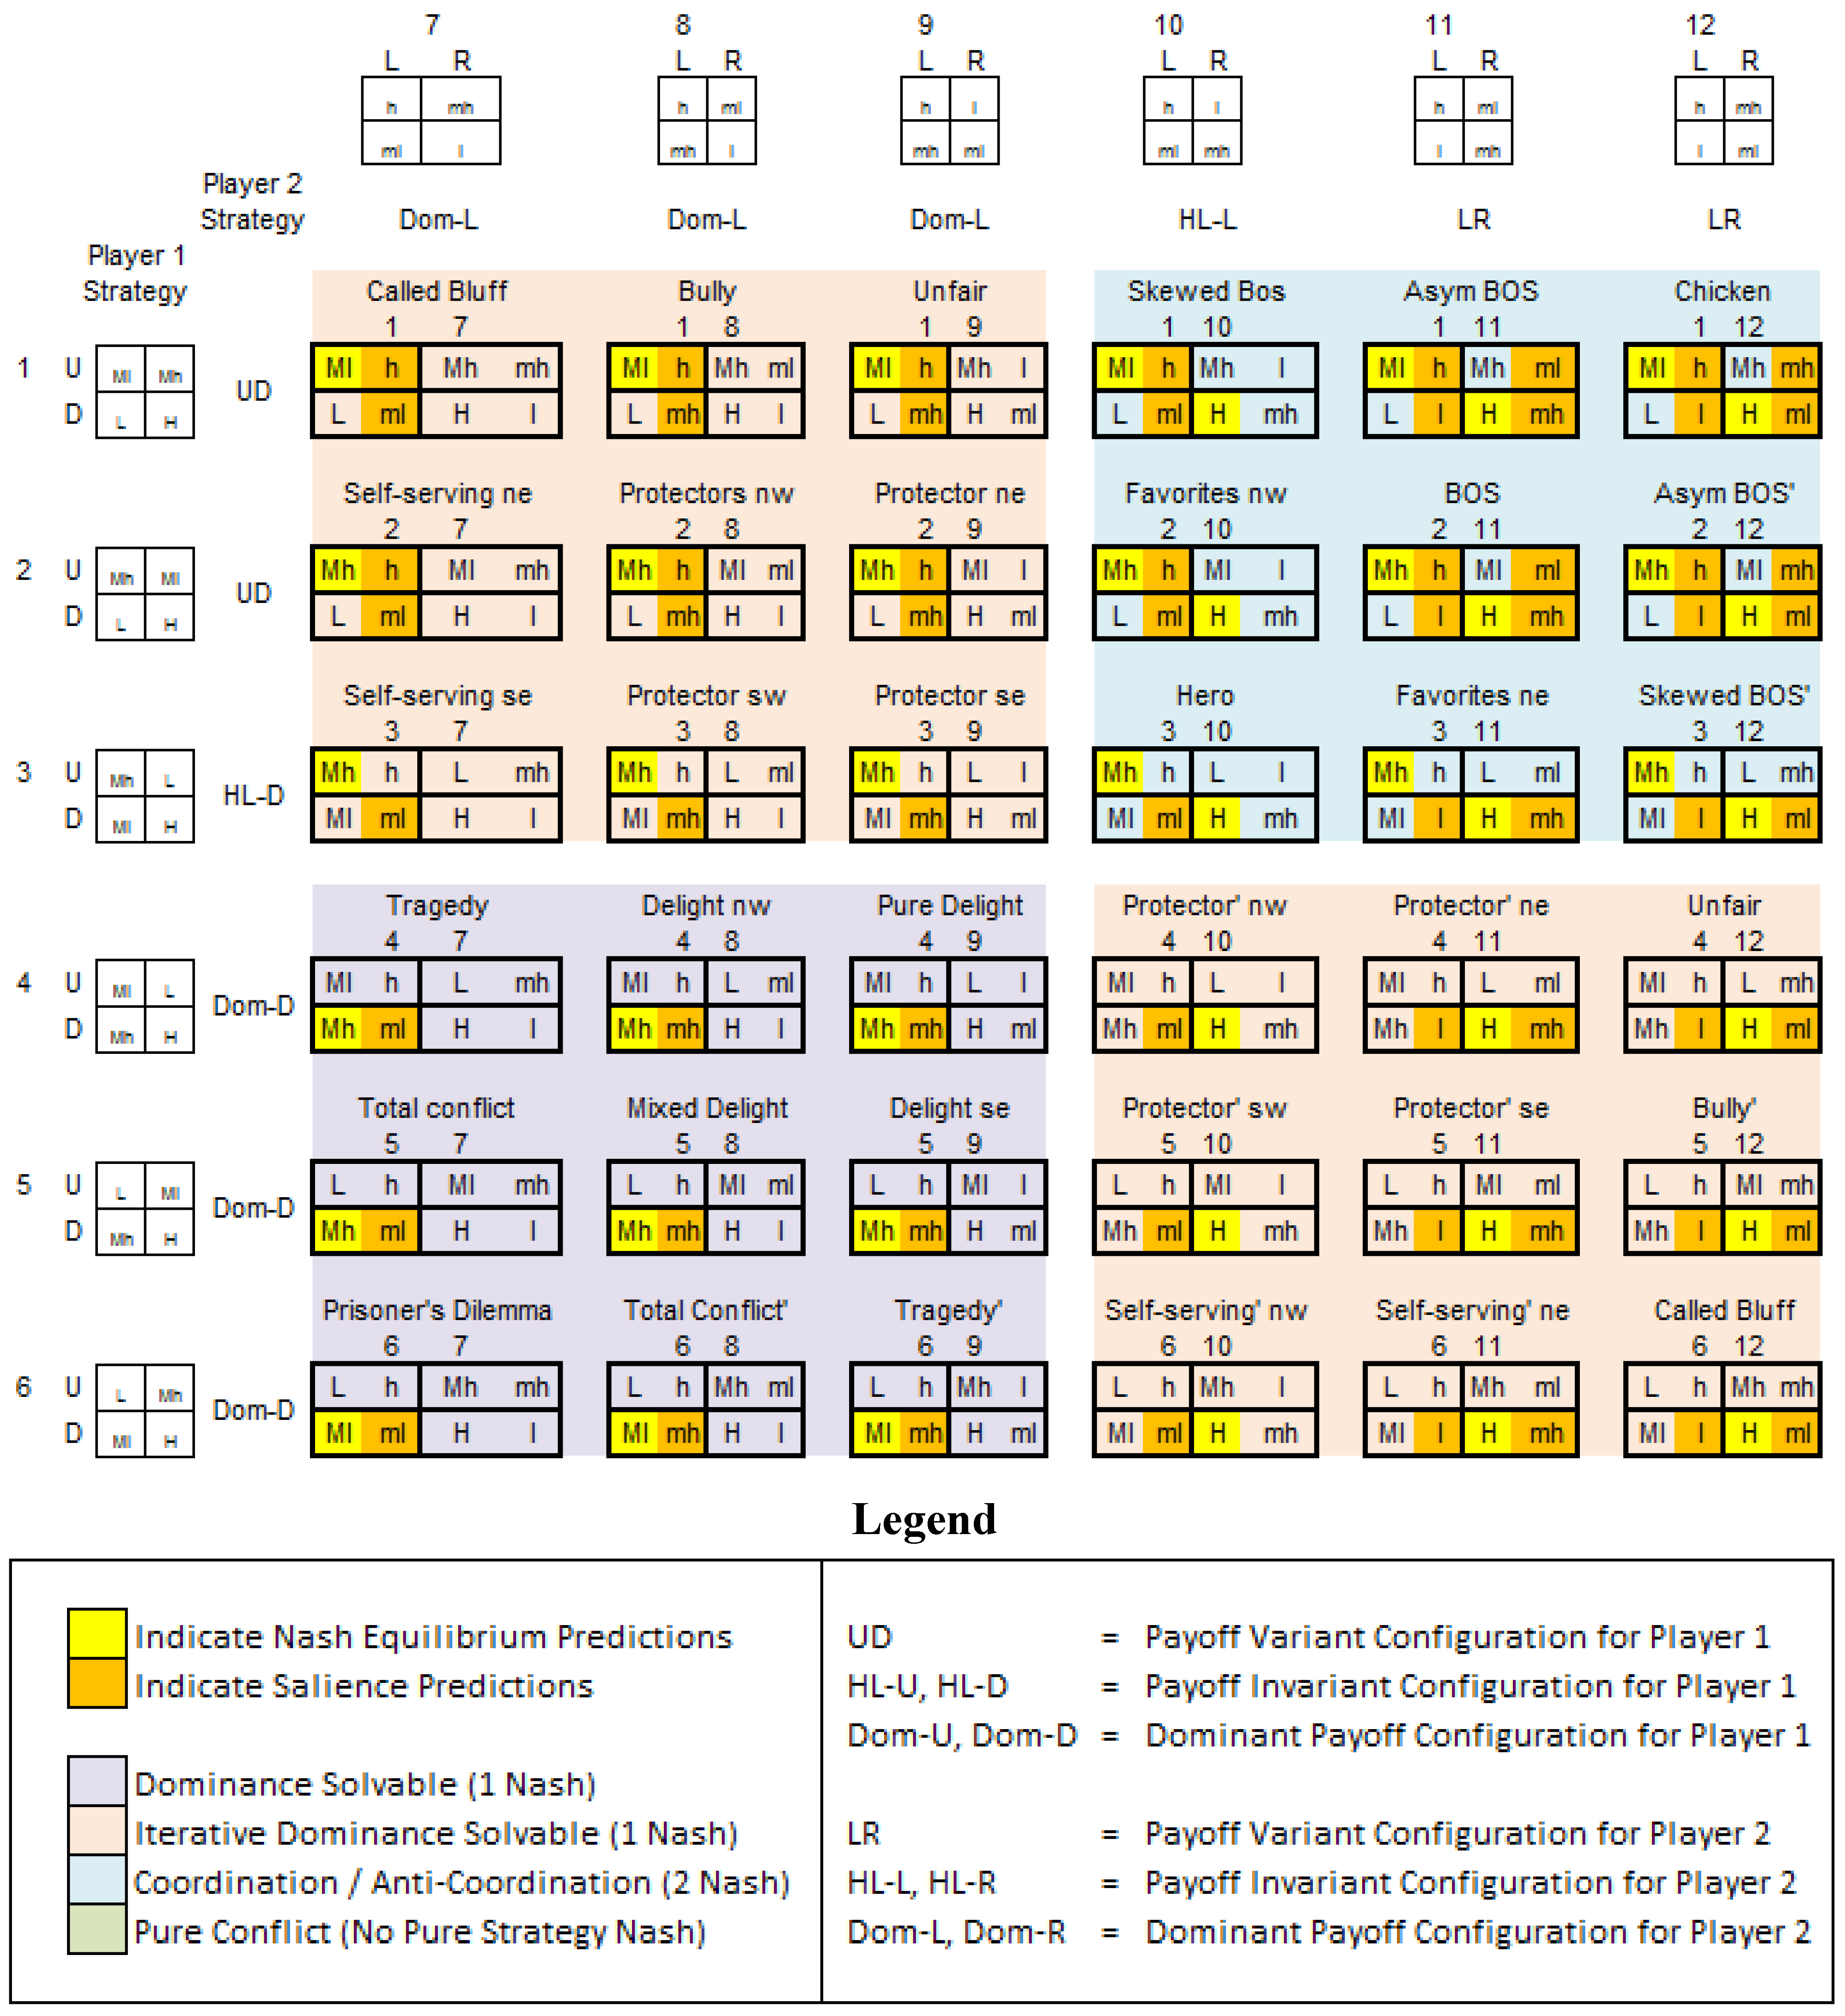
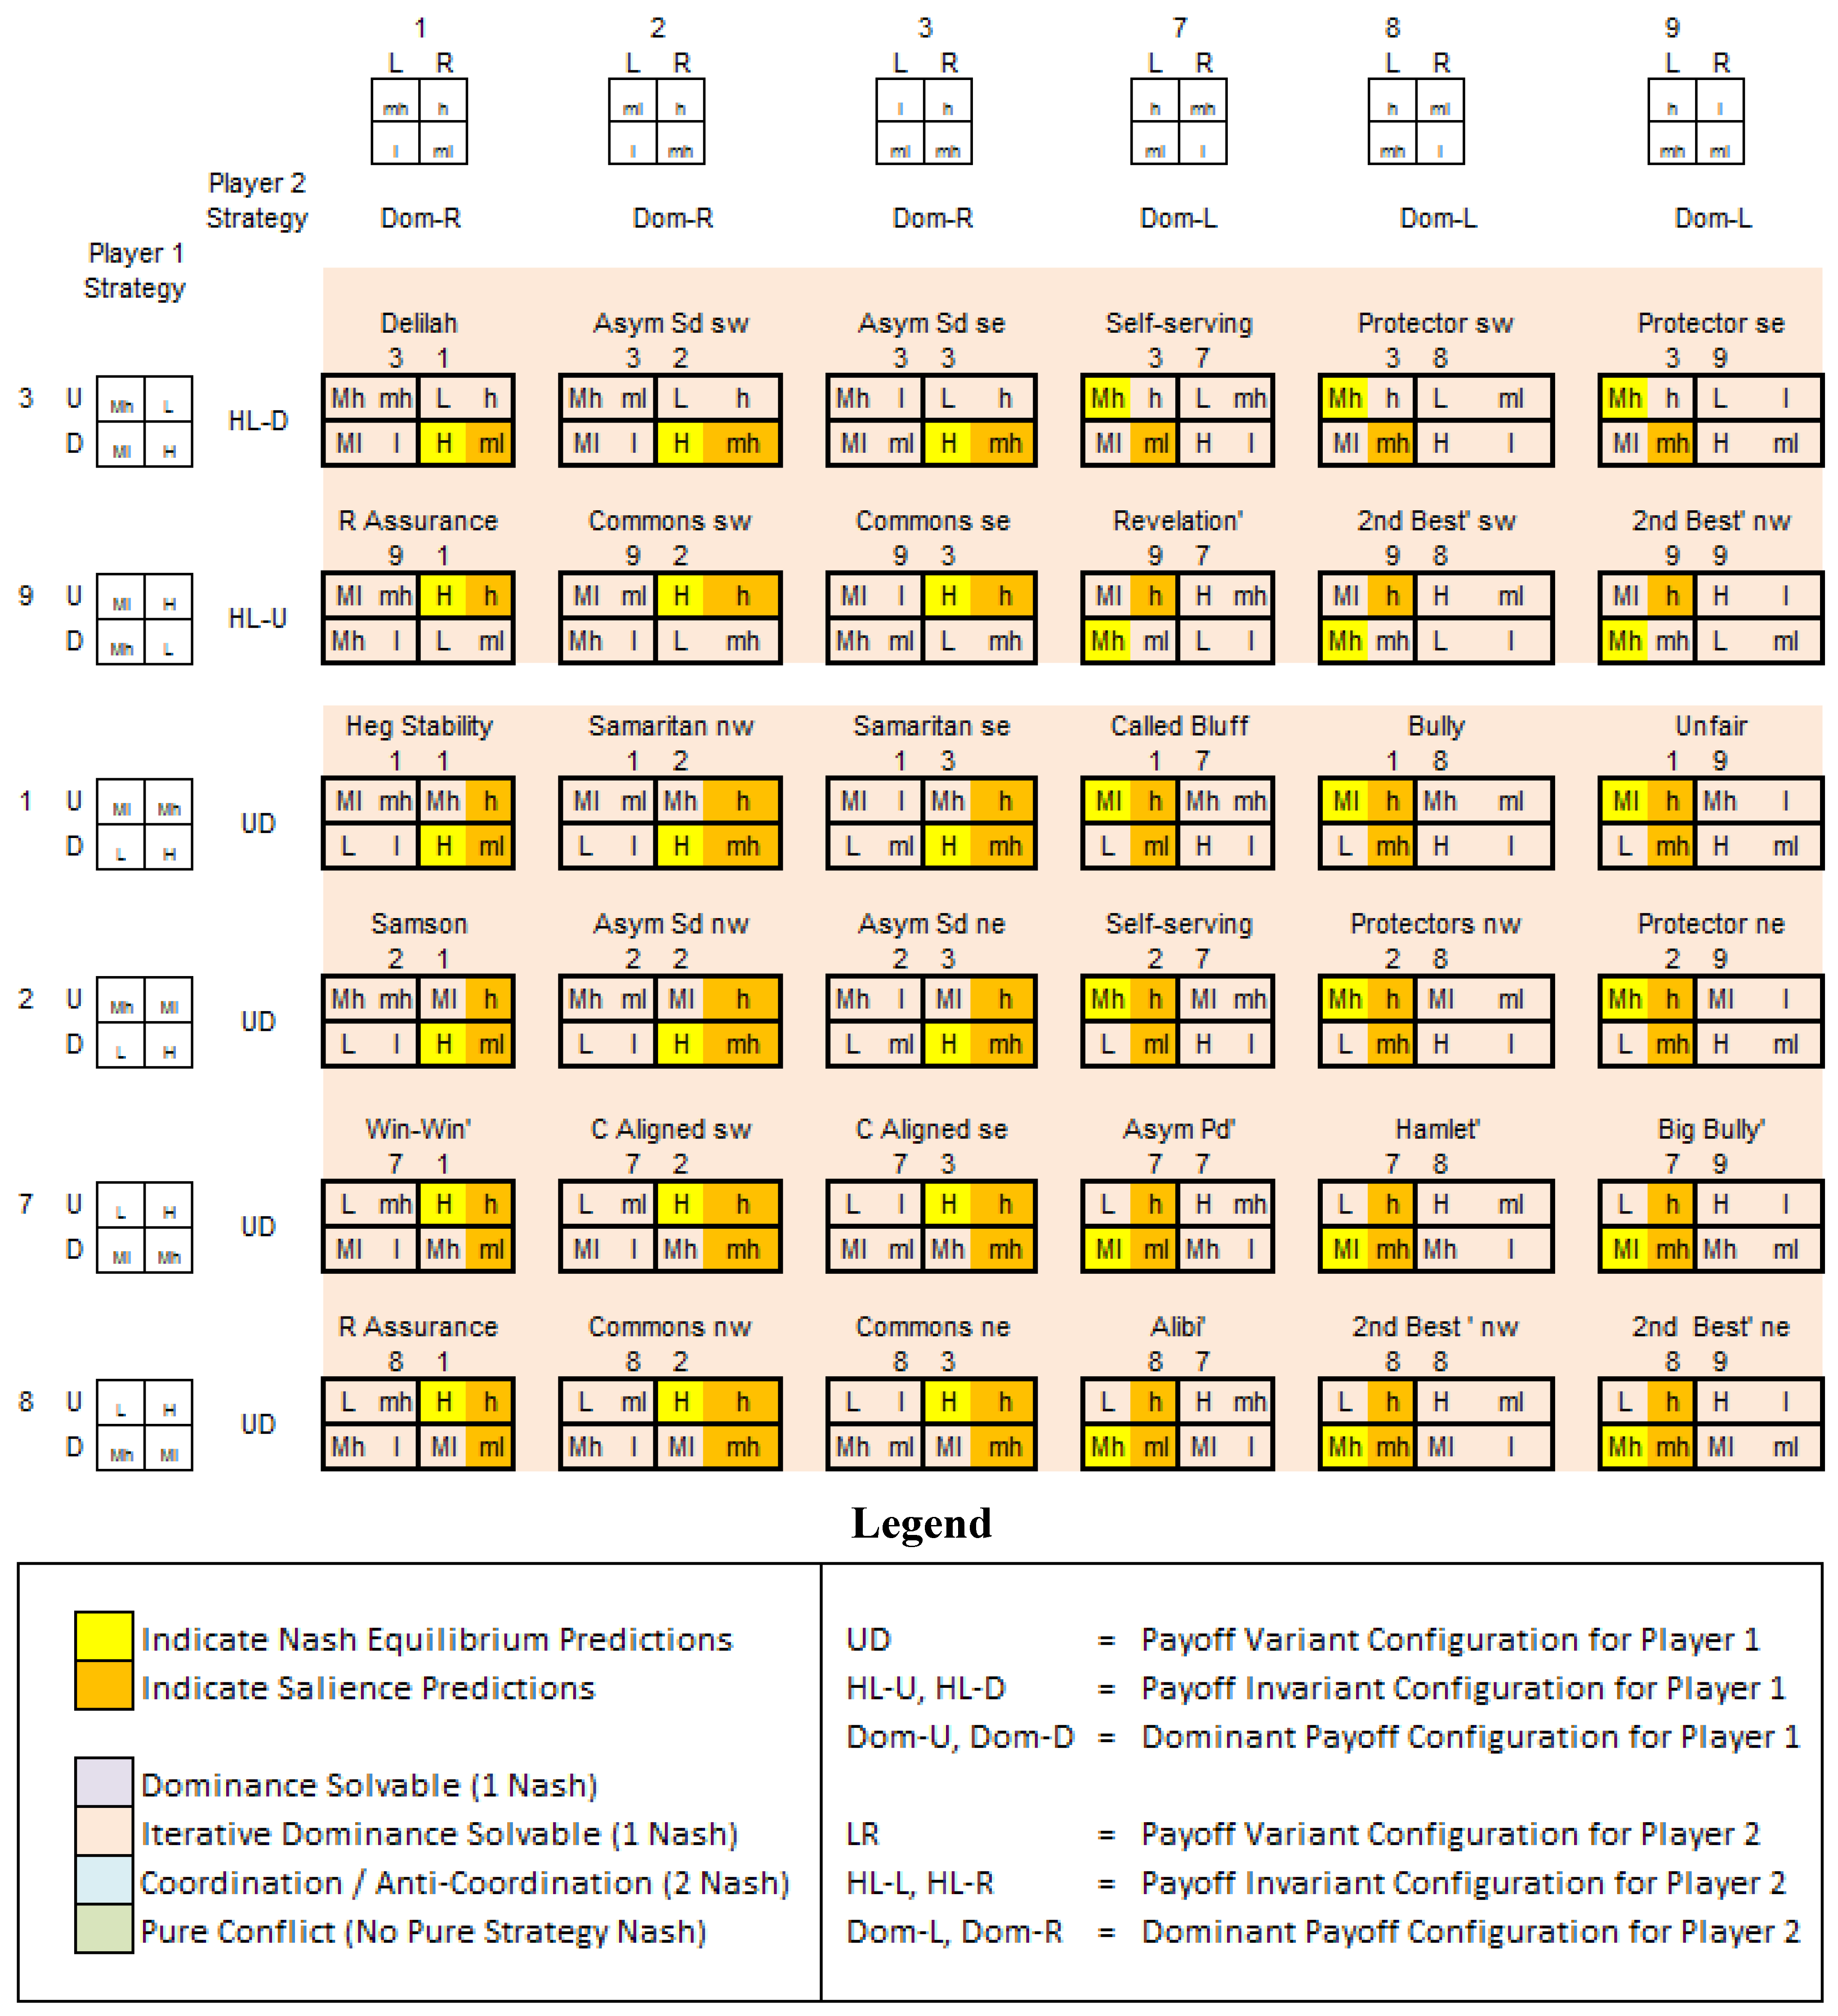
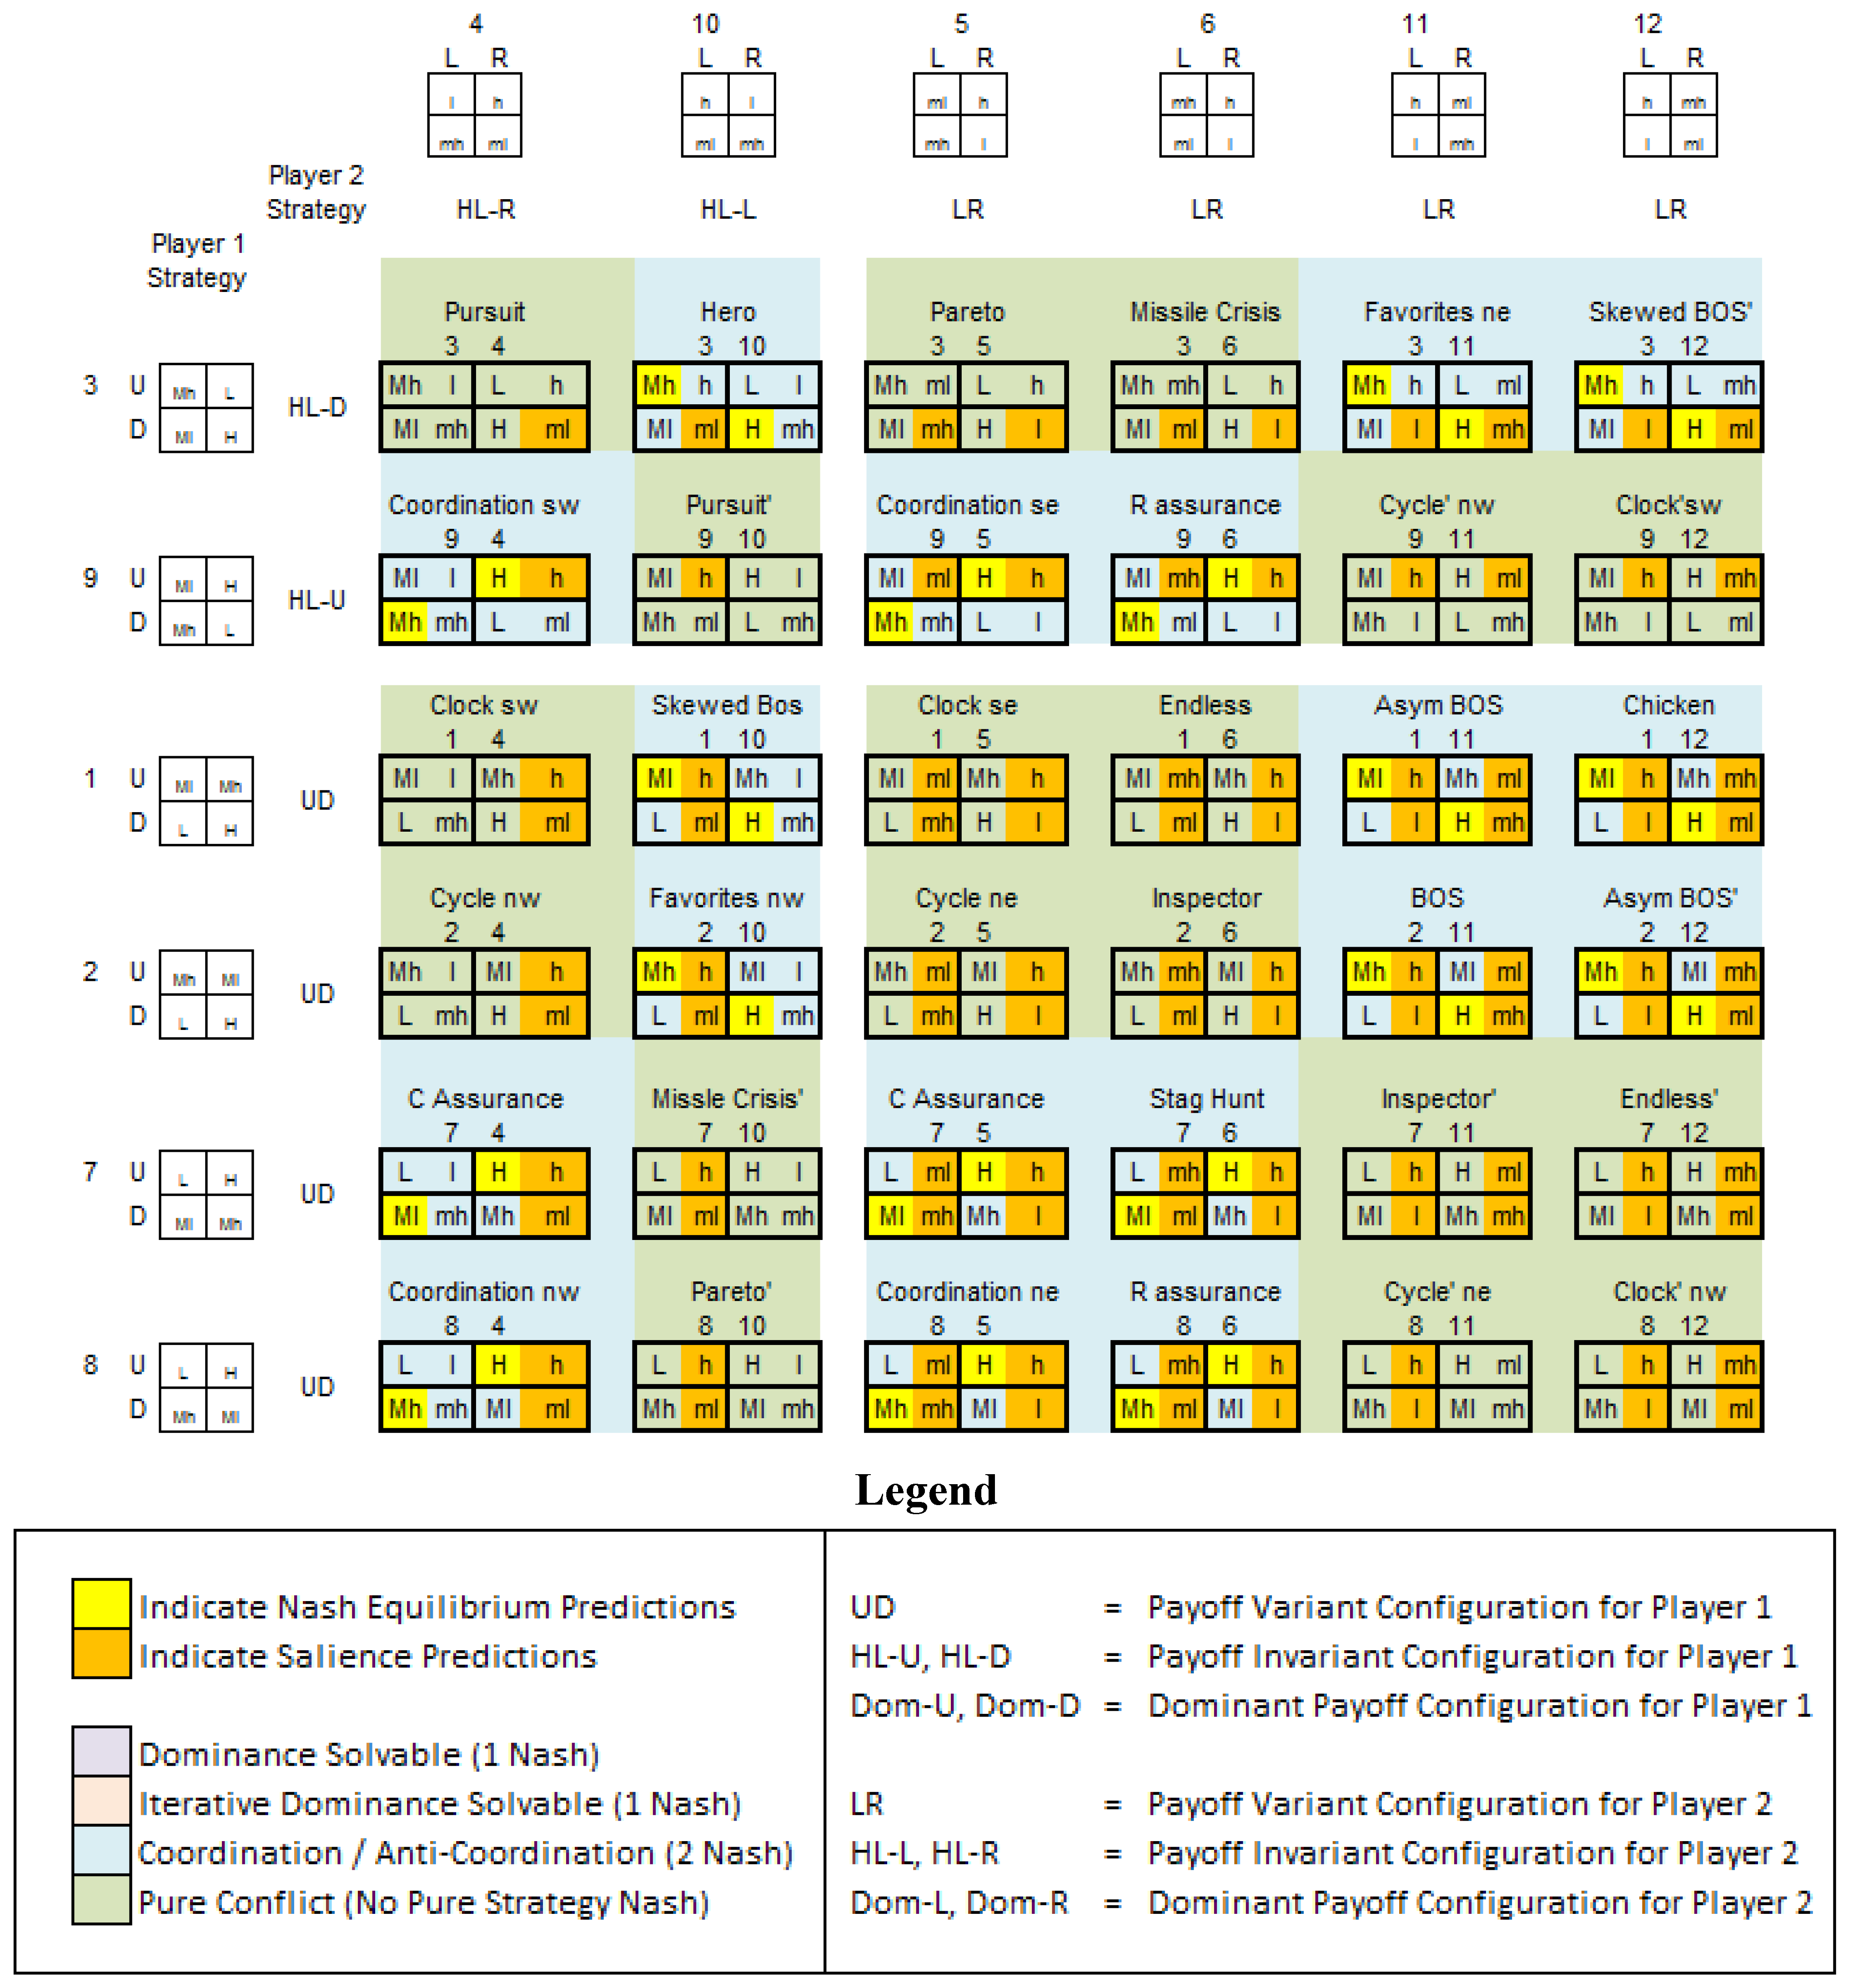
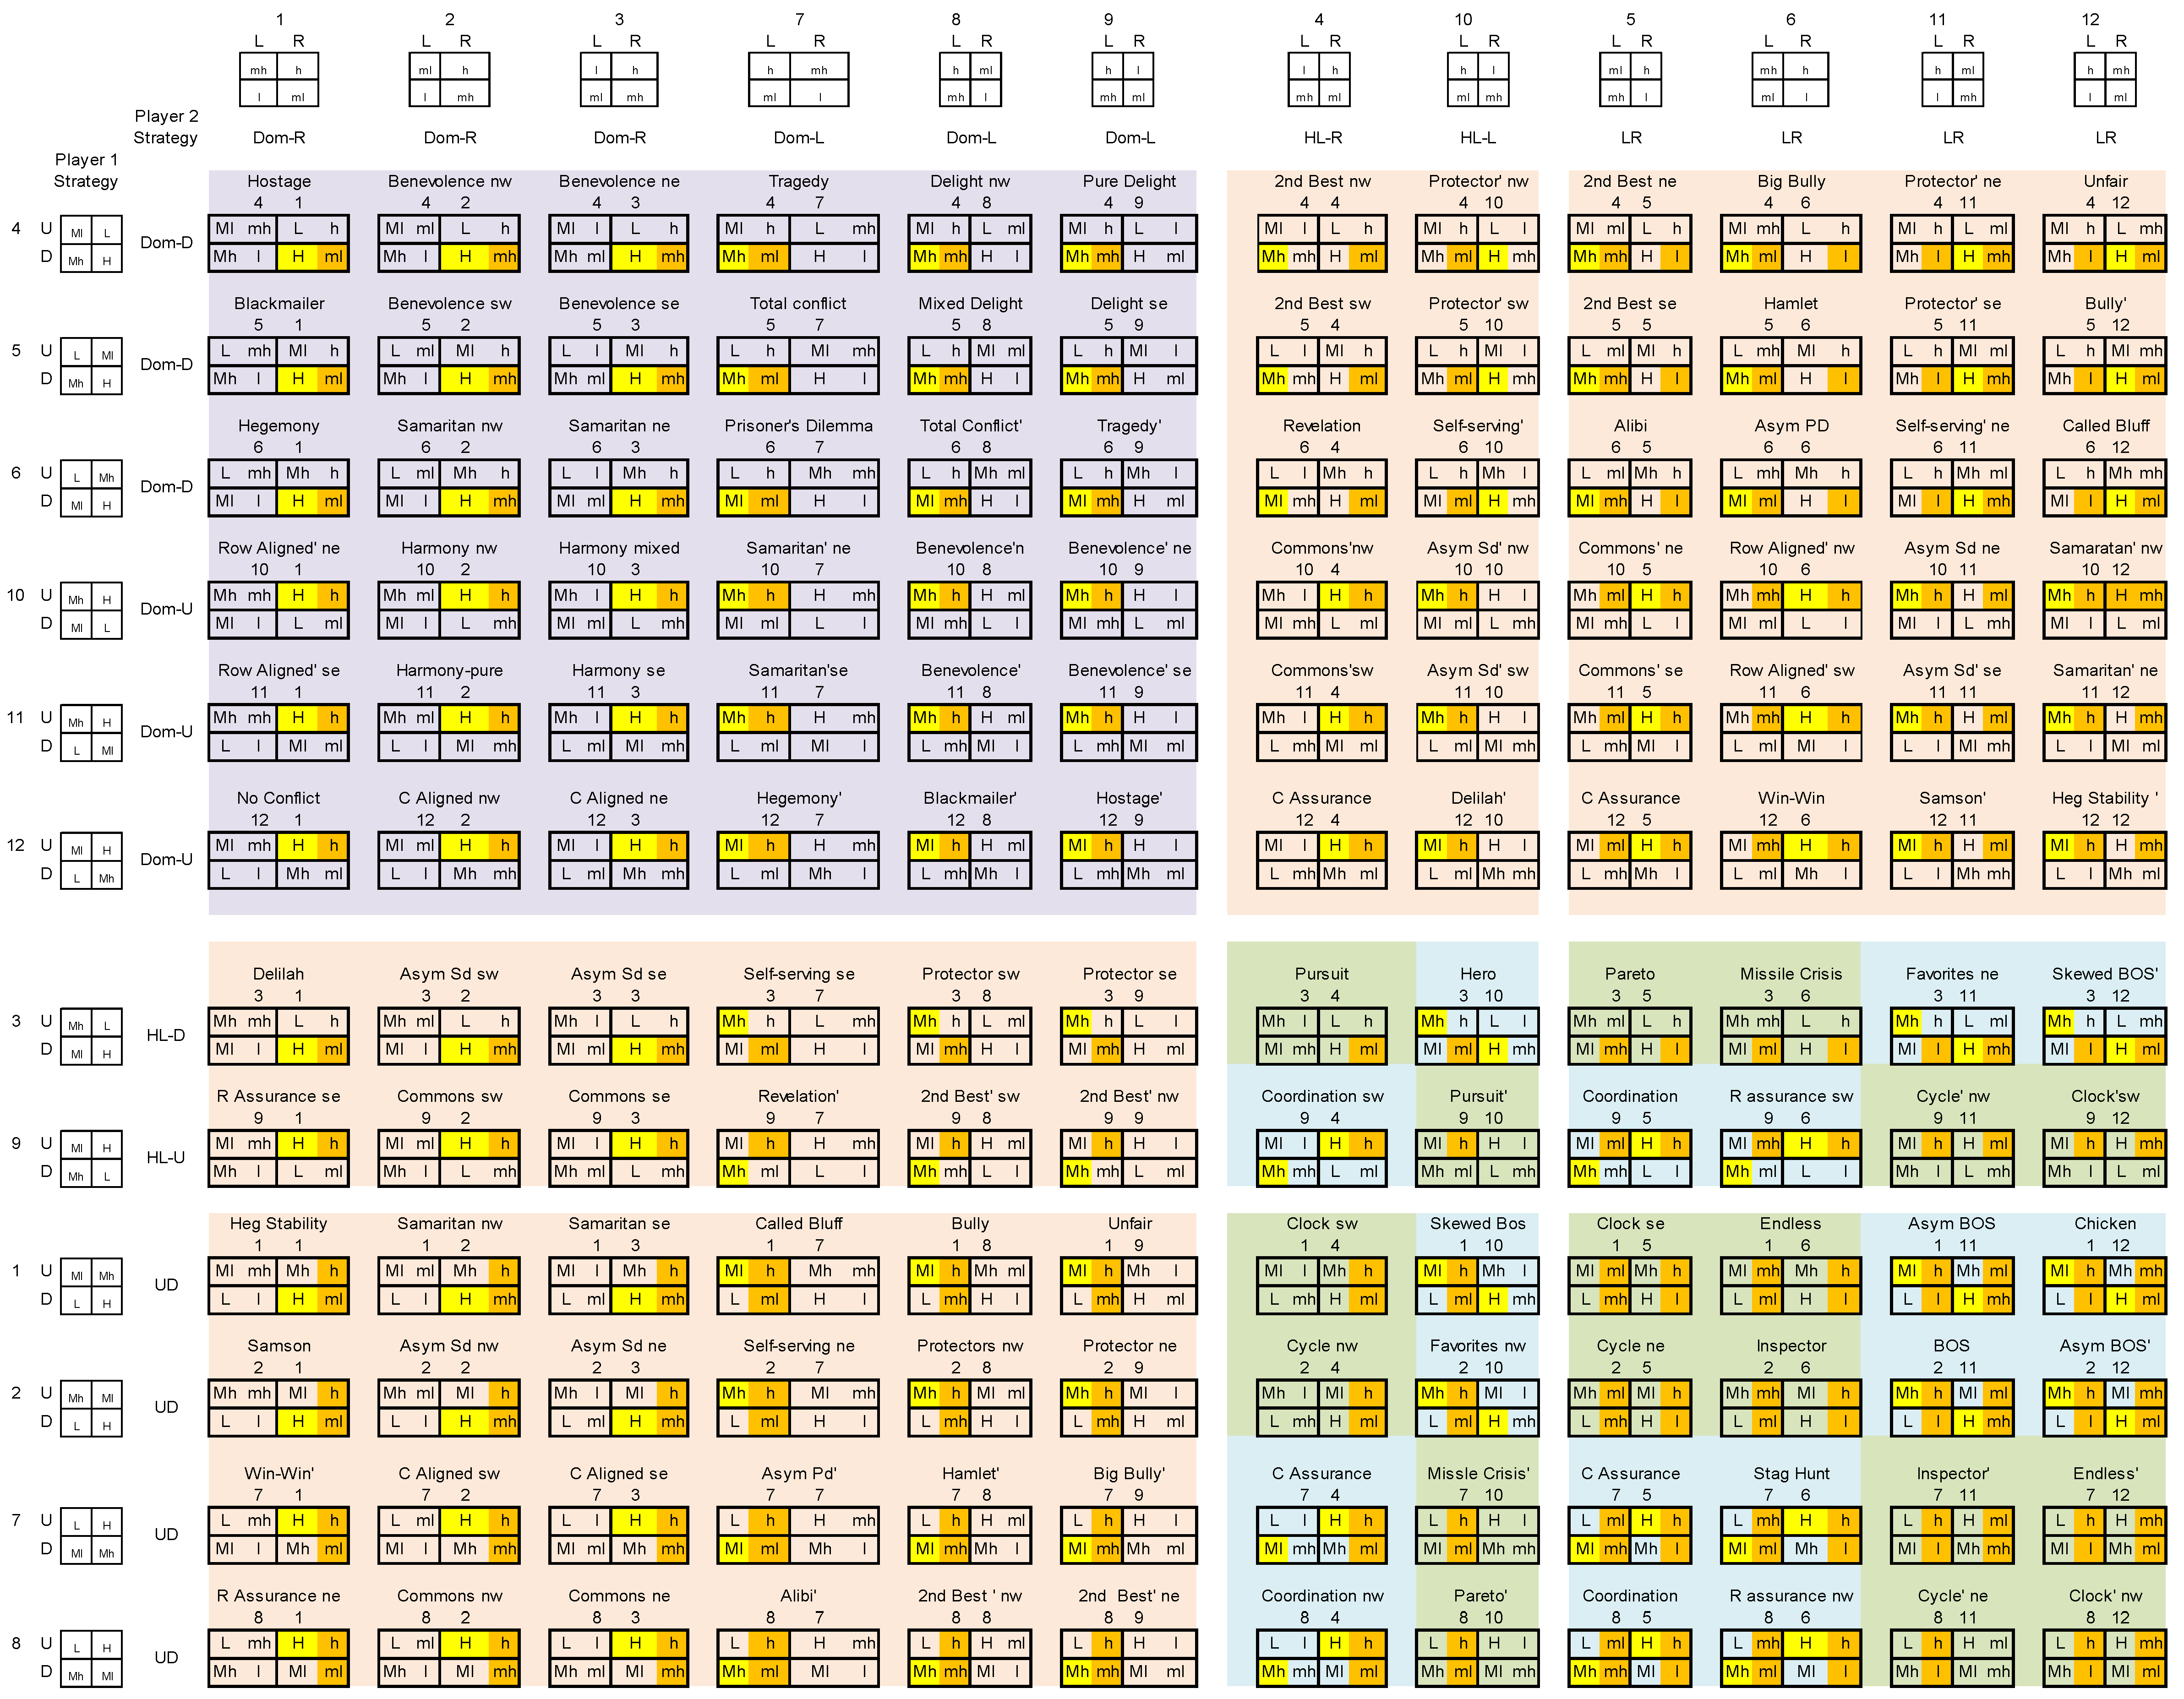
Appendix: Taxonomy of 2 × 2 Games


References
- Leland, J.W. Equilibrium Selection, Similarity Judgments, and the “Nothing to Gain/Nothing to Lose” Effect. J. Behav. Decision Mak. 2013. [Google Scholar] [CrossRef] [Green Version]
- Fehr, E.; Schmidt, K. A Theory of Fairness, Competition, and Cooperation. Q. J. Econ. 1999, 114, 817–868. [Google Scholar] [CrossRef]
- Bolton, G.; Ockenfels, A. ERC: A Theory of Equity, Reciprocity, and Competition. Am. Econ. Rev. 2000, 90, 166–193. [Google Scholar] [CrossRef]
- Andreoni, J.; Miller, J. Giving According to GARP: An Experimental Test of the Consistency of Preferences for Altruism. Econometrica 2002, 70, 737–753. [Google Scholar] [CrossRef]
- Camerer, C.F.; Ho, T.-H.; Chong, J.-K. A Cognitive Hierarchy Model of Games. Q. J. Econ. 2004, 119, 861–898. [Google Scholar] [CrossRef]
- Nagel, R. Unraveling in Guessing Games: An Experimental Study. Am. Econ. Rev. 1995, 85, 1313–1326. [Google Scholar]
- Stahl, D.; Wilson, P. On Players’ Models of Other Players: Theory and Experimental Evidence. Games Econ. Behav. 1995, 10, 218–254. [Google Scholar] [CrossRef]
- Todd, P.; Gigerenzer, G. Precis of Simple Heuristics that Make us Smart. Behav. Brain Sci. 2000, 23, 727–741. [Google Scholar] [CrossRef] [PubMed]
- Tversky, A. Intransitivity of Preferences. Psychol. Rev. 1969, 76, 31–48. [Google Scholar] [CrossRef]
- Reyna, V.; Brainerd, C. Fuzzy-trace Theory and Framing Effects in Choice: Gist Extraction, Truncation, and Conversion. J. Behav. Decision Mak. 1991, 4, 249–262. [Google Scholar] [CrossRef]
- González-Vallejo, C. Making Trade-offs: A Probabilistic and Context-Sensitive Model of Choice Behavior. Psychol. Rev. 2002, 109, 137–155. [Google Scholar] [CrossRef] [PubMed]
- Scholten, M.; Read, D. The Psychology of Intertemporal Tradeoffs. Psychol. Rev. 2010, 117, 925–944. [Google Scholar] [CrossRef] [PubMed]
- Loomes, G.; Sugden, R. Regret Theory: An Alternative Theory of Rational Choice under Uncertainty. Econ. J. 1982, 92, 805–824. [Google Scholar] [CrossRef]
- Rubinstein, A. Similarity and Decision-Making under Risk (is There a Utility Theory Resolution to the Allais Paradox?). J. Econ. Theory 1988, 46, 145–153. [Google Scholar] [CrossRef]
- Rubinstein, A. “Economics and Psychology”? The Case of Hyperbolic Discounting. Int. Econ. Rev. 2003, 44, 1207–1216. [Google Scholar] [CrossRef]
- Leland, J. Generalized Similarity Judgments: An Alternative Explanation for Choice Anomalies. J. Risk Uncertain. 1994, 9, 151–172. [Google Scholar] [CrossRef]
- Leland, J. Similarity Judgments in Choice under Uncertainty: A Reinterpretation of Regret Theory. Manag. Sci. 1998, 44, 1–14. [Google Scholar] [CrossRef]
- Leland, J. Similarity Judgments and Anomalies in Intertemporal Choice. Econ. Inq. 2002, 40, 574–581. [Google Scholar] [CrossRef]
- Bordalo, P.; Gennaioli, N.; Shleifer, A. Salience Theory of Choice under Risk. Q. J. Econ. 2012, 127, 1243–1285. [Google Scholar] [CrossRef]
- Kőszegi, B.; Szeidl, A. A Model of Focusing in Economic Choice. Q. J. Econ. 2013, 128, 53–104. [Google Scholar] [CrossRef]
- Di Guida, S.; Devetag, G. Feature-Based Choice and Similarity Perception in Normal-Form Games: An Experimental Study. Games 2013, 4, 776–794. [Google Scholar] [CrossRef]
- Frederick, S. Cognitive Reflection and Decision Making. J. Econ. Perspect. 2005, 19, 25–42. [Google Scholar] [CrossRef]
- Camerer, C.F. Behavioral Game Theory: Experiments on Strategic Interaction; Princeton University Press: Princeton, NJ, USA, 2003. [Google Scholar]
- Guyer, M.; Rapaport, A. 2 × 2 Games Played Once. J. Confl. Resolut. 1972, 16, 409–431. [Google Scholar]
- Kilgour, D.M.; Fraser, N.M. A Taxonomy of All Ordinal 2 × 2 Games. Theory Decision 1988, 24, 99–117. [Google Scholar] [CrossRef]
- Robinson, D.; Goforth, D.; Cargill, M. Toward a topological treatment of the nonstrictly ordered 2 × 2 games, 2007. Available online: http://www.researchgate.net/profile/David_Robinson23/publication/251699368_Toward_a_Topological_Treatment_of_the_Non-strictly_Ordered_2_2_Games/links/0deec53bb6160cd58b000000.pdf (accessed on 15 October 2015).
- Robinson, D.R.; Goforth, D.J. The Topology of 2 × 2 Games: A New Periodic Table; Routledge: London, UK, 2005. [Google Scholar]
- Goeree, J.; Holt, C. Ten Little Treasures of Game Theory and Ten Intuitive Contradictions. Am. Econ. Rev. 2001, 91, 1402–1422. [Google Scholar] [CrossRef]
- Basu, K. The Traveler’s Dilemma: Paradoxes of Rationality in Game Theory. Am. Econ. Rev. 1994, 84, 391–395. [Google Scholar] [CrossRef]
- Bernheim, D. Rationalizable Strategic Behavior. Econometrica 1984, 52, 1007–1028. [Google Scholar] [CrossRef]
- Pearce, D.G. Rationalizable Strategic Behavior and the Problem of Perfection. Econometrica 1984, 52, 1029–1050. [Google Scholar] [CrossRef]
- Schelling, T. The Strategy of Conflict: Prospectus for a Reorientation of Game Theory. J. Confl. Resolut. 1958, 2, 203–264. [Google Scholar] [CrossRef]
- Simon, H.A. Rational Choice and the Structure of the Environment. Psychol. Rev. 1956, 63, 129–138. [Google Scholar] [CrossRef] [PubMed]
- Gigerenzer, G.; Goldstein, D.G. Reasoning the Fast and Frugal Way: Models of Bounded Rationality. Psychol. Rev. 1996, 103, 650–669. [Google Scholar] [CrossRef] [PubMed]
- 4If neither player has dominant or salient strategy, players choose at random.
- 5This type of sequential decision making process is discussed by Frederick [22] in the context of the Cognitive Reflection Test.
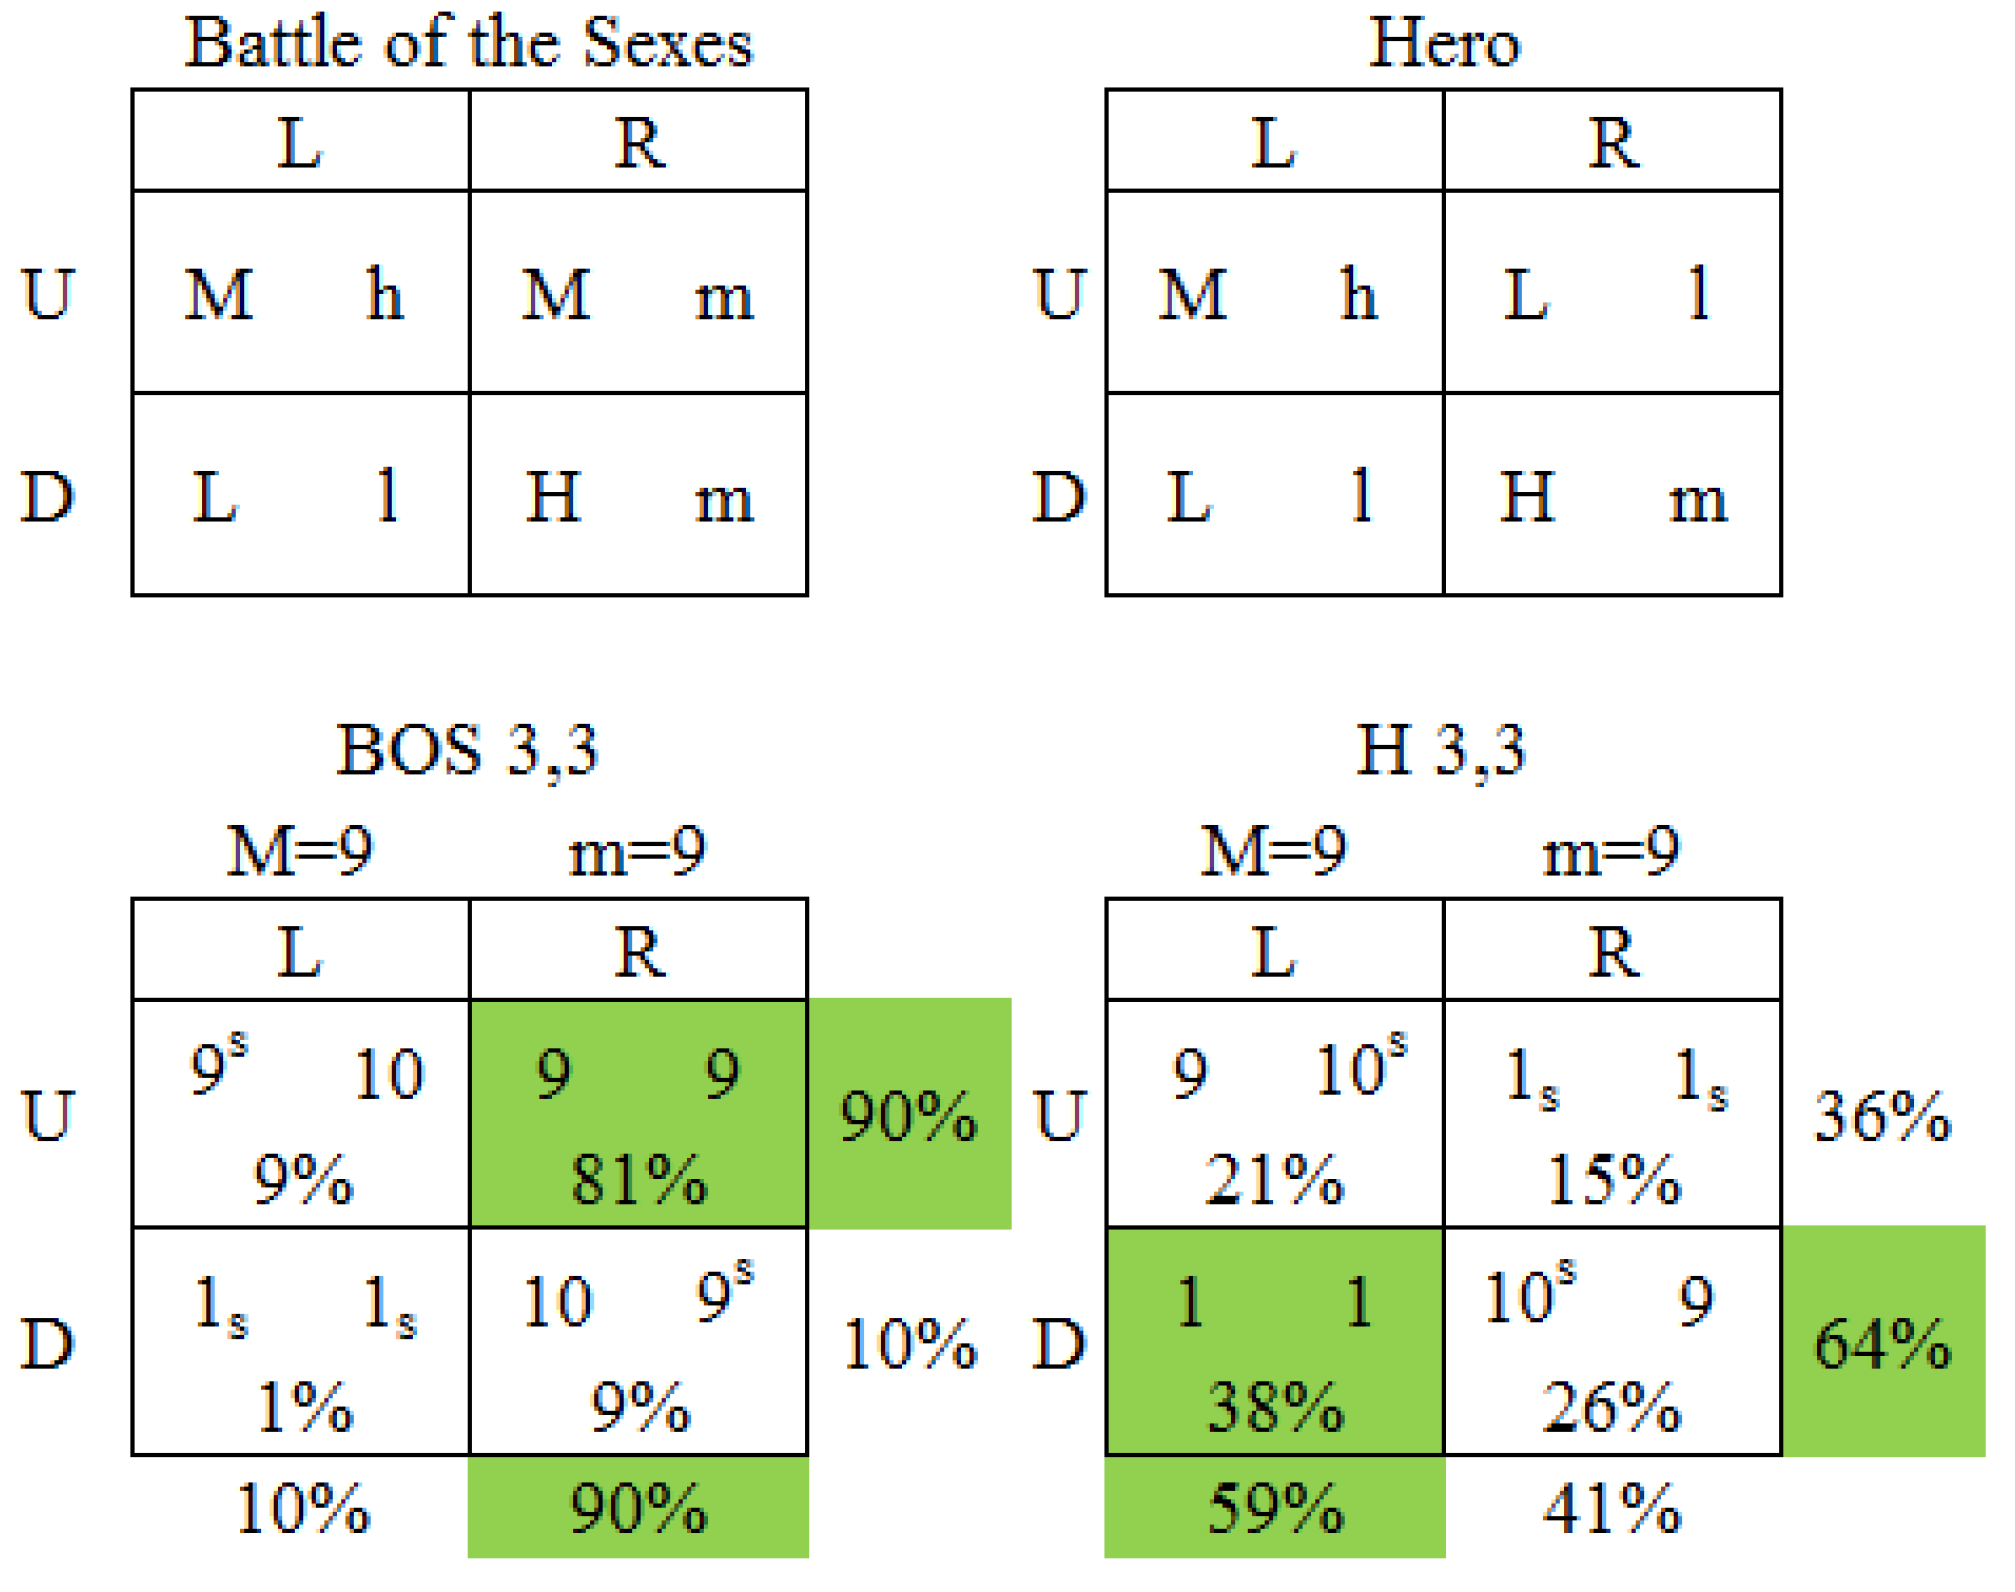
- 6These predictions, to the extent they are borne out empirically, have interesting implications for engineering outcomes in strategic settings. Within the confines of traditional game theory, the only ways to influence outcomes in games are through side-payments and penalties that change the game structure or by changing players’ preferences over the outcomes. In the model presented here, side-payments and penalties can influence the outcome in payoff-variable games even if the fundamental structure remains the same. We may also be able to construct situations in which the preferred outcome will always obtain (e.g., the payoff dominant outcome in the Coordination sw game) or ones where it will never occur like the Hero game (in case we do not like the players.).
- 7Here again, the model suggests that we may be able to engineer the outcome that obtains in strategic settings by using side-payments or penalties to convert a HI/IL payoff structure to a Dom or HL structure for which one of the Nash equilibrium outcomes is assured.
- 8Predicted outcomes are the same for Player 2 except for cyclic games with HI/IL structures for both players. In these games, Player 2s best responses would result in the upper left and lower right (rather than lower left and upper right) outcomes in each game.
- 9This result suggests yet a third way to engineer outcomes in games and “solve” coordination problems. If we can convince one player in a game to consider the salience of his opponent’s payoffs and best respond before considering the salience of his own payoffs, the resulting game outcomes will be the same as those that arise if he has no salient payoffs and will correspond to Nash equilibria in games where they exist. Interestingly, if both players consider the salience of their opponent’s payoffs first, the non-Nash equilibrium outcomes predicted by the model are mirror images of the ones when players consider salience in their own payoffs first. In summarizing the impact of communication for solving coordination problems, (Camerer [22], p. 357) notes that one-way communication “work like a charm” but 2-way communication is almost as bad as no communication at all. This is exactly what we would expect if one-way communication prompts one player to think in terms of his opponent’s salient payoffs but two-way communication prompts both players to do so.
- 10Two additional games, always presented to subjects last, examined how players behave when their opponent has more than 2 strategies available.
- 11Instructions for Player 2s were identical except they were to choose between strategies L and R (and their opponent’s between U and D).
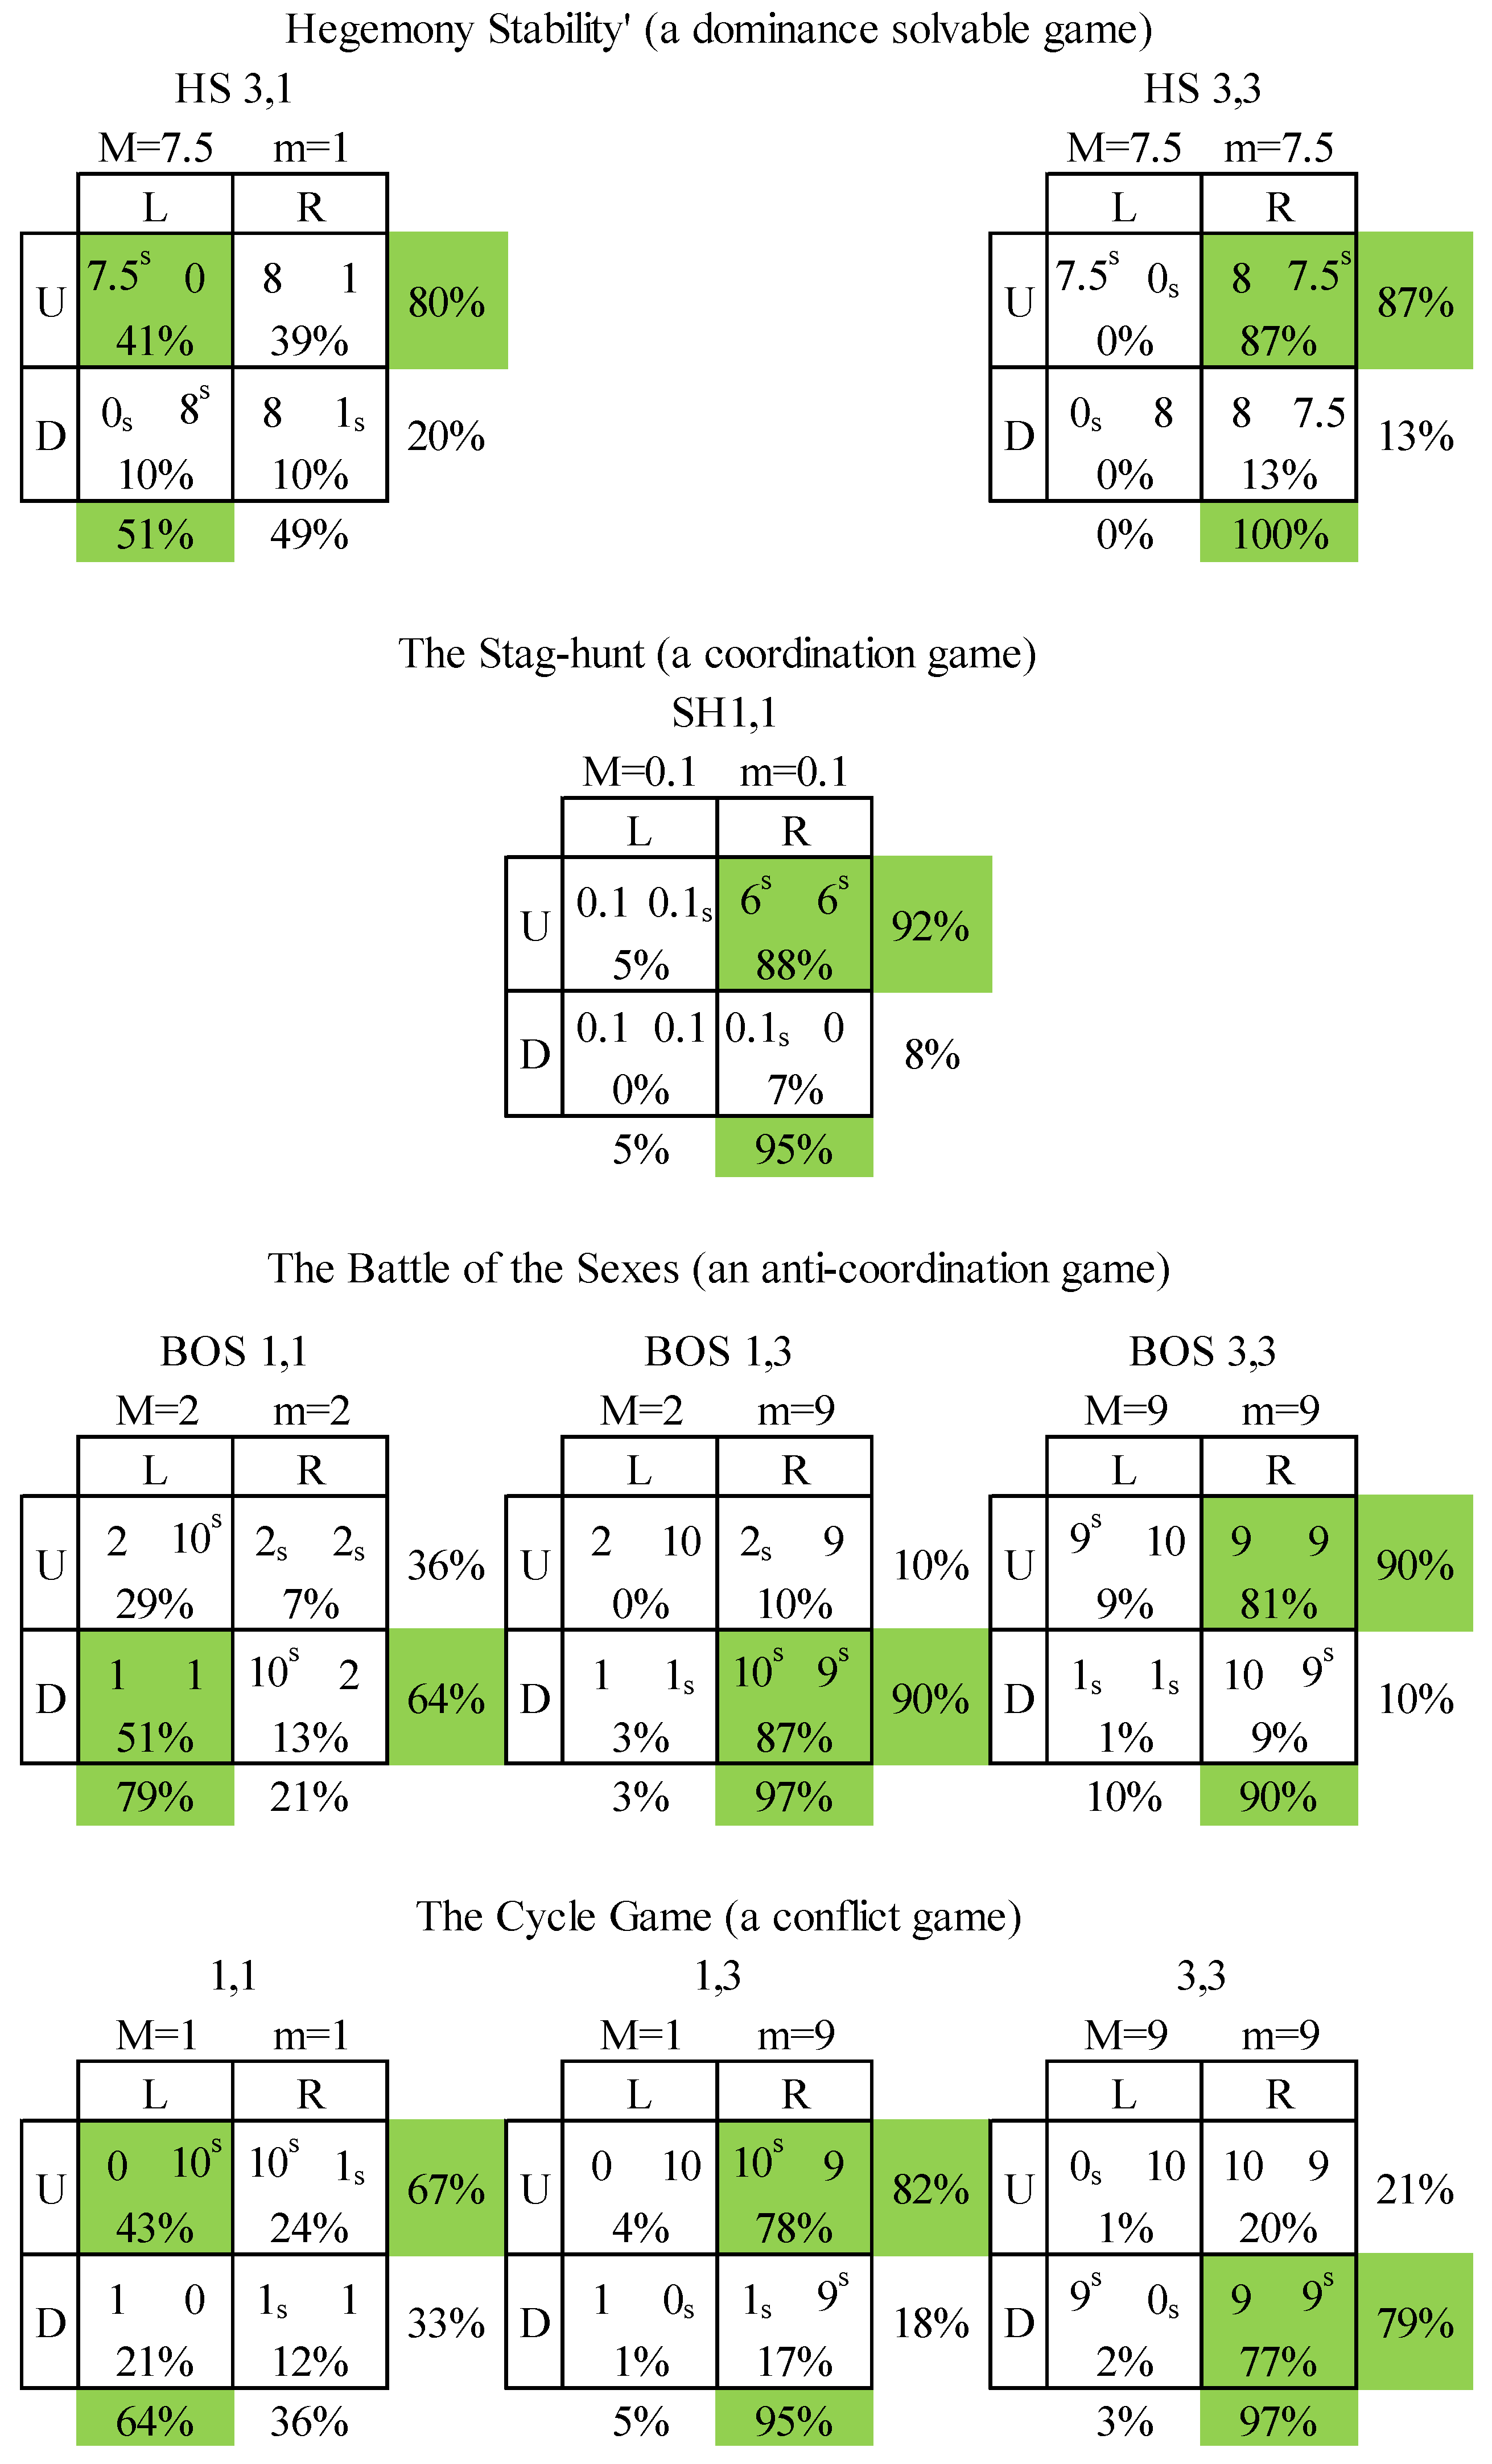
- 12Superscript s and subscript s here and in the subsequent figures, indicate the larger and smaller salient payoffs in the games.
- 13Although it is worth noting that allowing for the additional Nash outcome DL adds very little (2% to 7%) in terms of explaining the outcomes observed in the games.
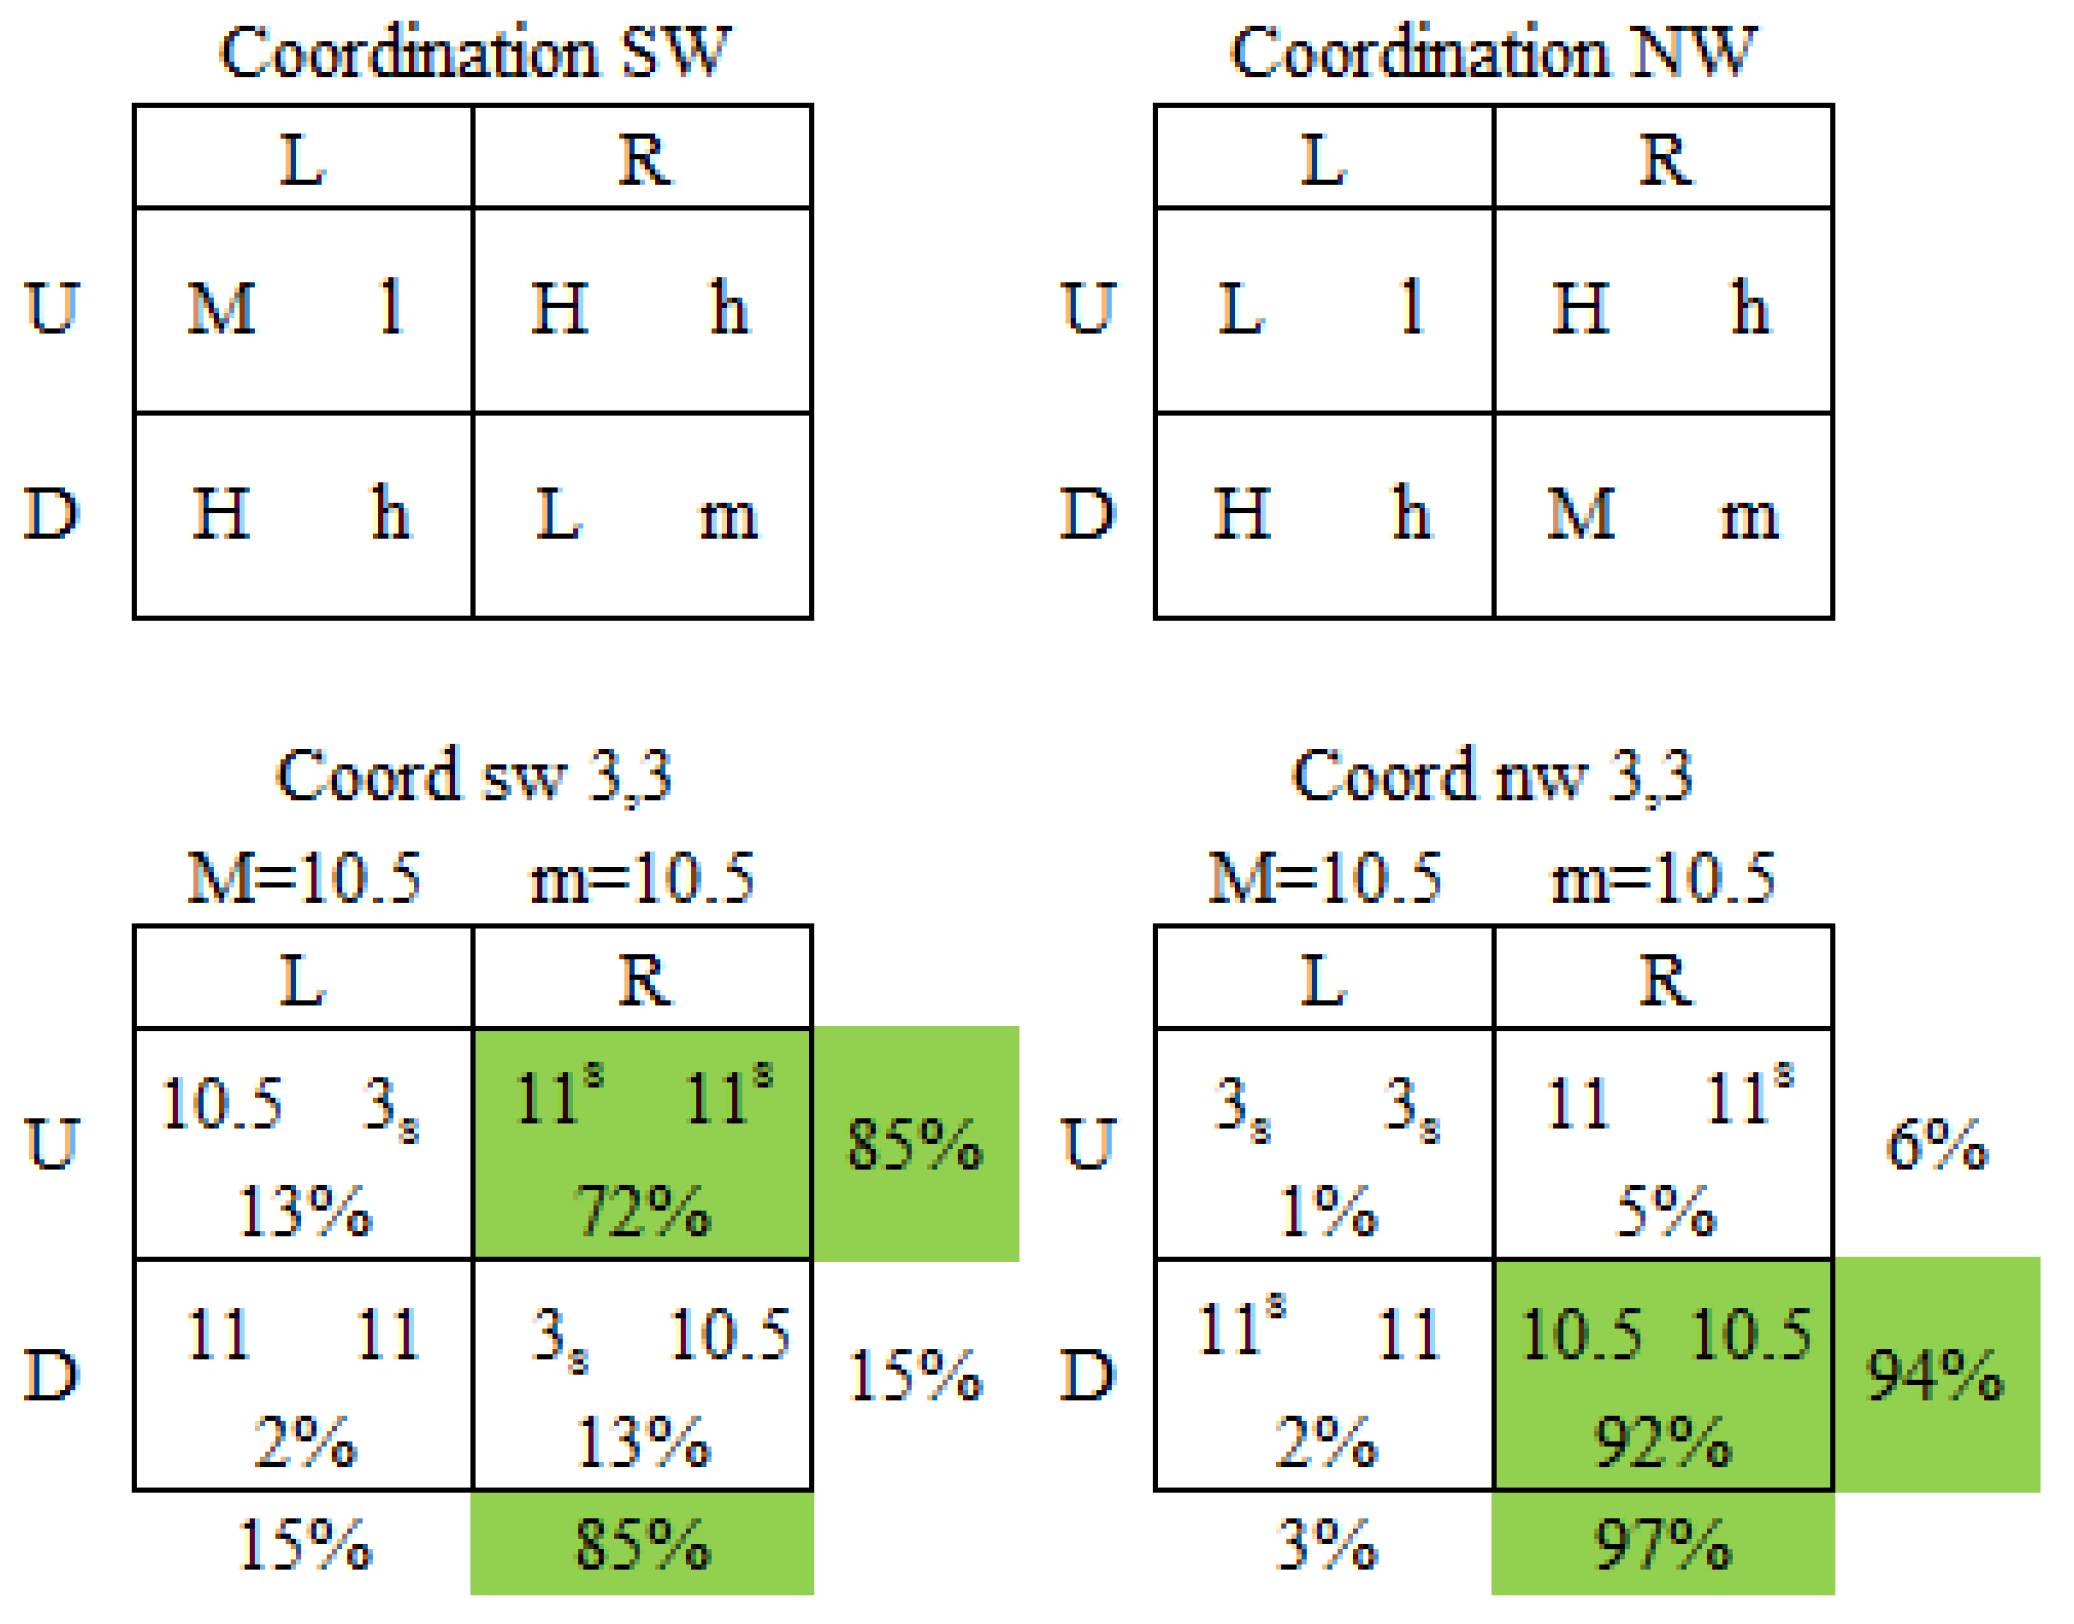
- 14Coord nw 3,3 is obtained by equating H and Mh and h and mh in the Coord NW game in Figure 9 (8,4). This converts the game from a payoff-variant HI/IL-HI/IL structure to a payoff invariant HL-HL structure. This illustrates a general consequence of moving from four distinct outcomes to three, namely, that the number of payoff configurations corresponding to a HI/IL structure declines and the number of configurations corresponding a Dom structure proliferate. For four distinct payoffs there are 12 possible payoff configurations, six of which are Dom, two of which are HL, and four of which are UD. For three distinct payoffs, there are six possible payoff configurations, four of which are Dom, and two of which are UD.
- 15It is not quite clear what a mixed strategy means in the context of a single-shot game. However, if players did randomize optimally given the payoff matrices, we would expect 81% of the outcomes in 1,1 to be DR (rather than the 12% observed), 81% of the outcomes in 1,3 to be UL (rather than the 4% observed) and 81% of the outcomes in 3,3 to be UR (rather than the 20% observed.)
- 16Here 39 of 78 subjects choose strategies offering payoffs of either 0 or 6 (23 P1s chose U and 16 P2s chose R) and 39 choose strategies offering payoffs of 3 or 3 (16 P1s choose D and 23 P2s choose L).
- 17One additional plausible prediction one might construct for salience-based payers is that response times will be longer for situations where players are predicted to best-respond. After analyzing the response time data from the experiment, we find that the results testing this prediction are ambiguous and small–for Player 1s the average reaction time for the 3 strategy choices in which they best responded was 25.79 seconds versus 25.99 seconds for the 17 choices when they did not have to best respond (opposite from the predicted direction). For Player 2s, the difference went in the predicted direction (24.63 seconds for the four strategy choices where they best responded versus 23.44 seconds for the 16 choices where they do not).
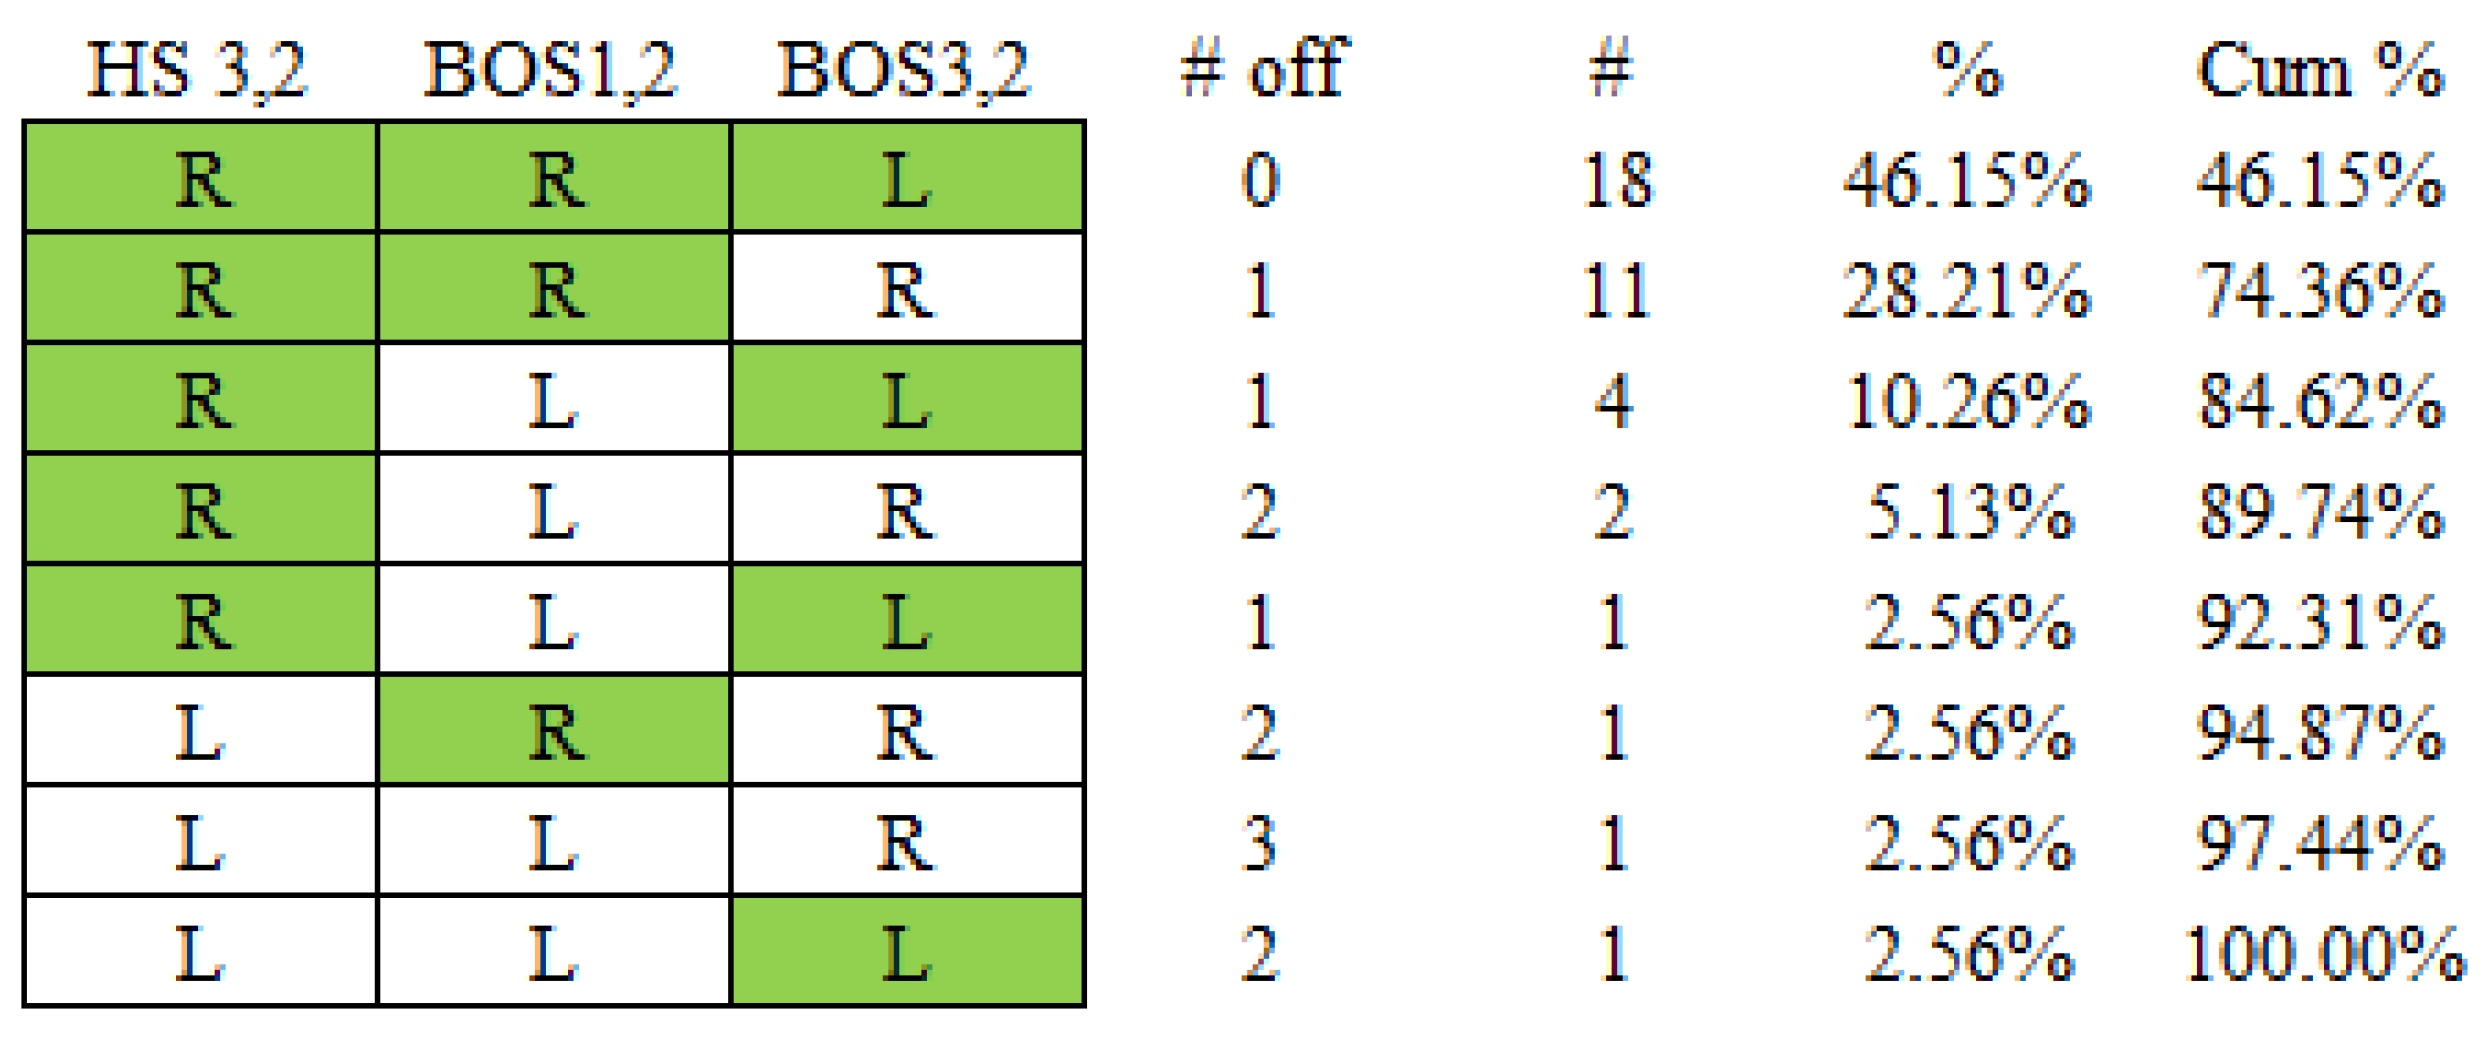
- 18Although the modal pattern for Player 1s appears to be two off the predicted pattern in Figure 20, Player 1s were two off the predicted pattern in different ways such that the modal response pattern apparently exhibited by nine subjects conceals the fact there were several different response patterns by which Player 1s differed by two choices from the predicted pattern. A similar observation holds for Player 2s.
- 19This suggests that the Hero game might be an ideal candidate for studies of learning in games to the extent it provides unambiguous negative feedback to either salience or Level-1 players. However, the general implication of this discussion is that opportunities for learning about the quality of decisions prescribed by are likely to be limited. Opportunities for learning in this type for setting will be even more circumscribed for Level-1 players to the extent that instances where they would want to have chosen differently can be attributed to their opponent having chosen randomly.
© 2015 by the authors; licensee MDPI, Basel, Switzerland. This article is an open access article distributed under the terms and conditions of the Creative Commons Attribution license (http://creativecommons.org/licenses/by/4.0/).
Share and Cite
Leland, J.W.; Schneider, M. Salience and Strategy Choice in 2 × 2 Games. Games 2015, 6, 521-559. https://doi.org/10.3390/g6040521
Leland JW, Schneider M. Salience and Strategy Choice in 2 × 2 Games. Games. 2015; 6(4):521-559. https://doi.org/10.3390/g6040521
Chicago/Turabian StyleLeland, Jonathan W., and Mark Schneider. 2015. "Salience and Strategy Choice in 2 × 2 Games" Games 6, no. 4: 521-559. https://doi.org/10.3390/g6040521
APA StyleLeland, J. W., & Schneider, M. (2015). Salience and Strategy Choice in 2 × 2 Games. Games, 6(4), 521-559. https://doi.org/10.3390/g6040521