
A U-Net Architecture for Inpainting Lightstage Normal Maps †


1
Department of Computer Science, University College London, London WC1E 6BT, UK
2
Department of Computer Science, Aberystwyth University, Aberystwyth SY23 3DB, UK
*
Author to whom correspondence should be addressed.
†
This paper is an extended version of our paper published in Computer Graphics & Visual Computing 2023, Wales, UK, 14–15 September 2023.
Computers 2024, 13(2), 56; https://doi.org/10.3390/computers13020056
Submission received: 15 January 2024
/
Revised: 6 February 2024
/
Accepted: 12 February 2024
/
Published: 19 February 2024
(This article belongs to the Special Issue Selected Papers from Computer Graphics & Visual Computing (CGVC 2023))
Abstract
:In this paper, we investigate the inpainting of normal maps that were captured from a lightstage. Occlusion of parts of the face during performance capture can be caused by the movement of, e.g., arms, hair, or props. Inpainting is the process of interpolating missing areas of an image with plausible data. We build on previous works about general image inpainting that use generative adversarial networks (GANs). We extend our previous work on normal map inpainting to use a U-Net structured generator network. Our method takes into account the nature of the normal map data and so requires modification of the loss function. We use a cosine loss rather than the more common mean squared error loss when training the generator. Due to the small amount of training data available, even when using synthetic datasets, we require significant augmentation, which also needs to take account of the particular nature of the input data. Image flipping and inplane rotations need to properly flip and rotate the normal vectors. During training, we monitor key performance metrics including the average loss, structural similarity index measure (SSIM), and peak signal-to-noise ratio (PSNR) of the generator, alongside the average loss and accuracy of the discriminator. Our analysis reveals that the proposed model generates high-quality, realistic inpainted normal maps, demonstrating the potential for application to performance capture. The results of this investigation provide a baseline on which future researchers can build with more advanced networks and comparison with inpainting of the source images used to generate the normal maps.
1. Introduction
Inpainting is a widely used image processing technique that involves filling in missing or damaged regions of an image. It has a wide range of applications, such as restoring damaged photographs [1], removing unwanted objects from images [2], and improving image compression techniques [3]. In the field of medical imaging, inpainting has been used to reconstruct images from partial scans [4], while in the film industry, it has been applied for special effects and postproduction work [5]. In this study, we focus on inpainting normal map facial data, a type of data generated from lightstage technology, which present unique challenges due to their intricate surface detail representation.
Traditional inpainting techniques involve manually painting over missing areas with color or texture information from surrounding regions [1]. However, this process can be time-consuming and requires significant expertise [6].
In recent years, deep learning-based inpainting methods have emerged as a promising alternative, showing remarkable performance in generating high-quality inpainted images [7]. These methods use convolutional neural networks (CNNs) to learn the mapping between the input image and its missing regions, allowing them to fill in missing regions with visually appealing results. The application of these methods to lightstage data, particularly normal maps, is less explored and forms the crux of our research. Normal maps encode detailed surface normals of objects, offering rich information crucial for realistic rendering in 3D modeling and digital restoration.
This study focuses on developing an image inpainting system for normal map facial data acquired from a lightstage [8,9]. A lightstage uses a spherical arrangement of LED lights to provide a variety of illumination patterns. Polarizing filters on some of the LEDs and one of the cameras allow specular reflections to be eliminated from some images. By capturing the specular and diffuse reflections under suitable lighting patterns, normal maps for surface and subsurface scattering can be estimated, along with the diffuse ‘albedo’ (i.e., shading-free surface colors). This allows realistic rendering of facial models under different lighting. Lightstage data have found various applications, including performance capture [10], face analysis by synthesis [11], and facial image relighting [12]. Our study leverages lightstage data, which provide comprehensive facial surface information through normal maps, to enhance the inpainting process. These normal maps represent surface normals as RGB values, offering a detailed depiction of facial topography critical for accurate and realistic inpainting.
The inpainting algorithm is inspired by the context encoder model proposed by Pathak et al. [13], which utilizes deep CNNs and generative adversarial networks (GANs) [14] to learn the reconstruction of missing image regions in an unsupervised manner. However, unlike the original context encoder model, our approach employs a U-Net architecture for the generator network, drawing upon the design proposed by Ronneberger et al. [15]. This U-Net structure is instrumental in effectively capturing and reconstructing the contextual information present in the surrounding regions of the image. Additionally, our model incorporates elements of the deep convolutional generative adversarial network (DCGAN) architecture proposed by Radford et al. [16], particularly in the design of the entire GAN model, including both the generator and discriminator. A significant aspect of our method is the simultaneous alternate training of the generator and discriminator, optimizing their performance in the image inpainting task. The inpainting model uses contextual information present in the surrounding regions to generate a plausible reconstruction of the missing regions and is trained using a joint loss function that combines a reconstruction loss and an adversarial loss.
In this study, the goal is to adapt the existing inpainting system to work with lightstage data, in particular normal maps, directly. This poses a number of challenges, including the lack of large-sized datasets needed for training deep learning (hence requiring extensive augmentation); the need to account for the particular form of the data when applying data augmentations such as flipping and rotation; and the adaptation of the loss functions to properly account for the nature of the data.
This paper presents our model design, experimental results, and the conclusions drawn from these results, offering valuable insights for subsequent work in the field of deep learning-based image inpainting of normal maps. It is an extension of our conference paper [17], in which we presented inpainting for lightstage-derived normal maps using a GAN incorporating a ‘bow-tie’ encoder–decoder network as the generator. Here we replace the ‘bow-tie’ network with a U-Net generator and present additional results comparing the previous and new architecture, with significant improvements. In addition, we present additional results and evaluation of the network, and we have improved the accompanying code base, which is available from https://github.com/HanchengZuo/Inpainting-NormalMaps (accessed on 10 January 2024).
2. Data Preparation
Our work uses the SFSNet dataset [18] of only 300 training and 105 testing normal map images. This is a synthetic dataset generated from rendered 3D facial models. Such a small training set is insufficient for effectively training a deep CNN, so data augmentation is required. Flipping, rotating, and zooming images are commonly used approaches to data augmentation, but care needs to be taken when dealing with normal map data.
When flipping or rotating a standard RGB image, the colors sampled from the input image location are written to the output location unchanged. With normal maps, the sampled normal vector additionally needs to be flipped or rotated to match the global image transformation. To achieve this, we apply an additional matrix transform to the sampled normals.
For the particular dataset used, we also apply some additional operations so that the resulting images more closely resemble the unaugmented images. The background values in the training set are allocated the RGB values (0,0,0), which become when converted to a normal vector. When the normal map is flipped or rotated, this vector is converted to a different direction. We move these background vectors back to by identifying them using the (flipped/rotated/zoomed) mask to identify the background locations. Points around the edge of the face model often show artifacts where the uncorrected background is still showing, so we additionally erode the mask slightly to remove such artifacts. Examples of original and augmented images are shown in Figure 1.
Considering the need for a fair evaluation across all comparative experiments, we meticulously prepared the dataset in advance. For the specific dataset used, we merged the original training and testing images, resulting in a total of 405 images. These images were then augmented by (a) flipping all images, and (b) randomly rotating by and zooming randomly by , which increased the total number of training normal map images to 1620. Given that the original dataset had distinct distribution characteristics, capturing various individuals from different angles, we opted for stratified sampling over random sampling. This approach was employed to select images for the training, validation, and testing datasets, thereby ensuring a diverse representation in each dataset category. Subsequently, we divided these images into training, validation, and testing datasets in an 8:1:1 ratio, resulting in our training dataset having 1296 images and both the validation and testing datasets having 162 images each.
In order to train the system, areas were masked using randomly generated irregular mask channels. The functions for generating mask channels were devised to accept parameters for the number of masks and mask dimensions. We trained three systems using different masking styles: (a) random lines of varying thickness and directions, (b) randomly scattered small circles, and (c) a randomly located single large circular area. For the line masks, a ‘size’ variable was randomly generated that dictated the maximum line thickness in the mask and used the cv2.line method from the OpenCV library to draw random lines, with intensity values representing occluded regions. A similar approach was used for generating the scattered-circle and single-circle masks. The generated mask channels were normalized to maintain consistency with the preprocessed training data, aiding in simulating real-world occlusions.
A function performed element-wise multiplication of raw images and mask channels to create masked images with pixel values close to 0 in the masked areas and original pixel values in the unmasked areas. The generated masks were applied to the original images using this function to remove the masked areas, and then the masked images were concatenated with the corresponding mask channels. This provided the necessary input data for training the generator to discern missing image areas that required filling. These masked image data served as a learning base for the inpainting GAN model, enabling its ability to handle complex inpainting scenarios.
3. Model Design
3.1. Model Architecture Selection
In the context of image inpainting tasks, the generative adversarial network (GAN) model, especially the deep convolutional generative adversarial network (DCGAN) variant, offers a powerful and flexible architecture [16]. Alternative architectures like CycleGAN were considered, but they were designed for the unpaired image translation problem, whereas we are able to provide paired synthetic training data for our problem. They were also found to pose unique challenges in the context of inpainting tasks, such as the difficulty in maintaining spatial consistency and color coherence due to the absence of paired training data [19]. Additionally, CycleGAN often requires more computational resources and training time, which may not be feasible in many real-world applications [19]. Therefore, due to these complexities and in view of its superior performance in handling image inpainting, the DCGAN architecture was selected.
3.2. Model Architecture Overview
The GAN architecture, as shown in Figure 2, consists of a generator, which is intended to take as input corrupted images and produce uncorrupted images as output, and a discriminator, which is trained to differentiate between real and fake images [14]. For inpainting tasks, the generator takes masked images and mask channels as inputs and produces inpainted images. These generated images are then evaluated by the discriminator. The adversarial dynamics between the generator and discriminator facilitates the learning of complex, high-dimensional distributions for generating realistic images.
3.3. Implementation of Skip Connections in U-Net Architecture
The U-Net architecture, chosen for the generator model in our GAN, is particularly suited for our image inpainting tasks, primarily due to its exceptional capability in capturing and reconstructing complex contextual information. Drawing inspiration from the method used in ‘Inpainting of Irregular Holes in a Manuscript using UNet and Partial Convolution’ [20], the U-Net structure with skip connections enables effective handling of the intricate details in normal maps, which is a key aspect of our project. These skip connections are vital for the U-Net framework, allowing direct transfer of information from early layers to deeper layers in the network. During encoding, various feature maps are retained and later integrated during the decoding process, enabling the model to preserve and utilize fine details lost during downsampling. This mechanism is particularly beneficial for our task, as the accurate restoration of facial features from lightstage data relies heavily on the preservation of minute details and textures. The U-Net’s proficiency in detail preservation and contextual information reconstruction, as demonstrated in the referenced study [20], makes it an ideal choice for our deep learning-based inpainting approach, ensuring high-quality reconstructions of complex normal map data.
3.4. Activation Functions and Normalization Techniques
For the generator model optimized for normal map inpainting, the Leaky ReLU (rectified linear unit) activation function is utilized within its convolutional layers. Leaky ReLU, which allows a small gradient even for negative input values, aids in effective backpropagation, mitigating the ‘dying ReLU’ problem and improving model learning efficiency [21].
After the first convolutional layer, batch normalization is applied to stabilize the training process, accelerate learning, and enhance the model generalization ability. By normalizing the activations of the layer, batch normalization minimizes internal covariate shift, an issue where the distribution of layer inputs changes during training, potentially slowing down learning and leading to unstable training dynamics [22].
To ensure that the generated output represents a normal map, we use a custom layer, the UnitNormalize layer. This layer normalizes the output vectors of the generator to have unit length with respect to the L2 norm. Notably, the normalization operates across the channels of the tensor, preserving the relative contribution of each channel within each pixel. While the TensorFlow library does include its own Keras UnitNormalization layer, we prefer to use a custom layer to give greater control over aspects such as the treatment of very short/zero-length vectors by including a small constant for numerical stability and to prevent division by zero.
3.5. Optimization Techniques
The model utilizes the Adam (adaptive moment estimation) optimization algorithm, offering benefits like bias correction and adaptive learning rates [23]. Implemented via the Keras API of TensorFlow with a learning rate of , it mitigates issues like oscillations and overshooting during the optimization process.
3.6. Loss Function
The loss function for the generator consists of two main components: the reconstruction loss and the adversarial loss [24]. The reconstruction loss measures the difference between the target images and the generated images, and the adversarial loss quantifies the ability of the generator to deceive the discriminator. For reconstruction loss, we employ the cosine similarity measure, which is more appropriate than the mean squared error (MSE) in the context of normal vectors. While RGB values in traditional images lie in a Euclidean space, making MSE a suitable error measure, normal vectors reside on the unit sphere. Therefore, an error metric related to the angle between the vectors is more apt. The cosine similarity provides this metric, effectively measuring the angular difference between the generated and ground-truth normal vectors.
The reconstruction loss is calculated using the cosine similarity between the target images and the generated images. Instead of minimizing the mean squared error, this loss function aims to maximize the sum of scalar products between the generated and ground-truth normal vectors across pixels. In the context of image inpainting, the cosine similarity evaluates the cosine of the angle between the pixel values of the target and generated images, and it can be formulated as
where is the pixel value of the target image, is the pixel value of the generated image, and n is the total number of pixels in the image. Minimizing the above expression will maximize the scalar products.
On the other hand, the adversarial loss is determined using cross-entropy, a widely used loss function for classification tasks [24]. In the adversarial context, this cross-entropy measures the ability of the generator to produce images that the discriminator classifies as real, and it can be formulated as
where is the true label of the image, and is the label predicted by the discriminator.
The total generator loss combines the reconstruction loss and the adversarial loss, with and serving as control weights for each component:
The choice of the lambda parameters and , which determine the balance between the importance of each loss component, was based on a brief experimentation with some combinations of integer and noninteger values that were multiples of 10. We found that combinations of integer weights yielded smoother performance and led to integer values when combined. The final settings emphasize the importance of reconstruction loss, with set to 100.0 and to 1.0. This specific configuration assists in monitoring changes in loss size during training, facilitating easier analysis without affecting the desired balance between the reconstruction and adversarial loss components; while these values proved effective in our study, a more detailed evaluation might optimize them further.
The generator seeks to minimize this total loss, leading to the generation of images that are visually similar to the target images and able to deceive the discriminator. By optimizing this composite loss function, the generator can produce high-quality inpainted images that are convincing to both the human eye and the discriminator, making it an effective solution for various inpainting tasks and input sizes.
3.7. Training and Evaluation
The training process of the generative adversarial network (GAN) model involves updating the generator and the discriminator in tandem to refine the performance of both components. Unique to our approach is the method of passing a list of batches for each training iteration rather than training with a single, larger batch size. This technique differs from simply increasing the batch size as it allows for the accumulation of gradients across multiple smaller batches within a list before updating both the generator and discriminator simultaneously. This method, by iterating over the entire list of batches before each update, provides the benefits of larger batch training, such as more stable gradient estimates and smoother training updates, without the high memory requirements of a single large batch.
During each training iteration, the generator receives a batch of masked images and corresponding mask channels with the goal to generate realistic image content in the masked regions. Subsequently, the discriminator is presented with both the real training images and the images generated by the generator for differentiation. This alternating training procedure ensures continuous improvement in the ability of the generator to create plausible images and the proficiency of the discriminator in differentiating real images from those generated.
The training process is iterated for a number of epochs, during which the performance of the model is continuously monitored on the validation dataset. The model is saved only when there is a decrease in the validation dataset loss, ensuring that the saved model represents the best performance on the validation dataset. This strategy incorporates early stopping based on the loss observed on the validation dataset. During each epoch, the performance of the model is evaluated using key metrics such as the losses of the generator and discriminator, structural similarity index measure (SSIM), peak signal-to-noise ratio (PSNR), and the accuracy of the discriminator. If the loss on the validation dataset does not improve for a specified number of epochs, the training is halted to prevent overfitting. To safeguard against infinite training loops, a maximum epoch limit is set. Additionally, regular visual assessments are conducted to provide qualitative insights into the learning progress and the overall performance of the model. After the training is complete, the saved model is evaluated on the test dataset, which has been completely untouched and reserved exclusively for this final assessment, to comprehensively evaluate its performance. This ensures that the effectiveness of the model is measured against entirely new and unseen data, providing a true test of its generalization capabilities.
In summary, the design of the model, including the chosen architecture, activation functions, normalization techniques, and optimization algorithm, contributes collectively to its performance. The iterative and alternating training strategy, enhanced with continuous monitoring of validation dataset loss and model saving based on performance improvement, ensures continual refinement of the performance of the model. The final evaluation on the test dataset allows for a comprehensive assessment of the model’s suitability for image inpainting tasks.
4. Evaluation and Results
Comparative evaluations are crucial for understanding the performance of generative models in a variety of scenarios. These evaluations are instrumental in highlighting the strengths and weaknesses of the models, as well as identifying potential avenues for improvement. This study conducts a comprehensive comparative analysis of generative models under five distinct types of masks: irregular lines mask, single large blob mask, scattered smaller blobs mask, rotating large stripe mask, and edge crescent mask. The addition of the rotating large stripe and edge crescent masks is particularly relevant to actual real-life cases of missing or damaged regions of a face image. This analysis contrasts traditional bow-tie-like architectures with U-Net architectures featuring skip connections and scrutinizes these models under the specific mask conditions. This research further explores different training methodologies for generative adversarial networks (GANs), including standalone generator training, synchronous updates of both generator and discriminator, and a cyclic approach of training the generator to convergence followed by the discriminator. Moreover, the impact of varying weight ratios between reconstruction loss and adversarial loss in the generator’s loss function on the training process is examined. The analysis concludes with a focus on the influence of mask presence in the model input, particularly emphasizing the irregular lines mask.
Principal metrics for assessing performance include the cosine similarity loss [25], the structural similarity index (SSIM) [26], the peak signal-to-noise ratio (PSNR) [27], and the accuracy of the discriminator, along with the evaluations of training time and testing time. All comparative analyses maintain consistency in other parameters. The cosine similarity loss, configured with ‘axis = 3’, facilitates the capability of the model to compare the direction of normal vectors at the pixel level. This metric yields values between −1 and 1, where values closer to −1 denote greater similarity and those approaching 1 indicate greater dissimilarity. Such a comprehensive evaluation significantly advances the understanding of generative models, providing valuable insights for researchers aiming to enhance these models for various applications. This study delves into the broader impacts of architectural choices, training methodologies, and loss function configurations in the generative process, while also exploring how the inclusion of masks influences the inpainting process. This holistic approach allows for a deeper understanding of how generative models can be fine-tuned not just for specific mask types but also in response to a range of design and training considerations, highlighting the multifaceted nature of model optimization and application.
4.1. Comparative Evaluation of U-Net and Bow-Tie-like Architectures
In this experiment, we compare the performance of two generator architectures: the bow-tie generator, as shown in Figure 3, and the U-Net structured generator, depicted in Figure 2, which incorporates additional skip connections between matching input and output layers. The comparative results for the five mask types, including metrics such as loss, SSIM, PSNR, and discriminator accuracy, are presented in Table 1, while Table 2 showcases the evaluation of training and testing times. The training performance of these two architectures across different masks is demonstrated in Figure 4 and Figure 5, highlighting the superior performance of the U-Net architecture, while Figure 6 provides an example of the generator training and SSIM variations over the training process for an irregular lines mask on both the U-Net and bow-tie-like models, evaluated on a validation dataset.
Qualitatively, Figure 4 and Figure 5 support these findings. The U-Net’s reconstructions show a higher fidelity in preserving facial features and contours, even in areas that were obscured by various mask types. The bow-tie-like model, while capable of generating coherent images, exhibits less precision in restoring intricate details, particularly under the challenging conditions imposed by masks such as scattered smaller blobs, a single large blob, and those simulating real-life cases.
The performance plots in Figure 6 illustrate a significant difference in the convergence rate between the two architectures. The U-Net model demonstrates a much faster convergence compared to the bow-tie-like model, with the loss decreasing more rapidly and substantially. This suggests that the U-Net’s architecture is more efficient at learning the inpainting task, potentially due to the beneficial effects of skip connections that facilitate the flow of gradient and information throughout the network during training.
Conversely, while the bow-tie-like model consistently achieves a discriminator accuracy of 50% for all mask types as presented in Table 1, this uniformity in performance may not necessarily indicate a robust generative capability. Such consistent accuracy could suggest overfitting or a lack of complex challenges from the discriminator, which might not be adequately testing the generative capabilities of the model. In comparison, the U-Net model demonstrates much lower discriminator accuracies (37.50% for irregular lines, 7.10% for scattered smaller blobs, and 1.99% for a single large blob), suggesting a more balanced and potentially healthier adversarial training environment. This stark contrast between the two models’ discriminator accuracies underscores the importance of considering multiple performance metrics, rather than relying solely on discriminator accuracy, to assess generative model effectiveness.
Table 2 presents a comparison of the U-Net and bow-tie-like models’ efficiency, measured in training and testing times across different mask types. The U-Net model generally requires more training time, indicative of its intricate architecture that can handle complex inpainting tasks. Despite this, the testing times remain within a practical range, suggesting its suitability for real-time applications. In particular, the rotating large stripe and edge crescent masks show that while the U-Net’s training is longer, the bow-tie-like model’s training time is not significantly lower, and its quick testing phase could be advantageous for rapid deployment.
In summary, the U-Net’s structured generator demonstrates superior performance in handling complex mask patterns, delivering better image quality and more stable learning dynamics. The bow-tie-like generator, while effective, may benefit from further tuning to prevent overfitting and to improve the diversity of its outputs. The consistency of the U-Net’s performance across various mask types and metrics underscores its versatility and effectiveness in the domain of image inpainting.
4.2. Comparative Analysis of Different Training Configurations
In this experiment, we evaluate the effectiveness of three different training methodologies for U-Net structured networks in the context of image inpainting tasks using irregular lines masks. The three methods are ‘Generator-Only’, where only the generator is trained without the adversarial loss from a discriminator; ‘Simultaneous Generator and Discriminator’, which involves training both components together with a reconstruction to an adversarial loss ratio of 100:1; and ‘Cyclic Generator–Discriminator Training’, maintaining the same loss ratio as the simultaneous approach. For a fair comparison, each model is assessed using the same dataset and mask inputs, ensuring consistent conditions for all performance metrics. The results, detailing the averaged outcomes across key indicators for these approaches, are presented in Table 3, with additional insights into the computational demands of each method outlined in Table 4. Furthermore, Figure 7 visually demonstrates the example results from each training configuration, providing insights into the effectiveness of each method.
The ‘Generator-Only’ method presents an interesting case where the absence of adversarial loss does not significantly hinder the model’s performance based on the LOSS and SSIM metrics. These metrics do not necessarily capture the full complexity of the image textures and nuances, as demonstrated by Parthak et al. [13] for the RGB image case, which adversarial training can improve. This suggests that for certain inpainting tasks, the adversarial component may not be critical for achieving acceptable results.
However, the incorporation of adversarial training in the ‘Simultaneous Generator and Discriminator’ method appears to influence the stability of the training, as shown by the variation in PSNR and a modest discriminator accuracy of 20.45%. This configuration’s plots in Figure 8 (top) reveal a rapid initial decrease in generator loss, followed by a plateau, which is concurrent with the stabilization of SSIM and PSNR values over epochs, indicating a quick convergence to a suboptimal solution that does not improve significantly with further training.
The ‘Cyclic Generator–Discriminator Training’ approach exhibits a marked improvement in discriminator accuracy to 40.34%, as seen in Table 3. Notably, as Table 4 illustrates, this method also presents a more efficient training regime, requiring less time than the simultaneous method, which suggests that pretraining the generator creates a more effective adversarial feedback loop, potentially allowing for continued refinement over epochs. Indeed, the corresponding plots (bottom in Figure 8) illustrate a resistance to declines in SSIM and PSNR during training, with a more gradual reduction in generator loss and consistent enhancement in both SSIM and PSNR metrics. Despite these quantitative gains, the qualitative evaluation indicates that the improved numbers do not necessarily translate into a substantial visual enhancement, suggesting that while discriminator accuracy is important, it may not be the sole determinant of perceived image quality in inpainting tasks.
4.3. Impact of Lambda Reconstruction and Lambda Adversarial Ratios on Generator Performance in GANs
In examining the impact of varied and ratios on the performance of generative adversarial networks (GANs), our experimental results, as depicted in Table 5 and Figure 9, present insightful observations. When was set exceedingly high at 999 with , the generator’s LOSS was marginally the lowest at −0.9968, and SSIM was at its peak of 0.1594, suggesting a more accurate structural similarity to the original images. However, this configuration only yielded a moderate discriminator accuracy of 49.72%, hinting at a potential overfitting towards reconstruction fidelity at the expense of adversarial robustness.
Conversely, a lower of 100 resulted in a decrease in SSIM to 0.1238 and a noticeable drop in discriminator accuracy to 37.50%, indicating a less convincing generation of images in fooling the discriminator. The lowest of 10, while maintaining the adversarial ratio constant, further decreased the LOSS to −0.9972 and SSIM to 0.1234, with a slightly higher discriminator accuracy of 48.86% compared to the highest setting. PSNR values across all configurations remained relatively stable with negligible variance, suggesting minimal impact on the peak signal-to-noise ratio with changes in .
Visual inspection of the generator output reveals that the quality of the reconstructed images is surprisingly consistent, as shown in Figure 9. Despite the substantial variation in the values from 999 to 10, the structural integrity and visual fidelity of the generated images remained consistently high, as evidenced by the indistinguishable results in the ‘Pred Test Img’ and ‘Pred Only Masked Reg.’ columns.
The top row, representing a of 999, demonstrates a generator that is highly focused on accurate reconstruction, as one would expect given the high emphasis on the reconstruction loss. However, the middle and bottom rows, corresponding to values of 100 and 10, respectively, do not display the anticipated degradation in visual quality. This suggests that the generator has achieved a level of robustness where it can produce high-quality reconstructions even when the adversarial loss has a more significant influence on the training process.
The lack of a discernible difference in the SSIM and PSNR metrics across the configurations further corroborates the visual results. This unexpected outcome might be indicative of a plateau in the generator’s learning capability with respect to the dataset used or could reflect a limitation in the sensitivity of SSIM and PSNR metrics to capture subtle nuances in the GAN-generated images.
The addition of training and testing times in Table 6 complements our understanding of the computational efficiency of each configuration. Although the quality of the reconstructed images does not vary significantly across different parameter ratios, the increase in training time with a higher proportion of reconstruction loss suggests that a greater emphasis on reconstruction loss may impose a more substantial burden on the training process.
4.4. Impact of Mask Presence on Model Input
The input to the network can include just the image that requires inpainting or the image combined with the known mask. Conventional wisdom suggests that adding the mask should enhance the results, as it clearly indicates the areas needing inpainting instead of being undifferentiated ‘black’ zones. Nevertheless, Table 7 reveals that integrating the mask into the network input has a negligible effect on the metrics’ outcomes. Table 8 extends this analysis to include the impact on training and testing times, indicating a modest reduction in time for models trained without the mask input.
Unexpectedly, and contrary to what one might assume, the qualitative results shown in Figure 10 indicate that the visual results are marginally better without the mask than with it. Despite the quantitative metrics (such as LOSS, SSIM, and PSNR) showing similar performances for both scenarios, the qualitative results depicted in Figure 10 do not align with the assumption that the mask’s inclusion significantly enhances visual outcomes. It appears that while the mask provides explicit boundaries for inpainting, it does not necessarily translate to a visually superior reconstruction in this instance.
This finding may imply that the effectiveness of the mask in inpainting tasks is not as pivotal as previously thought or that the current network architecture is not fully utilizing the additional information provided by the mask. The training and testing times further suggest that the presence of a mask does not significantly affect the efficiency of the model during testing, although there is a slight difference in training duration. Future studies should delve further into the utilization of masks, examining how different mask types and complexities affect model performance. Moreover, it might be advantageous to consider adaptive strategies for mask usage during the training phase to refine the model’s learning process and improve generalization.
5. Conclusions
This study’s comprehensive evaluation of a GAN-based inpainting model across varied masks—irregular lines, single large blob, and scattered smaller blobs—reveals its strengths and areas for improvement. The visual assessments show that minor modifications, like the integration of a mask channel and expanded layer structure, significantly enhance the quality of inpainted images. Comparative evaluations highlight the U-Net generator’s superior performance over the bow-tie-like model, especially in complex mask scenarios, evident in both qualitative and quantitative measures. Explorations into different training configurations underscore the importance of a balanced approach for optimal results. Surprisingly, the inclusion of the mask in the model input did not markedly enhance outcomes, pointing to future research directions. Overall, this study demonstrates the effectiveness of the GAN-based inpainting model in various scenarios and opens new possibilities for advancements in image inpainting.
6. Future Work
This research explored promising directions in image inpainting, but there is still room for further improvement and expansion.
A further research direction could involve a deeper investigation into the integrability of the predicted normal maps. Evaluating whether there could be a surface whose normals are consistent with the given normal map could serve as an additional validation of the generated maps. The method outlined in ‘Normal Integration via Inverse Plane Fitting With Minimum Point-to-Plane Distance’ CVPR 2021 [28] offers one potential approach to this investigation.
Moreover, evaluating the human-like appearance of the predicted normal maps could provide another meaningful evaluation metric. This could include assessing elements such as the reconstruction of nostrils and the continuity of lips. The use of the normal map for relighting scenarios and the subsequent evaluation of its performance in these settings would provide a practical measure of the quality of the map.
Finally, the inclusion of more diverse and potentially more perceptually oriented metrics could improve the evaluation of the quality of the results, expanding beyond the current evaluation metrics utilized in this study.
By pursuing these lines of inquiry, we can continue to refine and advance the capabilities of image inpainting technology.
Author Contributions
Conceptualization, B.T.; methodology, H.Z. and B.T.; software, H.Z. and B.T.; validation, H.Z. and B.T.; formal analysis, H.Z.; investigation, H.Z.; resources, H.Z. and B.T.; data curation, H.Z. and B.T.; writing—original draft preparation, H.Z.; writing—review and editing, H.Z. and B.T.; visualization, H.Z.; supervision, B.T.; project administration, B.T.; funding acquisition, N/A. All authors have read and agreed to the published version of the manuscript.
Funding
This research received no external funding.
Institutional Review Board Statement
The work reported here was given Aberystwyth University Ethics Approval, Ethics ID #28326.
Data Availability Statement
The datasets generated and/or analyzed during the current study, as well as the code base, are available in the GitHub repository at https://github.com/HanchengZuo/Inpainting-NormalMaps.
Acknowledgments
Chat GPT-4 was used to translate as well as logically polish portions of the English writing. All such content was checked for accuracy, to ensure that it correctly reflects the experimental work that was completed.
Conflicts of Interest
The authors declare no conflicts of interest.
References
- Bertalmio, M.; Sapiro, G.; Caselles, V.; Ballester, C. Image Inpainting. In Proceedings of the 27th Annual Conference on Computer Graphics and Interactive Techniques (SIGGRAPH ’00), New Orleans, LA, USA, 23–28 July 2000; pp. 417–424. [Google Scholar] [CrossRef]
- Criminisi, A.; Perez, P.; Toyama, K. Region filling and object removal by exemplar-based image inpainting. IEEE Trans. Image Process. 2004, 13, 1200–1212. [Google Scholar] [CrossRef] [PubMed]
- Mainberger, M.; Bruhn, A.; Weickert, J.; Forchhammer, S. Edge-based compression of cartoon-like images with homogeneous diffusion. Pattern Recognit. 2011, 44, 1859–1873. [Google Scholar] [CrossRef]
- Liu, X.; Xing, F.; Yang, C.; Kuo, C.C.J.; ElFakhri, G.; Woo, J. Symmetric-Constrained Irregular Structure Inpainting for Brain MRI Registration with Tumor Pathology. In Proceedings of the 6th International Workshop on Glioma, Multiple Sclerosis, Stroke and Traumatic Brain Injuries (Brainlesion), Lima, Peru, 4–5 October 2021; Volume 12658, pp. 80–91. [Google Scholar]
- Wexler, Y.; Shechtman, E.; Irani, M. Space-Time Completion of Video. IEEE Trans. Pattern Anal. Mach. Intell. 2007, 29, 463–476. [Google Scholar] [CrossRef] [PubMed]
- Telea, A. An Image Inpainting Technique Based on the Fast Marching Method. J. Graph. Tools 2004, 9, 23–34. [Google Scholar] [CrossRef]
- Liu, G.; Reda, F.A.; Shih, K.J.; Wang, T.C.; Tao, A.; Catanzaro, B. Image Inpainting for Irregular Holes Using Partial Convolutions. In Proceedings of the European Conference on Computer Vision (ECCV), Munich, Germany, 8–14 September 2018; pp. 85–100. [Google Scholar]
- Ma, W.C.; Hawkins, T.; Peers, P.; Chabert, C.F.; Weiss, M.; Debevec, P.E. Rapid Acquisition of Specular and Diffuse Normal Maps from Polarized Spherical Gradient Illumination. Render. Tech. 2007, 2007, 10. [Google Scholar]
- Ghosh, A.; Fyffe, G.; Tunwattanapong, B.; Busch, J.; Yu, X.; Debevec, P. Multiview face capture using polarized spherical gradient illumination. ACM Trans. Graph. (TOG) 2011, 30, 1–10. [Google Scholar] [CrossRef]
- Wilson, C.A.; Ghosh, A.; Peers, P.; Chiang, J.Y.; Busch, J.; Debevec, P. Temporal upsampling of performance geometry using photometric alignment. ACM Trans. Graph. (TOG) 2010, 29, 1–11. [Google Scholar] [CrossRef]
- Smith, W.A.; Seck, A.; Dee, H.; Tiddeman, B.; Tenenbaum, J.B.; Egger, B. A morphable face albedo model. In Proceedings of the IEEE/CVF Conference on Computer Vision and Pattern Recognition, Seattle, WA, USA, 14–19 June 2020; pp. 5011–5020. [Google Scholar]
- LeGendre, C.; Ma, W.C.; Pandey, R.; Fanello, S.; Rhemann, C.; Dourgarian, J.; Busch, J.; Debevec, P. Learning Illumination from Diverse Portraits. In Proceedings of the SIGGRAPH Asia 2020 Technical Communications (SA ’20), New York, NY, USA, 4–13 December 2020. [Google Scholar] [CrossRef]
- Pathak, D.; Krähenbühl, P.; Donahue, J.; Darrell, T.; Efros, A.A. Context Encoders: Feature Learning by Inpainting. arXiv 2016, arXiv:1604.07379. [Google Scholar]
- Goodfellow, I.; Pouget-Abadie, J.; Mirza, M.; Xu, B.; Warde-Farley, D.; Ozair, S.; Courville, A.; Bengio, Y. Generative Adversarial Nets. In Proceedings of the Advances in Neural Information Processing Systems, Montreal, QC, Canada, 8–13 December 2014; Ghahramani, Z., Welling, M., Cortes, C., Lawrence, N., Weinberger, K., Eds.; Curran Associates Inc.: New York, NY, USA, 2014; Volume 27, pp. 2672–2680. [Google Scholar]
- Ronneberger, O.; Fischer, P.; Brox, T. U-Net: Convolutional Networks for Biomedical Image Segmentation. arXiv 2015, arXiv:1505.04597. [Google Scholar]
- Radford, A.; Metz, L.; Chintala, S. Unsupervised Representation Learning with Deep Convolutional Generative Adversarial Networks. In Proceedings of the 4th International Conference on Learning Representations (ICLR 2016), San Juan, Puerto Rico, 2–4 May 2016. [Google Scholar]
- Zuo, H.; Tiddeman, B. Inpainting Normal Maps for Lightstage data. In Proceedings of the Computer Graphics and Visual Computing (CGVC), Aberystwyth, UK, 14–15 September 2023; Vangorp, P., Hunter, D., Eds.; The Eurographics Association: Eindhoven, The Netherlands, 2023. [Google Scholar] [CrossRef]
- Sengupta, S.; Kanazawa, A.; Castillo, C.D.; Jacobs, D.W. Sfsnet: Learning shape, reflectance and illuminance of facesin the wild’. In Proceedings of the IEEE Conference on Computer Vision and Pattern Recognition, Salt Lake City, UT, USA, 18–22 June 2018; pp. 6296–6305. [Google Scholar]
- Zhu, J.; Park, T.; Isola, P.; Efros, A.A. Unpaired Image-to-Image Translation using Cycle-Consistent Adversarial Networks. arXiv 2017, arXiv:1703.10593. [Google Scholar]
- Kaur, A.; Raj, A.; Jayanthi, N.; Indu, S. Inpainting of Irregular Holes in a Manuscript using UNet and Partial Convolution. In Proceedings of the 2020 Second International Conference on Inventive Research in Computing Applications (ICIRCA), Coimbatore, India, 15–17 July 2020; pp. 778–784. [Google Scholar] [CrossRef]
- Maas, A.L.; Hannun, A.Y.; Ng, A.Y. Rectifier nonlinearities improve neural network acoustic models. In Proceedings of the 30th International Conference on Machine Learning, Atlanta, GA, USA, 16–21 June 2013; Volume 30. [Google Scholar]
- Ioffe, S.; Szegedy, C. Batch Normalization: Accelerating Deep Network Training by Reducing Internal Covariate Shift. arXiv 2015, arXiv:1502.03167. [Google Scholar]
- Kingma, D.P.; Ba, J. Adam: A Method for Stochastic Optimization. In Proceedings of the 3rd International Conference on Learning Representations (ICLR 2015), San Diego, CA, USA, 7–9 May 2015. [Google Scholar]
- Goodfellow, I.; Bengio, Y.; Courville, A. Deep Learning; MIT Press: Cambridge, MA, USA, 2016; Available online: http://www.deeplearningbook.org (accessed on 10 January 2024).
- tf.keras.losses.CosineSimilarity. 2024. Available online: https://www.tensorflow.org/api_docs/python/tf/keras/losses/CosineSimilarity (accessed on 10 January 2024).
- Wang, Z.; Bovik, A.; Sheikh, H.; Simoncelli, E. Image quality assessment: From error visibility to structural similarity. IEEE Trans. Image Process. 2004, 13, 600–612. [Google Scholar] [CrossRef]
- Huynh-Thu, Q.; Ghanbari, M. Scope of validity of PSNR in image/video quality assessment. Electron. Lett. 2008, 44, 800–801. [Google Scholar] [CrossRef]
- Cao, X.; Shi, B.; Okura, F.; Matsushita, Y. Normal Integration via Inverse Plane Fitting with Minimum Point-to-Plane Distance. In Proceedings of the IEEE/CVF Conference on Computer Vision and Pattern Recognition (CVPR), Nashville, TN, USA, 19–25 June 2021; pp. 2382–2391. [Google Scholar]
Figure 1.
Examples of augmentations, rows from left to right: original; flipped; random zoom and rotation; flipped with (different) random zoom and rotation. The colours show the red, green and blue (RGB) values stored, which are mapped on to (x,y,z) directions.
Figure 1.
Examples of augmentations, rows from left to right: original; flipped; random zoom and rotation; flipped with (different) random zoom and rotation. The colours show the red, green and blue (RGB) values stored, which are mapped on to (x,y,z) directions.

Figure 2.
A schematic of a U-Net-based generative adversarial network (GAN) with skip connections, showing the input and output image dimensions as 256 × 256 pixels and detailing the loss functions for the generator and discriminator.
Figure 2.
A schematic of a U-Net-based generative adversarial network (GAN) with skip connections, showing the input and output image dimensions as 256 × 256 pixels and detailing the loss functions for the generator and discriminator.
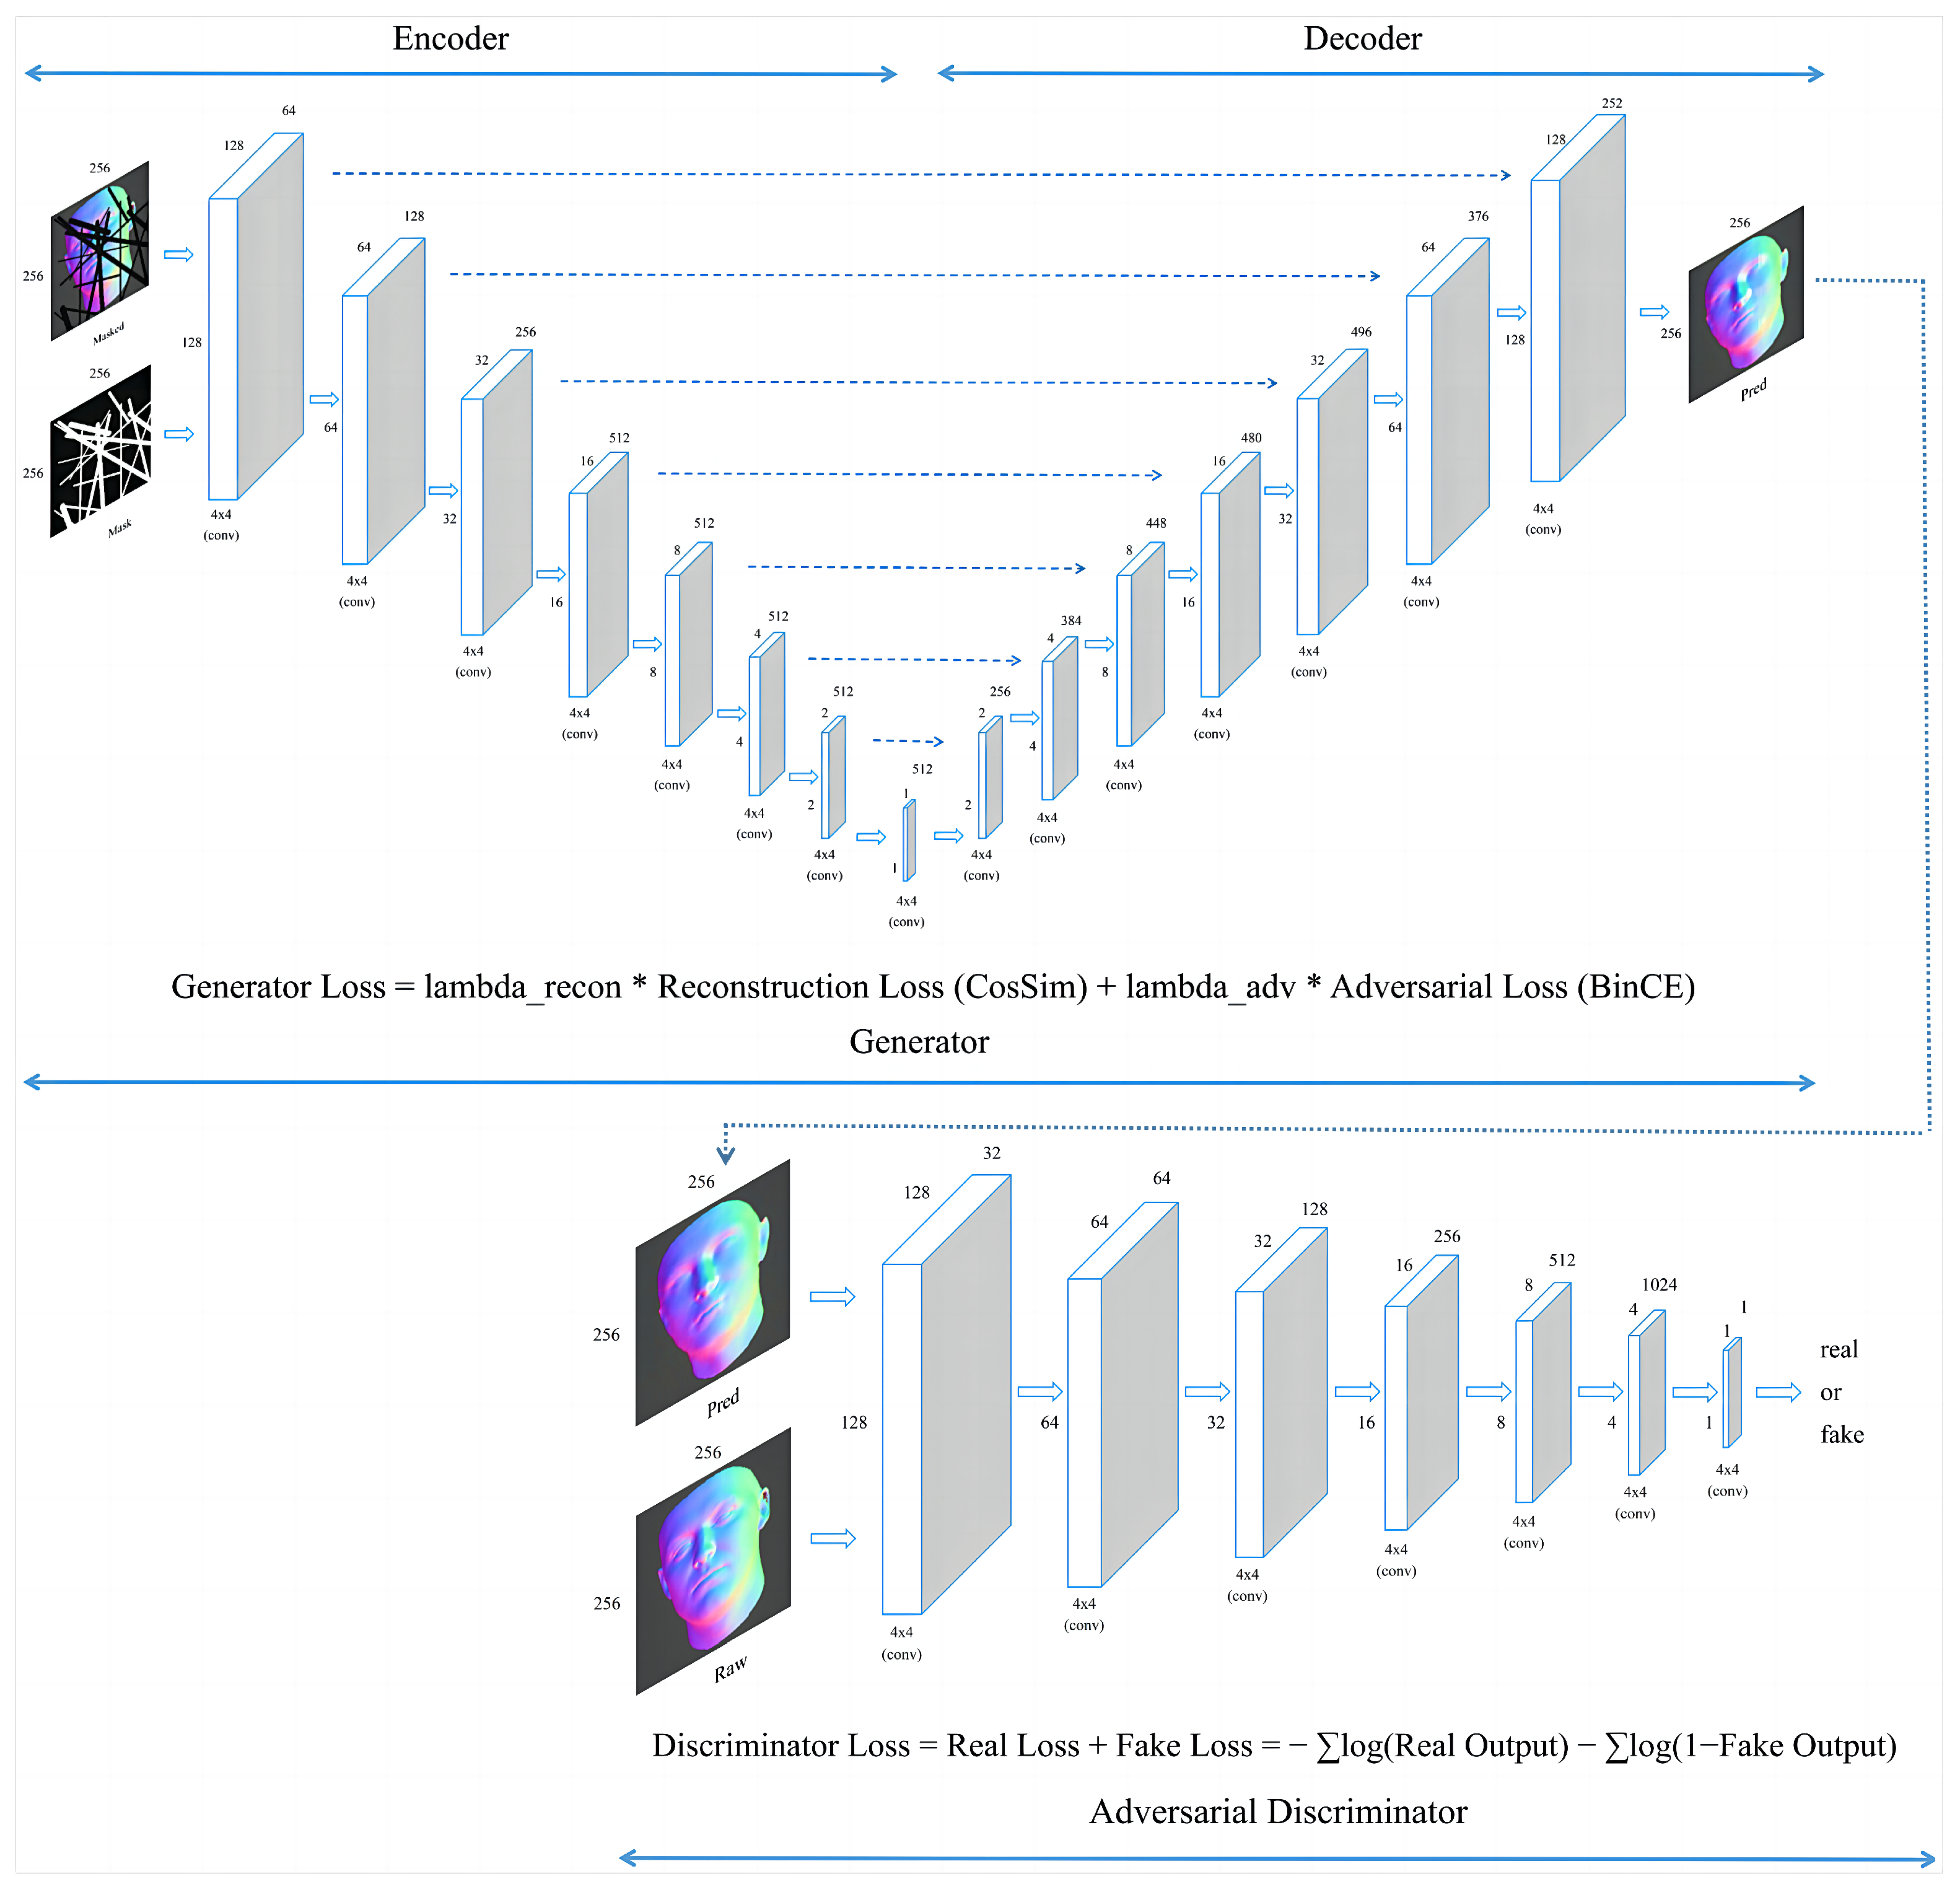
Figure 3.
A schematic of a bow-tie-like-based generative adversarial network (GAN), showing the input and output image dimensions as 256 × 256 pixels and detailing the loss functions for the generator and discriminator.
Figure 3.
A schematic of a bow-tie-like-based generative adversarial network (GAN), showing the input and output image dimensions as 256 × 256 pixels and detailing the loss functions for the generator and discriminator.

Figure 4.
Performance comparison of U-Net and bow-tie-like model structures across three mask types. Each set of two rows represents a different mask type, with U-Net results in the top row and bow-tie-like results in the bottom row of each set. From top to bottom, the first set is for the irregular lines mask, the second set is for the scattered smaller blobs mask, and the third set is for the single large blob mask. Within each row, from left to right, the images compare the raw image, masked image, predicted image, and predicted image in the masked region only.

Figure 5.
Performance comparison of U-Net and bow-tie-like model structures across two types of masks, particularly relevant to real-life cases of missing or damaged regions in face images. Each set of two rows represents a different mask type, with U-Net results in the top row and bow-tie-like results in the bottom row of each set. From top to bottom, the first set is for the rotating large stripe mask, and the second set is for the edge crescent mask. Within each row, from left to right, the images compare the raw image, masked image, predicted image, and predicted image in the masked region only.

Figure 6.
During the initial epochs of testing on the irregular lines mask, the U-Net model (left) and the bow-tie-like model (right) exhibit distinct performance characteristics. The generator loss, indicated in green, and the SSIM, represented in purple, evolve differently across the epochs for each model.

Figure 7.
Comparative performance of three training configurations of a GAN. The top row depicts results when only the generator is trained. The middle row shows outcomes for simultaneous training of both the generator and discriminator. The bottom row presents results from cyclic training, where the generator is trained to convergence first, followed by the discriminator.

Figure 8.
The figure presents three sets of training configurations for GANs: the top row for ‘Generator-only’ training, the middle for ‘Simultaneous Generator and Discriminator’, and the bottom for ‘Generator to Convergence, then Discriminator’, each displaying generator loss (in green) and image quality metrics SSIM/PSNR (in purple).
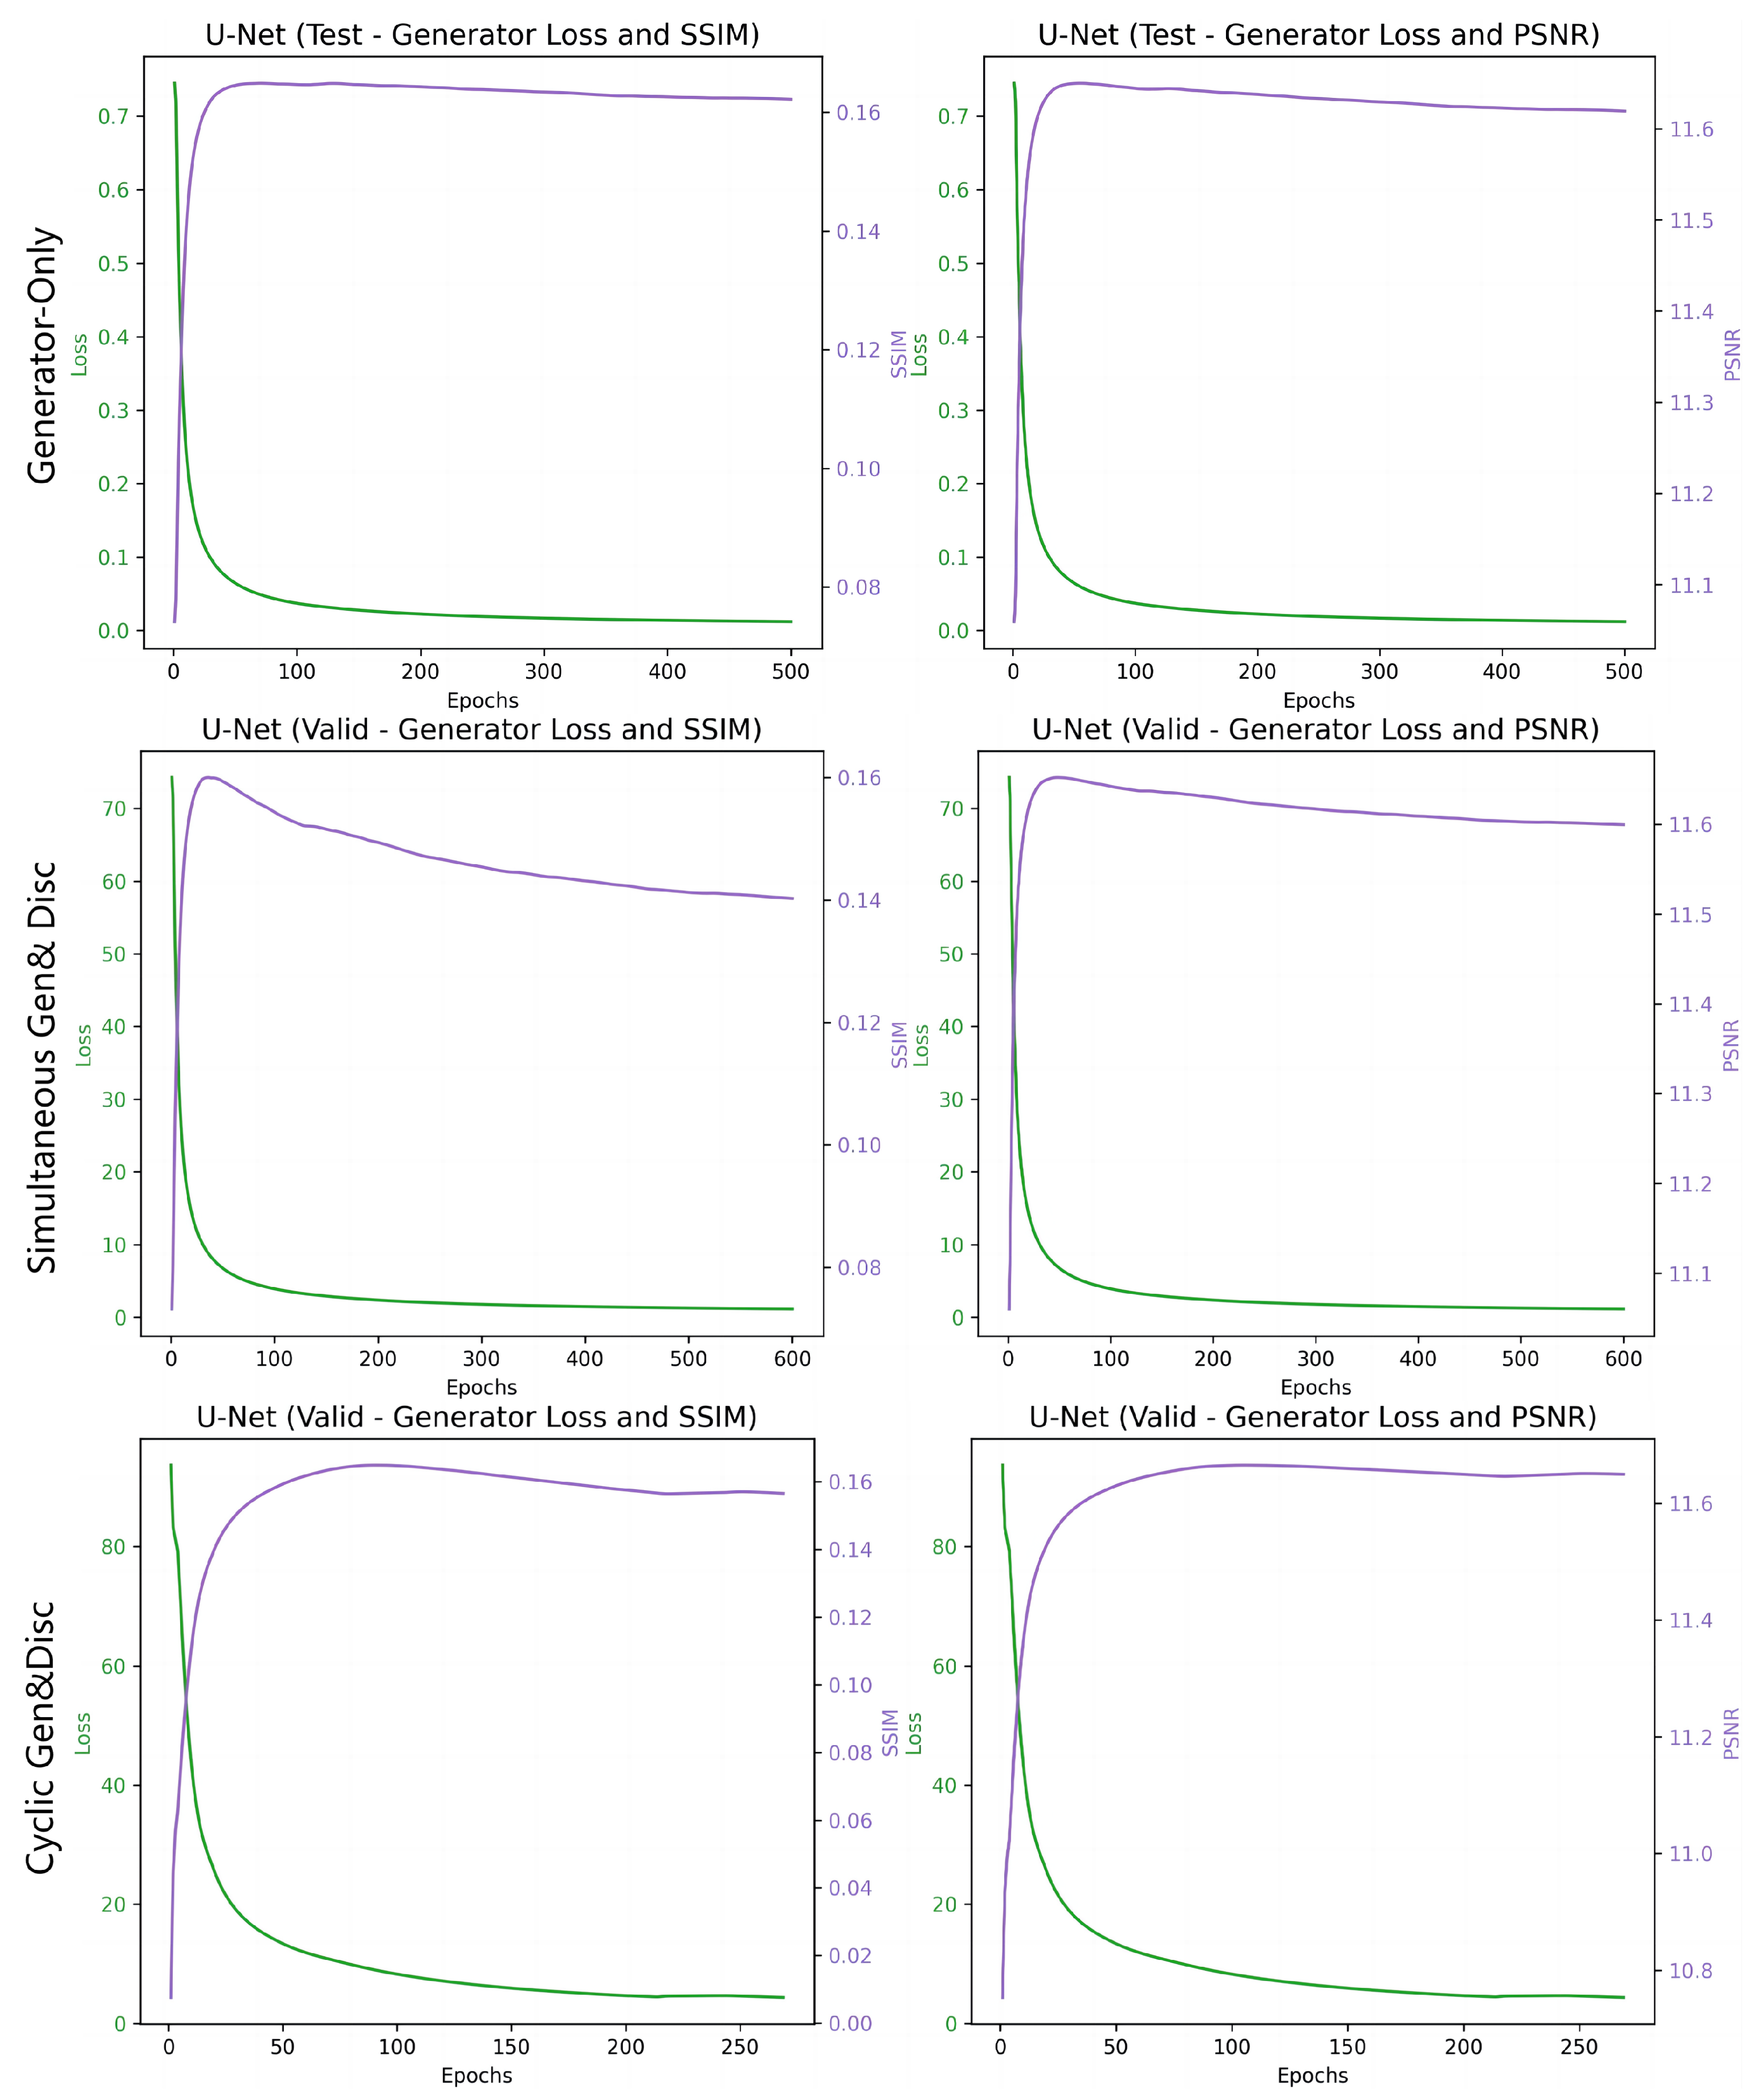
Figure 9.
Visual results of generator loss experiments with varying and ratios. The top row corresponds to , the middle row to , and the bottom row to .
Figure 9.
Visual results of generator loss experiments with varying and ratios. The top row corresponds to , the middle row to , and the bottom row to .

Figure 10.
From top to bottom, the performance is shown with and without an irregular lines mask used as input for training the generator; from left to right, images compare the raw image, masked image, predicted image, and predicted image in the masked region only.
Figure 10.
From top to bottom, the performance is shown with and without an irregular lines mask used as input for training the generator; from left to right, images compare the raw image, masked image, predicted image, and predicted image in the masked region only.


Table 1.
Comprehensive comparison of U-Net and bow-tie-like architectures across irregular lines mask, scattered smaller blobs mask, single large blob mask, rotating large stripe mask, and edge crescent mask.
Table 1.
Comprehensive comparison of U-Net and bow-tie-like architectures across irregular lines mask, scattered smaller blobs mask, single large blob mask, rotating large stripe mask, and edge crescent mask.
| Mask Type | Model | Loss | SSIM | PSNR | Disc Acc (%) |
|---|---|---|---|---|---|
| Irregular lines | U-Net | −0.9936 | 0.1250 | 11.5695 | 37.50 |
| Bow-tie-like | −0.9665 | 0.1161 | 11.5195 | 50.00 | |
| Scattered smaller blobs | U-Net | −0.9983 | 0.1301 | 11.5513 | 7.10 |
| Bow-tie-like | −0.9674 | 0.1540 | 11.6088 | 48.58 | |
| Single large blob | U-Net | −0.9986 | 0.1205 | 11.5305 | 1.99 |
| Bow-tie-like | −0.9639 | 0.1509 | 11.6056 | 50.00 | |
| Rotating large stripe | U-Net | −0.9947 | 0.1276 | 11.5494 | 49.72 |
| Bow-tie-like | −0.9657 | 0.1441 | 11.5916 | 43.47 | |
| Edge crescent | U-Net | −0.9913 | 0.1252 | 11.5450 | 48.58 |
| Bow-tie-like | −0.9604 | 0.1566 | 11.5807 | 48.58 |
Table 2.
Comparison of training and testing times for U-Net and bow-tie-like architectures across irregular lines mask, scattered smaller blobs mask, single large blob mask, rotating large stripe mask, and edge crescent mask. The models were trained on a dataset of 1296 images and tested on a dataset of 162 images, with a batch size of 16.
| Mask Type | Model | Training Time (s) | Testing Time (s) |
|---|---|---|---|
| Irregular lines | U-Net | 4895.33 | 3.48 |
| Bow-tie-like | 3488.38 | 1.46 | |
| Scattered smaller blobs | U-Net | 9729.63 | 3.51 |
| Bow-tie-like | 4530.37 | 1.50 | |
| Single large blob | U-Net | 7752.97 | 3.48 |
| Bow-tie-like | 3755.90 | 1.45 | |
| Rotating large stripe | U-Net | 11,045.99 | 4.00 |
| Bow-tie-like | 11,202.25 | 1.89 | |
| Edge crescent | U-Net | 5517.66 | 3.61 |
| Bow-tie-like | 2874.90 | 1.49 |
Table 3.
Comparative analysis of different GAN training configurations.
| Training Configuration | LOSS | SSIM | PSNR | Disc Acc (%) |
|---|---|---|---|---|
| Only generator | −0.9946 | 0.1618 | 11.6132 | - |
| Simultaneous generator and discriminator | −0.9944 | 0.1328 | 11.5730 | 20.45 |
| Generator to convergence, then discriminator | −0.9903 | 0.1435 | 11.6100 | 40.34 |
Table 4.
Evaluation of training and testing times across different GAN training configurations. The models were trained on a dataset of 1296 images and tested on a dataset of 162 images, with a batch size of 16.
Table 4.
Evaluation of training and testing times across different GAN training configurations. The models were trained on a dataset of 1296 images and tested on a dataset of 162 images, with a batch size of 16.
| Training Configuration | Training Time (s) | Testing Time (s) |
|---|---|---|
| Only generator | 3784.86 | 3.78 |
| Simultaneous generator and discriminator | 5564.94 | 3.85 |
| Generator to convergence, then discriminator | 1857.34 | 3.82 |
Table 5.
Comparative analysis of generator performance with varied and ratios.
| Configuration | LOSS | SSIM | PSNR | Disc Acc (%) |
|---|---|---|---|---|
| −0.9968 | 0.1594 | 11.5970 | 49.72 | |
| −0.9958 | 0.1238 | 11.5672 | 37.50 | |
| −0.9972 | 0.1234 | 11.5488 | 48.86 |
Table 6.
Evaluation of training and testing times for different and ratios. The models were trained on a dataset of 1296 images and tested on a dataset of 162 images, with a batch size of 16.
Table 6.
Evaluation of training and testing times for different and ratios. The models were trained on a dataset of 1296 images and tested on a dataset of 162 images, with a batch size of 16.
| Configuration | Training Time (s) | Testing Time (s) |
|---|---|---|
| 4895.12 | 3.77 | |
| 4895.33 | 3.49 | |
| 6792.58 | 3.52 |
Table 7.
Model performance with and without mask input training.
| Mask | LOSS | SSIM | PSNR | Disc Acc (%) |
|---|---|---|---|---|
| With | −0.9955 | 0.1231 | 11.5659 | 37.50 |
| Without | −0.9965 | 0.1406 | 11.5721 | 42.33 |
Table 8.
Comparison of training and testing times for models trained with and without mask input. The models were trained on a dataset of 1296 images and tested on a dataset of 162 images, with a batch size of 16.
Table 8.
Comparison of training and testing times for models trained with and without mask input. The models were trained on a dataset of 1296 images and tested on a dataset of 162 images, with a batch size of 16.
| Mask | Training Time (s) | Testing Time (s) |
|---|---|---|
| With | 4895.33 | 3.60 |
| Without | 4672.35 | 3.56 |
Disclaimer/Publisher’s Note: The statements, opinions and data contained in all publications are solely those of the individual author(s) and contributor(s) and not of MDPI and/or the editor(s). MDPI and/or the editor(s) disclaim responsibility for any injury to people or property resulting from any ideas, methods, instructions or products referred to in the content. |
© 2024 by the authors. Licensee MDPI, Basel, Switzerland. This article is an open access article distributed under the terms and conditions of the Creative Commons Attribution (CC BY) license (https://creativecommons.org/licenses/by/4.0/).
Share and Cite
MDPI and ACS Style
Zuo, H.; Tiddeman, B. A U-Net Architecture for Inpainting Lightstage Normal Maps. Computers 2024, 13, 56. https://doi.org/10.3390/computers13020056
AMA Style
Zuo H, Tiddeman B. A U-Net Architecture for Inpainting Lightstage Normal Maps. Computers. 2024; 13(2):56. https://doi.org/10.3390/computers13020056
Chicago/Turabian StyleZuo, Hancheng, and Bernard Tiddeman. 2024. "A U-Net Architecture for Inpainting Lightstage Normal Maps" Computers 13, no. 2: 56. https://doi.org/10.3390/computers13020056
Note that from the first issue of 2016, this journal uses article numbers instead of page numbers. See further details here.