
Supervised Machine Learning Models for Liver Disease Risk Prediction

Department of Computer Engineering and Informatics, University of Patras, 26504 Patras, Greece
*
Author to whom correspondence should be addressed.
Computers 2023, 12(1), 19; https://doi.org/10.3390/computers12010019
Submission received: 16 November 2022
/
Revised: 3 January 2023
/
Accepted: 12 January 2023
/
Published: 13 January 2023
(This article belongs to the Special Issue Machine and Deep Learning in the Health Domain)
Abstract
:The liver constitutes the largest gland in the human body and performs many different functions. It processes what a person eats and drinks and converts food into nutrients that need to be absorbed by the body. In addition, it filters out harmful substances from the blood and helps tackle infections. Exposure to viruses or dangerous chemicals can damage the liver. When this organ is damaged, liver disease can develop. Liver disease refers to any condition that causes damage to the liver and may affect its function. It is a serious condition that threatens human life and requires urgent medical attention. Early prediction of the disease using machine learning (ML) techniques will be the point of interest in this study. Specifically, in the content of this research work, various ML models and Ensemble methods were evaluated and compared in terms of Accuracy, Precision, Recall, F-measure and area under the curve (AUC) in order to predict liver disease occurrence. The experimental results showed that the Voting classifier outperforms the other models with an accuracy, recall, and F-measure of 80.1%, a precision of 80.4%, and an AUC equal to 88.4% after SMOTE with 10-fold cross-validation.
1. Introduction
The liver is located in the upper part of the gastrointestinal tract of the human body, and its weight in men ranges between 1400–1800 g and in women between 1200–1400 g. It performs important functions related to digestion, metabolism, releasing toxins, immunization and nutrient storage. That is why some liver diseases can even lead to death [1,2].
Liver diseases are categorized based on their aetiology and effect on the liver. The aetiology may include infection, injury, exposure to drugs or toxic substances, a process, or a genetic abnormality (such as hemochromatosis). The above causes can lead to hepatitis, cirrhosis, and stones that can increase in size and cause blockages, fatty infiltration and, in rare cases, liver cancer. Genetic abnormalities can also interfere with vital functions of the liver and lead to the deposition and concentration of harmful components, such as iron or copper [3,4,5].
Non-alcoholic fatty liver disease (NAFLD) is one of the main liver diseases and is characterized by an accumulation of lipids in the liver. If there is inflammation and injury to the liver cells, it is called “non-alcoholic steatohepatitis” [6]. Cirrhosis is also one of the most serious liver diseases. This disease causes healthy tissue to be replaced by scar tissue. Thus, the liver is permanently injured and cannot function properly. The main causes of cirrhosis of the liver include alcoholism, non-alcoholic fatty liver disease, chronic hepatitis C, and chronic hepatitis B [7].
There are two main forms of hepatitis, acute hepatitis [8], where the liver becomes inflamed at a rapid rate, and chronic hepatitis [9], where the liver becomes inflamed and destroyed slowly over a long period of time. Although hepatitis can be caused by any of the above, it is most often caused by infection with a virus in a group called hepatitis viruses. These viruses have been named, in the order they were discovered, as hepatitis A, B, C, D, and E viruses [10].
Hepatitis A is caused by the HAV virus. It is usually spread by contaminated food or water. It can also be transmitted through sexual contact and more rarely through blood. [11]. Hepatitis B has similar characteristics. However, in this case, it is transmitted by contact with any bodily fluid of an infected person. There are two forms, acute and chronic. Left untreated, the latter can turn into liver cancer or cause liver failure [12]. Hepatitis C has a similar pattern to the previous two. However, it is transmitted through contact with the blood of an infected person. Early symptoms can appear even ten years after infection. As with hepatitis B, there is an acute and chronic form [13]. The hepatitis D virus is very rare and only affects people with hepatitis B [14], and hepatitis E is spread by drinking water contaminated by the faeces of an infected person [15].
Liver disease is usually associated with alcoholism or hepatitis, but obesity and diabetes are becoming a growing threat of potentially fatal liver damage. Advanced fatty liver disease increases a person’s risk of death by nearly sevenfold. It is a silent “killer” and if the symptoms associated with fatty liver damage appear, the situation is already difficult [16,17,18].
In order to prevent liver disease, patients should not drink large amounts of alcohol. However, in the case where a patient is diagnosed with hepatitis B or C, alcoholic hepatitis, etc., the simple recommendation for these patients is to not consume any alcohol at all. Additional precautions include the use of a condom during sexual intercourse, the avoidance of sharing syringes or needles, vaccination for hepatitis A and B, and the protection of the skin from toxic chemicals. Finally, exercise, a healthy diet and maintaining a normal body weight contribute to the proper functioning of the liver [19,20].
Traditionally, health professionals make a medical report concerning a patient’s condition based on histopathological exams. With the advances in information and communication technologies, especially in artificial intelligence (AI) and machine learning (ML), efficient data collection, processing, and visualization methods have arisen. Clinicians combining the outcomes of AI and ML models with the findings of clinical methods can further improve their decisions on disease detection. Undoubtedly, ML techniques have significantly contributed to the early prediction of disease complications in diabetes (handling it as a classification problem [21,22] or regression task for the short-term glucose prediction [23,24]), cholesterol [25], hypertension [26,27], hypercholesterolemia [28], chronic obstructive pulmonary disease (COPD) [29], covid-19 [30], stroke [31], chronic kidney disease (CKD) [32], lung cancer [33], sleep disorders [34,35], cardiovascular diseases (CVDs) [36], etc.
In particular, liver disease occurrence will concern us in the context of this research work. The main contributions of the methodology adopted are the following:
- Data preprocessing is performed with the synthetic minority oversampling technique (SMOTE). In this way, the dataset’s instances are distributed in a balanced way allowing us to design efficient classification models and predict the occurrence of liver disease.
- Features’ importance evaluation based on the Pearson Correlation, Gain Ratio and Random Forest is carried out.
- A comparative evaluation of many ML models’ performance is illustrated considering well-known metrics, such as Precision, Recall, F-Measure, Accuracy and AUC. The experimental results indicated that the Voting classifier prevailed over the other models constituting the proposition of this research work.
- Considering published papers that were based on the same dataset with the same features we relied on, our main proposal (i.e., Voting classifier) outperformed in terms of accuracy.
The rest of the paper is organized as follows. Section 2 provides a dataset description and an analysis of the methodology followed. Furthermore, in Section 3, we evaluate the experimental research results. In addition, Section 4 discusses related works on the topic under examination. Finally, conclusions and future directions are noted in Section 5.
2. Materials and Methods
Here, we will provide the dataset we relied on and the main steps of the adopted methodology for liver disease risk prediction, namely, class balancing and features’ ranking in the balanced data. Finally, we note the ML models we based on for the experimental results.
2.1. Dataset Description
Our research was based on the Indian Liver Patients’ Records dataset [37]. The specific dataset includes 579 participants, of which the number of men (male) is 439 (75.8%) and women (female) 140 (24.2%). The target class indicates if the participant has been diagnosed with liver disease or not. The number of participants diagnosed with liver disease is 414 (71.5%). A brief overview of the dataset’s characteristics is shown in Table 1.
2.2. Liver Disease Risk Prediction
Nowadays, clinicians and health carers exploit machine-learning models to develop efficient tools for the risk assessment of a disease occurrence based on several risk factors. Here, the long-term risk prediction of liver disease is formulated as a classification problem with two possible classes c = “Liver-Disease” (LD) or c = “Non-Liver-Disease” (Non-LD). The trained ML models will be able to predict the class of a new unclassified instance, either as LD or Non-LD based on the input features’ values and thus the risk of occurring liver disease.
2.2.1. Data Preprocessing
The accurate identification of LD and Non-LD instances may be impacted by their unbalanced distribution in the dataset. Here, an oversampling method is applied, namely SMOTE [46], which, based on a 5-NN classifier, creates synthetic data [47] on the minority class. The instances in the Non-LD class are oversampled such that the subjects in the two classes are uniformly distributed. After the implementation of SMOTE, the number of participants is 828, of which the number of men (male) is 615 (74.3%) and women (female) 213 (25.7%). Now the dataset is balanced, and the target class includes 414 LD and 414 Non-LD instances. Finally, in Table 2, we present the statistical characteristics of the features in the balanced dataset, focusing on the minimum, maximum, mean and standard deviation.
2.2.2. Features Analysis
Three ranking methods [48] have been selected to evaluate the contribution of a feature in the target class (LD). Their results are illustrated in Table 3.
Initially, Pearson correlation analysis [49] is executed and its outcomes are first illustrated in Figure 1. This coefficient is utilized to capture the strength and direction of the association between two features and/or a feature and the interested class. Its values vary between −1 and 1. Focusing on this coefficient, we observe a strong correlation of 0.88 between TB and DB. Moreover, a strong association is noted between SGOT and SGPT, and ALB and TP of rank 0.79 and 0.76, respectively. Furthermore, a moderate relationship of rank 0.65 is shown to have AGR with ALB. Evaluating the features’ contribution in the target class, DB is first in order of importance; however, a low association of 0.32 is recorded. The same holds for the TB, ALP, SGPT, AGR and SGOT. A weaker association of 0.1836 and 0.1596 is shown to have liver disease variable with the features of age and ALB, correspondingly. An absence of correlation seems to occur with the gender and TP features where the rank is lower than 0.1.
Next, we employed Gain Ratio (GR) method [50], which is calculated as , where (with denoting the probability of feature X takes value equal to ), (with be the probability of selecting an instance in class c with two possible states Non-LD, LD) and are the entropy of feature X, the entropy of class variable C and the conditional entropy of feature X given class C, respectively. This method assigned the highest scores to DB, TB and SGOT.
Thirdly, the Random Forest classifier was considered to measure the features’ importance based on Gini impurity [51], which measures a candidate feature’s ability to optimally split the instances into two classes. In this method, gender was assigned the lowest ranking, close to zero. As we see, the importance of the rest features is very close to each other (such as in the case of DB, ALP, and TB).
In conclusion, the models’ training and validation will be based on all of these features, as they are the most important for liver disease screening by physicians.
2.3. Machine Learning Models
In this research article, we experimented with various ML models to uncover which one outperforms the others by evaluating their prediction performance. Specifically, we focused on naive Bayes (NB) [52] and Logistic Regression (LR) [53] models, which are probabilistic classifiers. In addition, we used the well-known kernel-based (linear, non-linear) classifier Support Vector Machine (SVM) [54].
Moreover, we used Decision-Tree-based models such as, J48 [55], Random Tree (RT) [56] and Reduced Error Pruning Tree (RepTree) [57]. From Ensemble ML algorithms [58], Bagging [59], Random Forest (RF) [60], Rotation Forest (RotF) [61], AdaBoostM1 [62], Voting [63] and Stacking [64] were exploited. Finally, a simple Artificial Neural Network (ANN) called multilayer perceptron (MLP) [65], and k-nearest neighbors (kNN) [66], a distance-based classifier, were evaluated.
2.4. Evaluation Metrics
To evaluate the ML models’ performance we utilised the most commonly used metrics in the relevant literature, such as Accuracy, Precision, Recall, F-Measure, and AUC [67,68]. The confusion matrix consists of the elements true positive (TP), true negative (TN), false positive (FP) and false negative (FN). The aforementioned metrics are defined as follows.
- Accuracy: summarizes the performance of the classification task and measures the number of correctly predicted instances out of all the data instances.
- Recall: corresponds to the proportion of participants who were diagnosed with LD and were correctly classified as positive, concerning all positive participants.
- Precision: indicates how many of those who were identified as LD belong to this class.
- F-Measure: is the harmonic mean of the Precision and Recall and sums up the predictive performance of a model. The desired metrics will be calculated with the help of the Confusion matrix.In order to evaluate the distinguishability of a model, the AUC is exploited. It is a metric that varies in [0, 1]. The closer to one, the better the ML model performance is in distinguishing LD from Non-LD instances.
3. Results
In this section, the experiment settings and the acquired outcomes will be described.
3.1. Experimental Setup
For the evaluation of our proposed ML models, we relied on the Waikato Environment for Knowledge Analysis (Weka) [69], which is an open-access software developed at the University of Waikato, New Zealand. In addition, the experiments were performed on a computer system with the following specifications: 11th generation Intel(R) Core(TM) i7-1165G7 @ 2.80 GHz, RAM 16 GB, Windows 11 Home, 64-bit OS and x64 processor.
Various ML models, such as NB, SVM, LR, ANN, kNN, J48, RF, RT, RepTree, RotF, AdaBoostM1, Stacking, Bagging, and Voting were assessed in terms of Accuracy, Precision, Recall, F-Measure and AUC. In Stacking, we consider as base classifiers the RF and AdaBoostM1 models, and as meta classifier the LR model. Concerning Voting, the same base classifiers as Stacking were assumed, and the final prediction was derived from the average probabilities (soft Voting). The Bagging had as a base classifier the RF. In Table 4, we illustrate the optimal parameters’ settings of the ML models that we experimented with. Finally, we applied 10-fold cross-validation in order to measure the models’ efficiency in the balanced dataset of 828 instances after SMOTE.
3.2. Performance Evaluation
In the context of performance evaluation, we will first present how SMOTE method contributed to the design of efficient models. The impact of the specific class balancing method is clearly reflected in the Recall and Precision metrics which are captured in Table 5. These outcomes are related to the minority class (namely healthy participants) and show that ML models highly benefited from the application of SMOTE technique. Then, in Table 6, we illustrate the average performance of the models under consideration after applying SMOTE with 10-fold cross-validation. At this point, it should be noted that the uniform class distribution helped to improve the correct identification of healthy instances while keeping the average performance at higher levels. That means that the investigated models maintained their efficiency for the patients’ correct and accurate identification as well. The Voting Ensemble method outperforms in comparison to the other models with an Accuracy, Recall, and F-measure of 80.1%, a Precision of 80.4%, and an AUC equal to 88.4%. Very good performance is also presented by the AdaboostM1 model, which has as a base classifier the RF, with an Accuracy, F-Measure and Recall of 79.5%, a Precision of 79.7%, and an AUC equal to 87.9%. Finally, the RF and the Stacking Ensemble model operate at similar levels of accuracy (79.4%).
In addition to the above metrics, in Figure 2, we provide models’ evaluation based on AUC ROC curves after SMOTE with 10-fold cross-validation. From the illustration, we observe that the RF, RotF, AdaboostM1, Stacking, Bagging and Voting classifiers present better performance than the other models, which is also confirmed and numerically.
4. Discussion
In this section, works based on the Indian Liver Patients’ Records dataset [37] are presented in order to predict liver disease occurrence by applying various ML models. Specifically, [84,85] proposed the Random Forest model reaching an accuracy of 71.87%, while [87] suggested the Decision Tree model achieving an accuracy of 69.40%. In addition, [80] recommended the Random Tree model with an accuracy of 74.20% and [79] showed that AdaBoostM1 is the best model achieving an accuracy of 74.36%, [88] proposed the ensemble Bagging method achieving an accuracy of 69.30%, [78] proposed the k-nearest neighbour model with an accuracy of 74.67%, and in [71] the authors proposed a hybrid ML model called Mathematical Approach on Multilayer Feedforward Neural Network with Backpropagation (MAMFFN) achieving an accuracy of 75.30%.
Furthermore, the authors in [73,74,75,76,77] proposed the Logistic Regression model achieving an accuracy of 75%. The Composite Hypercube on Iterated Random Projection (CHIRP) model proposed by the authors in [86] with an accuracy equal to 71.30%. A classic multi-layered neural network based on a backpropagation algorithm is the authors’ proposal in [82] with 73.2% accuracy. Additionally, the authors at [81] tested that the k-nearest neighbour with feature selection techniques (KNNWFST) outperforms all other comparables. The Gradient Tree Boosting classifier for a balanced dataset showed the best accuracy with 72% in [83]. Finally, the naïve Bayes in [70] performs better with 75.54% accuracy, and in [72], the Support Vector Machine achieves 75.04% accuracy.
In this work, exploiting the same dataset with [70,71,72,73,74,75,76,77,78,79,80,81,82,83,84,85,86,87,88], we decided to study more efficient models resorting to ensemble learning. The models in this category were trained and tested on the same biochemical features before and after class balancing assuming 10-fold cross-validation. We focused on the SMOTE-based balanced dataset and the ensemble models which the previous works did not consider, along with a graphical capture of AUC ROC curves. Comparing the performance of the single models in the studies [70,71,72,73,74,75,76,77,78,79,80,81,82,83,84,85,86,87,88] with the ones examined here, our trained and tested classifiers prevailed in terms of accuracy. The Voting method, which is the main suggestion of this study, prevailed both against the models in the same family and the single ones as shown in Table 7. Quality of life is an important variable. Hence, from a clinical and technological research perspective, designing a machine learning model based on biochemical data that capture human health status has become an imperative need.
Concluding this section, the current study will help clinicians and researchers monitor liver disease, design high-performance personalized models, providing the flexibility to incorporate both quality-of-life features that show the well-being of patients, and indicate the difficulties associated with this condition. Summarizing the evaluation of the proposed models, we have to point out some limitations of our article. The present research work was based on the Indian Liver Patients’ Records dataset, which, although a well-known publicly available dataset [37], has no indications on what were the exact definitions and criteria used for diagnosing patients with liver disease. Finally, exploiting data coming from a hospital unit or institute could give us a greater variety of features to better evaluate the ML models. However, it should be emphasized that gaining access to sensitive medical data is difficult due to privacy reasons.
5. Conclusions
Liver disease is a serious condition that threatens human life and requires urgent medical attention. Health professionals are based on pathological methods to make a medical report concerning a patient’s condition. Early prediction of liver disease using machine learning techniques was the point of interest in this study.
Specifically, plenty of ML models, such as NB, SVM, LR, ANN, kNN, J48, RF, RT, RepTree, RotF, AdaBoostM1, Stacking, Bagging, and Voting, were evaluated in terms of Accuracy, Precision, Recall, F-Measure and AUC, in order to predict liver disease occurrence. From the experimental results, the Voting classification method outperforms the other ones with an Accuracy, Recall, and F-measure of 80.1%, a Precision of 80.4%, and an AUC equal to 88.4% after SMOTE with 10-fold cross-validation and, thus, it constitutes the main proposition of this study. Finally, our proposed model (i.e., Voting) shows better accuracy compared to matched published research works based on the dataset [37] with the same features we relied on.
In future work, we aim to re-consider the liver disease manifestation methodology following, first, the ROPE (region of practical equivalence) analysis to test whether a feature is significant (in the sense of important enough for the liver disease risk prediction) and, secondly, extend the machine learning framework by using deep learning methods and comparing the results on the aforementioned metrics.
Author Contributions
E.D. and M.T. conceived of the idea, designed and performed the experiments, analyzed the results, drafted the initial manuscript and revised the final manuscript. All authors have read and agreed to the published version of the manuscript.
Funding
This research received no external funding.
Data Availability Statement
All data has been present in the main text.
Conflicts of Interest
The authors declare no conflict of interest.
References
- Arias, I.M.; Alter, H.J.; Boyer, J.L.; Cohen, D.E.; Shafritz, D.A.; Thorgeirsson, S.S.; Wolkoff, A.W. The Liver: Biology and Pathobiology; John Wiley & Sons: Hoboken, NJ, USA, 2020. [Google Scholar]
- Singh, H.R.; Rabi, S. Study of morphological variations of liver in human. Transl. Res. Anat. 2019, 14, 1–5. [Google Scholar] [CrossRef]
- Razavi, H. Global epidemiology of viral hepatitis. Gastroenterol. Clin. 2020, 49, 179–189. [Google Scholar] [CrossRef]
- Ginès, P.; Krag, A.; Abraldes, J.G.; Solà, E.; Fabrellas, N.; Kamath, P.S. Liver cirrhosis. Lancet 2021, 398, 1359–1376. [Google Scholar] [CrossRef] [PubMed]
- Ringehan, M.; McKeating, J.A.; Protzer, U. Viral hepatitis and liver cancer. Philos. Trans. R. Soc. B Biol. Sci. 2017, 372, 20160274. [Google Scholar] [CrossRef] [Green Version]
- Powell, E.E.; Wong, V.W.S.; Rinella, M. Non-alcoholic fatty liver disease. Lancet 2021, 397, 2212–2224. [Google Scholar] [CrossRef]
- Smith, A.; Baumgartner, K.; Bositis, C. Cirrhosis: Diagnosis and management. Am. Fam. Physician 2019, 100, 759–770. [Google Scholar] [PubMed]
- Rycroft, J.A.; Mullender, C.M.; Hopkins, M.; Cutino-Moguel, T. Improving the accuracy of clinical interpretation of serological testing for the diagnosis of acute hepatitis a infection. J. Clin. Virol. 2022, 155, 105239. [Google Scholar] [CrossRef]
- Thomas, D.L. Global elimination of chronic hepatitis. N. Engl. J. Med. 2019, 380, 2041–2050. [Google Scholar] [CrossRef]
- Rasche, A.; Sander, A.L.; Corman, V.M.; Drexler, J.F. Evolutionary biology of human hepatitis viruses. J. Hepatol. 2019, 70, 501–520. [Google Scholar] [CrossRef] [Green Version]
- Gust, I.D. Hepatitis A; CRC Press: Boca Raton, FL, USA, 2018. [Google Scholar]
- Yuen, M.F.; Chen, D.S.; Dusheiko, G.M.; Janssen, H.L.; Lau, D.T.; Locarnini, S.A.; Peters, M.G.; Lai, C.L. Hepatitis B virus infection. Nat. Rev. Dis. Prim. 2018, 4, 1–20. [Google Scholar] [CrossRef]
- Manns, M.P.; Buti, M.; Gane, E.; Pawlotsky, J.M.; Razavi, H.; Terrault, N.; Younossi, Z. Hepatitis C virus infection. Nat. Rev. Dis. Prim. 2017, 3, 1–19. [Google Scholar] [CrossRef] [PubMed]
- Mentha, N.; Clément, S.; Negro, F.; Alfaiate, D. A review on hepatitis D: From virology to new therapies. J. Adv. Res. 2019, 17, 3–15. [Google Scholar] [CrossRef] [PubMed]
- Kamar, N.; Izopet, J.; Pavio, N.; Aggarwal, R.; Labrique, A.; Wedemeyer, H.; Dalton, H.R. Hepatitis E virus infection. Nat. Rev. Dis. Prim. 2017, 3, 1–16. [Google Scholar] [CrossRef] [Green Version]
- Marchesini, G.; Moscatiello, S.; Di Domizio, S.; Forlani, G. Obesity-associated liver disease. J. Clin. Endocrinol. Metab. 2008, 93, s74–s80. [Google Scholar] [CrossRef]
- Seitz, H.K.; Bataller, R.; Cortez-Pinto, H.; Gao, B.; Gual, A.; Lackner, C.; Mathurin, P.; Mueller, S.; Szabo, G.; Tsukamoto, H. Alcoholic liver disease. Nat. Rev. Dis. Prim. 2018, 4, 1–22. [Google Scholar] [CrossRef] [PubMed]
- Åberg, F.; Färkkilä, M. Drinking and obesity: Alcoholic liver disease/nonalcoholic fatty liver disease interactions. In Seminars in Liver Disease; Thieme Medical Publishers: New York, NY, USA, 2020; Volume 40, pp. 154–162. [Google Scholar]
- Bae, M.; Park, Y.K.; Lee, J.Y. Food components with antifibrotic activity and implications in prevention of liver disease. J. Nutr. Biochem. 2018, 55, 1–11. [Google Scholar] [CrossRef] [PubMed]
- Cai, J.; Zhang, X.J.; Li, H. Progress and challenges in the prevention and control of nonalcoholic fatty liver disease. Med. Res. Rev. 2019, 39, 328–348. [Google Scholar] [CrossRef] [PubMed] [Green Version]
- Fazakis, N.; Kocsis, O.; Dritsas, E.; Alexiou, S.; Fakotakis, N.; Moustakas, K. Machine learning tools for long-term type 2 diabetes risk prediction. IEEE Access 2021, 9, 103737–103757. [Google Scholar] [CrossRef]
- Dritsas, E.; Trigka, M. Data-Driven Machine-Learning Methods for Diabetes Risk Prediction. Sensors 2022, 22, 5304. [Google Scholar] [CrossRef]
- Alexiou, S.; Dritsas, E.; Kocsis, O.; Moustakas, K.; Fakotakis, N. An approach for Personalized Continuous Glucose Prediction with Regression Trees. In Proceedings of the 2021 6th South-East Europe Design Automation, Computer Engineering, Computer Networks and Social Media Conference (SEEDA-CECNSM), Preveza, Greece, 24–26 September 2021; pp. 1–6. [Google Scholar]
- Dritsas, E.; Alexiou, S.; Konstantoulas, I.; Moustakas, K. Short-term Glucose Prediction based on Oral Glucose Tolerance Test Values. In Proceedings of the International Joint Conference on Biomedical Engineering Systems and Technologies—HEALTHINF, Lisbon, Portugal, 9–11 February 2022; Volume 5, pp. 249–255. [Google Scholar]
- Fazakis, N.; Dritsas, E.; Kocsis, O.; Fakotakis, N.; Moustakas, K. Long-Term Cholesterol Risk Prediction with Machine Learning Techniques in ELSA Database. In Proceedings of the 13th International Joint Conference on Computational Intelligence (IJCCI), Online, 24–26 October 2021; pp. 445–450. [Google Scholar]
- Dritsas, E.; Fazakis, N.; Kocsis, O.; Fakotakis, N.; Moustakas, K. Long-Term Hypertension Risk Prediction with ML Techniques in ELSA Database. In Proceedings of the International Conference on Learning and Intelligent Optimization, Athens, Greece, 20–25 June 2021; pp. 113–120. [Google Scholar]
- Dritsas, E.; Alexiou, S.; Moustakas, K. Efficient Data-driven Machine Learning Models for Hypertension Risk Prediction. In Proceedings of the 2022 International Conference on INnovations in Intelligent SysTems and Applications (INISTA), Biarritz, France, 8–10 August 2022; pp. 1–6. [Google Scholar]
- Dritsas, E.; Trigka, M. Machine Learning Methods for Hypercholesterolemia Long-Term Risk Prediction. Sensors 2022, 22, 5365. [Google Scholar] [CrossRef]
- Dritsas, E.; Alexiou, S.; Moustakas, K. COPD Severity Prediction in Elderly with ML Techniques. In Proceedings of the 15th International Conference on PErvasive Technologies Related to Assistive Environments, Corfu Island, Greece, 29 June–1 July 2022; pp. 185–189. [Google Scholar]
- Dritsas, E.; Trigka, M. Supervised Machine Learning Models to Identify Early-Stage Symptoms of SARS-CoV-2. Sensors 2023, 23, 40. [Google Scholar] [CrossRef]
- Dritsas, E.; Trigka, M. Stroke Risk Prediction with Machine Learning Techniques. Sensors 2022, 22, 4670. [Google Scholar] [CrossRef]
- Dritsas, E.; Trigka, M. Machine Learning Techniques for Chronic Kidney Disease Risk Prediction. Big Data Cogn. Comput. 2022, 6, 98. [Google Scholar] [CrossRef]
- Dritsas, E.; Trigka, M. Lung Cancer Risk Prediction with Machine Learning Models. Big Data Cogn. Comput. 2022, 6, 139. [Google Scholar] [CrossRef]
- Konstantoulas, I.; Kocsis, O.; Dritsas, E.; Fakotakis, N.; Moustakas, K. Sleep Quality Monitoring with Human Assisted Corrections. In Proceedings of the International Joint Conference on Computational Intelligence (IJCCI), Online, 24–26 October 2021; pp. 435–444. [Google Scholar]
- Konstantoulas, I.; Dritsas, E.; Moustakas, K. Sleep Quality Evaluation in Rich Information Data. In Proceedings of the 2022 13th International Conference on Information, Intelligence, Systems & Applications (IISA), Corfu, Greece, 18–20 July 2022; pp. 1–4. [Google Scholar]
- Dritsas, E.; Alexiou, S.; Moustakas, K. Cardiovascular Disease Risk Prediction with Supervised Machine Learning Techniques. In Proceedings of the ICT4AWE, Online, 23–25 April 2022; pp. 315–321. [Google Scholar]
- Indian Liver Patient Records. Available online: https://www.kaggle.com/datasets/uciml/indian-liver-patient-records (accessed on 14 November 2022).
- Mauvais-Jarvis, F.; Merz, N.B.; Barnes, P.J.; Brinton, R.D.; Carrero, J.J.; DeMeo, D.L.; De Vries, G.J.; Epperson, C.N.; Govindan, R.; Klein, S.L.; et al. Sex and gender: Modifiers of health, disease, and medicine. Lancet 2020, 396, 565–582. [Google Scholar] [CrossRef]
- Lin, H.; Yip, T.C.F.; Zhang, X.; Li, G.; Tse, Y.K.; Hui, V.W.K.; Liang, L.Y.; Lai, J.C.T.; Chan, S.L.; Chan, H.L.Y.; et al. Age and the relative importance of liver-related deaths in nonalcoholic fatty liver disease. Hepatology 2022. [Google Scholar] [CrossRef] [PubMed]
- Ruiz, A.R.G.; Crespo, J.; Martínez, R.M.L.; Iruzubieta, P.; Mercadal, G.C.; Garcés, M.L.; Lavin, B.; Ruiz, M.M. Measurement and clinical usefulness of bilirubin in liver disease. Adv. Lab. Med. Med. Lab. 2021, 2, 352–361. [Google Scholar]
- Liu, Y.; Cavallaro, P.M.; Kim, B.M.; Liu, T.; Wang, H.; Kühn, F.; Adiliaghdam, F.; Liu, E.; Vasan, R.; Samarbafzadeh, E.; et al. A role for intestinal alkaline phosphatase in preventing liver fibrosis. Theranostics 2021, 11, 14. [Google Scholar] [CrossRef]
- Goodarzi, R.; Sabzian, K.; Shishehbor, F.; Mansoori, A. Does turmeric/curcumin supplementation improve serum alanine aminotransferase and aspartate aminotransferase levels in patients with nonalcoholic fatty liver disease? A systematic review and meta-analysis of randomized controlled trials. Phytother. Res. 2019, 33, 561–570. [Google Scholar] [CrossRef] [Green Version]
- He, B.; Shi, J.; Wang, X.; Jiang, H.; Zhu, H.J. Genome-wide pQTL analysis of protein expression regulatory networks in the human liver. BMC Biol. 2020, 18, 1–16. [Google Scholar] [CrossRef]
- Carvalho, J.R.; Machado, M.V. New insights about albumin and liver disease. Ann. Hepatol. 2018, 17, 547–560. [Google Scholar] [CrossRef] [PubMed]
- Ye, Y.; Chen, W.; Gu, M.; Xian, G.; Pan, B.; Zheng, L.; Zhang, Z.; Sheng, P. Serum globulin and albumin to globulin ratio as potential diagnostic biomarkers for periprosthetic joint infection: A retrospective review. J. Orthop. Surg. Res. 2020, 15, 1–7. [Google Scholar] [CrossRef]
- Maldonado, S.; López, J.; Vairetti, C. An alternative SMOTE oversampling strategy for high-dimensional datasets. Appl. Soft Comput. 2019, 76, 380–389. [Google Scholar] [CrossRef]
- Dritsas, E.; Fazakis, N.; Kocsis, O.; Moustakas, K.; Fakotakis, N. Optimal Team Pairing of Elder Office Employees with Machine Learning on Synthetic Data. In Proceedings of the 2021 12th International Conference on Information, Intelligence, Systems & Applications (IISA), Chania Crete, Greece, 12–14 July 2021; pp. 1–4. [Google Scholar]
- Jain, D.; Singh, V. Feature selection and classification systems for chronic disease prediction: A review. Egypt. Inform. J. 2018, 19, 179–189. [Google Scholar] [CrossRef]
- Liu, Y.; Mu, Y.; Chen, K.; Li, Y.; Guo, J. Daily activity feature selection in smart homes based on Pearson correlation coefficient. Neural Process. Lett. 2020, 51, 1771–1787. [Google Scholar] [CrossRef]
- Gnanambal, S.; Thangaraj, M.; Meenatchi, V.; Gayathri, V. Classification algorithms with attribute selection: An evaluation study using WEKA. Int. J. Adv. Netw. Appl. 2018, 9, 3640–3644. [Google Scholar]
- Aldrich, C. Process variable importance analysis by use of random forests in a shapley regression framework. Minerals 2020, 10, 420. [Google Scholar] [CrossRef]
- Berrar, D. Bayes’ theorem and naive Bayes classifier. Encycl. Bioinform. Comput. Biol. ABC Bioinform. 2018, 1, 403. [Google Scholar]
- Nusinovici, S.; Tham, Y.C.; Yan, M.Y.C.; Ting, D.S.W.; Li, J.; Sabanayagam, C.; Wong, T.Y.; Cheng, C.Y. Logistic regression was as good as machine learning for predicting major chronic diseases. J. Clin. Epidemiol. 2020, 122, 56–69. [Google Scholar] [CrossRef]
- Ghosh, S.; Dasgupta, A.; Swetapadma, A. A study on support vector machine based linear and non-linear pattern classification. In Proceedings of the 2019 International Conference on Intelligent Sustainable Systems (ICISS), Palladam, India, 21–22 February 2019; pp. 24–28. [Google Scholar]
- Emon, S.U.; Trishna, T.I.; Ema, R.R.; Sajal, G.I.H.; Kundu, S.; Islam, T. Detection of hepatitis viruses based on J48, KStar and Naïve Bayes Classifier. In Proceedings of the 2019 10th International Conference on Computing, Communication and Networking Technologies (ICCCNT), Kanpur, India, 6–8 July 2019; pp. 1–7. [Google Scholar]
- Joloudari, J.H.; Hassannataj Joloudari, E.; Saadatfar, H.; Ghasemigol, M.; Razavi, S.M.; Mosavi, A.; Nabipour, N.; Shamshirband, S.; Nadai, L. Coronary artery disease diagnosis; ranking the significant features using a random trees model. Int. J. Environ. Res. Public Health 2020, 17, 731. [Google Scholar] [CrossRef] [Green Version]
- Catherine, O. Lower Respiratory Tract Infection Clinical Diagnostic System Driven by Reduced Error Pruning Tree (REP Tree). Am. J. Compt. Sci. Inf. Technol. 2020, 8, 53. [Google Scholar]
- Dong, X.; Yu, Z.; Cao, W.; Shi, Y.; Ma, Q. A survey on ensemble learning. Front. Comput. Sci. 2020, 14, 241–258. [Google Scholar] [CrossRef]
- González, S.; García, S.; Del Ser, J.; Rokach, L.; Herrera, F. A practical tutorial on bagging and boosting based ensembles for machine learning: Algorithms, software tools, performance study, practical perspectives and opportunities. Inf. Fusion 2020, 64, 205–237. [Google Scholar] [CrossRef]
- Palimkar, P.; Shaw, R.N.; Ghosh, A. Machine learning technique to prognosis diabetes disease: Random forest classifier approach. In Advanced Computing and Intelligent Technologies; Springer: Berlin/Heidelberg, Germany, 2022; pp. 219–244. [Google Scholar]
- Ani, R.; Jose, J.; Wilson, M.; Deepa, O. Modified rotation forest ensemble classifier for medical diagnosis in decision support systems. In Progress in Advanced Computing and Intelligent Engineering; Springer: Berlin/Heidelberg, Germany, 2018; pp. 137–146. [Google Scholar]
- Polat, K.; Sentürk, U. A novel ML approach to prediction of breast cancer: Combining of mad normalization, KMC based feature weighting and AdaBoostM1 classifier. In Proceedings of the 2018 2nd International Symposium on Multidisciplinary Studies and Innovative Technologies (ISMSIT), Kanpur, India, 19–21 October 2018; pp. 1–4. [Google Scholar]
- Kumari, S.; Kumar, D.; Mittal, M. An ensemble approach for classification and prediction of diabetes mellitus using soft voting classifier. Int. J. Cogn. Comput. Eng. 2021, 2, 40–46. [Google Scholar] [CrossRef]
- Pavlyshenko, B. Using stacking approaches for machine learning models. In Proceedings of the 2018 IEEE Second International Conference on Data Stream Mining & Processing (DSMP), Lviv, Ukraine, 21–25 August 2018; pp. 255–258. [Google Scholar]
- Masih, N.; Naz, H.; Ahuja, S. Multilayer perceptron based deep neural network for early detection of coronary heart disease. Health Technol. 2021, 11, 127–138. [Google Scholar] [CrossRef]
- Cunningham, P.; Delany, S.J. k-Nearest neighbour classifiers-A Tutorial. ACM Comput. Surv. (CSUR) 2021, 54, 1–25. [Google Scholar] [CrossRef]
- Handelman, G.S.; Kok, H.K.; Chandra, R.V.; Razavi, A.H.; Huang, S.; Brooks, M.; Lee, M.J.; Asadi, H. Peering into the black box of artificial intelligence: Evaluation metrics of machine learning methods. Am. J. Roentgenol. 2019, 212, 38–43. [Google Scholar] [CrossRef] [PubMed]
- Zhou, J.; Gandomi, A.H.; Chen, F.; Holzinger, A. Evaluating the quality of machine learning explanations: A survey on methods and metrics. Electronics 2021, 10, 593. [Google Scholar] [CrossRef]
- Weka. Available online: https://www.weka.io/ (accessed on 14 November 2022).
- Dhamodharan, S. Liver Disease Prediction Using Bayesian Classification. 2016. Available online: https://www.ijact.in/index.php/ijact/article/viewFile/443/378 (accessed on 14 November 2022).
- Gajendran, G.; Varadharajan, R. Classification of Indian liver patients data set using MAMFFN. In Proceedings of the AIP Conference Proceedings, Coimbatore, India, 17–18 July 2020; Volume 2277, p. 120001. [Google Scholar]
- Geetha, C.; Arunachalam, A. Evaluation based Approaches for Liver Disease Prediction using Machine Learning Algorithms. In Proceedings of the 2021 International Conference on Computer Communication and Informatics (ICCCI), Coimbatore, India, 27–29 January 2021; pp. 1–4. [Google Scholar]
- Rahman, A.S.; Shamrat, F.J.M.; Tasnim, Z.; Roy, J.; Hossain, S.A. A comparative study on liver disease prediction using supervised machine learning algorithms. Int. J. Sci. Technol. Res. 2019, 8, 419–422. [Google Scholar]
- Srivastava, A.; Kumar, V.V.; Mahesh, T.; Vivek, V. Automated Prediction of Liver Disease using Machine Learning (ML) Algorithms. In Proceedings of the 2022 Second International Conference on Advances in Electrical, Computing, Communication and Sustainable Technologies (ICAECT), Bhilai, India, 21–22 April 2022; pp. 1–4. [Google Scholar]
- Singh, A.S.; Irfan, M.; Chowdhury, A. Prediction of liver disease using classification algorithms. In Proceedings of the 2018 4th International Conference on Computing Communication and Automation (ICCCA), Greater Noida, India, 14–15 December 2018; pp. 1–3. [Google Scholar]
- Choudhary, R.; Gopalakrishnan, T.; Ruby, D.; Gayathri, A.; Murthy, V.S.; Shekhar, R. An Efficient Model for Predicting Liver Disease Using Machine Learning. In Data Analytics in Bioinformatics: A Machine Learning Perspective; Wiley Online Library: Hoboken, NJ, USA, 2021; pp. 443–457. [Google Scholar]
- Bahramirad, S.; Mustapha, A.; Eshraghi, M. Classification of liver disease diagnosis: A comparative study. In Proceedings of the 2013 Second International Conference on Informatics & Applications (ICIA), Lodz, Poland, 23–25 September 2013; pp. 42–46. [Google Scholar]
- Kumar, P.; Thakur, R.S. Early detection of the liver disorder from imbalance liver function test datasets. Int. J. Innov. Technol. Explor. Eng. 2019, 8, 179–186. [Google Scholar]
- Idris, K.; Bhoite, S. Applications of machine learning for prediction of liver disease. Int. J. Comput. Appl. Technol. Res 2019, 8, 394–396. [Google Scholar] [CrossRef]
- Muthuselvan, S.; Rajapraksh, S.; Somasundaram, K.; Karthik, K. Classification of liver patient dataset using machine learning algorithms. Int. J. Eng. Technol. 2018, 7, 323. [Google Scholar] [CrossRef]
- Azam, M.S.; Rahman, A.; Iqbal, S.H.S.; Ahmed, M.T. Prediction of liver diseases by using few machine learning based approaches. Aust. J. Eng. Innov. Technol. 2020, 2, 85–90. [Google Scholar]
- Sontakke, S.; Lohokare, J.; Dani, R. Diagnosis of liver diseases using machine learning. In Proceedings of the 2017 International Conference on Emerging Trends & Innovation in ICT (ICEI), Pune, India, 3–5 February 2017; pp. 129–133. [Google Scholar]
- Sokoliuk, A.; Kondratenko, G.; Sidenko, I.; Kondratenko, Y.; Khomchenko, A.; Atamanyuk, I. Machine learning algorithms for binary classification of liver disease. In Proceedings of the 2020 IEEE International Conference on Problems of Infocommunications. Science and Technology (PIC S&T), Kharkiv, Ukraine, 6–9 October 2020; pp. 417–421. [Google Scholar]
- Swapna, K.; Prasad Babu, M. Critical analysis of Indian liver patients dataset using ANOVA method. Int. J. Eng. Technol 2017, 7, 19–33. [Google Scholar]
- Gulia, A.; Vohra, R.; Rani, P. Liver patient classification using intelligent techniques. Int. J. Comput. Sci. Inf. Technol. 2014, 5, 5110–5115. [Google Scholar]
- Khan, B.; Naseem, R.; Ali, M.; Arshad, M.; Jan, N. Machine learning approaches for liver disease diagnosing. Int. J. Data Sci. Adv. Anal. (ISSN 2563-4429) 2019, 1, 27–31. [Google Scholar]
- Jin, H.; Kim, S.; Kim, J. Decision factors on effective liver patient data prediction. Int. J. Bio-Sci. Bio-Technol. 2014, 6, 167–178. [Google Scholar] [CrossRef]
- Ramana, B.V.; Boddu, R.S.K. Performance comparison of classification algorithms on medical datasets. In Proceedings of the 2019 IEEE 9th Annual Computing and Communication Workshop and Conference (CCWC), Las Vegas, NV, USA, 7–9 January 2019; pp. 140–145. [Google Scholar]
Figure 1.
Pearson correlation analysis.
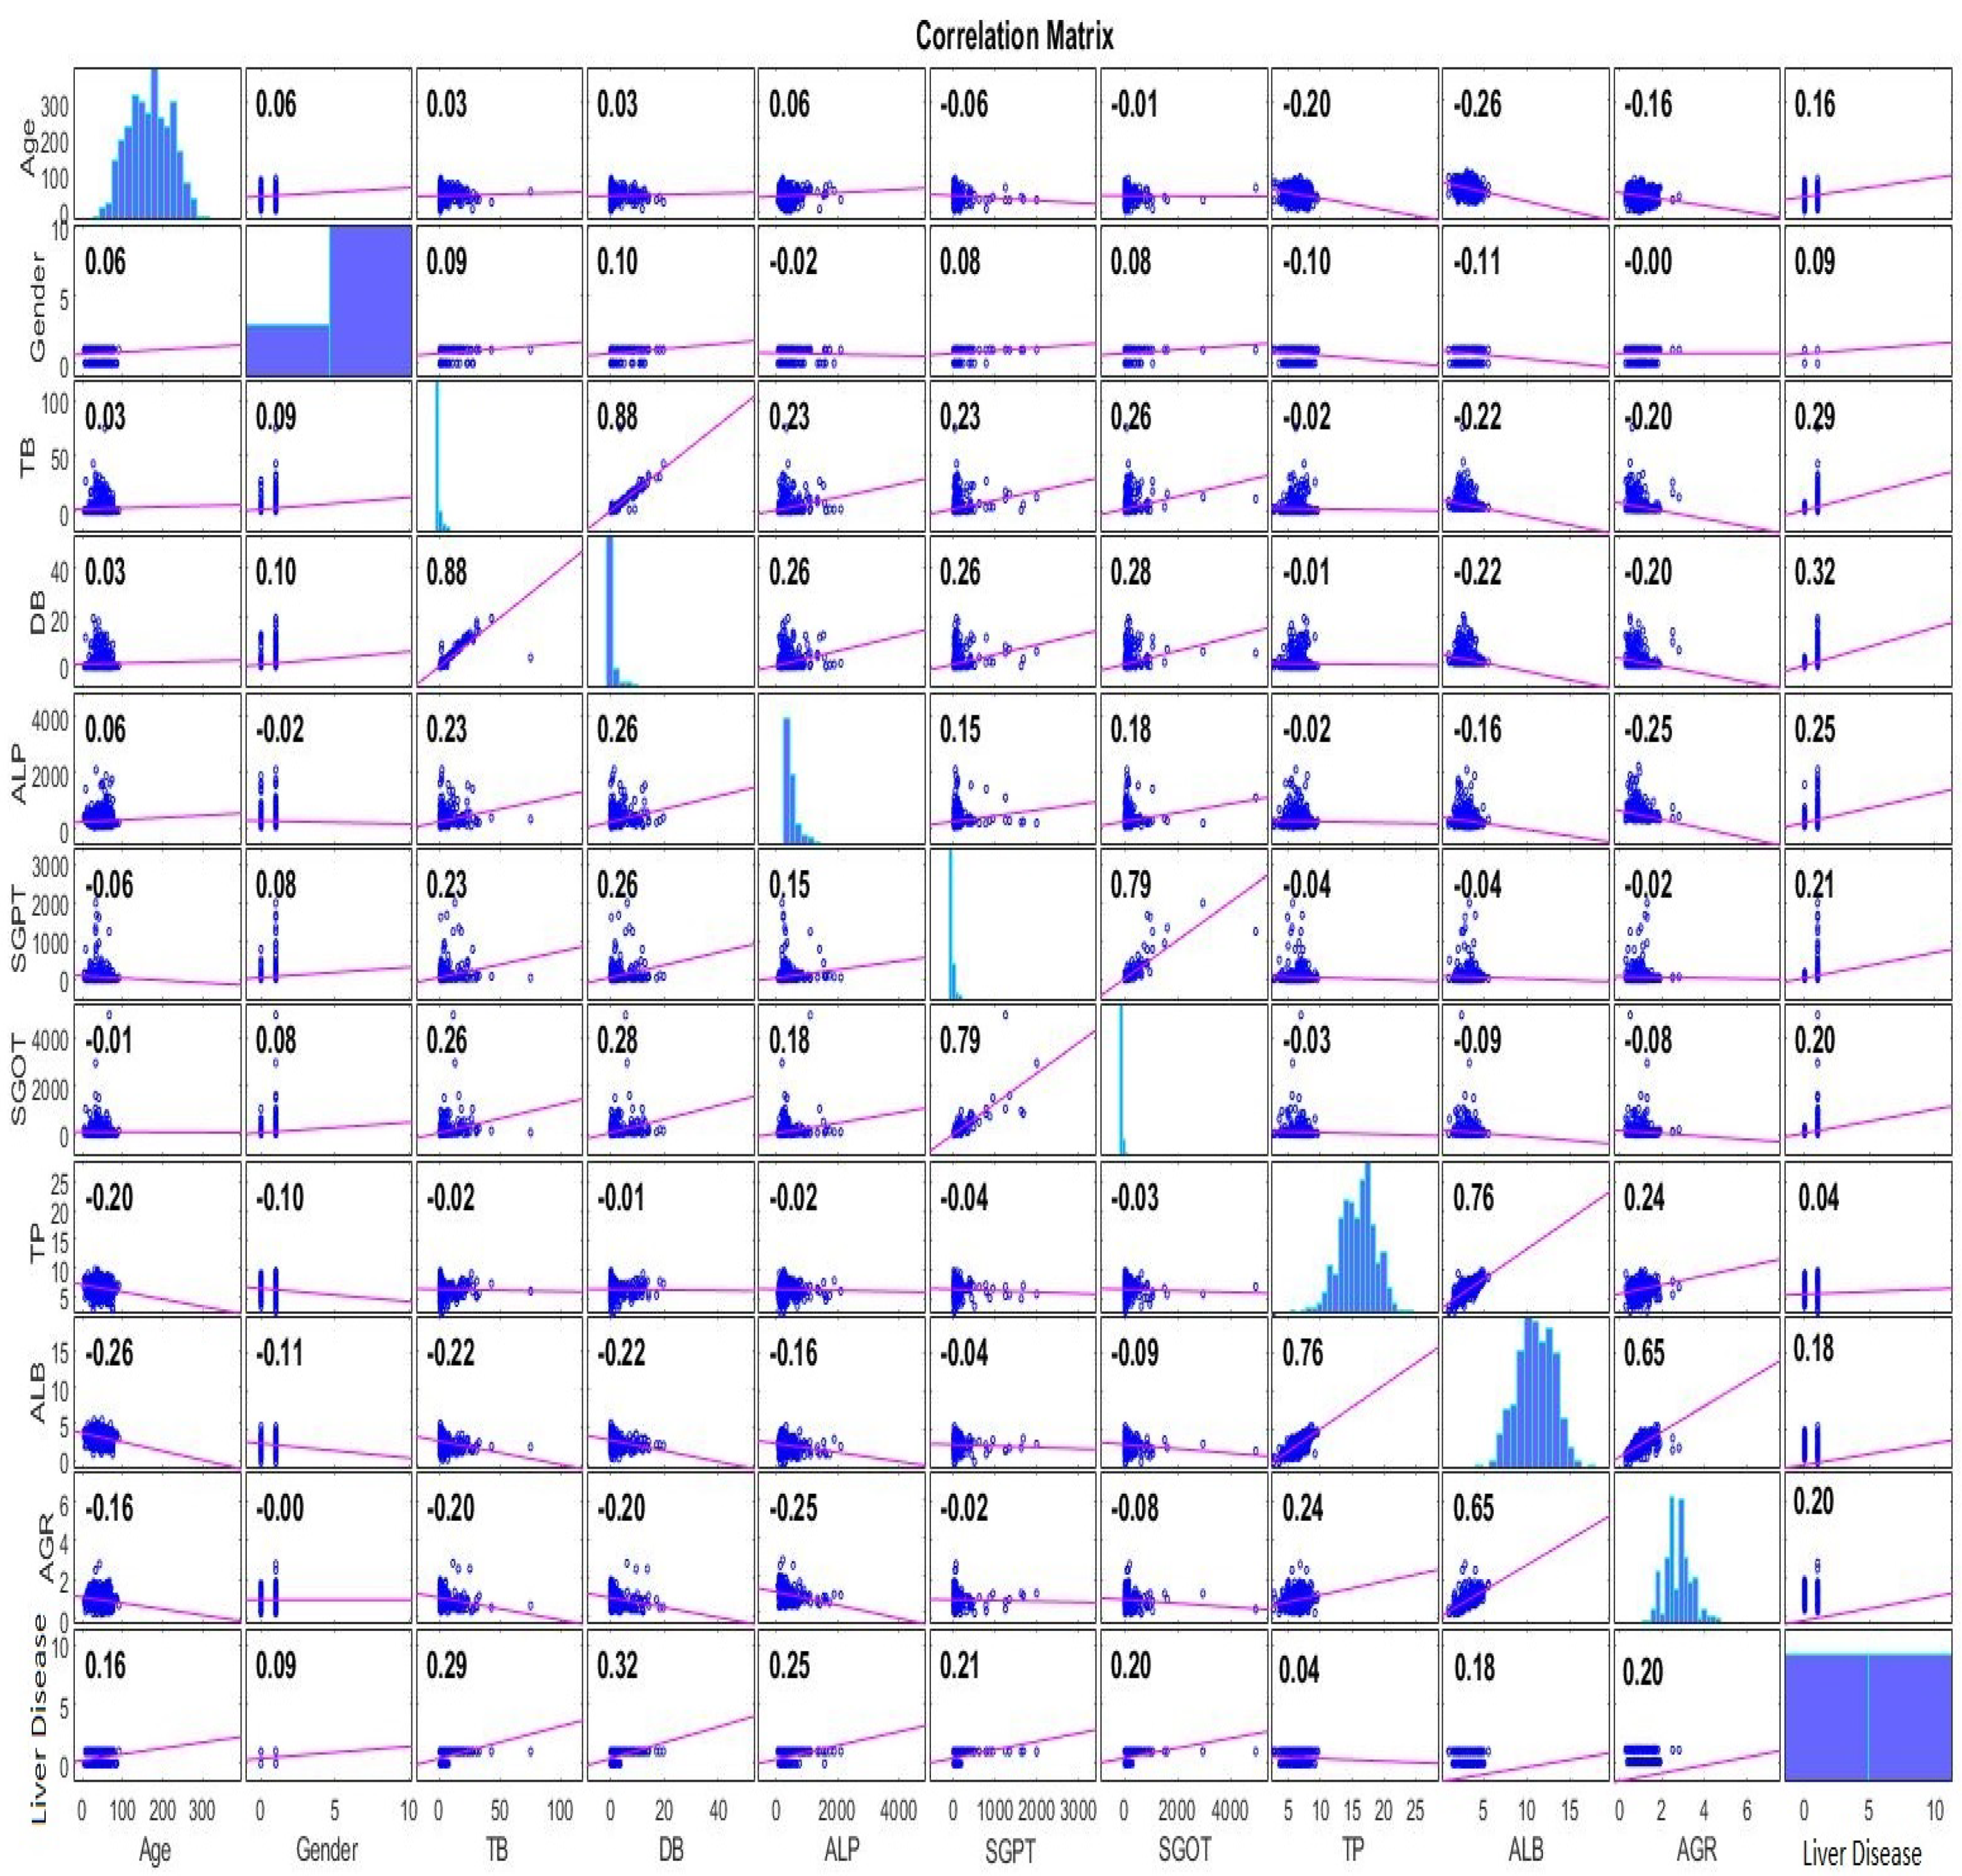
Figure 2.
Models’ evaluation based on AUC ROC curves.


Table 1.
Dataset Description.
| Feature | Type | Description |
|---|---|---|
| Gender [38] | nominal | This feature illustrates the participant’s gender. |
| Age (years) [39] | numeric | The age range of the participants is 4–90 years. |
| Total Bilirubin—TB (mg/dL) [40] | numeric | This feature captures the participant’s total bilirubin. |
| Direct Bilirubin—DB (mg/dL) [40] | numeric | This feature captures the participant’s direct bilirubin. |
| Alkaline Phosphatase—ALP (IU/L) [41] | numeric | This feature captures the participant’s alkaline phosphatase. |
| Alanine Aminotransferase—SGPT (U/L) [42] | numeric | This feature captures the participant’s alanine aminotransferase. |
| Aspartate Aminotransferase—SGOT (U/L) [42] | numeric | This feature captures the participant’s aspartate aminotransferase. |
| Total Protein—TP (g/L) [43] | numeric | This feature captures the participant’s total protein. |
| Albumin—ALB (g/dL) [44] | numeric | This feature captures the participant’s albumin. |
| Albumin and Globulin Ratio—AGR [45] | numeric | This feature captures the participant’s albumin and globulin Ratio. |
| Liver Disease | nominal | This feature stands for whether the participant has been diagnosed with liver disease or not. |
Table 2.
Statistical description of the numerical features in the balanced dataset after SMOTE.
| Min | Max | Mean ± Stdv | |
|---|---|---|---|
| Age | 4 | 90 | 43.55 ± 16.28 |
| TB | 0.4 | 75 | 2.65 ± 5.32 |
| DB | 0.1 | 19.7 | 1.16 ± 2.42 |
| ALP | 63 | 2110 | 267.26 ± 212.62 |
| SGPT | 10 | 2000 | 66.78 ± 155.16 |
| SGOT | 10 | 4929 | 88.78 ± 245.07 |
| TP | 2.7 | 9.6 | 6.50 ± 1.02 |
| ALB | 0.9 | 5.5 | 3.19 ± 0.76 |
| GR | 0.3 | 2.8 | 0.98 ± 0.30 |
Table 3.
Features’ importance evaluation based on the Pearson Correlation, Gain Ratio and Random Forest.
Table 3.
Features’ importance evaluation based on the Pearson Correlation, Gain Ratio and Random Forest.
| Feature | Pearson Rank | Feature | Gain Ratio | Feature | Random Forest |
|---|---|---|---|---|---|
| DB | 0.3205 | DB | 0.1421 | DB | 0.2895 |
| TB | 0.2874 | TB | 0.1373 | ALB | 0.2883 |
| ALP | 0.246 | SGOT | 0.1005 | TB | 0.2848 |
| SGPT | 0.2141 | ALP | 0.0867 | Age | 0.2625 |
| AGR | 0.2046 | AGR | 0.0822 | SGPT | 0.2613 |
| SGOT | 0.2017 | SGPT | 0.0701 | AGR | 0.2599 |
| ALB | 0.1836 | ALB | 0.0408 | SGOT | 0.2393 |
| Age | 0.1596 | Age | 0.0372 | TP | 0.2161 |
| Gender | 0.0857 | Gender | 0.0065 | ALP | 0.1936 |
| TP | 0.0443 | TP | 0 | Gender | 0.0255 |
Table 4.
Machine learning models’ settings.
| Model | Parameters |
|---|---|
| NB | useKernelEstimator: False useSupervisedDiscretization: True |
| SVM | eps = 0.001 gamma = 0.0 kernel type: linear loss = 0.1 |
| LR | ridge = useConjugateGradientDescent: True |
| ANN | hidden layers: ‘a’ learning rate = 0.1 momentum = 0.2 training time = 200 |
| J48 | reducedErrorPruning: True savelnstanceData: True useMDLCorrection: True subtreeRaising: True binarysplits = True collapseTree = True |
| RT | maxDepth = 0 minNum = 1.0 minVarianceProp = 0.001 |
| RepTree | maxDepth = 1 minNum = 2.0 minVarianceProp = 0.001 |
| RF | breakTiesRandomly:True numIterations = 100 numFeatures = 0 |
| RotF | classifier: Random Forest numberOfGroups: False projectionFilter: PrincipalComponents |
| kNN | k = 1 Search Algorithm: LinearNNSearch with Euclidean cross-validate = True |
| AdaBoostM1 | classifier: Random Forest resume: True useResampling: True |
| Stacking | classifiers: Random Forest and AdaBoostM1 metaClassifier: Logistic Regression numFolds = 10 |
| Voting | classifiers: Random Forest and AdaBoostM1 combinationRule: average of probabilities |
| Bagging | classifiers: Random Forest printClassifiers: True storeOutOfBagPredictions: True |
Table 5.
Performance of ML models before and after SMOTE into class “No” with 10-fold cross-validation.
Table 5.
Performance of ML models before and after SMOTE into class “No” with 10-fold cross-validation.
| Class “No” | Precision | Recall | ||
|---|---|---|---|---|
| No SMOTE | SMOTE | No SMOTE | SMOTE | |
| NB | 0.429 | 0.671 | 0.679 | 0.831 |
| SVM | 0.000 | 0.648 | 0.000 | 0.908 |
| LR | 0.544 | 0.659 | 0.261 | 0.826 |
| MLP | 0.415 | 0.653 | 0.297 | 0.787 |
| 1-NN | 0.405 | 0.670 | 0.467 | 0.744 |
| J48 | 0.391 | 0.647 | 0.055 | 0.792 |
| RF | 0.495 | 0.763 | 0.291 | 0.848 |
| RT | 0.475 | 0.717 | 0.509 | 0.717 |
| RepTree | 0.358 | 0.687 | 0.206 | 0.763 |
| RotF | 0.564 | 0.726 | 0.321 | 0.884 |
| AdaBoostM1 | 0.529 | 0.756 | 0.442 | 0.853 |
| Stacking | 0.494 | 0.770 | 0.255 | 0.831 |
| Bagging | 0.494 | 0.749 | 0.267 | 0.853 |
| Voting | 0.515 | 0.791 | 0.309 | 0.875 |
Table 6.
Performance evaluation of ML models after SMOTE with 10-fold cross-validation.
| Accuracy | Precision | Recall | F-Measure | AUC | |
|---|---|---|---|---|---|
| NB | 0.711 | 0.724 | 0.711 | 0.707 | 0.771 |
| SVM | 0.708 | 0.748 | 0.708 | 0.708 | 0.708 |
| LR | 0.700 | 0.713 | 0.700 | 0.700 | 0.754 |
| MLP | 0.690 | 0.701 | 0.690 | 0.690 | 0.742 |
| 1-NN | 0.688 | 0.691 | 0.688 | 0.687 | 0.693 |
| J48 | 0.732 | 0.733 | 0.732 | 0.732 | 0.735 |
| RF | 0.794 | 0.798 | 0.793 | 0.793 | 0.877 |
| RT | 0.718 | 0.717 | 0.717 | 0.717 | 0.717 |
| RepTree | 0.708 | 0.710 | 0.708 | 0.707 | 0.761 |
| RotF | 0.775 | 0.789 | 0.775 | 0.773 | 0.869 |
| AdaBoostM1 | 0.795 | 0.797 | 0.795 | 0.795 | 0.879 |
| Stacking | 0.794 | 0.795 | 0.793 | 0.793 | 0.881 |
| Bagging | 0.785 | 0.791 | 0.785 | 0.784 | 0.872 |
| Voting | 0.801 | 0.804 | 0.801 | 0.801 | 0.884 |
Table 7.
Illustration of proposed models from works based on the same dataset [37].
Table 7.
Illustration of proposed models from works based on the same dataset [37].
| Research Work | Proposed Model | Accuracy |
|---|---|---|
| Present Work | Voting | 80.10% |
| [70] | NB | 75.54% |
| [71] | MAMFFN | 75.30% |
| [72] | SVM | 75.04% |
| [73,74,75,76,77] | LR | 75% |
| [78] | kNN | 74.67% |
| [79] | AdaBoostM1 | 74.36% |
| [80] | RT | 74.20% |
| [81] | KNNWFST | 74% |
| [82] | Back Propagation | 73.20% |
| [83] | Gradient Tree Boosting | 72% |
| [84,85] | RF | 71.87% |
| [86] | CHIRP | 71.30% |
| [87] | DT | 69.40% |
| [88] | Bagging | 69.30% |
Disclaimer/Publisher’s Note: The statements, opinions and data contained in all publications are solely those of the individual author(s) and contributor(s) and not of MDPI and/or the editor(s). MDPI and/or the editor(s) disclaim responsibility for any injury to people or property resulting from any ideas, methods, instructions or products referred to in the content. |
© 2023 by the authors. Licensee MDPI, Basel, Switzerland. This article is an open access article distributed under the terms and conditions of the Creative Commons Attribution (CC BY) license (https://creativecommons.org/licenses/by/4.0/).
Share and Cite
MDPI and ACS Style
Dritsas, E.; Trigka, M. Supervised Machine Learning Models for Liver Disease Risk Prediction. Computers 2023, 12, 19. https://doi.org/10.3390/computers12010019
AMA Style
Dritsas E, Trigka M. Supervised Machine Learning Models for Liver Disease Risk Prediction. Computers. 2023; 12(1):19. https://doi.org/10.3390/computers12010019
Chicago/Turabian StyleDritsas, Elias, and Maria Trigka. 2023. "Supervised Machine Learning Models for Liver Disease Risk Prediction" Computers 12, no. 1: 19. https://doi.org/10.3390/computers12010019
Note that from the first issue of 2016, this journal uses article numbers instead of page numbers. See further details here.