
Brain Tumor Segmentation of MRI Images Using Processed Image Driven U-Net Architecture
by
 , ,
, ,
Anuja Arora
1 ,
,
Ambikesh Jayal
2,*,
Mayank Gupta
1,
Prakhar Mittal
1 and
Suresh Chandra Satapathy
3 1
Deptartment of Computer Science and Information Technology, Jaypee Institute of Information Technology, Noida 201310, India
2
School of Information Systems and Technology, University of Canberra, Australian Capital Territory 2617, Australia
3
School of Computer Engineering, KIIT Deemed to Be University, Bhubaneswar 751024, India
*
Author to whom correspondence should be addressed.
Computers 2021, 10(11), 139; https://doi.org/10.3390/computers10110139
Submission received: 4 October 2021
/
Revised: 20 October 2021
/
Accepted: 21 October 2021
/
Published: 28 October 2021
(This article belongs to the Special Issue Advances of Machine and Deep Learning in the Health Domain)
Abstract
:Brain tumor segmentation seeks to separate healthy tissue from tumorous regions. This is an essential step in diagnosis and treatment planning to maximize the likelihood of successful treatment. Magnetic resonance imaging (MRI) provides detailed information about brain tumor anatomy, making it an important tool for effective diagnosis which is requisite to replace the existing manual detection system where patients rely on the skills and expertise of a human. In order to solve this problem, a brain tumor segmentation & detection system is proposed where experiments are tested on the collected BraTS 2018 dataset. This dataset contains four different MRI modalities for each patient as T1, T2, T1Gd, and FLAIR, and as an outcome, a segmented image and ground truth of tumor segmentation, i.e., class label, is provided. A fully automatic methodology to handle the task of segmentation of gliomas in pre-operative MRI scans is developed using a U-Net-based deep learning model. The first step is to transform input image data, which is further processed through various techniques—subset division, narrow object region, category brain slicing, watershed algorithm, and feature scaling was done. All these steps are implied before entering data into the U-Net Deep learning model. The U-Net Deep learning model is used to perform pixel label segmentation on the segment tumor region. The algorithm reached high-performance accuracy on the BraTS 2018 training, validation, as well as testing dataset. The proposed model achieved a dice coefficient of 0.9815, 0.9844, 0.9804, and 0.9954 on the testing dataset for sets HGG-1, HGG-2, HGG-3, and LGG-1, respectively.
1. Introduction
A brain tumor can be defined as a cancerous or noncancerous mass or development of abnormal cells in the brain. Gliomas can be categorized into High-Grade Glioma (HGG) and Low-Grade Glioma (LGG), based on the pathological assessment of the tumor. Brain tumor segmentation seeks to separate healthy tissue from tumorous regions. This is a crucial step in analysis and treatment planning to improve the possibility of effective treatment. Nowadays, biological science has emerged with several extended research problems under the category of Digital Image Processing (DIP). The detection of the tumor and its classification, detection of the cancerous region and its classification, testing, and inspecting crucial parts of the human body are some applications that fall under this category. Out of various medical science problems, automatic brain tumor segmentation and detection is of utmost importance, and efforts are being made in order to effectively handle this problem. A January 2020 Cancer.net editorial approved a report that estimated that this year, 23,890 adults, i.e., 13,590 males and 10,300 females, will be identified with cancerous tumors of the brain and spinal cord in the USA. In general, brain tumor diagnosis usually starts with Magnetic Resonance Imaging (MRI). The suspicious regions are separated using magnetic resonance segmentation using a complicated clinical imaging process. MRI is the most commonly used process that highlights the tumorous region in the brain, although brain tumor detection is still a manual process, examined and validated by experts. Thus, we require a compelling process to identify brain tumors in the early stage to save patients with high accuracy. There are some issues in the manual process, due to which the automatic detection of brain tumors becomes pivotal. Computer-aided detection of abnormal growth of tissue is primarily motivated by the necessity of reducing human error and thus achieving maximum possible accuracy. Using automated algorithms for the accurate and robust predictions of overall survival for patients diagnosed with gliomas can provide valuable guidance for diagnosis and necessary treatment. Furthermore, there is a lack of skilled Oncologists and Neurologists, especially in developing countries. According to a report in 2018, the country is facing a severe shortage of caregivers, with merely 2000 oncologists looking after around 10 million patients (https://timesofindia.indiatimes.com/india/India-has-just-2000-oncologists-for-10-million-patients/articleshow/50842842.cms). Owing to the presence of abnormalities, no conventional technique can be developed for the segmentation of brain tumors in the medical field. Generally, magnetic resonance image (MRI) scans are utilized for the proper examination and diagnosis of brain tumors. This study systematically works on the detection of brain tumors using MRI images [1]. Owing to the profound significance of machine learning and deep learning, a vast number of methods have been developed, mostly using a specific technique, i.e., machine learning or deep learning [2]. Despite initiating a breakthrough in handling tumor detection tasks, existing applied deep learning models have some drawbacks. CNN-based deep learning techniques require high volume data, which makes it a complex and expensive task. Massive features are necessary to train tumor detection and segmentation accurately. However, the U-net model of CNN has shown great help in prognosticating in medical image segmentation. In recent literature, numerous works are done either using variation in U-Net architecture or with some pre/post-filtering for outcome improvisation. A Multi-Inception-UNet architecture is proposed to improve scalability and is applied to BraTs 2015, 2017, and 2019 datasets [3]. This is considered the latest work done in this same direction with the help of this same U-Net Model. MRI Brain Tumor segmentation is validated using 3D-UNet on the BraTs’20 dataset, where the author achieved an accuracy of 0.83 on the training set and 0.82 on the validation set [4]. The proposed work is somewhat motivated by the work done by Jurdi et al. in June 2020; in their work, U-Net with Bounding Box Prior is applied to two public datasets—SegTHOR is Computed Tomography (CT) images and another Cardiac dataset is a mono-modal MRI dataset. A bounding box (BB) filter is inserted at the BBConV Layer, by which researchers can achieve approximately 98.32% average dice coefficient [5]. Henceforth, in this study, a systematic process is performed for the detection of brain tumors using MRI images. The experimentation uses U-Net to exhibit the knowledge of deep learning models for tumor image segmentation. The deep learning model is applied for MRI segmentation on the BraTS 2018 dataset (https://www.med.upenn.edu/sbia/brats2018/data.html), which contains four different MRI modalities—T1, T2, T1Gd, and FLAIR of each patient (see Figure 1).
Corresponding to each patient, the segmented tumor region and OT (ground truth of tumor segmentation) are stated. Although experiments are primarily carried out on the BraTS dataset, a list of datasets used to perform brain tumor detection tasks is also tabulated in Table 1 for the readers’ point of view.
In the proposed work, the tumor region in the MRI scan is segmented using a U-Net-based deep learning model which has a fully connected Convolutional Neural Network (CNN) foundation. Some image processing methods such as narrow object region filter along with subset division, category brain slicing, and feature scaling are incorporated before inputting the processed image to the deep learning model. Research work is done in the same direction and some pre-filters and feature scaling are employed to get the improved dice coefficient; the result section (Section 5) demonstrates success in getting high accuracy in tumor segmentation.
The major contributions of this project can be summarized as:
- Explored advanced deep learning models in depth and proved the conjectured performance evidence of U-Net deep learning models for brain tumor image segmentation for detection.
- Experimented segmentation with standard U-Net, further explored and incorporated subset division, category brain slicing, feature scaling, and narrow object region filtering prior to feeding to U-Net model and examined the performance enhancement of U-Net architecture by incorporating all these pre-learning processes.
- Specifically examined some challenging unsuccessful tumor segmentation test cases and observe a substantial parameter tuning for result refinement.
- The manuscript presented a state-of-the-art brain tumor detection technique which, in combination with a few image processing processes, followed by a deep learning model, can provide accurate brain tumor segmentation. Undoubtedly, this approach can assist in the medical workflow as well as give clinical direction in identification, therapy planning, and later evaluations.
The fragments of this manuscript are organized as follows. Section 2 presents a comprehensive study covering existing literature on MRI tumor detection, classification, and segmentation with the aim to assist researchers in developing an efficacious model that automatically detects the tumor from an MRI image. Section 3 presents the material used to perform the experiments and the research flow of the proposed methodology implemented to achieve high accuracy. After presenting the research flow, the methodology is discussed in Section 4, which subsequently gives the overall process of pre-learning techniques and the U-Net deep-learning model in Section 4.1 and Section 4.2. Experimental setup and results are detailed in Section 5; this section presents the used evaluation measure, model outcome observations, and performance evaluation outcome. Finally, Section 6 concludes the manuscript.
2. Related Work
The literature has expanded significantly in order to handle brain tumor detection using MRI scan images, intensifying the need to review and summarize used methodologies, associated datasets, and performance achieved. The work in this area uses brain tumor detection work with the use of machine learning techniques. Machine learning models require feature data to learn the tumor detection system. Therefore, the most commonly used technique in the research literature for feature extraction is the gray level co-occurrence matrix (GLCM) [11,16,17,18]. In the first instance under artificial intelligence, machine learning techniques are applied to extracted features; some are SVM [19,20,21], Adaboost [16], Neural Network [22], KNN Classifier [23], Naïve Bayes [12], Fuzzy C Means [24], bagging [25], or Mathematical Morphological Reconstruction [21]. Secondly, the research direction moves towards self-activating feature generation, i.e., learning models themselves will generate features. Hence, researchers started using CNN [9,26], its variants, and pre-trained CNN models [27]. Despite initiating a breakthrough in handling tumor detection tasks, existing applied deep learning models have some drawbacks. Most automatic brain tumor segmentation methods, as suggested in various research, use hand-crafted features such as edges, corners, histogram of gradient, local binary patterns, etc. In these methods, the focus has been on the implementation of a classical machine learning pipeline. The intended features are first extracted and then given to a classifier. The training procedure of the classifier is not affected by the nature of those features. CNN-based deep learning techniques require high volume data, which makes it a complex and expensive task. Massive features are necessitated to accurately train tumor detection and segmentation [28]. However, the U-net model of CNN has shown great help in prognosticating in medical image segmentation. Researchers even quoted in their work that U-Net, which is an advanced CNN model, has the potential to work best for brain tumor detection, and the same has been shown by using this advanced segmentation image generation model for tumor segmentation [29,30]. Therefore, the researcher’s direction took a turn towards specific work done using U-Net Architecture and this section strives to introduce the latest developments in the domain of brain tumor detection using deep learning techniques. Recent U-Net-specific work for brain tumor detection is enlisted in Table 2. U-Net Accuracy is measured using Dice Score Coefficient; the dice score achieved in U-Net specific work is also stated in the table, along with the methodology used. All the work was done in the BraTS 2018 dataset, and classification is done in three classes—Enhancing Tumor (ET), Whole Tumor (WT), and Core Tumor (CT).
Dong et al. worked on automatic brain tumor detection and segmentation using U-Net architecture for the BraTs 2015 dataset [31]. The dataset was normalized for each sequence of the multimodal MI images by subtracting the mean of each sequence and dividing it by its standard deviation. Furthermore, the extension in the dataset was done using several data augmentation techniques. The evaluation was done using a five-fold cross-validation method for the HGG and LGG data, respectively. For each patient, they were validated on three sub-tumoral regions, namely the complete tumor region, the core tumor region, and the enhancing tumor region. The dice similarity coefficient (DSC) for the complete, core, and enhancing tumor region is 0.88, 0.87, and 0.81 for HGG, respectively, and 0.84, 0.85, and 0.89 for LGG, respectively. The combined DSC score is 0.86, 0.86, and 0.85, respectively. There are still some limitations of the current work. First, the segmentation method was evaluated using a cross-validation scheme, which can provide an unbiased predictor, but running the model on a separate and independent testing dataset may produce a more objective evaluation. Secondly, several parameters need to be carefully tuned in the network. Currently, all the parameters were determined via an empirical study [31]. Sun et al. proposed a deep learning ensemble model in which three different 3DCNN architectures are used—(1) Cascaded Anisotropic Convolutional Neural Network (CA-CNN), in which the cascade is used to convert multi-class segmentation problem into a sequence of three hierarchical binary segmentation problems; (2) DFKZ Net DKZ Net uses a context encoding pathway that extracts abstract representations of the input, and a decoding pathway used to recombine these representations; and (3) 3D U-Net, which consists of a contracting path to capture the context and a symmetric expanding path that enables precise localization with extension [32]. Ensemble experiments are tested on the BraTS 2018 dataset. At the validation stage, the ensemble model had a classification accuracy of 46.4% while at the testing stage, the accuracy was 61%. The specificity of the ensemble model is much higher than the sensitivity, which indicates an under-segmentation of the model. The limited number of samples to train the regression model lowered the accuracy, and for improvement, feature selection methods should be optimized for survival prediction.
Tuan et al. worked on the BraTS 2018 dataset and used bit-plane and U-Net. Their proposed approach starts with Bit-plane to get the most significant and least significant bits which can cluster and generate more images, followed by U-Net to segment all glioma regions [33]. This research work implemented the U-NET with multiple kernels to get better performance. Furthermore, the result is evaluated without any additional data, and it demonstrated promising performance with a mean dice score of 0.82, 0.68, and 0.70 for the whole tumor (WT), enhancing tumor (ET), and tumor core (TC), respectively.
In the present work, and with some advancement, the achieved accuracy is better compared to existing work. One optimistic modification was proposed by Cahall et al. in 2019 by introducing an end-to-end brain tumor segmentation framework that utilizes a modified U-Net architecture with Inception modules to accomplish multi-scale feature extraction [36]. Moreover, the author evaluated the impact of training various models to segment the glioma sub-regions directly rather than the intra-tumoral structures. Both learning regimes were incorporated into a new loss function based on the Dice similarity coefficient. It was noticed that for intra-tumoral structures, adding Inception modules to the U-Net resulted in significant improvements in WT (DSC improved from 0.903 to 0.925), TC (0.938 to 0.952), and ET (0.937 to 0.948). For the glioma sub-regions, adding Inception modules to the U-Net also resulted in improvements in WT (0.898 to 0.918), TC (0.942 to 0.951), and ET (0.942 to 0.948). The study performed by Çinar et al. in 2021 applied various pre-trained CNN models—AlexNet, GoogleNet, ResNet50, and DenseNet201. In their work, a hybrid-improved deep learning model is introduced by which achieved accuracy is 97.01 [38].
Kermi et al. in 2019 used the BraTS 2018 dataset and during preprocessing, the researchers removed 1% of the highest and lowest intensities, then each modality of MR images was normalized [39]. To address the class imbalance problem in the data, various data augmentation techniques were employed, such as rotation, translation, and horizontal flipping and mirroring. As the deep learning model CNN is used with similar architecture as that of U-net. The designed network was trained with axial slices extracted from the training MRI set, including HGG and LGG cases, and the corresponding ground truth segmentations. The accuracy of the work is evaluated using the dice coefficient where the enhanced tumor, whole tumor, and core tumor detection dice coefficient is 0.717, 0.867, and 0.798, respectively. Our target is to provide an improved deep-learning-based model that can overcome the shortcomings of manual analysis of brain MRI scans, thus saving time and improving the accuracy of detecting abnormalities in the human brain.
3. Material and Research Flow
The studied literature broadens the understanding of the principal practices used to get the best performance and efficiency. Based on the studied literature, the brain tumor MRI scan dataset was taken for experimental consideration and a research flow was designed to achieve the research objective.
3.1. Material
The MICCAI BraTS 2018 dataset was acquired from the University of Pennsylvania’s Perelman School of Medicine. The data provided as part of BraTS 2018 was co-registered to the same anatomical template and interpolated to the same resolution of 1 mm3 and it was also skull-stripped. The BraTS dataset contains brain images of patients in each category—HGG (High-Grade Glioma) and LGG (Low-Grade Glioma). There is a different folder for each patient. The dataset contains four modalities and the segmented results for each patient. The different modalities are—Native (T1), T2-weighted (T2), post-contrast T1-weighted (T1Gd), and T2 Fluid Attenuated Inversion Recovery (FLAIR). Corresponding to each record, a tumor-segmented region and ground truth of tumor segmentation (OT) are provided in the BraTS 2018 dataset. The ground truth contains annotations of three nested subregions—Whole Tumor (WT), Tumor Core (TC), and enhancing tumor (ET). Two more datasets for testing and validation are provided along with that. The dataset details are enlisted in Table 3. The validation set was designed for intermediate evaluation, i.e., can be validated through multiple submissions, whereas the test set only has final submissions, and no intermediate evaluations are available. Table 3 provides the dataset size for the training, test, and validation sets. The multimodal scans in the BraTS dataset are available as NIfTI files (.nii.gz). The OT (ground truth of tumor segmentation/segmented result) is analyzed for comparison with our predicted output. All the imaging datasets were segmented manually and their annotations were affirmed by experienced neuroradiologists.
3.2. Research Flow
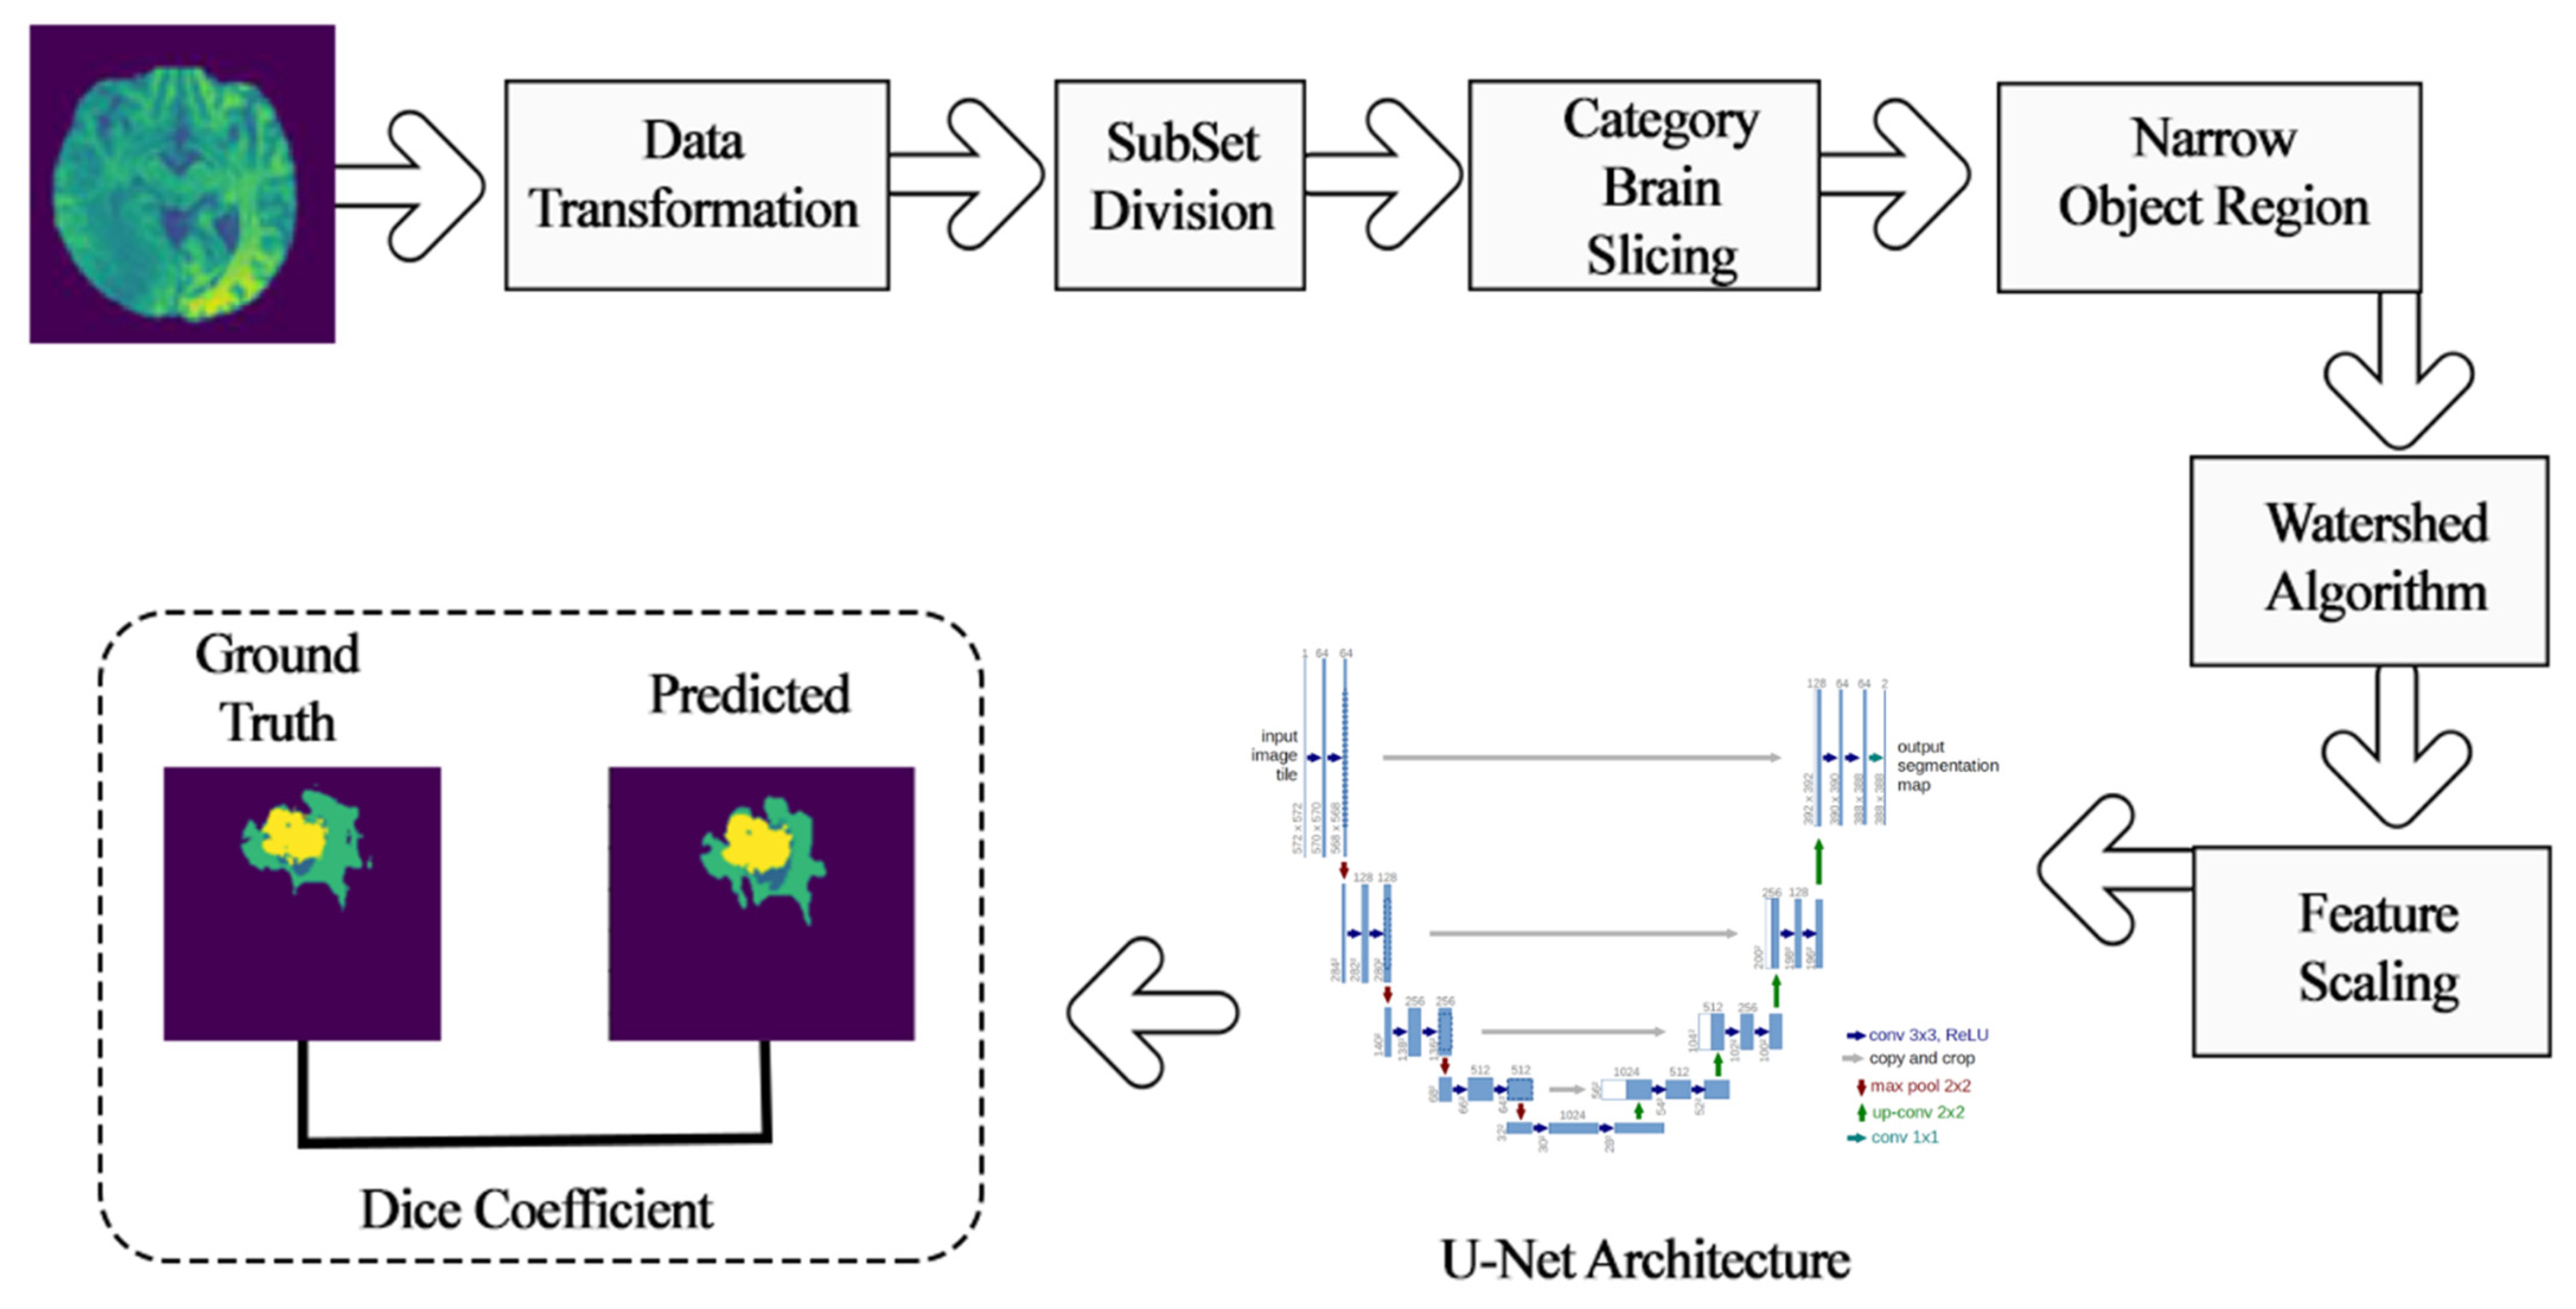
This section details the research flow of the work done in order to achieve the best accuracy for brain tumor detection using MRI scans. The research flow was designed to extract tumor segmented regions in comparison to classification. The input images were taken from the well-known BraTs 2018 dataset. Broadly, this research work was performed in two steps—(1) pre-learning process techniques and (2) deep-learning model for tumor image segmentation. Under pre-learning, the process started with a data transformation, which converted the brain tumor image dataset into a python machine-readable format. The subset division step was done to divide the dataset as the formed dataset is large in size and has resources restriction. Furthermore, category brain slicing and narrow object regions downsized the images by removing unnecessary content from the input image. Basic level image segmentation was accomplished by a watershed algorithm, and finally, feature scaling was applied to standardize the independent features, which ended the pre-learning process.
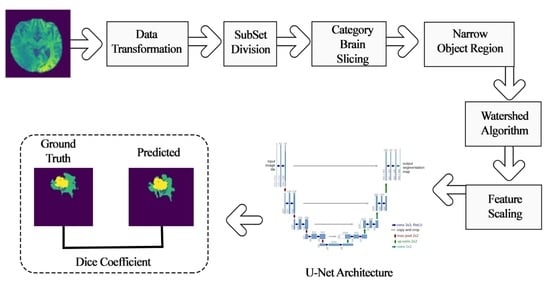
For biomedical imaging research problems, image localization is a specialized and essential task that needed an adequate deep learning mode. Therefore, U-Net architecture is the most preferable model for localization in the image out of variants of conventional convolutional neural network models. U-Net architecture aims to pinpoint the localized region of brain tumors. The strength of U-Net architecture is to identify unclear and irregular discontinuities and boundaries to a great extent, which was otherwise posing a great challenge, especially against edge-based methods for tumor region detection research problems. The last need of the research is to evaluate the performance of the research methodology, for which dice coefficient and loss function has been validated for the achieved outcome of deep learning-based segmentation. This performance measure is applicable to quantify the performance of the segmented tumor region. The overall framework is shown in Figure 2.
4. Methodology
4.1. Pre-Learning Process Techniques
4.1.1. Data Transformation
As mentioned in the data above (Section 3.1), the multimodal scans in BraTS 2018 dataset were formatted in NIfTI files (.nii.gz). All the given images were processed to convert from the .nii.gz format to NumPy arrays. This was done using Python’s SimpleITK library. Since the given data was already skull-stripped, each patient’s MRI scan volumes were collected and directly combined to form a Numpy array. The formed Numpy array is of size (X, S, D, D, N), where
X: number of HGG/LGG data (BraTS 2018 contains 210 patients’ scans under HGG and 75 patients’ scans under LGG);
S: number of total 2D slices corresponding to each MRI 3D volume imagery
D: dimensions of each 2D slice
N: number of modalities.
4.1.2. Subset Division
The formed Numpy array is of a large size, which required high RAM availability for further pre-processing and training. The data was handled by dividing it into four subsets, namely HGG-1, HGG-2, HGG-3, and LGG-1. This was done in an effort to reduce RAM consumption and feed the data sequentially. BraTS 2018 contains 210 patients’ scans under HGG and 75 patients’ scans under LGG. Thus, the HGG data was divided into three sets, each consisting of 70 patients’ scans, and the LGG data was considered as the fourth set. Similarly, the corresponding ground truth scans were also extracted and divided into four subsets.
4.1.3. Category Brain Slicing
All the 2D slices corresponding to each MRI 3D volume image would not show the tumor region. Thus, the slices which can contain the tumor region were grouped to get better accuracy. This implementation of brain slicing can be automated by learning features or set manually by excluding some first and end slices. Thus, from the 155 slices that corresponded to each MRI 3D volume imager, only the mid-portion, i.e., from the 30th slice to 120th slice, was taken to generate the sliced data.
4.1.4. Narrow Object Region
Each 2D image can be cropped to discard the unnecessary background and implement deep learning effectively. The images were, therefore, resized before feeding them to the architecture. Thus, to narrow the object region, we cropped the image size from (240,240) to (192,192) for all four modalities.
4.1.5. Watershed Algorithm
To optimize the learning process, we segmented the brain image with a tumor before inputting it to the feature extraction module. The outcome of segmentation rendered two regions of an image—the Tumor Region and the Non-Tumor Region. Watershed algorithm [40] has been used for segmentation, and in our experiments, we used OpenCV’s marker-based watershed algorithm. In this algorithm, one specifies which valley points are to be merged, i.e., included, and which are not, i.e., excluded. In our process, we labeled the region which we were sure of being the foreground or object with one color/intensity and labeled the region which we were sure of being the background, i.e., the non-object with another color. Finally, the region in which we were not sure of anything was labeled with 0—that was our marker. Then, the watershed algorithm was applied. Our marker was updated with the labels we gave, and the boundaries of objects were given a value of −1. An original image and its segmented image using the watershed algorithm are shown in Figure 3a,b, respectively.
4.1.6. Feature Scaling
Feature Scaling is a technique used to standardize independent features provided in the information onto a specified interval. It is a requisite part for tumor detection through the deep-learning process because the learning model uses gradient descent, which converges faster with scaled features as compared to without it. Z-score normalization was applied, which transforms each feature value range from zero to its unit-variance. Z-Score was computed using Equation (1), as given below.
where Z is the Z-transformation value of the specific feature value x, µ is the mean, and σ is the standard deviation of the image features.
4.2. Deep Learning Model for Tumor Region Segmentation
Biomedical image processing needs specialized deep learning techniques due to localization requirements to achieve the desired outcome. In the considered problem, localization aims to pinpoint the position of the tumor regions while locating, for example, attempts to assign a class label to each pixel. Standardized convolution neural networks are not apt for biomedical image segmentation problems as these models are used for classification tasks to assign each image a corresponding class label rather than to identify the segmented region.
The same U-Net model was used as a deep learning methodology based on fully convolutional neural networks. The main idea is to supplement a usual contracting network by successive layers, where pooling operators are replaced by upsampling operators. Hence, these layers increase the resolution of the output. In order to localize, high-resolution features from the contracting path are combined with the upsampled output. A successive convolution layer can then learn to assemble a more precise output based on this information. In the upsampling part, we have also a large number of feature channels, which allow the network to propagate context information to higher resolution layers. As a consequence, the expansive path is more or less symmetric to the contracting path and yields a u-shaped architecture. Figure 4 illustrates the network architecture, in which each blue box corresponds to a multi-channel feature map. It consists of a contracting path on the left side and an expansive path on the right side. The contracting path follows the typical architecture of a convolutional network. It consists of the repeated application of two 3 × 3 convolutions (unpadded convolutions), each followed by a rectified linear unit (ReLU) and a 2 × 2 max pooling operation with stride three for downsampling.
In our work, at each downsampling step, the numbers of feature channels are doubled. Every step in the expansive path consists of an upsampling of the feature map followed by a 2 × 2 convolution that halves the number of feature channels, a concatenation with the correspondingly cropped feature map from the contracting path, and two 3 × 3 convolutions, each followed by a ReLU. The cropping is necessary due to the loss of border pixels in every convolution. At the final layer, a 1 × 1 convolution is used to map each 64-component feature vector to the desired number of classes. Hence, the U-Net Convolutional networks comprise of two parts:
- A contracting path similar to an encoder to capture the context from a compact feature representation.
- A symmetric expanding path that is similar to a decoder, which allows for accurate localization. This step is done to retain boundary information (spatial information) despite downsampling and max-pooling performed in the encoder stage.
5. Experimental Setup and Results
MRI tumor identification in this work was performed using the deep learning-based segmentation model U-Net. Dice coefficient and loss functions were defined to validate the performance of the experimented approach-predicted segmented brain tumor region. Several python libraries were used to implement the process and validate the performance. Some libraries/packages used are as follows: Pip package, OpenCV, Glob, Mahotas, Numpy-1.14.1, Random, Keras, Tensorflow, Scikit-image, Matplotlib, and Scikit-learn, etc.
5.1. Performance Evaluation Measures
Performance evaluations were used to measure the learning model efficiency on the training and test set for the supervised learning prediction. The output of the U-net deep learning-based detection model was an image that depicts the localized tumor. The comparison in the output image with the original growth truth image was computed to define the difference between the original and predicted tumor region. The dice coefficient was considered more intuitive to measure the output effectiveness of the image segmentation problem [42]. It was used to compute the percentage of overlap between the two images’ ranges, from 0 to 1. A dice coefficient value of 1 denotes perfect and complete overlap. Usually, the dice coefficient has been used in existing medical imaging problems to evaluate the model. Hence, the dice score/coefficient was used to quantify the performance of image segmentation. Dice score is an evaluation measure to know the similarity of the objects. It is defined as the size of the overlap of the two segmentations divided by the total size of the two objects, i.e., the score for a particular class C is the size of the overlap between the predicted region and its true counterpart. The dice coefficient determines the amount of spatial overlap between the ground truth segmentation (X) and the predicted segmentation (Y). The formula to obtain the dice score/coefficient is defined as Equation (2),
where defines the cardinality of the ground truth set X. In medical volumes, it is common that the anatomy of interest is present in only a very small space in the scan. In the task of brain tumor segmentation, the tumor is present in a very compact area. This results in the training procedure getting caught in the local minima of the loss function and causes the predictions to be strongly biased towards the background. Consequently, the foreground region is only partially detected or in some cases, even missing. Several previous approaches made use of loss functions, which use sample re-weighting wherein the background area is provided less importance than the foreground area at the time of training. A novel objective function that is based on the dice coefficient with the intention to maximize the foreground is implied. This definition of the dice coefficient [43] uses the squared sum of X and Y in place of the absolute sum. The dice coefficient score between two binary volumes can then be written as,
5.2. Model Outcome Observations and Refinement
Before going forward to present our deep learning model outcome, we showcased various experiments made during the experimentation in order to refine the results of the deep learning-based model. Table 4 shows some test cases of the deep learning-applied segmentation model U-Net. Test case one and test case three are failed cases and not able to identify tumor region appropriately, whereas test case two, test case four, and test case five are pass test cases as an outcome of the proposed brain tumor detection model.
A brute force debugging strategy was used to refine the model to get the correct predictions. Various test cases were failing initially, and two samples test cases, one and three, are shown in Table 4. Henceforth, U-Net network parameter tuning was performed in order to enhance the dice coefficient accuracy outcome and to reduce loss function. Table 5 shows the accurately detected test cases after parameter tuning and the proposed methodology infers the whole tumor (WT), enhancing tumor (ET), and tumor core (TC) from the segmented regions for clinical application tasks. The model is trained on Google Colab’s GPU instance for 20 epochs on each subset for two iterations and each epoch took approximately three minutes.
5.3. U-Net Deep Learning Model Outcome for Brain Tumor Detection
In addition, to analyze the best performing deep learning model, we also monitored how the model performance is gradually improved with epochs for training and validation datasets. The model was then tested on random test images and the output was compared to the Ground Truth. To quantify the performance of our image segmentation, a Dice score was used. The proposed methodology, where the U-Net deep learning model is used after applying pre-learning techniques, was able to produce a competent outcome. The Dice coefficient outcome of the proposed approach on training, validation, and test set is tabulated in Table 6. After training the network with the U-Net model, the dice coefficients were 0.9955, 0.9965, 0.9962, and 0.9954, obtained for HGG-1, HGG-2, HGG-3, and LGG-1, respectively. The examined validation set and test set dice coefficient is listed in Table 4, which is also efficacious.
The Dice coefficient scores and loss curves of training and validation set for all the subsets (HGG-1, HGG-2, HGG-3, and LGG-1) used in this study are shown in Figure 5. In Figure 5, the model score represents the performance curve of the U-Net-based tumor segmentation model, where the vertical axis indicates the dice coefficient, while the horizontal axis is the number of epochs. The model loss plot is also shown in Figure 5, which shows the gradually decreasing loss with each epoch for both the training set and the validation set. Therefore, the results shown suggest that the proposed methodology is likely to obtain remarkable results in a lesser number of training epochs.
6. Conclusions
A challenging problem of pixel label segmentation of brain tumors using MRI data, which is required for brain tumor diagnostic procedures, was tackled in the present work. The proposed model initially used diverse image processing steps to upgrade the brain image and images provided in sub-regions in a well-defined manner. Undoubtedly, accurate segmentation of a brain tumor into its sub-regions provides a deeper insight into the condition of the tumor. Hence, in the proposed work, image data transformation, image slicing for the refined region (category brain slicing, subset division, and narrow object region), initial level image segmentation (watershed algorithm), and feature scaling were experimented with before inputting in the deep learning model. The U-Net deep learning model was used to localize the tumor region; the contracting part of U-Net captures the context from the compact feature representation and expansion path and performed accurate localization. Parameter tuning of contracting and expansion path layers in a symmetric manner was applied in order to achieve high accuracy. The proposed work achieved high accuracy on approximately 0.99 for the training and validation set and 0.98 for the test set, which is a remarkable performance for brain tumor detection. High dice scores, accuracy, and speed of this network allow for large-scale application in brain tumor segmentation. This method can be implemented in the clinical workflow for reliable tumor segmentation and for providing clinical guidance in diagnosis, surgical planning, and follow-up assessments. Although improvement and future research directions are opened in this as well, some are as follows:
- Developing a reliable system with an easy-to-use user interface for the proposed model. The interface would allow doctors to upload an image and get results on the location of the tumor and its class.
- The model can be enhanced to predict the survivability of patients suffering from a brain tumor.
- Explore a more vigorous system for the huge database of clinical images which could be noisy, be affected by external factors, and have reduced quality.
- Implement the model for the discovery and segmentation of tumors in different parts of the body.
Author Contributions
Conceptualization, A.A. and A.J.; methodology, A.A. and M.G.; validation, M.G., P.M., and A.A.; writing—review and editing, S.C.S.; project administration, A.A., A.J., and S.C.S.; funding acquisition, A.J. All authors have read and agreed to the published version of the manuscript.
Funding
This paper has been supported by the School of Information Systems and Technology, University of Canberra, Australian Capital Territory, 2617, Australia.
Institutional Review Board Statement
Not applicable.
Informed Consent Statement
Not applicable.
Data Availability Statement
The data used in this study are publicly available from University of Pennsylvania’s image processing portal. This data can be downloaded by raising a data request using the link below. https://www.med.upenn.edu/sbia/brats2018/registration.html.
Conflicts of Interest
The authors declare no conflict of interest.
References
- Riries, R.; Ain, K. Edge detection for brain tumor pattern recognition. In Proceedings of the International Conference on Instrumentation, Communication, Information Technology, and Biomedical Engineering, Bandung, Indonesia, 23–25 November 2009; pp. 1–3. [Google Scholar]
- Khare, S.; Bhandari, A.; Singh, S.; Arora, A. ECG Arrhythmia Classification Using Spearman Rank Correlation and Support Vector Machine. Adv. Intell. Soft Comput. 2012, 131, 591–598. [Google Scholar] [CrossRef]
- Urva, L.; Shahid, A.R.; Raza, B.; Ziauddin, S.; Khan, M.A. An end-to-end brain tumor segmentation system using multi-inception-UNET. Int. J. Imaging Syst. Technol. 2021. [Google Scholar] [CrossRef]
- Mora, B.L.; Vilaplana, V. MRI brain tumor segmentation and uncertainty estimation using 3D-UNet architectures. arXiv 2020, arXiv:2012.15294. [Google Scholar]
- Jurdi, E.; Petitjean, R.C.; Honeine, P.; Abdallah, F. Bb-unet: U-net with bounding box prior. IEEE J. Sel. Top. Signal Process. 2020, 14, 1189–1198. [Google Scholar] [CrossRef]
- Mohammadreza, S.; Yang, G.; Lambrou, T.; Allinson, N.; Jones, T.L.; Barrick, T.R.; Howe, F.A.; Ye, X. Automated brain tumour detection and segmentation using superpixel-based extremely randomized trees in FLAIR MRI. Int. J. Comput. Assist. Radiol. Surg. 2017, 12, 183–203. [Google Scholar]
- Abdelrahman, E.; Hussein, A.; AlNaggar, E.; Zidan, M.; Zaki, M.; Ismail, M.A.; Ghanem, N.M. Brain tumor segmantation using random forest trained on iteratively selected patients. In International Workshop on Brainlesion: Glioma, Multiple Sclerosis, Stroke and Traumatic Brain Injuries; Springer: Cham, Switzerland, 2016; pp. 129–137. [Google Scholar]
- Toktam, H.; Hamghalam, M.; Reyhani-Galangashi, O.; Mirzakuchaki, S. A machine learning approach to brain tumors segmentation using adaptive random forest algorithm. In Proceedings of the 2019 5th Conference on Knowledge Based Engineering and Innovation (KBEI), Tehran, Iran, 28 February–1 March 2019; pp. 76–82. [Google Scholar]
- Malathi, M.; Sinthia, P. BrainTumour Segmentation Using Convolutional Neural Network with Tensor Flow. Asian Pac. J. Cancer Prev. 2019, 20, 2095–2101. [Google Scholar] [CrossRef] [Green Version]
- Bangalore, Y.C.G.; Wagner, B.; Nalawade, S.S.; Murugesan, G.K.; Pinho, M.C.; Fei, B.; Madhuranthakam, A.J.; Maldjian, J.A. Fully automated brain tumor segmentation and survival prediction of gliomas using deep learning and mri. In International MICCAI Brainlesion Workshop; Springer: Cham, Switzerland, 2019; pp. 99–112. [Google Scholar]
- Nitish, Z.; Pawar, V. GLCM textural features for brain tumor classification. Int. J. Comput. Sci. Issues 2012, 9, 354. [Google Scholar]
- Tun, Z.H.; Maneerat, N.; Win, K.Y. Brain tumor detection based on Naïve Bayes Classification. In Proceedings of the 2019 5th International Conference on Engineering, Applied Sciences and Technology (ICEAST), Luang Prabang, Laos, 2–5 July 2019; pp. 1–4. [Google Scholar]
- Gadpayleand, P.; Mahajani, P.S. Detection and classification of brain tumor in MRI images. Int. Conf. Adv. Comput. Commun. Syst. 2013, 2320–9569. Available online: https://www.semanticscholar.org/paper/Detection-and-Classification-of-Brain-Tumor-in-MRI-Mahajani/f7faba638847a526c77d75f38f2278224aab363e (accessed on 18 October 2021).
- Bhaskarrao, B.N.; Ray, A.K.; Thethi, H.P. Image analysis for MRI based brain tumor detection and feature extraction using biologically inspired BWT and SVM. Int. J. Biomed. Imaging 2017, 2017, 9749108. [Google Scholar]
- Nabil, I.; Rahman, M.S. MultiRes UNet: Rethinking the U-Net Architecture for Multimodal Biomedical Image Segmentation. Neural Netw. Off. J. Int. Neural Netw. Soc. 2019, 121, 74–87. [Google Scholar]
- Minz, A.; Mahobiya, C. MR image classification using adaboost for brain tumor type. In Proceedings of the 2017 IEEE 7th International Advance Computing Conference (IACC), Hyderabad, India, 5–7 January 2017; pp. 701–705. [Google Scholar]
- Samjith, R.C.P.; Shreeja, R. Automatic brain tumor tissue detection in T-1 weighted MRI. In Proceedings of the 2017 International Conference on Innovations in Information, Embedded and Communication Systems (ICIIECS), Coimbatore, India, 17–18 March 2017; pp. 1–4. [Google Scholar]
- Rosy, K. SVM classification an approach on detecting abnormality in brain MRI images. Int. J. Eng. Res. Appl. 2013, 3, 1686–1690. [Google Scholar]
- Telrandhe, S.R.; Pimpalkar, A.; Kendhe, A. Detection of brain tumor from MRI images by using segmentation & SVM. In Proceedings of the 2016 World Conference on Futuristic Trends in Research and Innovation for Social Welfare (Startup Conclave), Coimbatore, India, 29 February–1 March 2016; pp. 1–6. [Google Scholar]
- Keerthana, T.K.; Xavier, S. An intelligent system for early assessment and classification of brain tumor. In Proceedings of the 2018 Second International Conference on Inventive Communication and Computational Technologies (ICICCT), Thondamuthur, India, 20–21 April 2018; pp. 1265–1268. [Google Scholar]
- Devkota, B.; Alsadoon, A.; Prasad, P.W.C.; Singh, A.K.; Elchouemi, A. Image segmentation for early stage brain tumor detection using mathematical morphological reconstruction. Procedia Comput. Sci. 2018, 125, 115–123. [Google Scholar] [CrossRef]
- Nadir, G.D.; Jehlol, H.B.; Oleiwi, A.S.A. Brain tumor detection using shape features and machine learning algorithms. Int. J. Adv. Res. Comput. Sci. Softw. Eng. 2015, 5, 454–459. [Google Scholar]
- Chavan, V.N.; Jadhav, B.D.; Patil, P.M. Detection and classification of brain tumors. Int. J. Comput. Appl. 2015, 112, 8. [Google Scholar]
- Shahariar, A.M.; Rahman, M.M.; Hossain, M.A.; Islam, M.K.; Ahmed, K.M.; Ahmed, K.T.; Singh, B.C.; Miah, M.S. Automatic human brain tumor detection in MRI image using template-based K means and improved fuzzy C means clustering algorithm. Big Data Cogn. Comput. 2019, 3, 27. [Google Scholar]
- Zoltán, K.; Lefkovits, L.; Szilágyi, L. Automatic detection and segmentation of brain tumor using random forest approach. In International Conference on Modeling Decisions for Artificial Intelligence; Springer: Cham, Switzerland, 2016; pp. 301–312. [Google Scholar]
- Chang, P.D. Fully convolutional neural networks with hyperlocal features for brain tumor segmentation. In MICCAI-BRATS Workshop; 2016; pp. 4–9. Available online: https://www.researchgate.net/publication/315920622_Fully_Convolutional_Deep_Residual_Neural_Networks_for_Brain_Tumor_Segmentation (accessed on 18 October 2021).
- Toraman, S.; Tuncer, S.A.; Balgetir, F. Is it possible to detect cerebral dominance via EEG signals by using deep learning? Med. Hypotheses 2019, 131, 109315. [Google Scholar] [CrossRef]
- Baranwal, S.; Arora, A.; Khandelwal, S. Detecting diseases in plant leaves: An optimised deep-learning convolutional neural network approach. Int. J. Environ. Sustain. Dev. 2021, 20, 166–188. [Google Scholar] [CrossRef]
- Raghav, M.; Arbel, T. 3D U-Net for brain tumour segmentation. In International MICCAI Brainlesion Workshop; Springer: Cham, Switzerland, 2018; pp. 254–266. [Google Scholar]
- Fridman, N. Brain Tumor Detection and Segmentation Using Deep Learning U-Net on Multi-Modal MRI. In Proceedings of the Pre-Conference Proceedings of the 7th MICCAI BraTS Challenge, Granada, Spain, 16 September 2018; pp. 135–143. [Google Scholar]
- Hao, D.; Yang, G.; Liu, F.; Mo, Y.; Guo, Y. Automatic brain tumor detection and segmentation using U-Net based fully convolutional networks. In Annual Conference on Medical Image Understanding and Analysis; Springer: Cham, Switzerland, 2017; pp. 506–517. [Google Scholar]
- Li, S.; Zhang, S.; Chen, H.; Luo, L. Brain tumor segmentation and survival prediction using multimodal MRI scans with deep learning. Front. Neurosci. 2019, 13, 810. [Google Scholar]
- Tuan, T.A. Brain tumor segmentation using bit-plane and unet. In International MICCAI Brainlesion Workshop; Springer: Cham, Switzerland, 2018; pp. 466–475. [Google Scholar]
- Wu, S.; Li, H.; Guan, Y. Multimodal Brain Tumor Segmentation Using U-Net. In Proceedings of the Pre-Conference Proceedings of the 7th MICCAI BraTS Challenge, Granada, Spain, 16 September 2018; pp. 508–515. [Google Scholar]
- Wei, C.; Liu, B.; Peng, S.; Sun, J.; Qiao, X. S3D-UNet: Separable 3D U-Net for brain tumor segmentation. In International MICCAI Brainlesion Workshop; Springer: Cham, Switzerland, 2018; pp. 358–368. [Google Scholar]
- Cahall, D.E.; Rasool, G.; Bouaynaya, N.C.; Fathallah-Shaykh, H.M. Inception modules enhance brain tumor segmentation. Front. Comput. Neurosci. 2019, 13, 44. [Google Scholar] [CrossRef] [Green Version]
- Kamrul, H.S.M.; Linte, C.A. A modified U-Net convolutional network featuring a Nearest-neighbor Re-sampling-based Elastic-Transformation for brain tissue characterization and segmentation. In Proceedings of the 2018 IEEE Western New York Image and Signal Processing Workshop (WNYISPW), Rochester, NY, USA, 5 October 2018; pp. 1–5. [Google Scholar]
- Çinar, A.; Yildirim, M. Detection of tumors on brain MRI images using the hybrid convolutional neural network architecture. Med. Hypotheses 2020, 139, 109684. [Google Scholar] [CrossRef]
- Kermi, A.; Mahmoudi, I.; Khadir, M.T. Deep convolutional neural networks using U-Net for automatic brain tumor segmentation in multimodal MRI volumes. In International MICCAI Brainlesion Workshop; Springer: Cham, Switzerland, 2015; pp. 37–48. [Google Scholar]
- Padmakant, D.; Phegade, M.R.; Shah, S.K. Watershed segmentation brain tumor detection. In Proceedings of the 2015 International Conference on Pervasive Computing (ICPC), Pune, India, 8–10 January 2015; pp. 1–5. [Google Scholar]
- Ronneberger, O.; Fischer, P.; Brox, T. U-net: Convolutional networks for biomedical image segmentation. In International Conference on Medical Image Computing and Computer-Assisted Intervention; Springer: Cham, Switzerland, 2015; pp. 234–241. [Google Scholar]
- Shamir Reuben, R.; Duchin, Y.; Kim, J.; Sapiro, G.; Harel, N. Continuous dice coefficient: A method for evaluating probabilistic segmentations. arXiv 2019, arXiv:1906.11031. [Google Scholar]
- Milletari, F.; Navab, N.; Ahmadi, S.A. V-net: Fully convolutional neural networks for volumetric medical image segmentation. In Proceedings of the 2016 Fourth International Conference on 3D Vision (3DV), Stanford, CA, USA, 25–26 October 2016; pp. 565–571. [Google Scholar]
- Menze, B.H.; Jakab, A.; Bauer, S.; Kalpathy-Cramer, J.; Farahani, K.; Kirby, J.; Burren, Y.; Porz, N.; Slotboom, J.; Wiest, R.; et al. The Multimodal Brain Tumor Image Segmentation Benchmark (BRATS). IEEE Trans. Med Imaging 2015, 34, 1993–2024. [Google Scholar] [CrossRef]
- Bakas, S.; Akbari, H.; Sotiras, A.; Bilello, M.; Rozycki, M.; Kirby, J.S.; Freymann, J.B.; Farahani, K.; Davatzikos, C. Advancing The Cancer Genome Atlas glioma MRI collections with expert segmentation labels and radiomic features. Nat. Sci. Data 2017, 4, 170117. [Google Scholar] [CrossRef] [Green Version]
- Bakas, S.; Reyes, M.; Jakab, A.; Bauer, S.; Rempfler, M.; Crimi, A.; Shinohara, R.T.; Berger, C.; Ha, S.M.; Rozycki, M.; et al. Identifying the Best Machine Learning Algorithms for Brain Tumor Segmentation, Progression Assessment, and Overall Survival Prediction in the BRATS Challenge. arXiv 2018, arXiv:1811.02629. [Google Scholar]
Figure 1.
A sample set of T1, T1-GD, T2, and T2 Flair images (Source: BraTS 2018 Dataset).
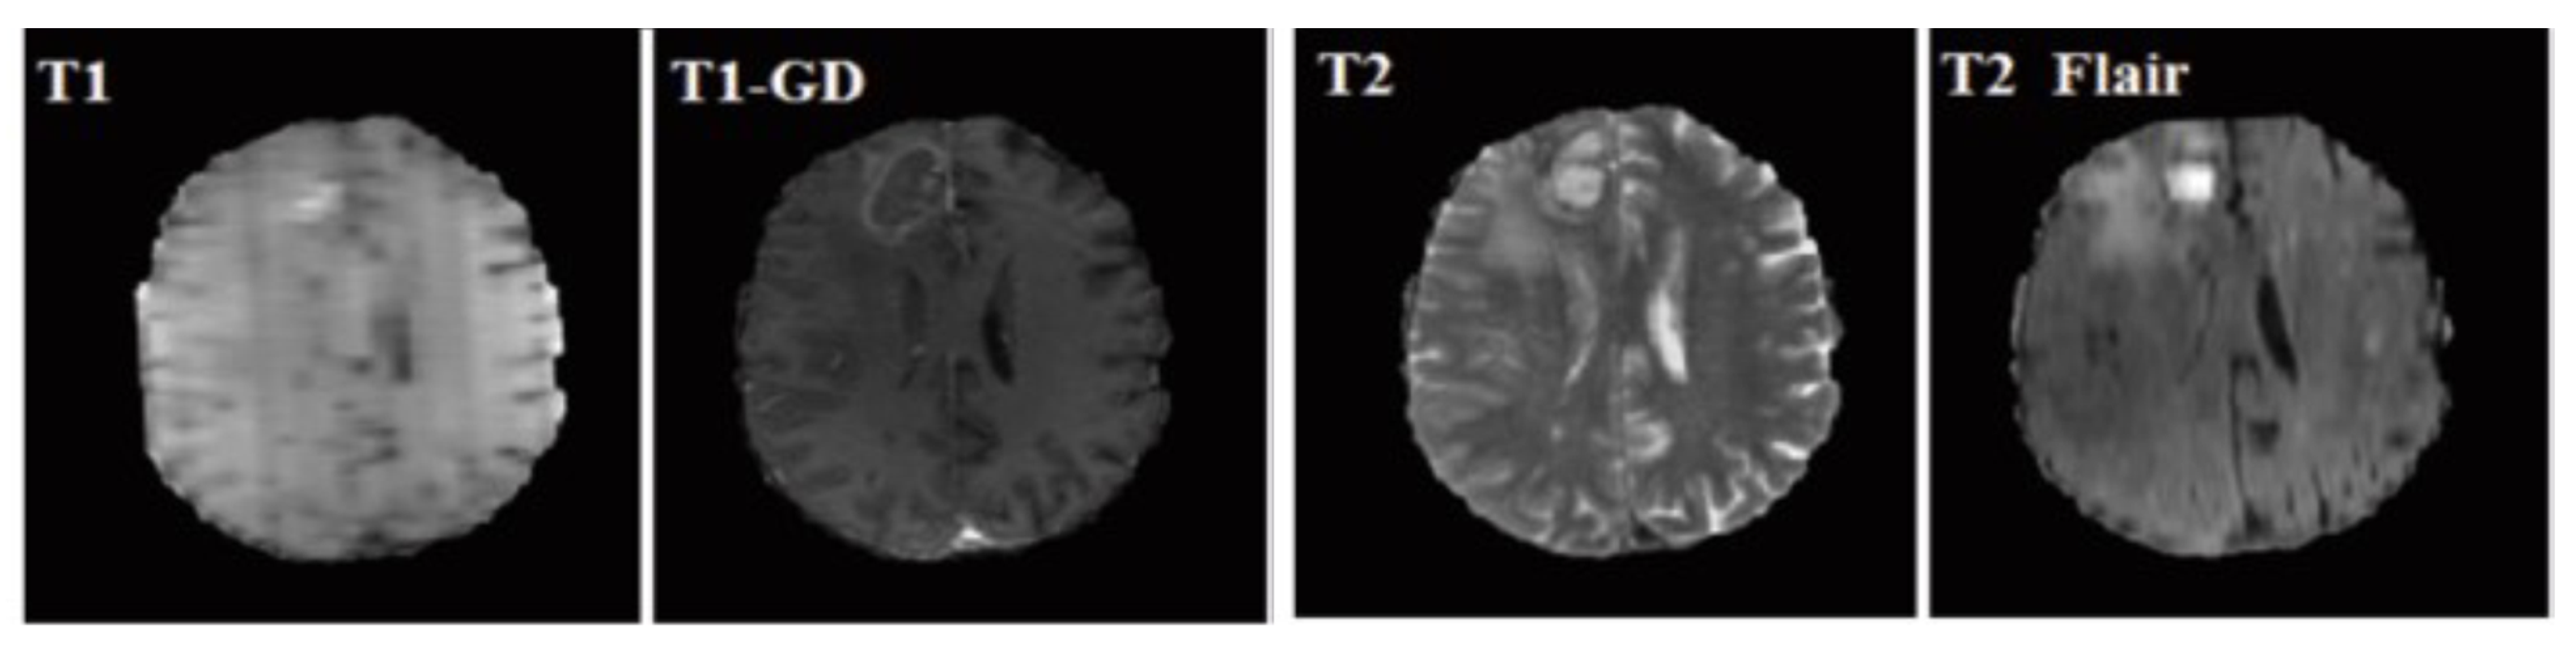
Figure 2.
Deep learning-based tumor detection architecture.
Figure 3.
Watershed algorithm outcome. (a) Original image; (b) Segmented image.

Figure 4.
U-Net architecture (example for 32 × 32 pixels in the lowest resolution) (Figure taken from [41]).
Figure 4.
U-Net architecture (example for 32 × 32 pixels in the lowest resolution) (Figure taken from [41]).
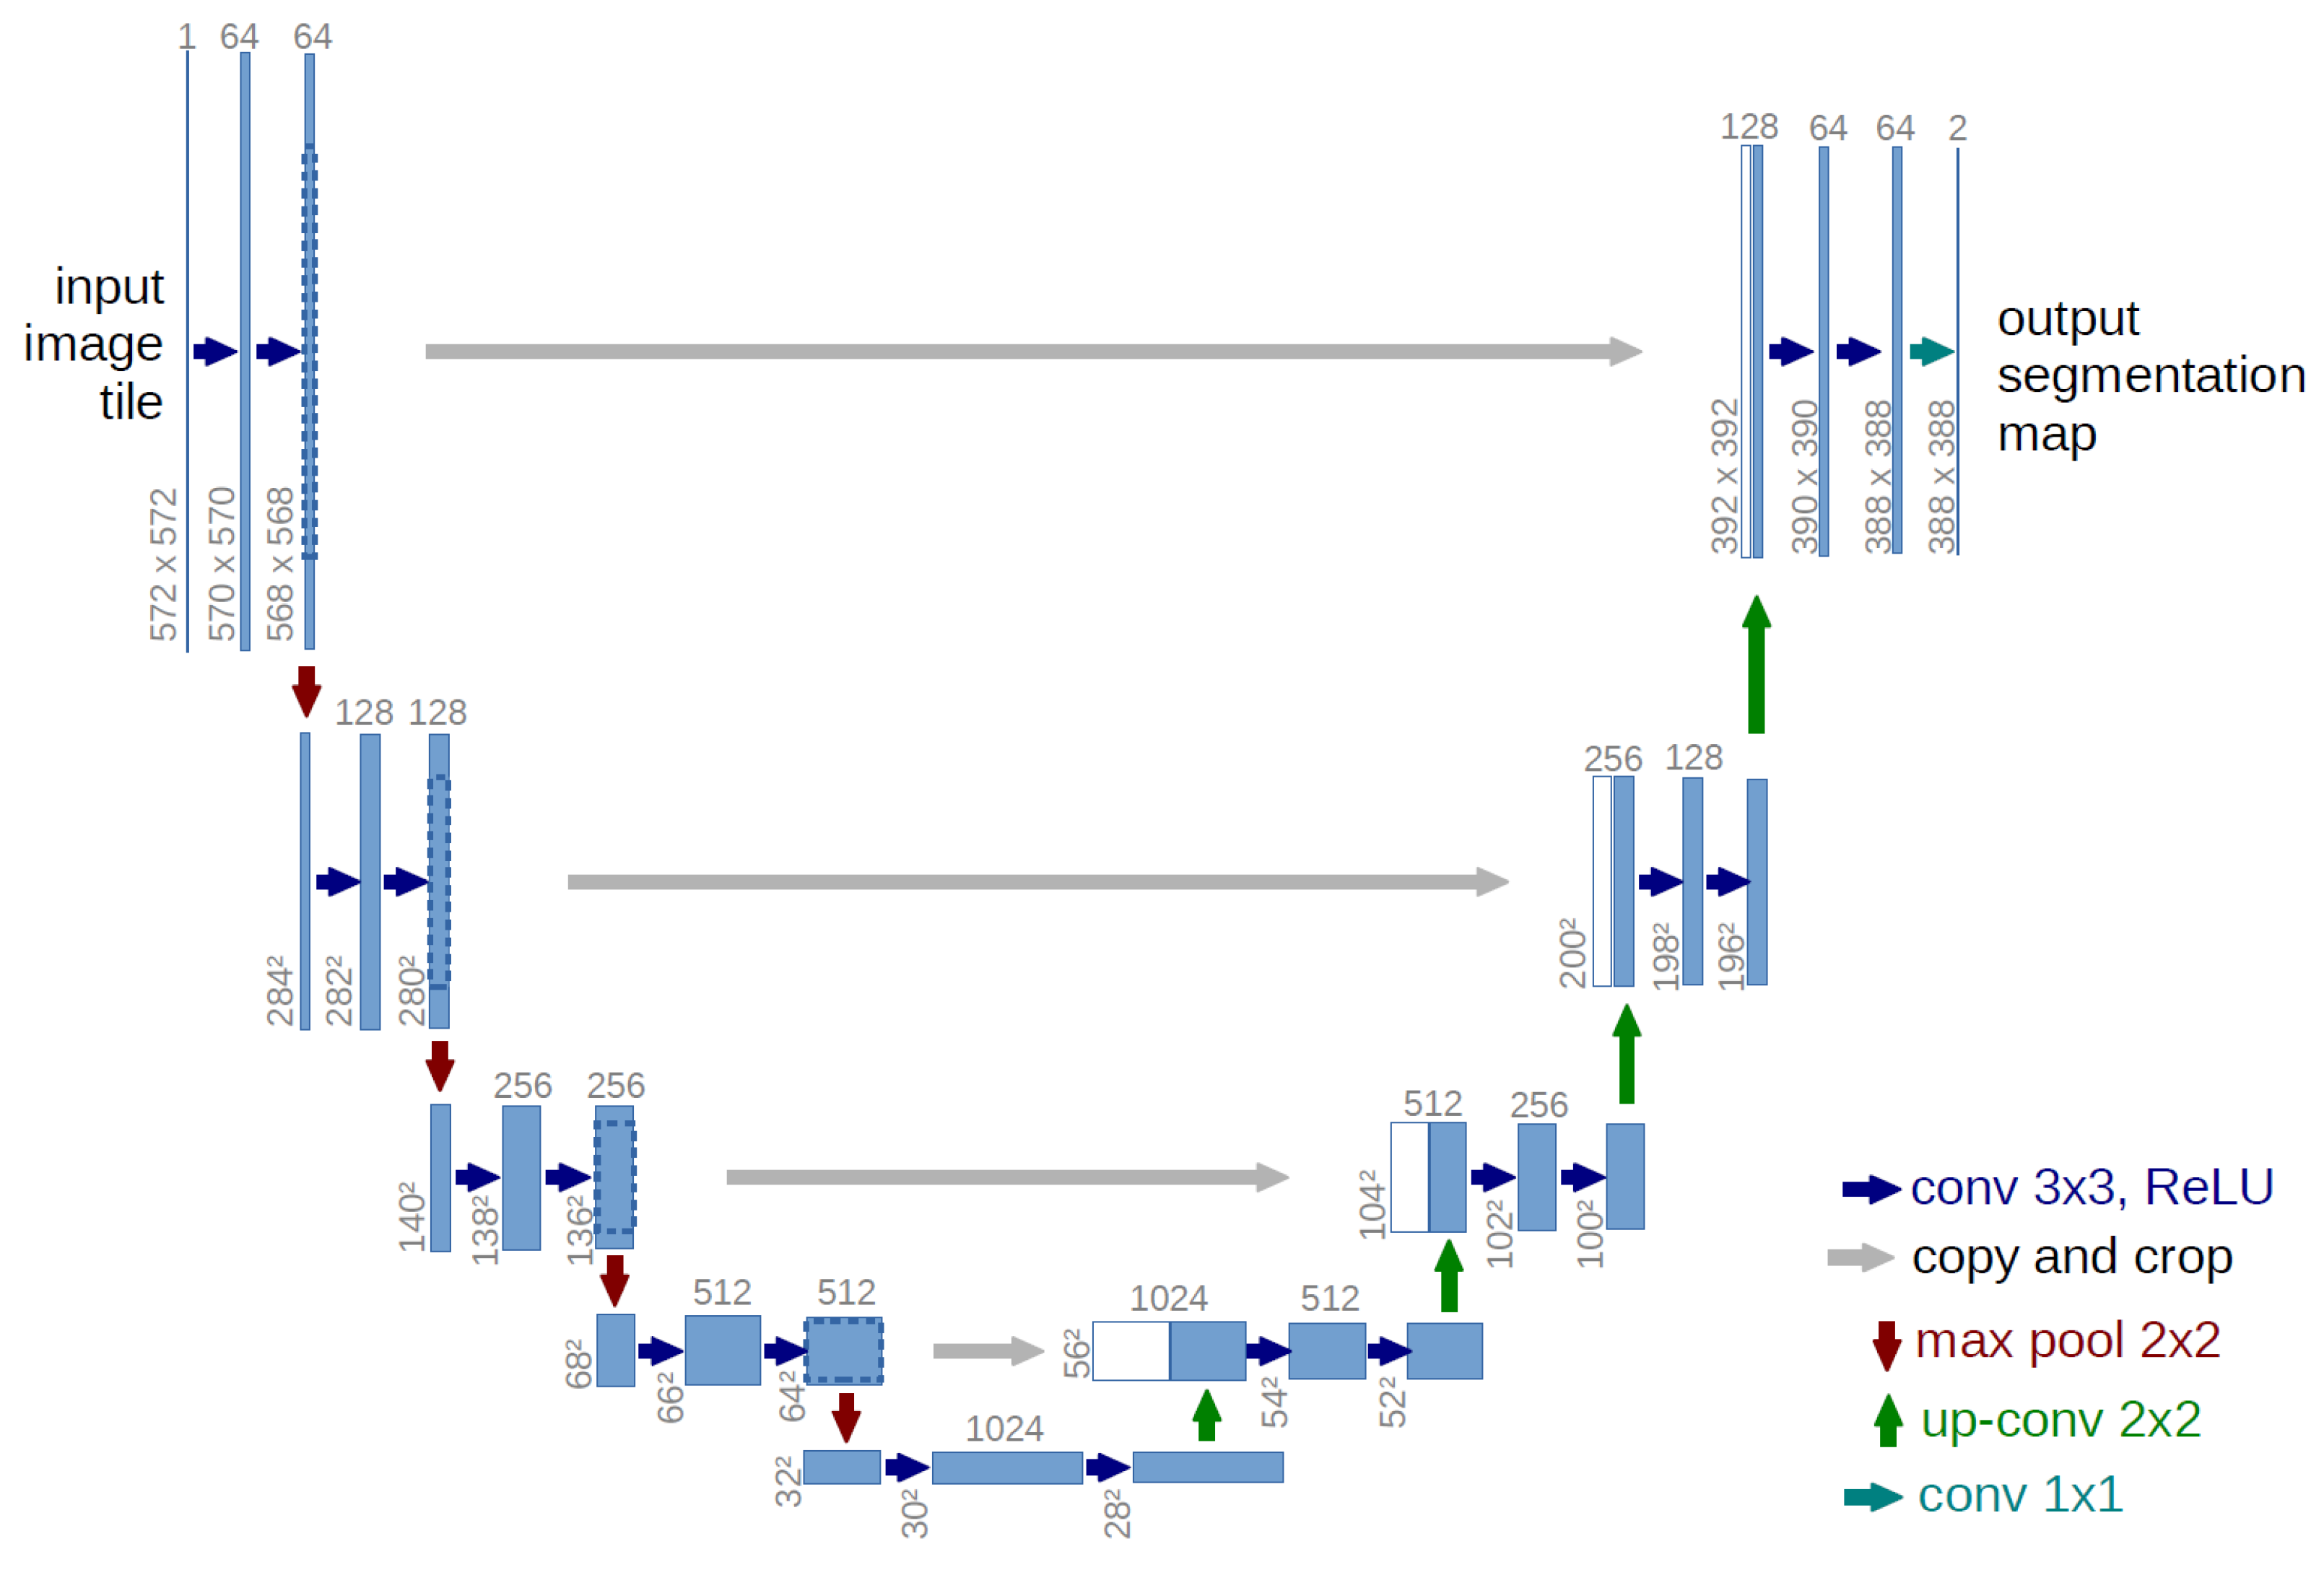
Figure 5.
Performance Evaluation Score and Loss Curve of the U-net Model for Brain Tumor Segmentation. (a) Dice coefficient and loss curve of HGG-1 Subset; (b) Dice coefficient and loss curve of HGG-2 Subset; (c) Dice coefficient and loss curve of HGG-3 Subset; (d) Dice coefficient and loss curve of LGG-1 Subset.


Table 1.
List of some sample datasets used for brain tumor detection and segmentation.
| Dataset | Used in Research Paper |
|---|---|
| BraTS 2012, 2015, 2016, 2018, 2019, 2020 | [6,7,8,9,10] |
| Whole Brain Atlas (WBA) | [11] |
| Rembrandt database | [12] |
| MRI Image database, Pioneer diagnostic center | [13] |
| BrainWeb: Simulated Brain Database | [14] |
| CVC-ClinicDB | [15] |
| ISIC-2017 | [15] |
Table 2.
Integrated Summary of Literature Studied.
| Author | Method Used | Results |
|---|---|---|
| Mehta et al., 2018 [29] |
| ET: 0.78, WT: 0.90, CT: 0.82 |
| Fridman et al., 2018 [30] |
| No accuracy metric was presented. |
| Tuan et al., 2019 [33] |
| WT:0.82, ET: 0.68, CT:0.70 |
| Shaocheng et al., 2018 [34] |
| Training phase: WT: 0.90, CT: 0.81, ET: 0.76 Validation set: WT: 0.91, CT: 0.83, ET: 0.79 |
| Wei et al., 2018 [35] |
| ET: 0.69, WT: 0.84, CT: 0.78 |
| Nabil et al., 2019 [15] |
| Average accuracy: 80.3%, 82%, 91.65%, 88%, 78.2% |
| Cahall et al., 2019 [36] |
| Intra-tumoral: WT: 0.925, CT: 0.95, ET: 0.95 Glioma subregions: WT: 0.92, CT: 0.95, ET: 0.95 |
| Malathi et al., 2019 [9] |
| Average Dice co-efficient: 0.73 Sensitivity: 0.82 |
| Yogananda et al., 2019 [10] |
| Accuracy: 89% WT: 0.95, CT: 0.92. ET:0.90 Survival Prediction: Accuracy: 44.8% |
| Hasan et al., 2018 [37] | Preprocessing: Image scaling, translation, rotation, and shear. Classification: Proposed NNRET U-net deep convolution neural network. DataSet: BraTS 2018 | Dice coefficient: 0.87 |
Table 3.
BraTS 2018 Dataset details.
| Input Image Size | 240*240*155 | |
|---|---|---|
| Training | # of HGG Images | 210 |
| # of LGG Images | 75 | |
| # of Test Dataset | 191 | |
| # of Validation Dataset | 66 | |
Table 4.
Some Sample Test Cases of U-net Deep Learning-based segmentation. Image from BraTs [44,45,46] Dataset.
| Test Case | 1 | 2 | 3 | 4 | 5 |
|---|---|---|---|---|---|
| Image |  |  |  |  |  |
| Ground Truth |  | 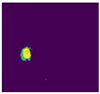 |  |  |  |
| Segmented Region |  |  |  |  |  |
| Result | Fail | Pass | Fail | Pass | Pass |
Table 5.
Sample successful test case after parameter tuning in U-Net architecture.
| Image | Ground Truth | Segmented Region | |
|---|---|---|---|
| Test Case1 | 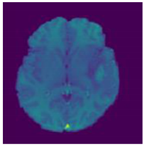 | 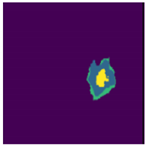 |  |
| Test Case2 |  |  |  |
Table 6.
Performance measure Dice coefficient of training, validation, and test sets.
| Set | Training | Validation | Test |
|---|---|---|---|
| HGG-1 | 0.9955 | 0.9953 | 0.9815 |
| HGG-2 | 0.9965 | 0.9964 | 0.9844 |
| HGG-3 | 0.9962 | 0.9957 | 0.9804 |
| LGG-1 | 0.9954 | 0.9951 | 0.9854 |
Publisher’s Note: MDPI stays neutral with regard to jurisdictional claims in published maps and institutional affiliations. |
© 2021 by the authors. Licensee MDPI, Basel, Switzerland. This article is an open access article distributed under the terms and conditions of the Creative Commons Attribution (CC BY) license (https://creativecommons.org/licenses/by/4.0/).
Share and Cite
MDPI and ACS Style
Arora, A.; Jayal, A.; Gupta, M.; Mittal, P.; Satapathy, S.C. Brain Tumor Segmentation of MRI Images Using Processed Image Driven U-Net Architecture. Computers 2021, 10, 139. https://doi.org/10.3390/computers10110139
AMA Style
Arora A, Jayal A, Gupta M, Mittal P, Satapathy SC. Brain Tumor Segmentation of MRI Images Using Processed Image Driven U-Net Architecture. Computers. 2021; 10(11):139. https://doi.org/10.3390/computers10110139
Chicago/Turabian StyleArora, Anuja, Ambikesh Jayal, Mayank Gupta, Prakhar Mittal, and Suresh Chandra Satapathy. 2021. "Brain Tumor Segmentation of MRI Images Using Processed Image Driven U-Net Architecture" Computers 10, no. 11: 139. https://doi.org/10.3390/computers10110139
Note that from the first issue of 2016, this journal uses article numbers instead of page numbers. See further details here.