A Review of Dietary Surveys in the Adult South African Population from 2000 to 2015

 ,
,
Abstract
:
1. Introduction
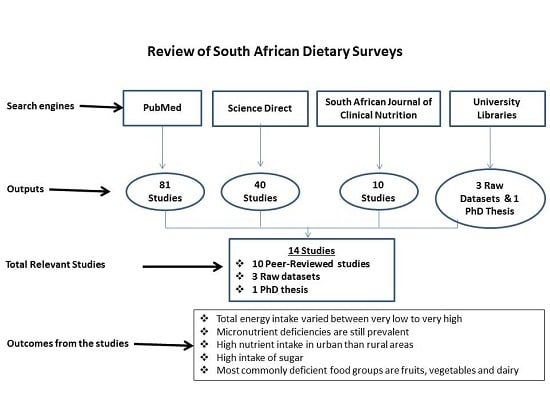
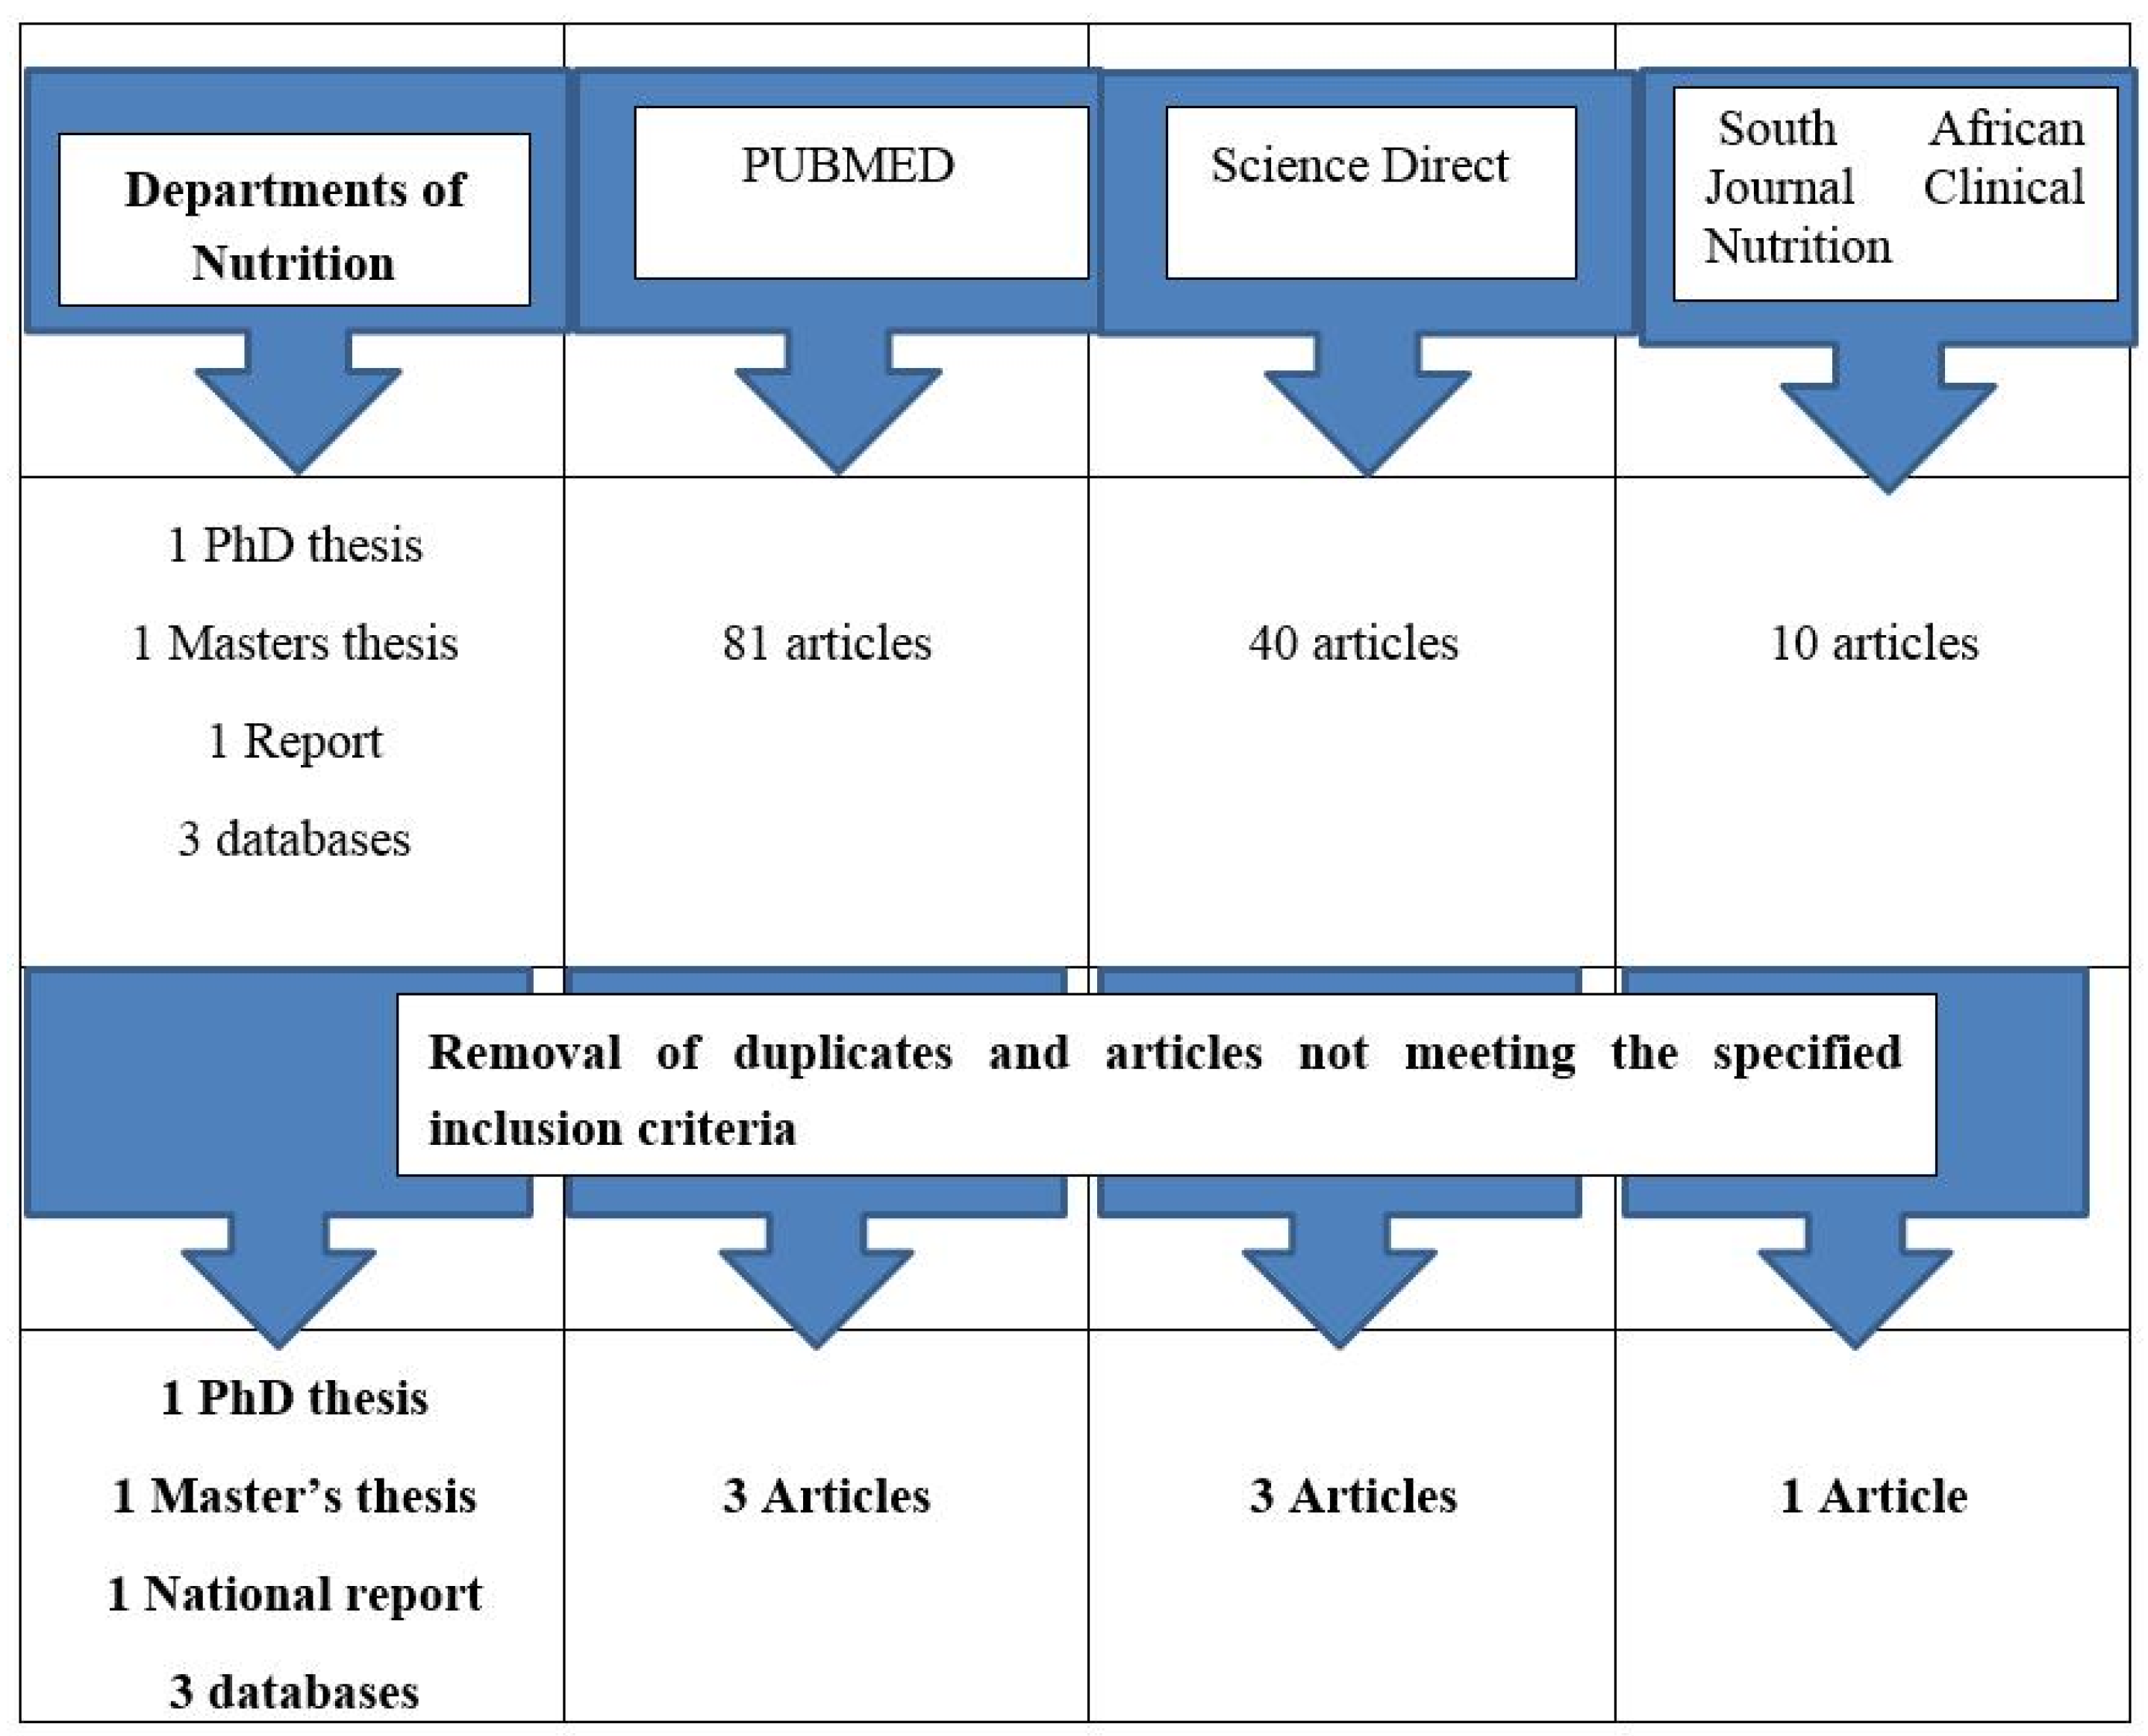
2. Methods
2.1. Framing the Research Question
2.2. Identifying Relevant Work
- -
- Dietary studies which used one of the following methods: 24 h recall, food frequency, weighed dietary record, dietary history to record adult intakes.
- -
- Participants in the studies were at least 14 years old.
- -
- Studies included in the review had at least 30 participants per group.
- -
- The study results included macro/micro nutrient intakes or foods commonly consumed or dietary diversity data or measures of dietary inadequacy.
- -
- Participants were breastfeeding or pregnant.
- -
- Participants of the studies had a specific disease condition, e.g., diabetes or AIDS.
- -
- Participants were disabled.
2.3. Analyzing the Quality of Studies
3. Summarizing the Evidence
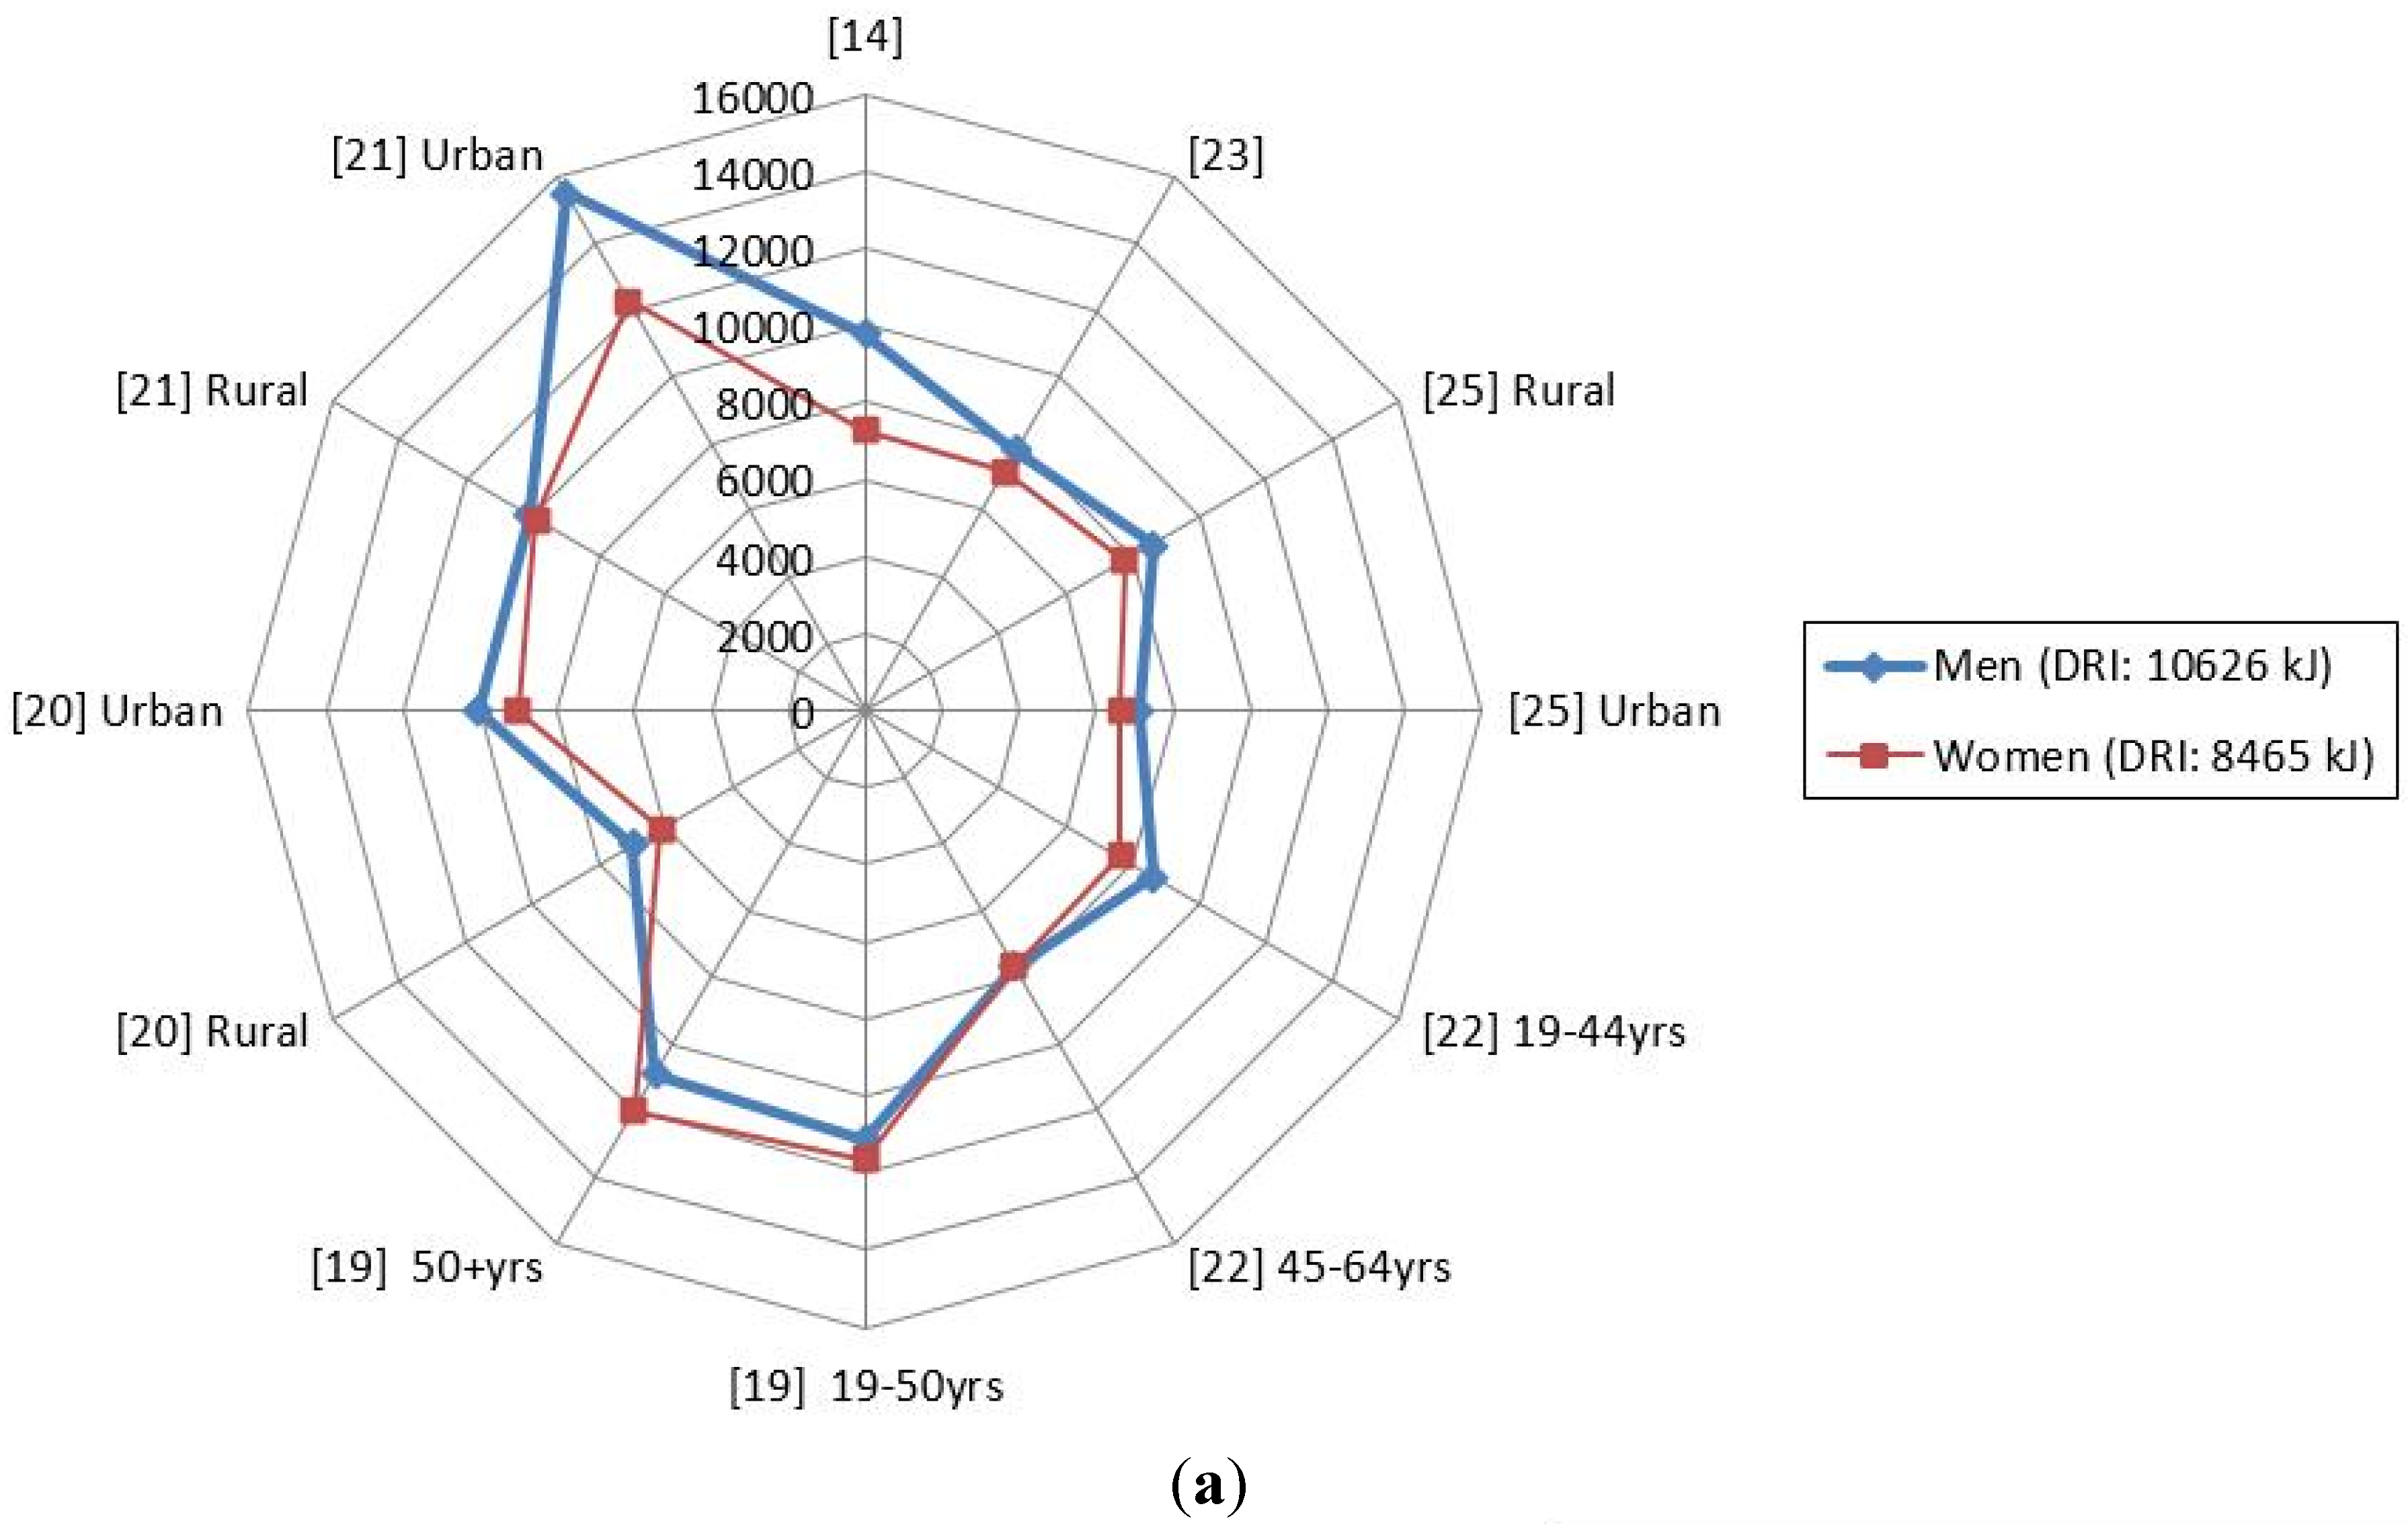
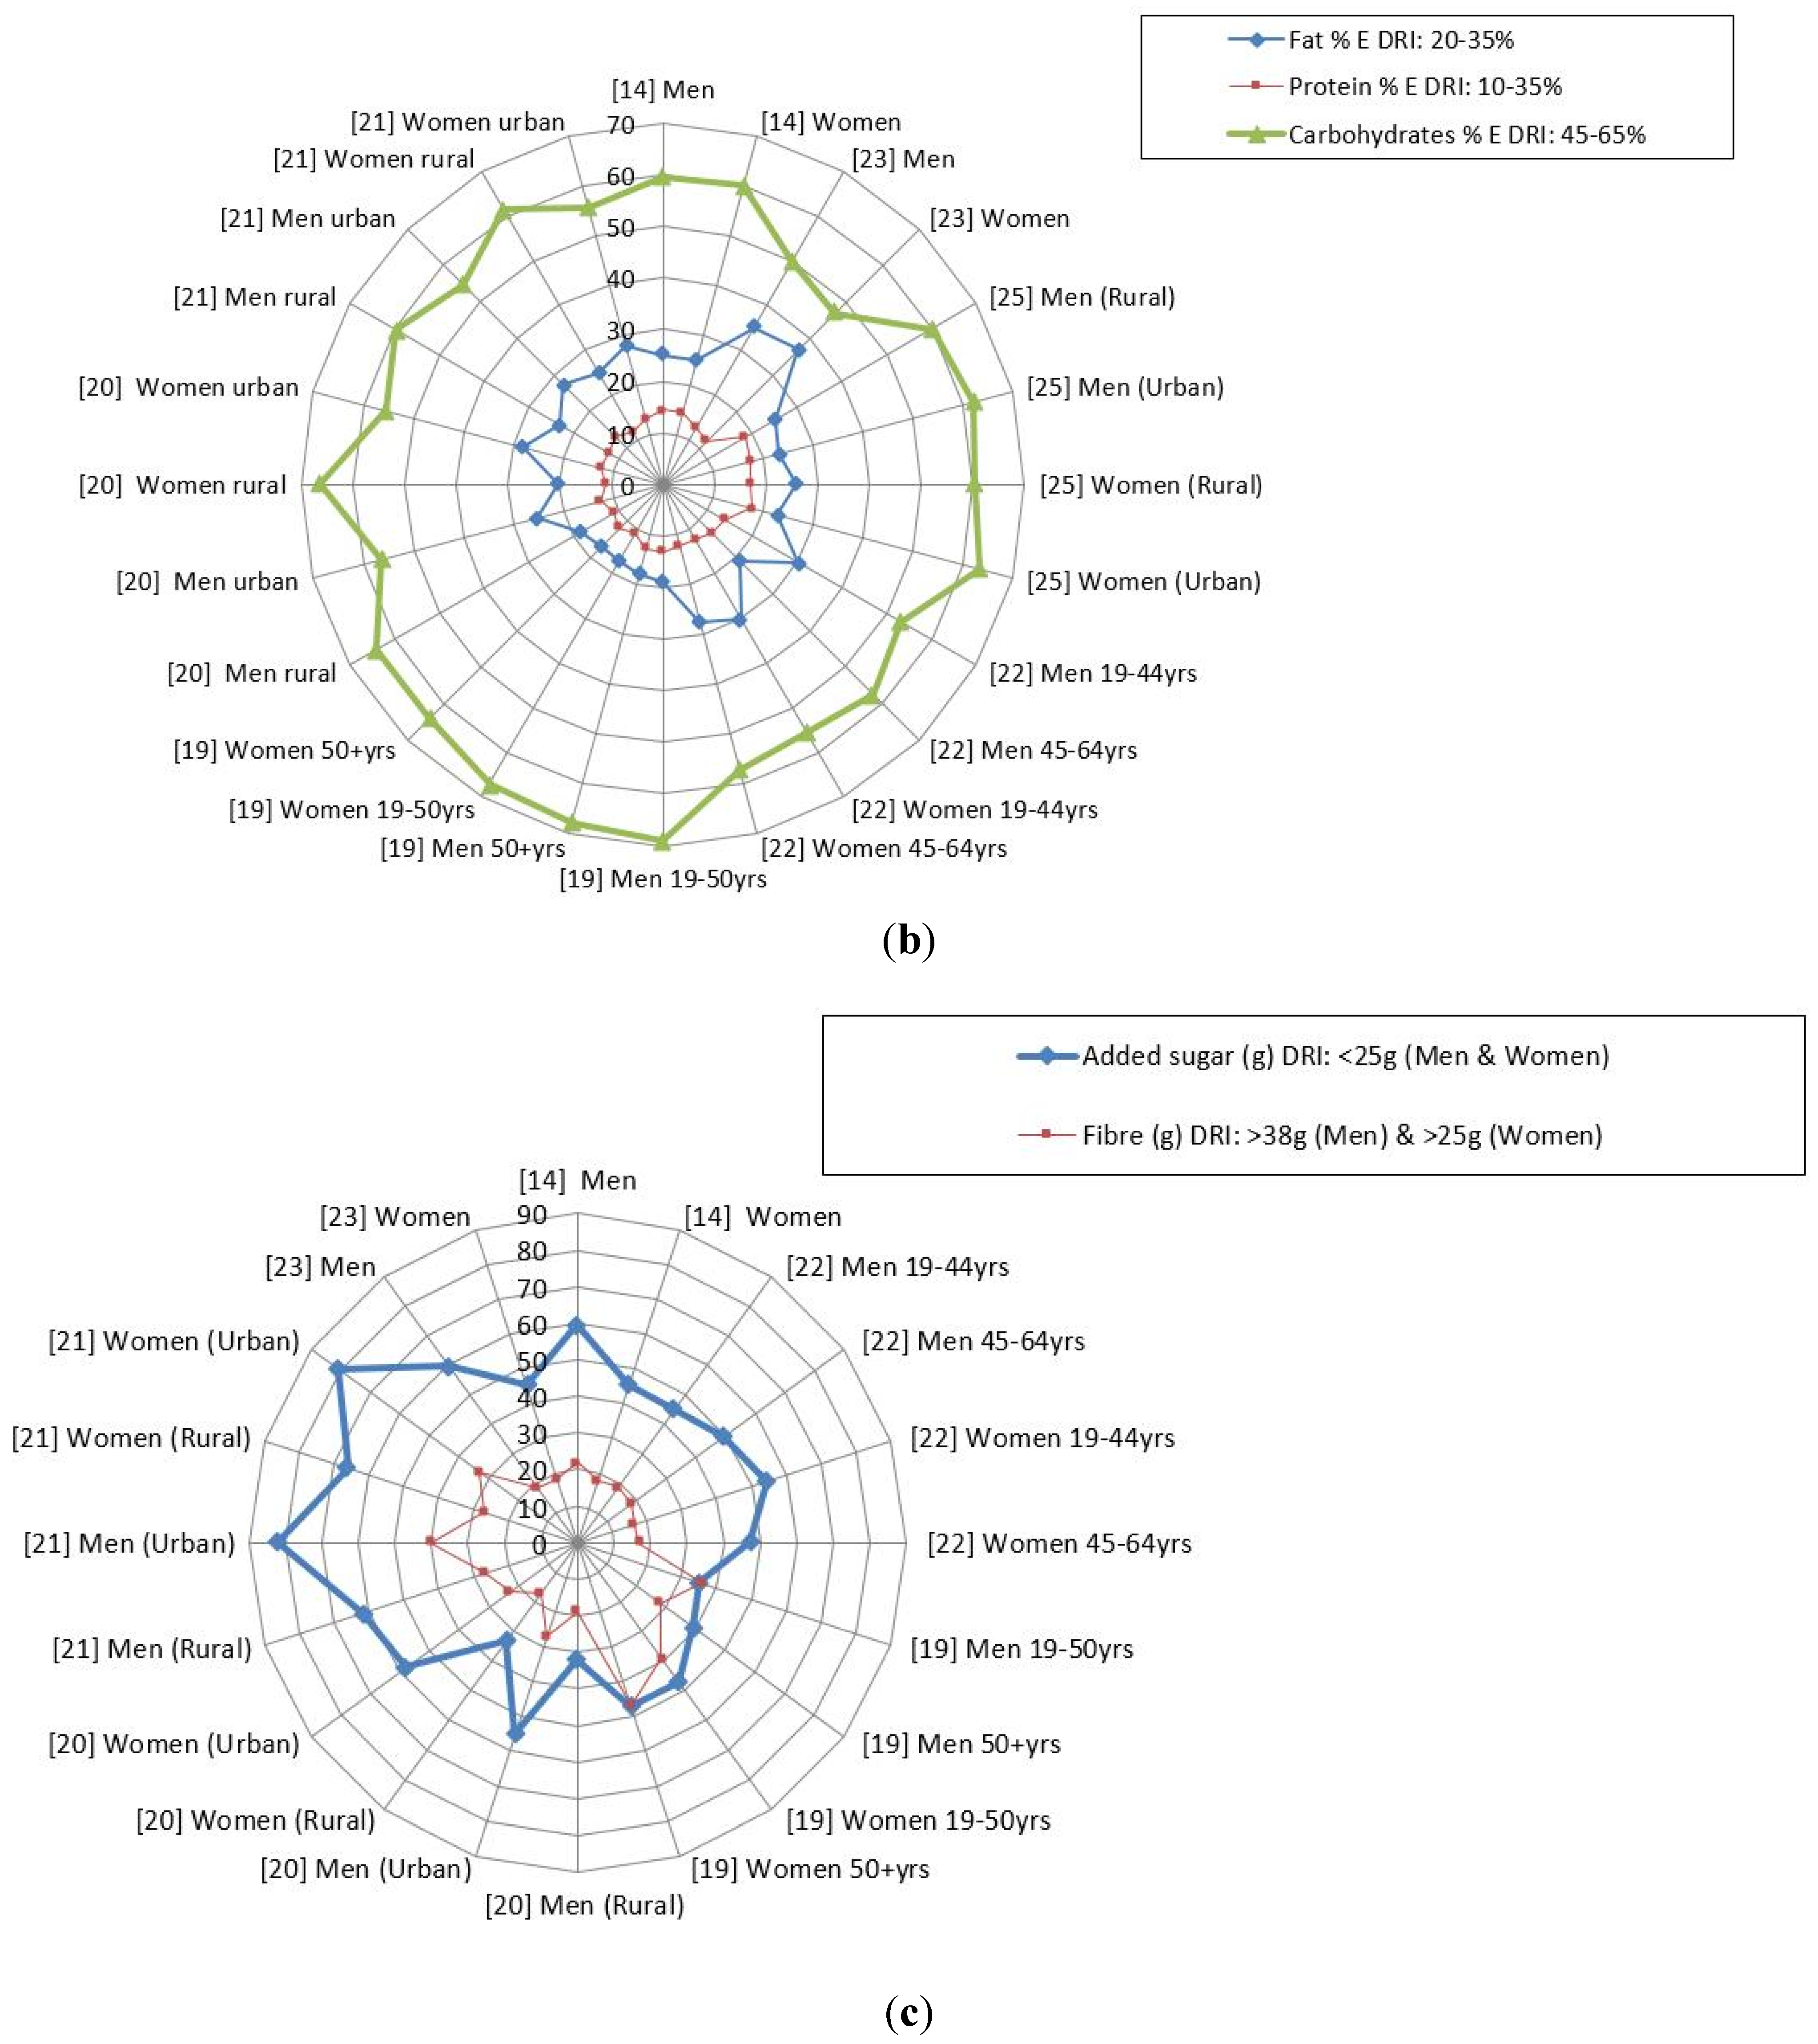
3.1. Macronutrient Intakes

| Author | Age | Gender | Race | No. of Participants | Area of Study | Urban/Rural | Other Info |
|---|---|---|---|---|---|---|---|
| Nel and Steyn, 2002 [14] | Adults | Men and Women | Black and White Africans | Adults: Men n = 1505 Women: n = 1726 | South Africa | Both | Secondary data analysis |
| Tydeman-Edwards, 2012 [26] | Adults (25–64 years) | Mostly Black | Adult men: n = 259 Adult women: n = 709 | Free State | Both | Primary data analysis | |
| Jaffer, 2009 CRIBSA ‡ [22] | Adults 25+ years | Men and Women | Black Africans | 544 | Cape Town | Urban townships (Langa, Gugulethu, Crossroads, Khayelitsha, Nyanga) | Primary data analysis |
| Hattingh et al., 2008 [27] | 25–34 years 35–44 years | Women | Black Africans | 496 | Bloemfontein | Urban townships (2 formal settlements 2 informal settlements) | Primary data analysis |
| Oldewage-Theron and Kruger, 2011 [28] | Households | Women and grandmothers | Black (assumption, not mentioned in article) | 357 | Vaal region—Gauteng province | Peri-urban Informal settlements | Primary data analysis |
| Msaki and Hendricks, 2013 [29] | Households | Women or other head of household | Black Africans (assumption, not mentioned in article) | 200 | KwaZulu Natal | Rural community, Embo | Primary data analysis |
| Msaki and Hendricks, 2014 [30] | Households | Women or other head of household | Black Africans (assumption, not mentioned in article) | 200 | KwaZulu Natal | Rural community, Embo | Secondary data analysis |
| Kolahdooz et al., 2013 [19] | Adults | Men and Women | Black Africans (assumption, not mentioned in article) | 136 | KwaZulu Natal | Rural, Empangeni | Primary data analysis |
| Audain et al., 2014 [31] | 14–21 years | Men and Women | Diverse ** | 209 | KwaZulu Natal | Hilton, peri-urban and rural | Primary data analysis |
| Labadarios et al., 2011 [32] | 16+ years | Men and women | Diverse ** | 3287 | All 9 South African provinces | Urban and rural | Primary data analysis |
| Shisana et al., 2013 [33] | 15+ years | Men and women | Diverse ** | 13,357 | All 9 South African provinces | Urban and rural | Primary data analysis |
| Naicker, 2009 [23] | Adults (35–55 years) | Men and Women | Indian | Adult men: n = 111 Adult women: n = 139 | KwaZulu Natal | Urban | Primary data analysis |
| Wentzel-Viljoen and Kruger, 2005 PURE * Data (unpublished) [20] | 30–70 years | Men and Women | Black Africans | 2009 | North West | Urban and rural | Raw data |
| Wentzel-Viljoen and Kruger, 2010 PURE * Data (unpublished) [21] | 30–70 years | Men and Women | Black Africans | 1275 | North West | Urban and rural | Raw data |
| Author | Aim | Dietary Intake Method | Analysis Method |
|---|---|---|---|
| Naicker, 2009 [23] | To assess the association of dietary and lifestyle exposures with the risk of non-communicable diseases among apparently healthy Indian adults in KwaDukuza, South Africa | Quantitative food frequency questionnaire validated by three quantified 24-h recalls | The quantities of food items recorded were converted to gram weights and the data processed using the South African FoodFinder software Averages of the macro- and micro-nutrients from the three 24-h recalls were compared to the quantities produced by the quantified food frequency questionnaire. Micronutrient intakes were compared with the recommended dietary allowance (RDA) and estimated average intakes (EARs) for all micronutrients |
| Hattingh et al., 2008 [27] | To assess micronutrient intake of black women living in Mangaung, South Africa | Quantitative food frequency questionnaire (culture sensitive) | The quantities of food items recorded were converted to gram weights and the data processed using the South African FoodFinder software Micronutrient intakes were compared with the recommended dietary allowance (RDA) for all micronutrients except for calcium, chromium, vitamin D, vitamin K, pantothenic acid and biotin where the adequate intake (AI) was used |
| Jaffer, 2009 CRIBSA ‡ [22] | To determine the occurrence of lifestyle risk factors associated with non-communicable diseases. In particular, this specific study focused on the dietary intake and nutritional status of this population in order to ascertain whether dietary patterns/habits have changed in urbanized South Africans since 1990 | Quantified 24-h recall | South African FoodFinder software was used to calculate the dietary intake of every person The values of macro and micronutrients were compared with the RDA, the estimated average intakes (EARs) and the acceptable macronutrient distribution ranges (AMDRs) |
| Oldewage-Theron and Kruger, 2011 [28] | To assess the food security situation of black women in an informal settlement by exploring their food access capabilities through dietary diversity measures and the coping strategies they employ to cope with poverty and hunger | 1-week quantified food frequency questionnaire, quantified or 24-h recall and Cornell Hunger Scale | South African FoodFinder software was used to calculate the dietary intake of every person Simple food item count and food group variety scores were calculated to determine dietary diversity scores Nutrient adequacy ratios (NARs) for energy, proteins, carbohydrates and 31 micro-nutrients were calculated by dividing the actual daily intake of nutrients and by the current dietary reference intakes of specific nutrient for women’s age category (IoM) The values of macro and micronutrients were also compared with the EARs |
| Msaki and Hendricks, 2013 [29] | To understand household food security using food diversity, quality, and intake | Checklist, food item count and screening | Household food intake strata were developed using matrices obtained from the household food intake index and nutritional adequacy ratios Food quality was measured using food count and later using 5 food groups, namely, starches, vegetables and fruits, animal sourced foods, fats, and legumes |
| Msaki and Hendricks, 2014 [30] | Estimation of micronutrients intake in household food consumption surveys | Household food intake index | The principal component analysis (PCA) involved breaking down household energy, protein and micronutrients per capita intakes (w.r.t. women adult equivalents) into categorical or interval variables The variables were then processed in order to obtain weights and principal component The results obtained from the first component (explaining the most variability) was used to develop the Household Food Intake Index based on formula: Aj − f 1x (aji-a1)/(S1) + ……fNx (fajN-aN)/(sN) [34] Using the 33.3 and 66.6 percentile, the resulting household population was divided into three household food intake quintiles representing the inadequate, average adequate and adequate household in terms of food intake |
| Kolahdooz et al., 2013 [19] | To investigate dietary adequacy amongst adults in rural KwaZulu-Natal, by determining daily energy and nutrient intakes, and identifying the degree of satisfaction of dietary requirements | 24-h dietary recall | All dietary data from the interviewer-administered 24-h recalls were coded and analysed using Nutribase version 9 (Cybersoft Inc., Pheonix, AZ, USA), which calculated energy and nutrient intakes per person |
| Audain et al., 2014 [31] | To make a comparative analysis of the dietary preferences of adolescents attending an urban versus a peri-urban school in KwaZulu-Natal, in order to investigate the association between socio-economic status and food frequency | Self-administered non-quantified food frequency questionnaire | Data analysis employed the grouping of food according to groups and assigned the frequency of eating. Responses to consumption frequency were assigned values ranging from 0–8 A score of 0:Never or less than once a month A score of 1: 1–3 times a month A score of 2: once a week A score of 3: 2–4 times a week A score of 4: 5–6 times a week A score of 5: Once a day A score of 6: 2–3 times a day A score of 7: 4–5 times a day A score of 8: 6 or more times a day |
| Labadarios et al., 2011 [32] | To measure the dietary diversity score (DDS) in South Africans aged 16+ years from all the population groups as a proxy of food insecurity | Face validated 24-h recall which was not quantified | Each specific food item was included in a group of nine selected food groups as used in an earlier study on children. A score below 4 was indicative of poor dietary diversity (and by association poor food security) while a score of nine represented a very varied diet. Each food group was only counted once when calculating DDS. The nine groups used were: (1) cereals/roots/tubers; (2) meat/poultry/fish; (3) dairy; (4) eggs; (5) vitamin A rich fruit and vegetables; (6) legumes; (7) other fruit; (8) other vegetables; (9) fats and oils. The results also included calculating the proportion of people who had consumed a food group at least once |
| Shisana et al., 2013 [33] | To measure the DDS of South Africans 15+ years by summing the number of food groups from which food had been consumed | 24-h recall which was not quantified | The outcome was based on the 9 food groups namely: cereals, roots and tubers; vitamin A-rich vegetables and fruit; vegetables other than vitamin A rich; fruit other than vitamin A-rich fruit; meat, poultry, and fish; eggs; legumes; dairy products; and foods made with fats or oils. A score below 4 was indicative of poor dietary diversity (and by association poor food security) while a score of nine represented a very varied diet. Each food group was only counted once when calculating DDS. |
| Wentzel-Viljoen and Kruger, 2005 PURE * Data (unpublished) [20] | To determine the occurrence of lifestyle risk factors associated with non-communicable diseases. | Quantified food frequency questionnaire | Macro- and micronutrient intakes were calculated using the South African Medical Research Council (SAMRC) Food Database |
| Wentzel-Viljoen and Kruger, 2010 PURE * Data (unpublished) [21] | To determine the occurrence of lifestyle risk factors associated with non-communicable diseases. The dietary data in the South African leg of the PURE study focused on the dietary intake and nutritional status of this population in the North West Province in order to ascertain whether dietary patterns/habits have changed in the same participants since 2005 in North West province | Quantified food frequency questionnaire | Macro- and micronutrient intakes were calculated using SAMRC Food Database |
| Nel and Steyn, 2002 [14] | The primary objective of this study was to generate a reference table of “most commonly” consumed food items and average intakes of these items in the diet of South Africans. The table is required to be representative of foods eaten by children and adults from all age and ethnic groups in South Africa. | Secondary data-analysis was conducted on existing dietary databases (raw data) obtained from surveys undertaken in South Africa between 1983 and 2000. | Data had to be extrapolated from existing isolated surveys on adults. In this process the following databases were utilized: Black Risk Factor Study (BRISK); First Year Women Student (FYWS) Project; Weight and Risk Factor Study (WRFS); the National Food Consumption Survey (NFCS) and the Coronary Risk Factor Study (CORIS). The dietary intake for the groups 1–5 years and 6–9 years were calculated only from the NFCS, and were not supplemented by other databases. The substantiation for treating age 10+ as a unit (and calling it an adult group), was the finding that average consumption of adolescents (10–15 years) did not differ significantly from that of adults when comparing mean energy intakes of age groups in the studies analyzed. |
| Tydeman-Edwards, 2012 [26] | The main aim of this study was to determine the diet and anthropometric status of adults (between 25 and 64 years old) and pre-school children (zero to seven years old) in rural and urban areas. In addition, this study investigated associations between anthropometric status of children and adults in rural and urban areas in order to determine whether a double burden of disease existed. | A 24-h recall of reported usual intake and adjusted food frequency questionnaire were used to determine dietary intake during individual interviews with each participant. | The exchange lists, based on the American Dietetics Association (ADA) Food Guide Pyramid (United States Department of Agriculture (USDA), 1992: online), classify food into seven groups according to their energy, carbohydrate, fat, and protein content, and these were used to quantify the energy and macronutrient content of the dietary intake of participants. Cut off points were followed such that: food intake less than the recommendations of the Food Guide Pyramid (USDA, 1992: online) were regarded as inadequate or below requirements; intake within the guidelines, as adequate or within requirements; and intake higher than the guidelines, as high or above requirements. |
| Dietary Reference Intakes (DRIs) Food and Nutrition Board [24] | |||||||
| Energy: Men of height 1.70 m of low activity with BMI = 22.5 = 10,626 | Fat: AMDR = 20%–35% | Protein: AMDR = 10%–35% | Carbohydrate: AMDR = 45%–65% | Added Sugar ** <10% Energy or 25 g per day Recommended by WHO [25] | Fiber: RDA Males = 38 g | ||
| Energy: Women of height 1.60 m with low activity and BMI = 22.5 = 8465 | Fat: AMDR = 20%–35% | Protein: AMDR = 10%–35% | Carbohydrate: AMDR = 45%–65% | <10%E or 25 g per day Recommended by WHO [25] | Fiber RDA Females = 25 g | ||
| Study | Gender | Energy kJ Mean (SD) | Fat % total energy Mean (SD) | Protein % total energy Mean (SD) | Carbohydrates (CHO) % total energy Mean (SD) | Added sugar ** (g) Mean (SD) | Fiber (g) Mean (SD) |
| Naicker, 2009 [23] | Men | 7815 (1514.1) | 35.1 (3.2) | 12.8 | 49.9 | 59.6 (68.4) | 18.8 (4.1) |
| Women | 7214 (1209.5) | 37.1 (3.2) | 12.0 | 47.0 | 45.4 (46.4) | 18.1 (3.8) | |
| Nel and Steyn, 2002 [14] | Men | 9788 (5485) | 25.1 (12.4) | 14.5 (4.5) | 59.6 (14.3) | 59.6 (68.4) | 22 (14) |
| Women | 7250 (3610) | 25.0 (12.2) | 14.3 (4.7) | 59.9 (14.1) | 45.4 (46.4) | 18 (12) | |
| Tydeman-Edwards, 2012 [26] | Men (Rural) | 8630 | 25.2 | 18.3 | 60.2 | na | |
| Men (Urban) | 7078 | 23.3 | 17.5 | 62.2 | na | ||
| Women (Rural) | 7755 | 25.9 | 16.9 | 60.3 | na | ||
| Women (Urban) | 6621 | 22.8 | 17.7 | 63.3 | na | ||
| Jaffer, 2009 CRIBSA ‡ [22] | Men 19–44 years | 8600 (3200) | 30.1 (12.7) | 13.7 (4.8) | 53.2 (13.7) | 45.0 g (42.8 g) | 18.9 (10.4) |
| Men 45–64 years | 7700 (2200) | 25.9 (13.8) | 13.4 (5.1) | 57.4 (14.1) | 49.4 g (37.7 g) | 18.1 (10.4) | |
| Women 19–44 years | 7600 (2300) | 30.1 (12.7) | 12.4 (4.5) | 55.5 (12.5) | 54.4 g (40.5 g) | 16.2 (8.5) | |
| Women 45–64 years | 7100 (1800) | 27.6 (14.1) | 12.4 (4.9) | 57.3 (15.0) | 47.0 g (36.3 g) | 16.8 (8.2) | |
| Kolahdooz et al., 2013 [19] | Men 19–50 years | 11,159 | 19 (11) | 13 (3) | 69 (13) | 35 g (25 g) | 36 (18) |
| Men 50+ years | 10,874 | 18 (10) | 13 (3) | 68 (9) | 39 g (53 g) | 28 (25) | |
| Women 19–50 years | 11,650 | 17 (9) | 11 (2) | 67 (12) | 47 g (24 g) | 39 (14) | |
| Women 50+ years | 11,978 | 17 (7) | 12 (3) | 64 (11) | 47 g (21 g) | 47 (14) | |
| Wentzel-Viljoen and Kruger, 2005 Unpublished PURE * data [20] | Men (Rural) | 6973 (3203) | 18.3 (6.3) | 10.9 (2.0) | 64.2 (9.4) | 32 g (28 g) | 19 (9) |
| Men (Urban) | 10,054 (4164) | 25.3 (6.9) | 12.6 (1.9) | 56.5 (6.9) | 55 g (33 g) | 27 (13) | |
| Women (Rural) | 6107 (2472) | 20.3 (7.1) | 11.0 (1.7) | 66.5 (8.7) | 33 g (23 g) | 17 (7) | |
| Women (Urban) | 9008 (3899) | 28.2 (6.6) | 12.5 (2.0) | 55.6 (7.0) | 58 g (33.5 g) | 23 (11) | |
| Wentzel-Viljoen and Kruger, 2010 Unpublished PURE data * [21] | Men (Rural) | 10,084 (5709) | 23.2 (7.43) | 12.1 (3.4) | 59.8 (11.3) | 62 g (62 g) | 27 (19) |
| Men (Urban) | 15,485 (10,209) | 27.2 (7.4) | 13.1 (2.4) | 54.7 (8.5) | 82 g (72 g) | 40 (25) | |
| Women (Rural) | 9891 (5528) | 24.8 (8.5) | 11.9 (3.1) | 61.5 (10.5) | 66 g (78 g) | 27 (19) | |
| Women (Urban) | 12,302 (5876) | 27.8 (7.1) | 13.3 (2.4) | 55.5 (8.5) | 81 g (68 g) | 33 (16) | |

3.2. Micronutrient Intakes
| Dietary Variable and Their DRIs | Minimum (Lowest) Reported Mean Value out of all 6 Studies | Maximum (Highest) Reported Mean Value out of all 6 Studies |
|---|---|---|
| Calcium: AI for M and W = 1000 mg | M = 299 mg [19]; W = 150.5 mg [28] | M = 743.2 mg [21]; W = 636.4 mg [27] |
| Iron: EAR for M = 6.0 mg, for W = 8.1 mg | M = 8.0 mg [22]; W = 3.8 mg [28] | M = 27.7 mg [21]; W = 29.0 mg [19] |
| Zinc: EAR for M = 9.4 mg, for W = 6.8 mg | M = 7.6 mg [22]; W = 3.8 mg [28] | M = 21.7 mg [21]; W = 16.6 mg [21] |
| Folate: EAR for M and W = 320 μg | M = 226 μg [23]; W = 81.9 μg [28] | M = 1633 μg [19]; W = 1763 μg [19] |
| Niacin: EAR for M = 12 mg, for W = 11 mg | M = 12.8 mg [20]; W = 4.9 mg [28] | M = 38.8 mg [21]; W = 31.8 mg [19] |
| Riboflavin: EAR for M = 1.1 mg, for W = 0.9 mg | M = 1.0 mg [22]; W = 0.3 mg [28] | M = 2.8 mg [21]; W = 2.4 mg [21] |
| Thiamin: EAR for M = 1.0 mg, for W = 0.9 mg | M = 0.8 mg [23]; W = 0.7 mg [28] | M = 2.8 mg [19]; W = 3.1 mg [19] |
| Vitamin A: EAR for M = 625 μg, RE for W = 500 μg | M = 125 μg [19]; W = 196 μg [19] | M = 2159 μg [21]; W = 2132 μg [21] |
| Vitamin B6: EAR for M and W = 1.1 mg | M = 1.0 mg [21]; W = 0.3 mg [28] | M = 5.3 mg [21]; W = 4.0 mg [21] |
| Vitamin C: EAR for M = 75 mg, for W = 60 mg | M = 12.6 mg [20]; W = 14.4 mg [28] | M = 90.7 mg [19]; W = 90.1 mg [21] |
| Vitamin B12: EAR for M and W = 2.0 μg | M = 1.1 μg [19]; W = 1.1 μg [19] | M = 11.2 μg [21]; W = 9.7 μg [21] |
| Vitamin E: EAR for M and W = 12 mg | M = 8.1 mg [19]; W = 4.6 mg [28] | M = 21.4.1 mg [21]; W = 17.6 mg [21] |
| Vitamin D: EAR for M and W = 10 μg | M = 2.8 μg [22]; W = 0.7 μg [28] | M = 7.7 μg [19]; W = 9.0 μg [19] |
3.3. Food Intakes
| Study on Secondary Analyses (Nel and Steyn [14]) | Bloemfontein Men (Tydeman-Edwards [26]) | Bloemfontein Women (Tydeman-Edwards [26]) |
|---|---|---|
| Maize porridge and dishes | Sugar | Sugar |
| Sugar | Maize porridge | Tea |
| Tea | Tea | Maize porridge |
| Brown bread | Stock | Stock/salt |
| White bread | Coffee | Margarine/oil |
| Non-dairy creamer | Margarine/oil | Bread |
| Brick margarine 1 | Full cream milk | Full cream milk |
| Chicken meat | Bread | Vegetables |
| Full cream milk | Vegetables | Fruit |
| Green leafy vegetables | Fruit | Cold drinks |
| Potatoes | Cold drinks | Chicken |
| Tomato and onion stewed | Eggs | Eggs |
| Coffee | Chicken | Sweets/chocolates |
| Eggs | Cake/biscuits | Chips |
| Cabbage | Alcohol | Cakes/biscuits |
3.4. Dietary Diversity
| 2012 SANHANES (Shisana et al. [33]) | 2009 Study (Labadarios et al. [32]) | ||||||
|---|---|---|---|---|---|---|---|
| Mean DDS | DDS < 4 | Mean DDS | DDS < 4 | ||||
| Mean | 95% CI | Percent | 95% CI | Percent | 95% CI | ||
| Area | |||||||
| Urban formal | 4.7 | 4.5–4.9 | 29.3 | 25.8–33.1 | 4.42 | 4.34–4.07 | 26 |
| Urban informal | 3.8 | 3.5–4.1 | 46.6 | 40.7–52.6 | 3.46 | 3.30–3.61 | 55.7 |
| Rural formal | 3.6 | 3.4–3.9 | 50.7 | 44.3–57.1 | 3.64 | 3.46–3.81 | 50.1 |
| Rural informal | 3.3 | 3.2–3.5 | 59.7 | 54.6–64.7 | 3.17 | 3.05–3.29 | 63.9 |
| Province | |||||||
| Western Cape | 4.6 | 4.3–4.8 | 28.2 | 22.5–34.7 | 4.78 | 4.66–4.90 | 15.7 |
| Eastern Cape | 4.0 | 3.7–4.2 | 42.1 | 37.1–47.4 | 3.38 | 3.22–3.54 | 59.6 |
| Northern Cape | 3.8 | 3.5–4.1 | 43.6 | 35.2–52.5 | 4.05 | 3.85–4.26 | 35.1 |
| Free State | 4.0 | 3.7–4.3 | 45.1 | 37.1–53.4 | 4.40 | 4.23–4.58 | 26.6 |
| Kwa-Zulu Natal | 3.7 | 3.5–4.0 | 49.3 | 41.9–56.6 | 3.97 | 3.81–4.12 | 40.8 |
| North West | 3.3 | 3.1–3.5 | 61.3 | 55.3–67.0 | 3.72 | 3.43–4.01 | 44.1 |
| Gauteng | 4.9 | 4.6–5.2 | 26.3 | 21.0–32.2 | 4.22 | 4.08–4.31 | 32.5 |
| Mpumalanga | 4.0 | 3.5–4.4 | 46.2 | 37.3–55.4 | 4.14 | 3.95–4.33 | 30.5 |
| Limpopo | 3.2 | 2.8–3.6 | 65.6 | 52.8–76.5 | 4.02 | 3.03–3.45 | 61.8 |
| Race | |||||||
| African | 4.0 | 3.8–4.1 | 44.9 | 41.1–48.8 | 3.63 | 3.55–3.71 | 50 |
| White | 5.6 | 5.2–6.0 | 14.9 | 10.2–21.2 | 4.96 | 4.82–5.10 | 9 |
| Coloured | 4.5 | 4.2–4.7 | 30.0 | 26.0–34.4 | 4.43 | 4.30–4.56 | 26 |
| Asian | 4.1 | 3.7–4.6 | 31.6 | 20.8–44.9 | 4.44 | 4.29–4.58 | 26 |
| Total SA | 4.2 | 4.1–4.3 | 39.7 | 36.7–42.7 | 4.02 | 3.96–4.07 | 38 |
4. Interpreting the Findings
5. Conclusions
6. Recommendations
Acknowledgments
Author Contributions
Conflicts of Interest
References
- Labadarios, D.; Steyn, N.P.; Maunder, E.; MacIntryre, U.; Gericke, G.; Swart, R.; Huskisson, J.; Dannhauser, A.; Vorster, H.H.; Nesmvuni, A.E.; et al. The National Food Consumption Survey (NFCS): South Africa, 1999. Public Health Nutr. 2005, 8, 533–543. [Google Scholar] [CrossRef] [PubMed]
- Wolmarans, P.; Langenhoven, M.L.; van Eck, M.; Swanepoel, A.S.P. The contribution of different food groups to the energy, fat and fibre intake of the Coronary Risk Factor Study (CORIS) population. S. Afr. Med. J. 1989, 75, 167–171. [Google Scholar] [PubMed]
- Steyn, K.; Kazenellenbogen, J.M.; Lombard, C.J.; Bourne, L.T. Urbanization and the risk for chronic diseases of lifestyle in the black population of the Cape Peninsula, South Africa. J. Cardiovasc. Risk 1997, 4, 135–142. [Google Scholar] [CrossRef] [PubMed]
- Langenhoven, M.L.; Steyn, K.; van Eck, M.; Gouws, E. Nutrient intake in the coloured population of the Cape Peninsula. Ecol. Food Nutr. 1988, 22, 97–106. [Google Scholar] [CrossRef]
- Bourne, L.T.; Langenhoven, M.L.; Steyn, K.; Jooste, P.L.; Laubuscher, J.A.; van der Vyfer, E. Nutrient intake in the urban African population of Cape Peninsula, South Africa. The BRISK Study. Cent. Afr. J. Med. 1993, 39, 238–247. [Google Scholar] [PubMed]
- Bourne, L.T. Dietary Intake in an Urban African Population in South Africa with Special Reference to the Nutrition Transition. Ph.D. Dissertation, University of Cape Town, Cape Town, South Africa, 1996. [Google Scholar]
- Senekal, M.; Steyn, N.P. Development of Nutritional and Health Monitor; Sovenga, University of the North: Limpopo, South Africa, 1997. [Google Scholar]
- Steyn, N.P.; Burger, S.; Monyeki, K.D.; Alberts, M.; Nthangeni, G. Seasonal variation in the dietary intake of the adult population of the Dikgale. S. Afr. J. Clin. Nutr. 2001, 14, 140–145. [Google Scholar]
- Venter, C.S.; MacIntyre, U.E.; Vorster, H.H. The development and testing of a food portion photograph book for use in an African population. J. Hum. Nutr. Diet. 2000, 13, 205–218. [Google Scholar] [CrossRef] [PubMed]
- Vorster, H.H.; Wissing, M.P.; Venter, C.S.; Kruger, H.S.; Kruger, A.; Malan, N.T.; de Ridder, J.H.; Veldman, F.J.; Steyn, H.S.; Margetts, B.M.; et al. The impact of urbanization on physical, physiological and mental health of Africans in the North West Province of South Africa: The THUSA study. S. Afr. J. Sci. 2000, 96, 505–514. [Google Scholar]
- MacIntyre, U.E.; Venter, C.S.; Vorster, H.H. A culture-sensitive quantitative food frequency questionnaire used in an African population: 1. Development and reproducibility. Public Health Nutr. 2001, 4, 53–62. [Google Scholar] [CrossRef] [PubMed]
- Steyn, N.P.; Senekal, M.; Brits, S.; Alberts, M.; Mashego, T.; Nel, J.H. Weight and health status of black women students. S. Afr. Med. J. 2000, 90, 146–152. [Google Scholar] [PubMed]
- Senekal, M.; Steyn, N.P.; Mashego, T.A.; Nel, J.H. Evaluation of body shape, eating disorders and weight management related parameters in black women students. S. Afr. J. Psychol. 2001, 31, 45–53. [Google Scholar]
- Nel, J.H.; Steyn, N.P. Report on South African food consumption studies undertaken amongst different population groups (1983–2000): Average intakes of foods most commonly consumed. Pretoria, South Africa, 2002. Available online: http://www.mrc.ac.za/chronic/foodstudy.pdf (accessed on 15 April 2015).
- Steyn, N.P.; Nel, J.H.; Casey, A. Secondary data analysis of dietary surveys undertaken in South Africa in order to determine usual food consumption of the population. Public Health Nutr. 2003, 6, 631–644. [Google Scholar] [CrossRef] [PubMed]
- Steyn, N.P.; Wolmarans, P.; Nel, J.H.; Bourne, L.T. National fortification of staple foods can make a significant contribution to micronutrient intake of South African adults. Public Health Nutr. 2008, 11, 307–313. [Google Scholar] [CrossRef] [PubMed]
- Khan, K.S.; Kunz, R.; Kleijnen, J.; Antes, G. Five steps to conducting a systematic review. J. R. Soc. Med. 2003, 96, 118–121. [Google Scholar] [CrossRef] [PubMed]
- FoodFinder database. Medical Research Council of South Africa food composition database. SA HealthInfo. Available online: http://www.mrc.ac.za/FoodComp/ (accessed on 16 April 2015).
- Kolahdooz, F.; Spearing, K.; Sharma, S. Dietary Adequacies among South African Adults in Rural KwaZulu-Natal. PLoS ONE 2013, 8, e67184. [Google Scholar] [CrossRef] [PubMed]
- Wentzel-Viljoen, E.; Kruger, A.; PURE research team. Prospective Urban and Rural Epidemiological (PURE) study in the North West Province of South Africa, 2005, North-West University, Potchefstroom, South Africa. Unpublished data. 2005. [Google Scholar]
- Wentzel-Viljoen, E.; Kruger, A. Prospective Urban and Rural Epidemiological (PURE) study in the North West Province of South Africa. North-West University: Potchefstroom, South Africa, Unpublished data. 2010. [Google Scholar]
- Jaffer, N.; Steyn, N.P.; Peer, N. Dietary data from the Cardiovascular risk in black South Africans (CRIBSA) study conducted in 2009. University of Cape Town: Cape Town, South Africa, Unpublished data. 2009. [Google Scholar]
- Naicker, A. The Prevalence of Selected Risk Markers for Non-Communicable Diseases and Associations with Lifestyle Behaviours in an Indian Community in KwaZulu Natal. Ph.D. Thesis, Potchefstroom Campus of the North-West University, Potchefstroom, South Africa, November 2009. [Google Scholar]
- Dietary Reference Intakes (DRIs): Recommended Intakes for Individuals, Vitamins Food and Nutrition Board, Institute of Medicine, National Academy of Sciences, 2004. Available online: http://www.sochinut.cl/pdf/Recomendaciones/DRISummaryListing.pdf (accessed on 21 June 2015).
- World Health Organisation (WHO). Guideline: Sugars Intake for Adults and Children; WHO: Geneva, Switzerland, 2015. Available online: http://apps.who.int/iris/bitstream/10665/149782/1/9789241549028_eng.pdf?ua=1 (accessed on 15 April 2015).
- Tydeman-Edwards, R. Obesity, Under-Nutrition and Double Burden of Disease in the Free State. Master’s Thesis, University of Free State, Bloemfontein, South Africa, 2012. [Google Scholar]
- Hattingh, Z.; Walsh, C.M.; Bester, C.J.; Oguntibeju, O.O. An analysis of Dietary Micronutrient Intakes in Two Age Groups of Black South African Women. West Indian Med. J. 2008, 57, 431–437. [Google Scholar] [PubMed]
- Oldewage-Theron, W.; Kruger, R. Dietary diversity and adequacy of women caregivers in a peri-urban informal settlement in South Africa. Nutrition 2011, 27, 420–427. [Google Scholar] [CrossRef] [PubMed]
- Msaki, M.M.; Hendriks, S.L. Do food quality and food quantity talk the same? Lesson from household food security study in Embo, South Africa. J. Am. 2013, 32, 165–176. [Google Scholar] [CrossRef] [PubMed]
- Msaki, M.M.; Hendriks, S.L. Measuring household food security using food intake indicators in rural Kwazulu Natal, South Africa. Ecol. Food Nutr. 2014, 53, 193–213. [Google Scholar] [CrossRef] [PubMed]
- Audain, K.A.; Kassier, S.M.; Veldman, F.J. Adolescent food frequency and socio-economic status in a private urban and peri-urban school in Hilton, KwaZulu-Natal. S. Afr. J. Clin. Nutr. 2014, 27, 201–206. [Google Scholar]
- Labadarios, D.; Steyn, N.P.; Nel, J.H. How diverse is the diet of adult South Africans? Nutr. J. 2011. [Google Scholar] [CrossRef] [PubMed]
- Shisana, O.; Labadarios, D.; Rehle, T.; Simbayi, L.; Zuma, K.; Dhansay, A.; Reddy, P.; Parker, W.; Hoosain, E.; Naidoo, P.; et al. South African National Health and Nutrition Examination Survey (SANHANES-1); HSRC Press: Cape Town, South Africa, 2013. [Google Scholar]
- Filmer, D.; Pritchett, L. Estimating wealth effects without expenditure data—or tears: An application of educational enrollment in states of India. 1998, The World Bank. Demography 2001, 38, 115–132. [Google Scholar] [PubMed]
- Dolman, R.C.; Wentzel-Viljoen, E.; Jerling, J.C.; Feskens, E.J.M.; Kruger, A.; Pieters, M. The use of predefined diet quality scores in the context of CVD risk during urbanization in the South African Prospective Urban and Rural Epidemiological (PURE) study. Public Health Nutr. 2013, 17, 1706–1716. [Google Scholar] [CrossRef] [PubMed]
- Mayosi, B.M.; Flisher, A.J.; Lalloo, U.G.; Sitas, F.; Tollman, S.M.; Bradshaw, D. The burden of non-communicable diseases in South Africa. Lancet 2009, 374, 934–947. [Google Scholar] [CrossRef]
- South African Department of Health. Foodstuffs, Cosmetics and Disinfectants ACT, 1972 (ACT NO. 54 OF 1972). Regulations relating to the fortification of certain foodstuffs. Government Gazette, Republic of South Africa. Available online: http://www.grainmilling.org.za/fortification%20regulations.pdf (accessed on 16 April 2015).
- Vorster, H.H.; Kruger, A.; Wentzel-Viljoen, E.; Kruger, H.S.; Margetts, B.M. Added sugar intake in South Africa: Findings from the Adult Prospective Urban and Rural Epidemiology (PURE) cohort study. Am. J. Clin. Nutr. 2014, 99, 1479–1486. [Google Scholar] [CrossRef] [PubMed]
- Schneider, M.; Norman, R.; Steyn, N.; Bradshaw, D.; the South African Comparative Risk Assessment Collaborating Group. Estimating the burden of disease attributable to low fruit and vegetable intake in South Africa in 2000. S. Afr. J. Clin. Nutr. 2007, 97, 717–723. [Google Scholar]
- The Department of Health South Africa and UNICEF South Africa. A Reflection of the South African Maize Meal and Wheat Flour Fortification Programme (2004 to 2007). Available online: http://www.unicef.org/southafrica/SAF_resources_wheatfortificationn.pdf (accessed on 16 April 2015).
- Steyn, N.P.; Nel, J.H.; Parker, W.; Ayah, R.; Mbithe, D. Urbanisation and the nutrition transition: A comparison of diet and weight status of South African and Kenyan women. Scand. J. Public Health 2012, 40, 229–238. [Google Scholar] [CrossRef] [PubMed]
- Temple, N.J.; Steyn, N.P. Food prices and energy density as barriers to healthy food patterns in Cape Town, South Africa. J. Hunger Environ. Nutr. 2009, 4, 203–213. [Google Scholar] [CrossRef]
- Kruger, A.; Lekalakala-Mokgele, S.E.; Wentzel-Viljoen, E. Rural and Urban Older African Caregivers Coping with HIV/AIDS are Nutritionally Compromised. J. Nutr. Gerontol. Geriatr. 2011, 30, 274–290. [Google Scholar] [CrossRef] [PubMed]
- Joubert, J.; Norman, R.; Bradshaw, D.; Goedecke, J.H.; Steyn, N.P.; Puoane, P.; South African Comparative Risk Assessment Collaborating Group. Estimating the burden of disease attributable to excess body weight in South Africa in 2000. S. Afr. J. Clin. Nutr. 2007, 97, 683–690. [Google Scholar]
- National High Blood Pressure Education Program (NHBPEP). The Seventh Report of the Joint National Committee on Prevention, Detection, Evaluation, and Treatment of high Blood Pressure. NIH Publication No. 04-5230: US Department of Health and Human Services, National Heart, Lung, and Blood Institute; August 2004. Available online: http://www.nhlbi.nih.gov/files/docs/guidelines/jnc7full.pdf (accessed on 15 April 2015). [Google Scholar]
- Morck, T.A.; Lynch, S.R.; Cook, J.D. Inhibition of food iron absorption by coffee. Am. J. Clin. Nutr. 1983, 37, 416–420. [Google Scholar] [PubMed]
- Wentzel-Viljoen, E.; Steyn, K.; Ketterer, E.; Charlton, K.E. “Use salt and foods high in salt sparingly”: A food-based dietary guideline for South Africa. S. Afr. J. Clin. Nutr. 2013, 26, 105–113. [Google Scholar]
- South African Department of Health. Foodstuffs, Cosmetics and Disinfectants ACT, 1972 (ACT NO. 54 OF 1972). Regulations relating to the reduction of sodium in certain foodstuffs and related matters. Government Gazette, Republic of South Africa, 20 March 2013. Available online: http://www.heartfoundation.co.za/sites/default/files/articles/South%20Africa%20salt%20legislation.pdf (accessed on 16 April 2015).
- Steyn, N.P.; Temple, N. (Eds.) Community Nutrition Textbook for South Africa; Parow, MRC: Tygerberg, South Africa, 2009.
- Vorster, H.H.; Badham, J.B.; Venter, C.S. An introduction to the revised food-based dietary guidelines for South Africa. S. Afr. J. Clin. Nutr. 2013, 26, S5–S12. [Google Scholar]
© 2015 by the authors; licensee MDPI, Basel, Switzerland. This article is an open access article distributed under the terms and conditions of the Creative Commons Attribution license (http://creativecommons.org/licenses/by/4.0/).
Share and Cite
Mchiza, Z.J.; Steyn, N.P.; Hill, J.; Kruger, A.; Schönfeldt, H.; Nel, J.; Wentzel-Viljoen, E. A Review of Dietary Surveys in the Adult South African Population from 2000 to 2015. Nutrients 2015, 7, 8227-8250. https://doi.org/10.3390/nu7095389
Mchiza ZJ, Steyn NP, Hill J, Kruger A, Schönfeldt H, Nel J, Wentzel-Viljoen E. A Review of Dietary Surveys in the Adult South African Population from 2000 to 2015. Nutrients. 2015; 7(9):8227-8250. https://doi.org/10.3390/nu7095389
Chicago/Turabian StyleMchiza, Zandile J., Nelia P. Steyn, Jillian Hill, Annamarie Kruger, Hettie Schönfeldt, Johanna Nel, and Edelweiss Wentzel-Viljoen. 2015. "A Review of Dietary Surveys in the Adult South African Population from 2000 to 2015" Nutrients 7, no. 9: 8227-8250. https://doi.org/10.3390/nu7095389