Coleus forskohlii Extract Supplementation in Conjunction with a Hypocaloric Diet Reduces the Risk Factors of Metabolic Syndrome in Overweight and Obese Subjects: A Randomized Controlled Trial

Abstract
:1. Introduction

2. Experimental Section
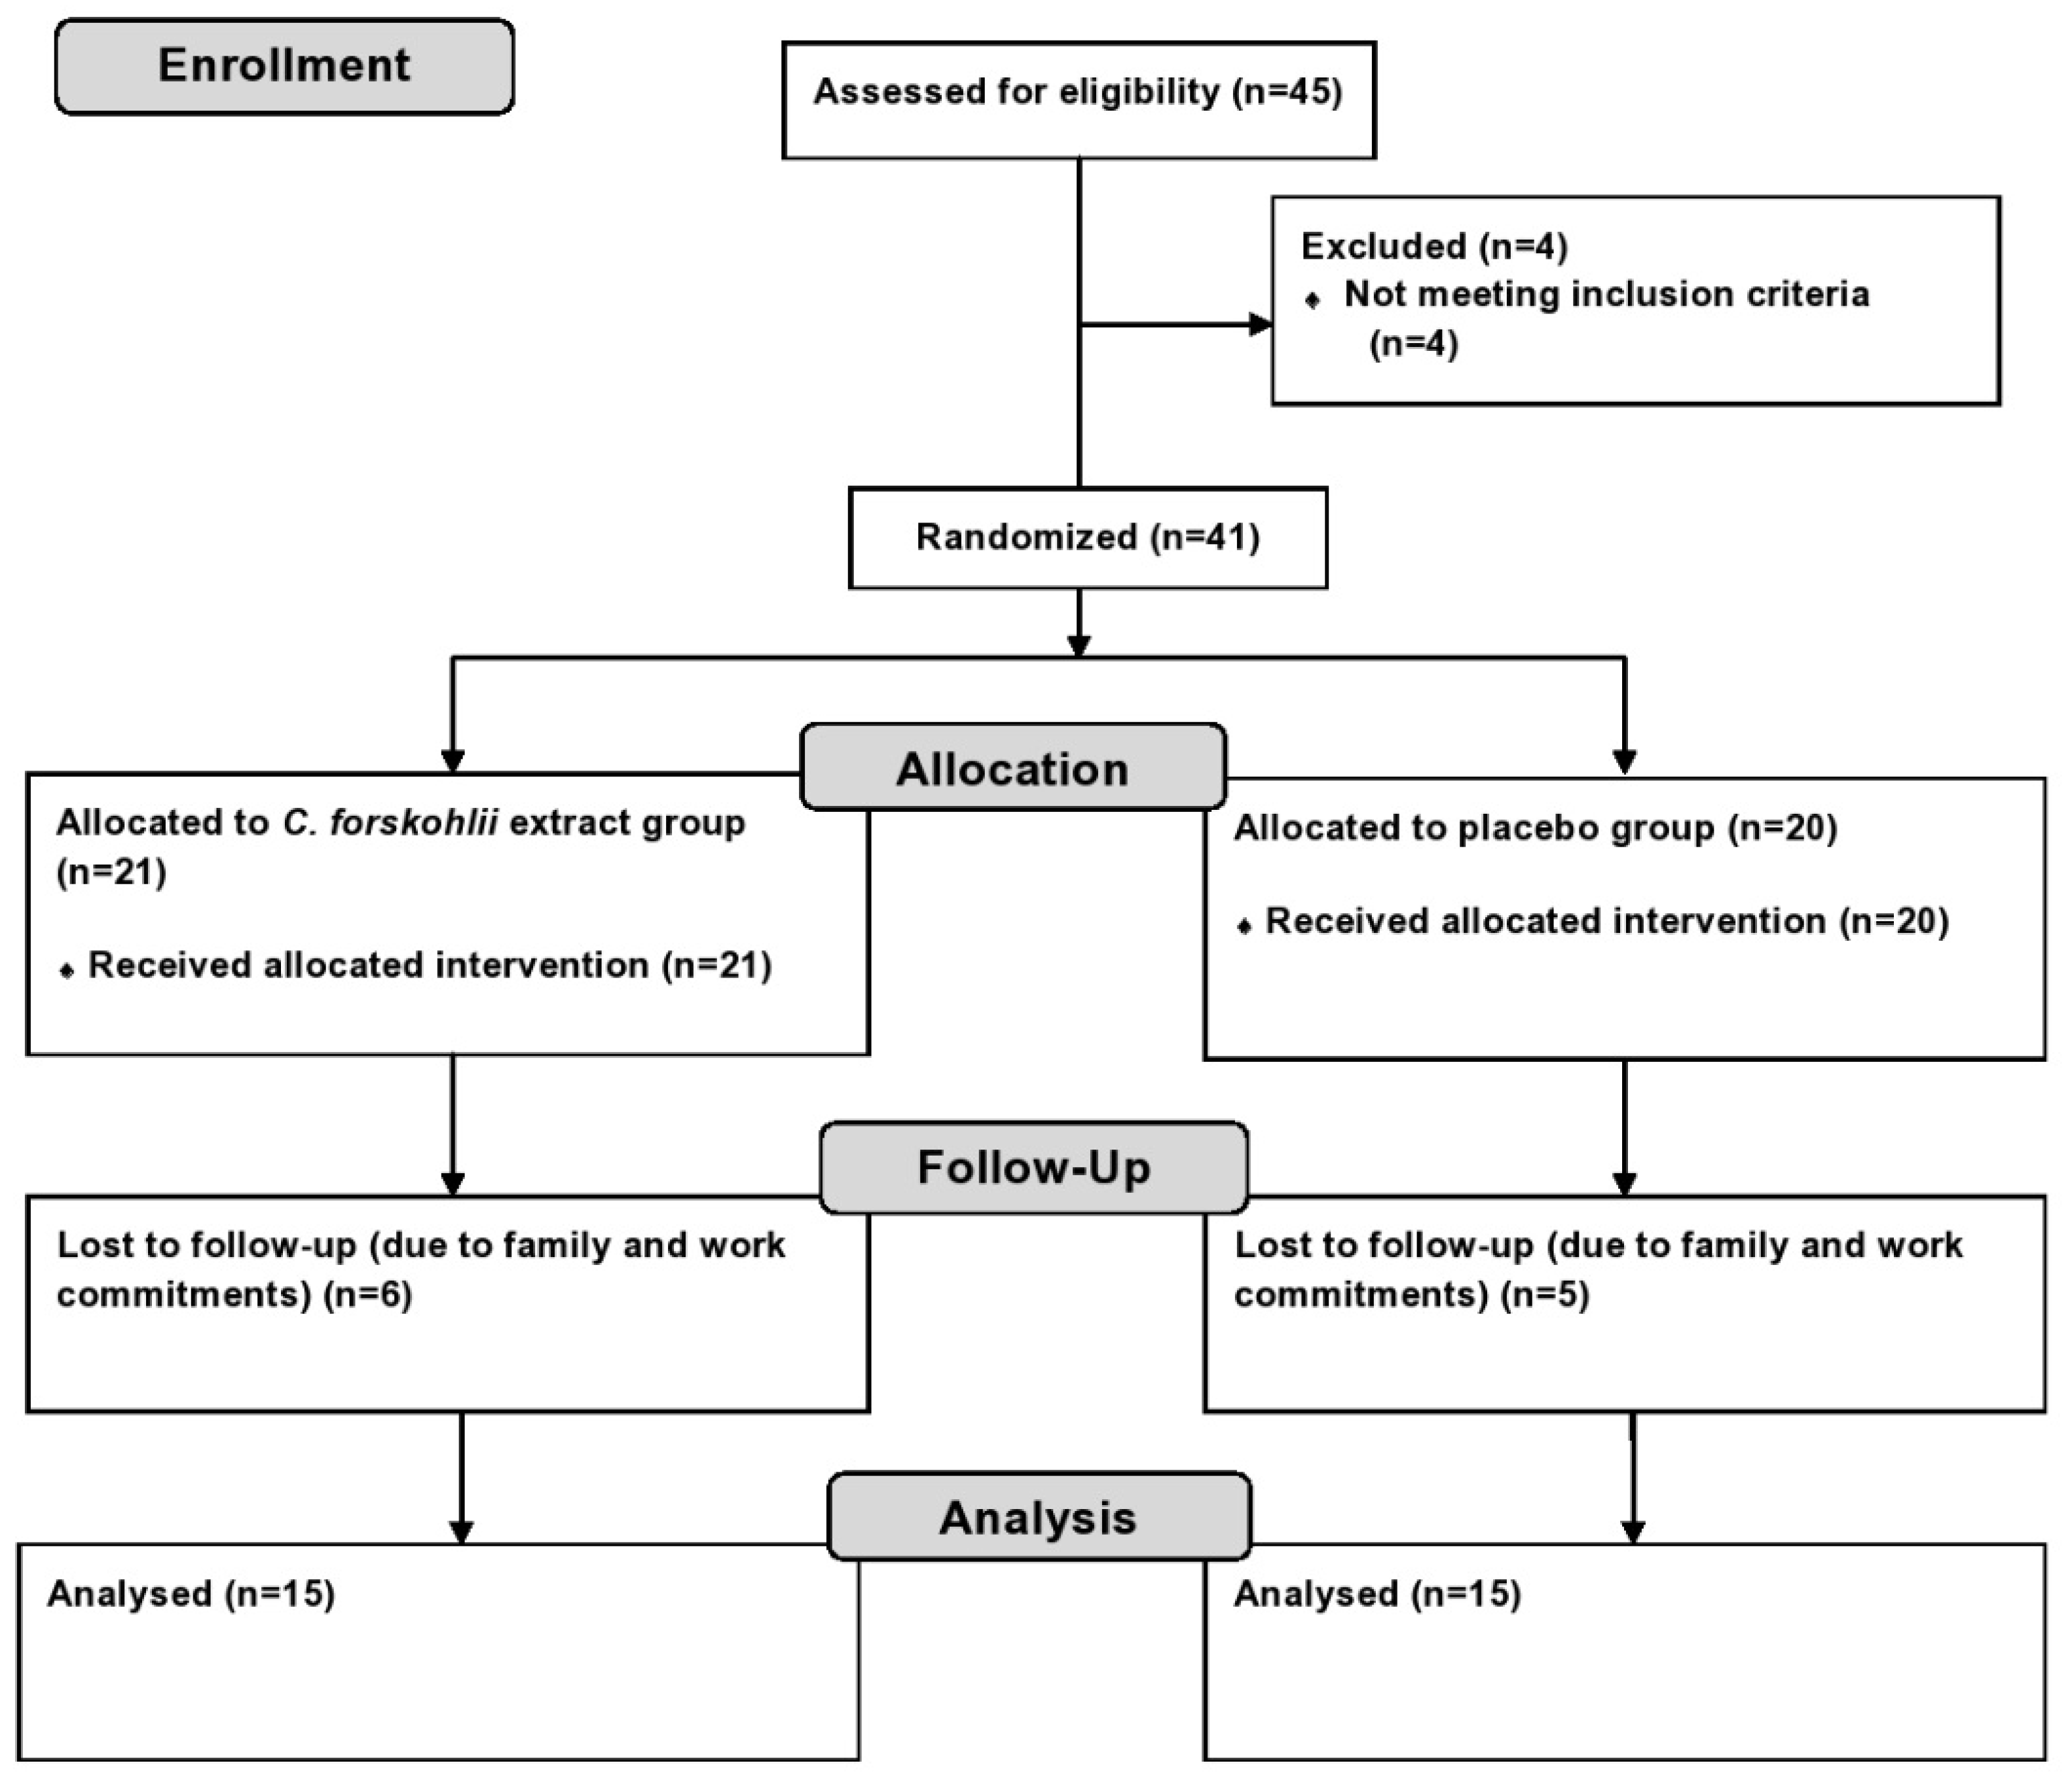
2.1. Participants and Randomization
2.2. Experimental Design
2.3. Anthropometry and Physiological Measurements
2.4. Biochemical Analyses of Metabolic Parameters
2.5. Appetite Assessment
2.6. Dietary Intake
2.7. Statistical Analysis
3. Results

| Parameter | Experimental Group (n = 15) | Placebo Group (n = 15) | p Value |
|---|---|---|---|
| Age (years) | 40.9 ± 13.8 | 41.8 ± 14.2 | 0.9 |
| Body weight (kg) | 90.9 ± 13.9 | 93.4 ± 21.2 | 0.9 |
| Body mass index (kg/m²) | 31.9 ± 4.0 | 33 ± 6.4 | 0.7 |
| Waist circumference (cm) | 105.4 ± 11.1 | 108.5 ± 17.8 | 0.8 |
| Hip circumference (cm) | 112.7 ± 8.2 | 113.2 ± 12.0 | 0.8 |
| Waist to hip ratio | 0.93 ± 0.08 | 0.96 ± 0.1 | 0.7 |
3.1. Anthropometric and Physiological Parameters
| Parameter | Study Group | Baseline | Week 6 | Week 12 | p Value | |
|---|---|---|---|---|---|---|
| Weight | Experimental | 89.5 ± 13.2 | 88.6 ± 12 | 88 ± 11.4 | Group | 0.3 |
| (kg) | Placebo | 92.9 ± 21.2 | 92.2 ± 20.5 | 91.5 ± 21 | Time | 0.3 |
| Interaction | 1 | |||||
| BMI | Experimental | 31.8 ± 3.9 | 30.7 ± 3.6 | 30.4 ± 3.4 | Group | 0.7 |
| (kg/m2) | Placebo | 32.8 ± 6.5 | 32.6 ± 6.4 | 32.2 ± 6.2 | Time | 0.1 |
| Interaction | 1 | |||||
| Waist | Experimental | 106.9 ± 11.7 | 103.6 ± 9.8 | 102.4 ± 11.3 | Group | 1.0 |
| (cm) | Placebo | 106.1 ± 11.2 | 103.7 ± 11.6 | 102.6 ± 15 * | Time | 0.02 |
| Interaction | 0.7 | |||||
| Hip | Experimental | 112.3 ± 5.9 | 109.8 ± 5 | 108.9 ± 5.4 | Group | 0.3 |
| (cm) | Placebo | 115.3 ± 13.2 | 113.8 ± 11.9 | 112.3 ± 12.6 * | Time | 0.01 |
| Interaction | 0.6 | |||||
| WHR | Experimental | 0.95 ± 0.09 | 0.94 ± 0.08 | 0.94 ± 0.08 | Group | 0.3 |
| Placebo | 0.92 ± 0.08 | 0.91 ± 0.09 | 0.91 ± 0.08 | Time | 0.3 | |
| Interaction | 0.8 | |||||
| Systolic BP | Experimental | 125 ± 17 | 128 ± 13 | 125 ± 13 | Group | 0.3 |
| (mmHg) | Placebo | 128 ± 13 | 132 ± 12 | 130 ± 10 | Time | 0.4 |
| Interaction | 0.8 | |||||
| Diastolic BP | Experimental | 79 ± 8 | 79 ± 9 | 77 ± 9 | Group | 0.6 |
| (mmHg) | Placebo | 83 ± 8 | 80 ± 8 | 78 ± 10 | Time | 0.1 |
| Interaction | 0.9 | |||||
| Heart Rate | Experimental | 74 ± 13 | 75 ± 12 | 73 ± 13 | Group | 0.3 |
| (bpm) | Placebo | 76 ± 14 | 73 ± 11 | 74 ± 12 | Time | 0.1 |
| Interaction | 0.6 | |||||
3.2. Metabolic Parameters
| Parameter | Baseline | Week 12 | p Value | |
|---|---|---|---|---|
| Fasting blood glucose (mmol/L) | Group | 0.9 | ||
| Experimental | 5.3 ± 0.5 | 5.5 ± 1.0 | Time | 0.8 |
| Placebo | 5.3 ± 1.0 | 5.5 ± 1.4 | Interaction | 1 |
| Triglycerides (mmol/L) | Group | 0.2 | ||
| Experimental | 1.2 ± 0.5 | 1.1 ± 0.7 | Time | 0.5 |
| Placebo | 1.5 ± 1.0 | 1.4 ± 0.6 | Interaction | 0.8 |
| Total cholesterol (mmol/L) | Group | 0.9 | ||
| Experimental | 4.1 ± 1.2 | 3.7 ± 0.9 | Time | 0.08 |
| Placebo | 4.1 ± 1.1 | 4.5 ± 0.7 | Interaction | 0.9 |
| HDL-C (mmol/L) | Group | 0.4 | ||
| Experimental | 0.9 ± 0.4 | 1.2 ± 0.5 * | Time | 0.01 |
| Placebo | 1.1 ± 0.6 | 1.3 ± 0.5 * | Interaction | 0.7 |
| LDL-C (mmol/L) | Group | 0.6 | ||
| Experimental | 2.76 ± 1.0 | 2.83 ± 1.0 | Time | 0.5 |
| Placebo | 2.5 ± 1.7 | 2.8 ± 0.9 | Interaction | 0.7 |
| HDL:LDL (mmol/L) | Group | 0.6 | ||
| Experimental | 0.4 ± 0.2 | 0.5 ± 0.3 | Time | 0.7 |
| Placebo | 0.5 ± 0.1 | 0.6 ± 0.4 | Interaction | 0.9 |
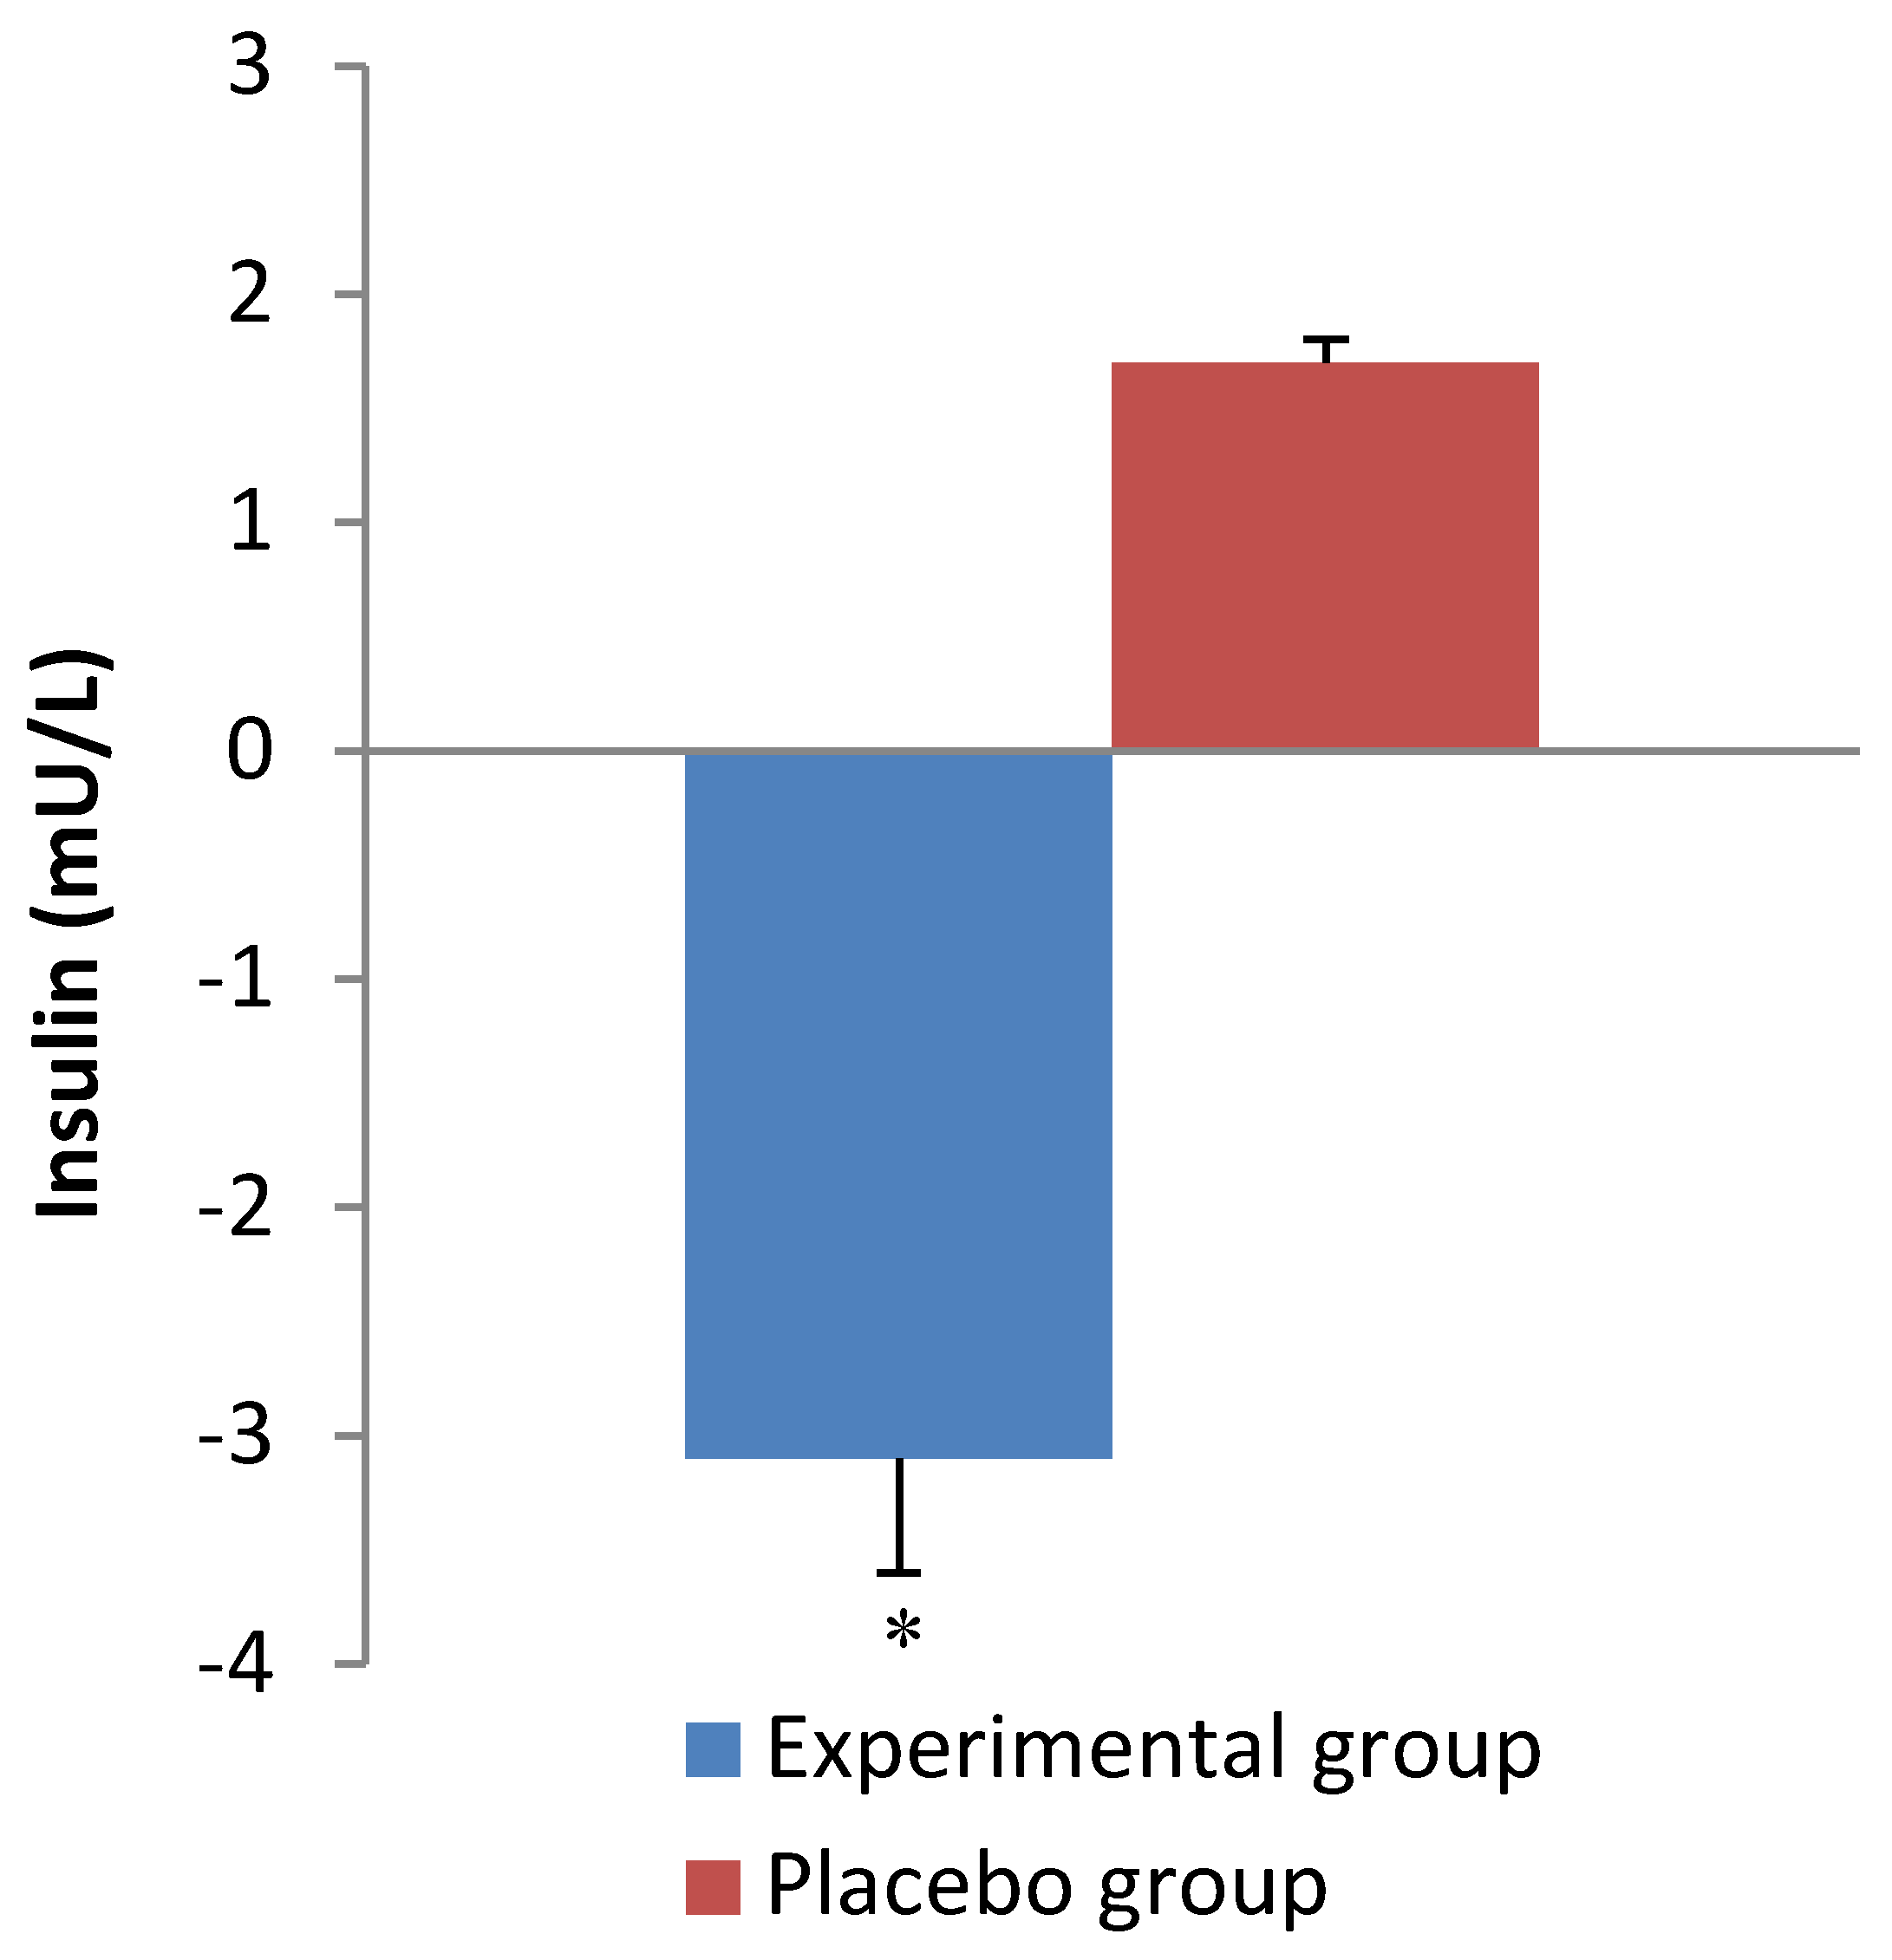
| Insulin (mU/L) | Group | 0.8 | ||
| Experimental | 9.6 ± 5.7 | 6.1 ± 2.3 | Time | 0.2 |
| Placebo | 6.8 ± 3.8 | 8.5 ± 4.1 | Interaction | 0.001 |
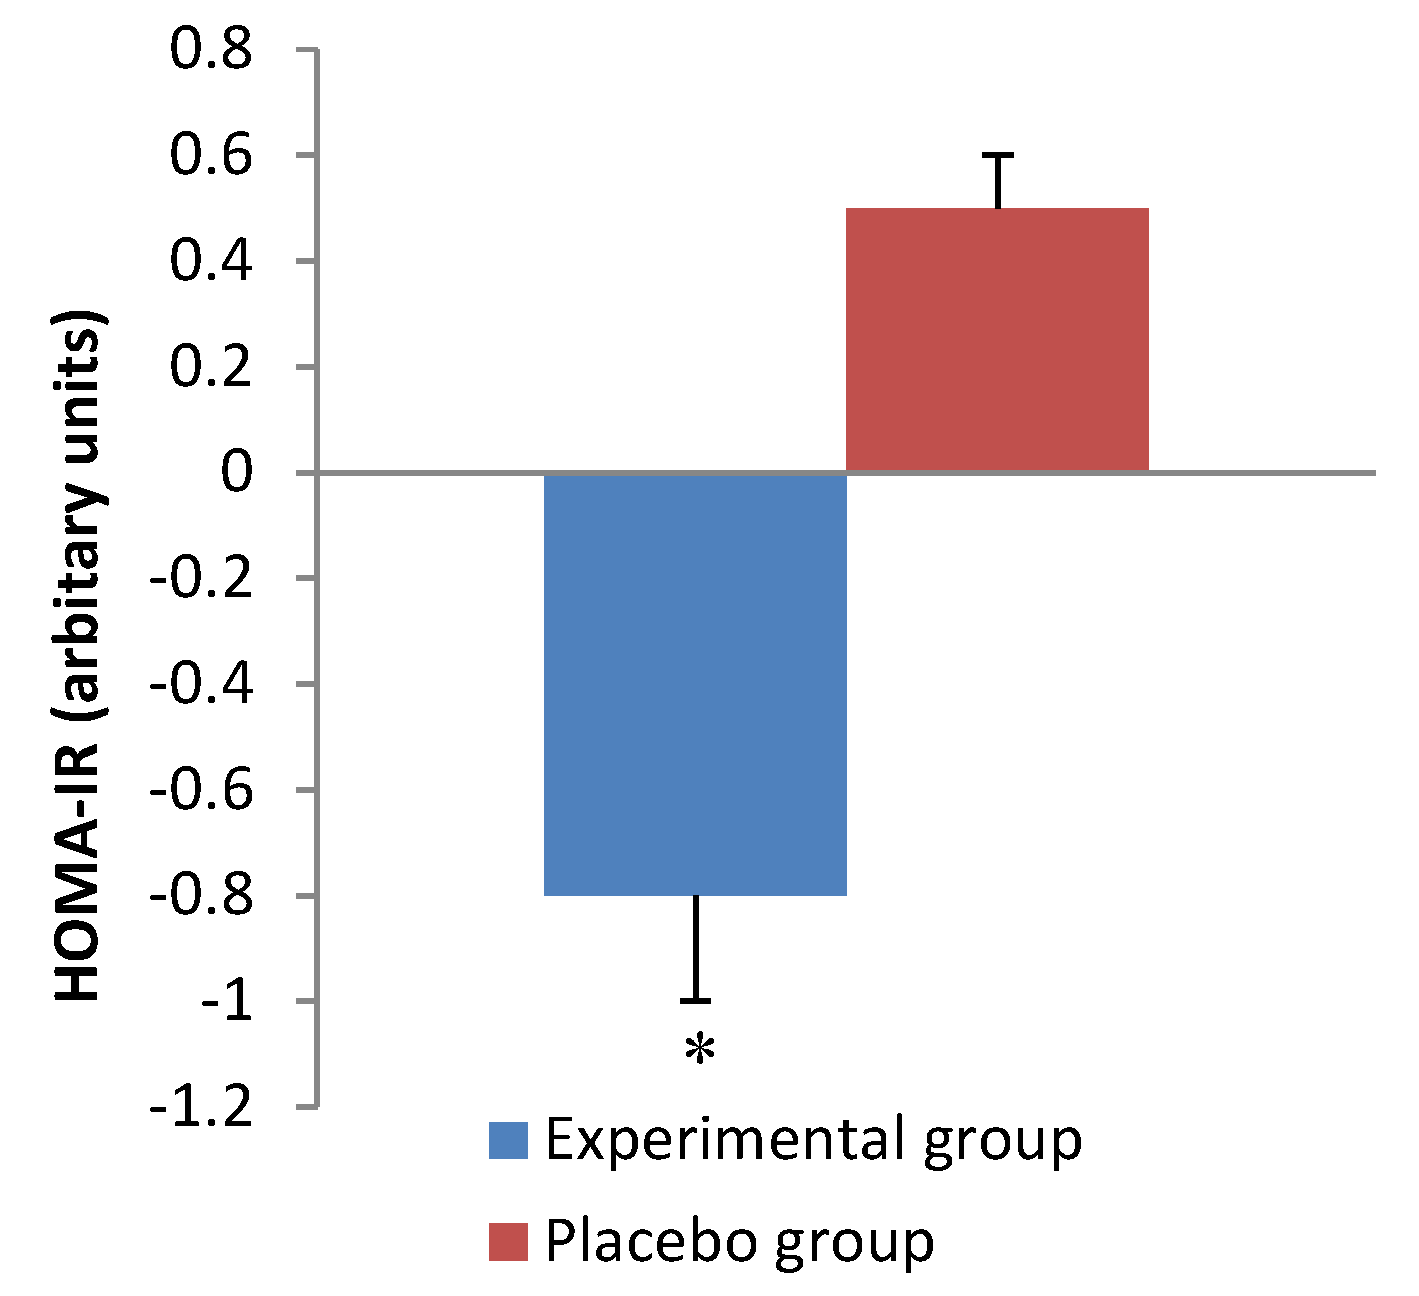
| HOMA-IR | Group | 1 | ||
| Experimental | 2.3 ± 1.5 | 1.5 ± 0.7 | Time | 0.5 |
| Placebo | 1.4 ± 0.9 | 2.1 ± 1.4 | Interaction | 0.01 |
| Ghrelin (pg/mL) | Group | 0.6 | ||
| Experimental | 622 ± 127 | 647 ± 143 | Time | 0.4 |
| Placebo | 643 ± 209 | 686 ± 208 | Interaction | 0.9 |
| Leptin (pg/mL) | Group | 1 | ||
| Experimental | 33938 ± 4117 | 38783 ± 3451 | Time | 0.8 |
| Placebo | 36286 ± 5120 | 32701 ± 9609 | Interaction | 0.5 |

3.3. Dietary Intake and Physical Activity
| Nutrient | Study Group | Week 1 | Week 4 | Week 8 | Week 12 | p Value | |
|---|---|---|---|---|---|---|---|
| Energy | Experimental | 8585 ± 2705 | 7717 ± 1784 | 6742 ± 1427 | 6726 ± 1306 | Group | 0.08 |
| (kJ/day) | Placebo | 9161 ± 3316 | 7923 ± 1235 | 8660 ± 2172 | 8611 ± 1888 * | Time | 0.03 |
| Interaction | 0.1 | ||||||
| Protein | Experimental | 94 ± 31 | 97 ± 19 | 70 ± 12 | 77 ± 10 | Group | 0.02 |
| (g/day) | Placebo | 105 ± 47 | 110 ± 40 | 107 ± 28 | 110 ± 37 | Time | 0.1 |
| Interaction | 0.1 | ||||||
| Carbohydrates | Experimental | 225 ± 62 | 200 ± 57 | 191 ± 53 | 179 ± 36 | Group | 0.5 |
| (g/day) | Placebo | 238 ± 83 | 190 ± 41 | 220 ± 71 | 200 ± 70 * | Time | 0.04 |
| Interaction | 0.4 | ||||||
| Total fat | Experimental | 79 ± 43 | 66 ± 24 | 53 ± 13 * | 54 ± 14 | Group | 0.1 |
| (g/day) | Placebo | 84 ± 39 | 71 ± 22 | 71 ± 31 * | 81 ± 21 * | Time | 0.02 |
| Interaction | 0.2 | ||||||
| Saturated fat | Experimental | 32 ± 18 | 23 ± 9 * | 20 ± 6 * | 23 ± 9 | Group | 0.8 |
| (g/day) | Placebo | 32 ± 17 | 24 ± 7 * | 23 ± 12 * | 23 ± 7 * | Time | 0.01 |
| Interaction | 0.2 | ||||||
| Sodium | Experimental | 2703 ± 824 | 2518 ± 716 | 2571 ± 531 | 2628 ± 820 | Group | 0.8 |
| (mg/day) | Placebo | 3072 ± 1272 | 2350 ± 532 | 2504 ± 877 | 2698 ± 624 | Time | 0.06 |
| Interaction | 0.4 | ||||||
| Alcohol | Experimental | 7 ± 19 | 0.3 ± 1 | 0.7 ± 2 | 1 ± 2 | Group | 0.8 |
| (g/day) | Placebo | 7 ± 9 | 2 ± 4 | 2 ± 4 | 0.7 ± 2 | Time | 0.07 |
| Interaction | 0.8 | ||||||
| Parameter | Baseline | Week 12 | p Value | |
|---|---|---|---|---|
| Energy (kJ/day) | Group | 0.06 | ||
| Experimental | 9012 ± 2944 | 6602 ± 1834 | Time | 1 |
| Placebo | 9659 ± 2630 | 8011 ± 3339 | Interaction | 0.03 |
| Protein (g/day) | Group | 0.06 | ||
| Experimental | 108 ± 32 | 85 ± 25 | Time | 0.8 |
| Placebo | 118 ± 40 | 106 ± 25 | Interaction | 0.3 |
| Total fat (g/day) | Group | 0.1 | ||
| Experimental | 92 ± 35 | 62 ± 27 | Time | 0.6 |
| Placebo | 97 ± 32 | 83 ± 37 | Interaction | 0.04 |
| Saturated fat (g/day) | Group | 0.1 | ||
| Experimental | 36 ± 15 | 24 ± 10 | Time | 0.9 |
| Placebo | 39 ± 15 | 31 ± 17 | Interaction | 0.04 |
| Polyunsaturated fat (g/day) | Group | 0.1 | ||
| Experimental | 14 ± 6 | 10 ± 5 | Time | 0.6 |
| Placebo | 15 ± 6 | 13 ± 5 | Interaction | 0.07 |
| Monounsaturated fat (g/day) | Group | 0.1 | ||
| Experimental | 34 ± 13 | 23 ± 11 | Time | 0.5 |
| Placebo | 35 ± 11 | 32 ± 14 | Interaction | 0.08 |
| Cholesterol (mg/day) | Group | 0.01 | ||
| Experimental | 339 ± 115 | 263 ± 83 | Time | 0.07 |
| Placebo | 408 ± 147 | 388 ± 177 | Interaction | 0.9 |
| Carbohydrates (g/day) | Group | 0.04 | ||
| Experimental | 204 ± 77 | 146 ± 29 | Time | 0.7 |
| Placebo | 223 ± 67 | 176 ± 45 | Interaction | 0.02 |
| Fiber (g/day) | Group | 0.2 | ||
| Experimental | 19 ± 6 | 18 ± 4 | Time | 0.4 |
| Placebo | 24 ± 8 | 21 ± 7 | Interaction | 0.2 |
| Alcohol (g/day) | Group | 0.9 | ||
| Experimental | 12 ± 19 | 7 ± 12 | Time | 0.8 |
| Placebo | 11 ± 11 | 6 ± 9 | Interaction | 0.4 |
3.4. Appetite Assessment
3.5. Safety and Adverse Events
4. Discussion
5. Conclusions
Acknowledgements
Author Contributions
Conflicts of Interest
References
- Grundy, S.M.; Hansen, B.; Smith, S.J.; Cleeman, J.; Kahn, R.A. Clinical management of metabolic syndrome: Report of the American Heart Association/National Heart, Lung, and Blood Institute/American Diabetes Association conference on scientific issues related to management. Circulation 2004, 109, 551–556. [Google Scholar] [CrossRef] [PubMed]
- Alberti, K.G.; Zimmet, P.; Shaw, J. Metabolic syndrome–A new world-wide definition. A Consensus Statement from the International Diabetes Federation. Diabet Med. 2006, 23, 469–480. [Google Scholar] [CrossRef] [PubMed]
- Expert Panel on Detection Evaluation and Treatment of Overweight in Adults. Clinical Guidelines on the Identification, Evaluation, and Treatment of Overweight and Obesity in Adults; Report No.: 98-4083; National Heart, Lung, and Blood Institute: Bethseda, MD, USA, 1998. [Google Scholar]
- Balkau, B.; Charles, M.A. Comment on the provisional report from the WHO consultation. Diabet. Med. 1999, 16, 442–443. [Google Scholar] [PubMed]
- Reaven, G.M. Role of insulin resistance in human disease (syndrome X): An expanded definition. Annu. Rev. Med. 1993, 44, 121–131. [Google Scholar] [CrossRef] [PubMed]
- Ferrannini, E.; Haffner, S.M.; Mitchell, B.D.; Stern, M.P. Hyperinsulinaemia: The key feature of a cardiovascular and metabolic syndrome. Diabetologia 1991, 34, 416–422. [Google Scholar] [CrossRef] [PubMed]
- Boden, G. Obesity, insulin resistance and free fatty acids. Curr. Opin. Endocrinol. Diabetes Obes. 2011, 18, 139–143. [Google Scholar] [CrossRef] [PubMed]
- Savage, D.B.; Petersen, K.F.; Shulman, G.I. Mechanisms of insulin resistance in humans and possible links with inflammation. Hypertension 2005, 45, 828–833. [Google Scholar] [CrossRef] [PubMed]
- Ford, E.S. Risks for all-cause mortality, cardiovascular disease, and diabetes associated wth the metabolic syndrome. Diabetes Care 2005, 28, 1769–1778. [Google Scholar] [CrossRef] [PubMed]
- Riccardi, G.; Rivellese, A.A. Dietary treatment of the metabolic syndrome—The optimal diet. Br. J. Nutr. 2000, 83, S143–S148. [Google Scholar] [CrossRef] [PubMed]
- Grundy, S.M.; Cleeman, J.I.; Daniels, S.R.; Donato, K.A.; Eckel, R.H.; Franklin, B.A.; Gordon, D.J.; Krauss, R.M.; Savage, P.J.; Smith, S.C., Jr.; et al. Diagnosis and management of the metabolic syndrome: An American Heart Association/National Heart, Lung, and Blood Institute scientific statement. Circulation 2005, 112, 2735–2752. [Google Scholar] [CrossRef] [PubMed]
- Kaur, J. A Comprehensive review on metabolic syndrome. Cardiol. Res. Pract. 2014, 2014, 21. [Google Scholar] [CrossRef] [PubMed]
- World Health Organization. Obesity: Preventing and Managing the Global Epidemic, Report of a WHO Consultation; WHO technical report series 894; World Health Organization: Geneva, Switzerland, 2000. [Google Scholar]
- Astell, K.; Mathai, M.; Su, X. A review on botanical species and chemical compounds with appetite suppressing properties for body weight control. Plant Foods Hum. Nutr. 2013, 68, 213–221. [Google Scholar] [CrossRef] [PubMed]
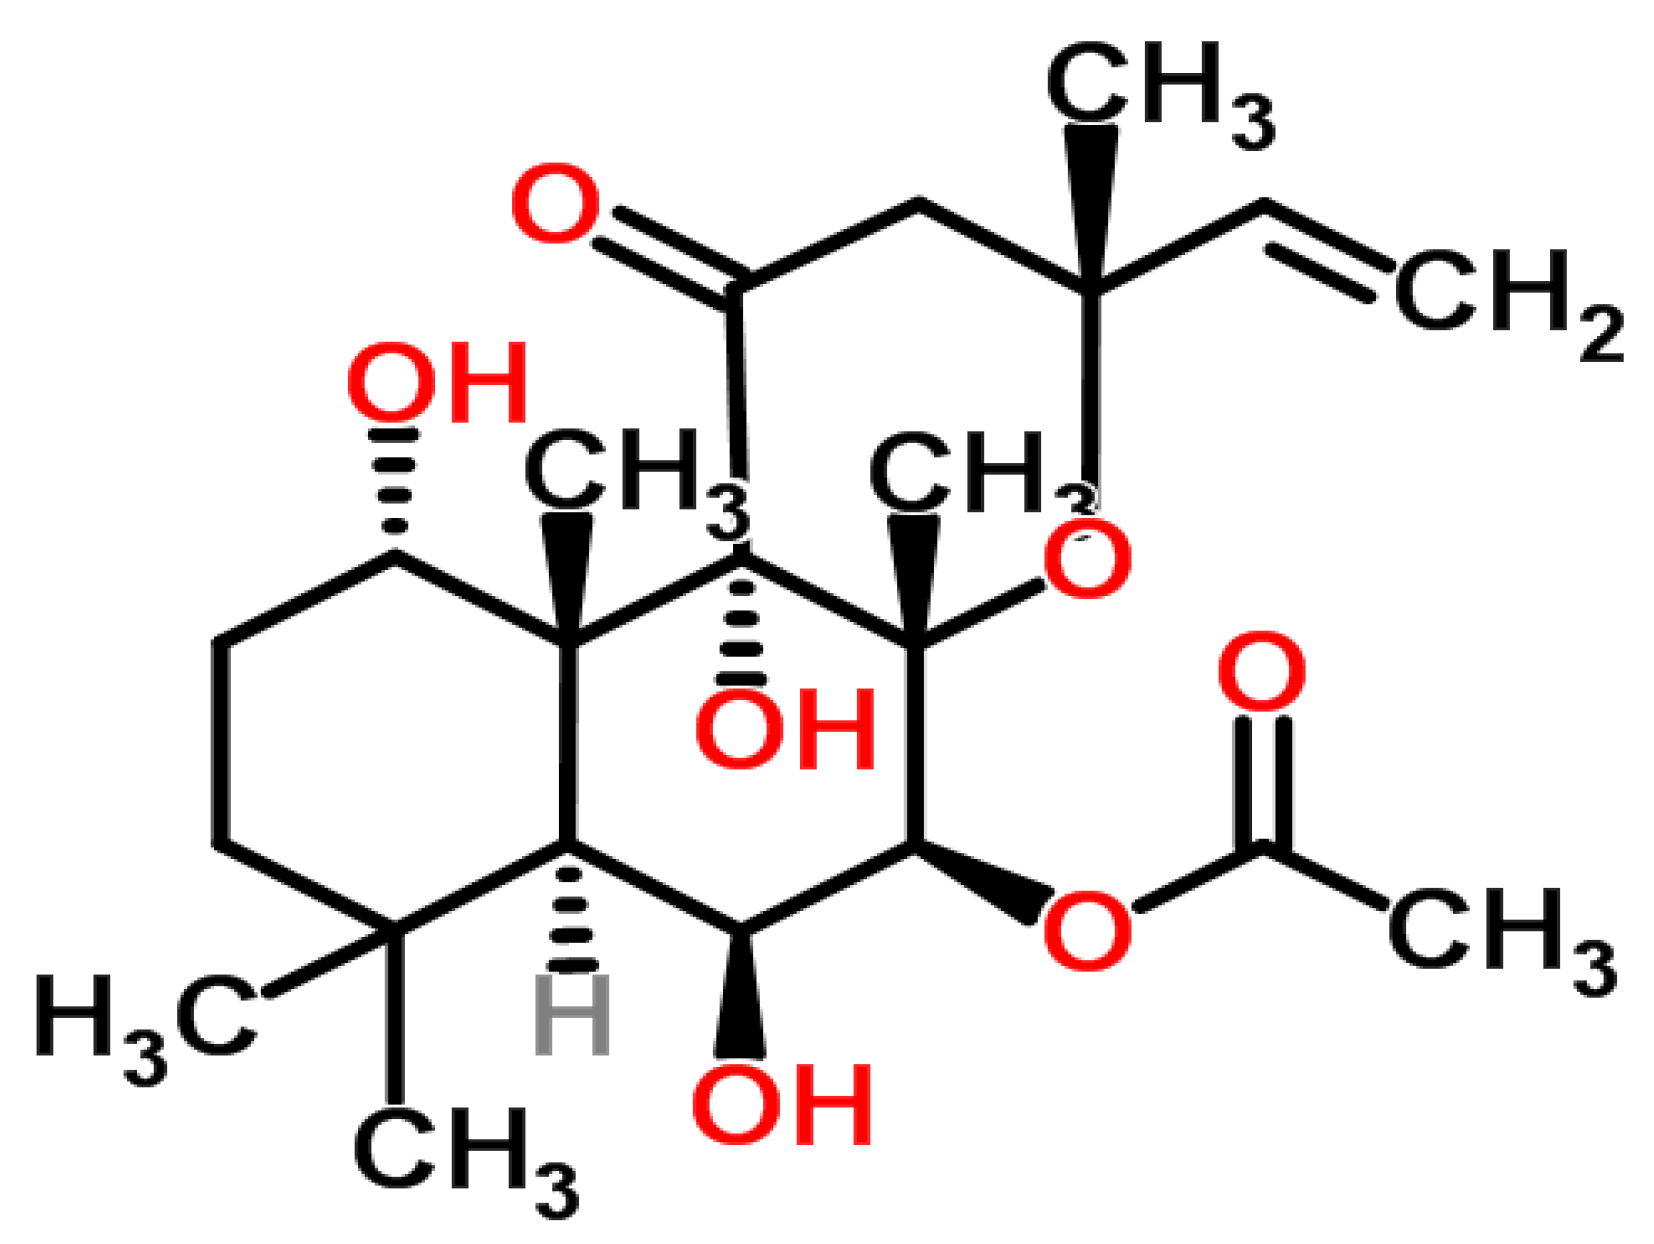
- Lakshmanan, G.M.A.; Manikandan, S.; Panneerselvam, S. Plectranthus forskohlii (Wild) Briq. (Syn: Coleus forskohlii)—A compendium on its botany and medicinal uses. Int. J. Res. Plant Sci. 2013, 3, 72–80. [Google Scholar]
- De Souza, N.J.; Dohadwalla, A.N.; Reden, Ü. Forskolin: A labdane diterpenoid with antihypertensive, positive inotropic, platelet aggregation inhibitory, and adenylate cyclase activating properties. Med. Res. Rev. 1983, 3, 201–219. [Google Scholar] [CrossRef] [PubMed]
- Shah, V.; Bhat, S.; Bajwa, B.; Dornauer, H.; de Souza, N. The occurrence of forskolin in the Labiatae. Planta Med. 1980, 39, 183–185. [Google Scholar] [CrossRef]
- Ho, R.-J.; Shi, Q.-H. Forskolin as a novel lipolytic agent. Biochem. Biophys. Res. Commun. 1982, 107, 157–164. [Google Scholar] [CrossRef]
- Allen, D.O.; Ahmed, B.; Naseer, K. Relationships between cyclic AMP levels and lipolysis in fat cells after isoproterenol and forskolin stimulation. J. Pharmacol. Exp. Ther. 1986, 238, 659–664. [Google Scholar] [PubMed]
- Schimmel, R.J. Stimulation of cAMP accumulation and lipolysis in hampster adipocytes with forskolin. Am. J. Physiol. 1984, 246, C63–C68. [Google Scholar] [PubMed]
- Litosch, I.; Hudson, T.H.; Mills, I.; Li, S.Y.; Fain, J.N. Forskolin as an activator of cyclic AMP accumulation and lipolysis in rat adipocytes. Mol. Pharmacol. 1982, 22, 109–115. [Google Scholar] [PubMed]
- Godard, M.P.; Johnson, B.A.; Richmond, S.R. Body composition and hormonal adaptations associated with forskolin consumption in overweight and obese men. Obes. Res. 2005, 13, 1335–1343. [Google Scholar] [CrossRef] [PubMed]
- Badmeav, V.; Majeed, M.; Conte, A.; Parker, J. Diterpene Forskolin (Coleus forskohlii Benth.): A possible new compound for reduction of body weight by increasing lean body mass. NutraCos 2002, 1, 6–7. [Google Scholar]
- Kamohara, S.; Noparatanawong, S. A Coleus forskohlii extract improves body composition in healthy volunteers: An open-label trial. Personal. Med. Universe 2013, 2, 25–27. [Google Scholar] [CrossRef]
- Henderson, S.; Magu, B.; Rasmussen, C.; Lancaster, S.; Kerksick, C.; Smith, P.; Melton, C.; Cowan, P.; Greenwood, M.; Earnest, C.; et al. Effects of Coleus forskohlii supplementation on body composition and hematological profiles in mildly overweight women. J. Int. Soc. Sports Nutr. 2005, 2, 54–62. [Google Scholar] [CrossRef] [PubMed]
- Giles, G.; Ireland, P. Dietary Questionnaire for Epidemiological Studies (Version 2); Cancer Council: Melbourne, Australia, 1996. [Google Scholar]
- Booth, M.L.; Ainsworth, B.E.; Pratt, M.; Ekelund, U.; Yngve, A.; Sallis, J.F.; Oja, P. International physical activity questionnaire: 12-country reliability and validity. Med. Sci. Sports Exerc. 2003, 195, 3508–1381. [Google Scholar]
- National Health and Medical Research Council. Clinical Practice Guidelines for the Management of Overweight and Obesity in Adults, Adolescents and Children in Australia; National Health and Medical Research Council: Melbourne, Australia, 2013. Available online: www.nhmrc.gov.au/guidelines/publications/n57 (accessed on 13 March 2014).
- Centers for Disease Control and Prevention. NHANES III Anthropometric Procedure Videos. Available online: http://www.cdc.gov/nchs/nhanes/nhanes3/anthropometric_videos.htm (accessed on 13 March 2014).
- Friedewald, W.; Levy, R.I.; Fredrickson, D. Estimation of the concentration of low-density lipoprotein cholesterol in plasma, without use of the preparative ultracentrifuge. Clin. Chem. 1972, 18, 499–503. [Google Scholar] [PubMed]
- Ma, Z.; Gingerich, R.L.; Santiago, J.V.; Klein, S.; Smith, C.H.; Landt, M. Radioimmunoassay of leptin in human plasma. Clin. Chem. 1996, 42, 942–946. [Google Scholar] [PubMed]
- Matthews, D.R.; Hosker, J.P.; Rudenski, A.S.; Naylor, B.A.; Treacher, D.F.; Turner, R.C. Homeostasis model assessment: Insulin resistance and β-cell function from fasting plasma glucose and insulin concentrations in man. Diabetologia 1985, 28, 412–419. [Google Scholar] [CrossRef] [PubMed]
- Flint, A.; Raben, A.; Blundell, J.E.; Astrup, A. Reproducibility, power and validity of visual analogue scales in assessment of appetite sensations in single test meal studies. Int. J. Obes. Relat. Metab. Disord. 2000, 24, 38–48. [Google Scholar] [CrossRef] [PubMed]
- Green, S.M.; Delargy, H.J.; Joanes, D.; Blundell, J.E. A satiety quotient: A formulation to assess the satiating effect of food. Appetite 1997, 29, 291–304. [Google Scholar] [CrossRef] [PubMed]
- Hodge, A. The Anti Cancer Council of Victoria FFQ: Relative validity of nutrient intakes compared with weighed food records in young to middle-aged women in a study of iron supplementation. Aust. N. Z. J. Public Health 2000, 24, 576–583. [Google Scholar] [CrossRef] [PubMed]
- Woods, R.K.; Stoney, R.M.; lreland, P.D.; Baileyl, M.J.; Raven, J.M.; Thien, F.C.K.; Walters, H.A.; Michael, J. A valid food frequency questionnaire for measuring dietary fish intake. Asia Pac. J. Clin. Nutr. 2002, 11, 56–61. [Google Scholar] [CrossRef] [PubMed]
- Bray, G.A. Medical consequences of obesity. J. Clin. Endocrinol. Metab. 2004, 89, 2583–2589. [Google Scholar] [CrossRef] [PubMed]
- Verweij, L.M.; Terwee, C.B.; Proper, K.I.; Hulshof, C.T.; van Mechelen, W. Measurement error of waist circumference: Gaps in knowledge. Public Health Nutr. 2013, 16, 281–288. [Google Scholar] [CrossRef] [PubMed]
- Seidell, J.C.; Pérusse, L.; Després, J.-P.; Bouchard, C. Waist and hip circumferences have independent and opposite effects on cardiovascular disease risk factors: The Quebec Family Study. Am. J. Clin. Nutr. 2001, 74, 315–321. [Google Scholar] [PubMed]
- Westerterp, K.R.; Goris, A.H. Validity of the assessment of dietary intake: Problems of misreporting. Curr. Opin. Clin. Nutr. Metab. Care 2002, 5, 489–493. [Google Scholar] [CrossRef] [PubMed]
- Rothenberg, E. Validation of the food frequency questionnaire with the 4-day record method and analysis of 24-h urinary nitrogen. Eur. J. Clin. Nutr. 1994, 48, 725–735. [Google Scholar] [PubMed]
- Stewart, J.E.; Feinle-Bisset, C.; Golding, M.; Delahunty, C.; Clifton, P.M.; Keast, R.S.J. Oral sensitivity to fatty acids, food consumption and BMI in human subjects. Br. J. Nutr. 2010, 104, 145–152. [Google Scholar] [CrossRef] [PubMed]
- Keast, R.; Costanzo, A. Is fat the sixth taste primary? Evidence and implications. Flavour 2015, 4, 1–7. [Google Scholar] [CrossRef]
- Wren, A.M.; Seal, L.J.; Cohen, M.A.; Brynes, A.E.; Frost, G.S.; Murphy, K.G.; Dhillo, W.S.; Ghatei, M.A.; Bloom, S.R. Ghrelin enhances appetite and increases food intake in humans. J. Clin. Endocrinol. Metab. 2001, 86, 5992. [Google Scholar] [CrossRef] [PubMed]
- Ostlund, R.E., Jr.; Yang, J.W.; Klein, S.; Gingerich, R. Relation between plasma leptin concentration and body fat, gender, diet, age, and metabolic covariates. J. Clin. Endocrinol. Metab. 1996, 81, 3909–3913. [Google Scholar] [PubMed]
- Doseyici, S.; Mehmetoglu, I.; Toker, A.; Yerlikaya, F.; Erbay, E. The effects of forskolin and rolipram on cAMP, cGMP and free fatty acid levels in diet induced obesity. Biotech. Histochem. 2014, 88, 388–392. [Google Scholar] [CrossRef] [PubMed]
- Shivaprasad, H.N.; Gopalakrishna, S.; Mariyanna, B.; Thekkoot, M.; Reddy, R.; Tippeswamy, B.S. Effect of Coleus forskohlii extract on cafeteria diet-induced obesity in rats. Pharmacogn. Res. 2014, 6, 42–45. [Google Scholar]
- Mattes, R. Hunger ratings are not a valid proxy measure of reported food intake in humans. Appetite 1990, 15, 103–113. [Google Scholar] [CrossRef]
- Huda, M.S.; Wilding, J.P.; Pinkney, J.H. Gut peptides and the regulation of appetite. Obes. Rev. Off. J. Int. Assoc. Study Obes. 2006, 7, 163–182. [Google Scholar] [CrossRef] [PubMed]
- Merchant, A.T.; Anand, S.S.; Kelemen, L.E.; Vuksan, V.; Jacobs, R.; Davis, B.; Teo, K.; Yusuf, S. Carbohydrate intake and HDL in a multiethnic population. Am. J. Clin. Nutr. 2007, 85, 225–230. [Google Scholar] [PubMed]
- Radhika, G.; Ganesan, A.; Sathya, R.M.; Sudha, V.; Mohan, V. Dietary carbohydrates, glycemic load and serum high-density lipoprotein cholesterol concentrations among South Indian adults. Eur. J. Clin. Nutr. 2009, 63, 413–420. [Google Scholar] [CrossRef] [PubMed]
- Choi, H.; Song, S.; Kim, J.; Chung, J.; Yoon, J.; Paik, H.Y.; Song, Y. High carbohydrate intake was inversely associated with high-density lipoprotein cholesterol among Korean adults. Nutr. Res. 2012, 32, 100–106. [Google Scholar] [CrossRef] [PubMed]
- Agren, J.J.; Hallikainen, M.; Vidgren, H.; Miettinen, T.A.; Gylling, H. Postprandial lipemic response and lipoprotein composition in subjects with low or high cholesterol absorption efficiency. Clin. Chim. Acta 2006, 366, 309–315. [Google Scholar] [CrossRef] [PubMed]
- Von Eckardstein, A.; Assmann, G. Prevention of coronary heart disease by raising high-density lipoprotein cholesterol? Curr. Opin. Lipidol. 2000, 11, 627–637. [Google Scholar] [CrossRef] [PubMed]
- Rye, K.A.; Barter, P.J. Cardioprotective functions of HDLs. J. Lipid Res. 2014, 55, 168–179. [Google Scholar] [CrossRef] [PubMed]
- Reaven, G. Metabolic syndrome: Pathophysiology and implications for management of cardiovascular disease. Circulation 2002, 106, 286–288. [Google Scholar] [CrossRef] [PubMed]
- National Institutes of Health. Dietary Supplements for Weight Loss Fact Sheet for Health Professionals. Available online: https://ods.od.nih.gov/factsheets/WeightLoss-HealthProfessional/ (accessed on 12 October 2015).
- Osefo, N.; Ito, T.; Jensen, R.T. Gastric acid hypersecretory states: Recent insights and advances. Curr. Gastroenterol. Rep. 2009, 11, 433–441. [Google Scholar] [CrossRef] [PubMed]
- Chew, C.S. Forskolin stimulation of acid and pepsinogen secretion in isolated gastric glands. Am. J. Physiol. 1983, 245, C371–C380. [Google Scholar] [PubMed]
© 2015 by the authors; licensee MDPI, Basel, Switzerland. This article is an open access article distributed under the terms and conditions of the Creative Commons by Attribution (CC-BY) license (http://creativecommons.org/licenses/by/4.0/).
Share and Cite
Loftus, H.L.; Astell, K.J.; Mathai, M.L.; Su, X.Q. Coleus forskohlii Extract Supplementation in Conjunction with a Hypocaloric Diet Reduces the Risk Factors of Metabolic Syndrome in Overweight and Obese Subjects: A Randomized Controlled Trial. Nutrients 2015, 7, 9508-9522. https://doi.org/10.3390/nu7115483
Loftus HL, Astell KJ, Mathai ML, Su XQ. Coleus forskohlii Extract Supplementation in Conjunction with a Hypocaloric Diet Reduces the Risk Factors of Metabolic Syndrome in Overweight and Obese Subjects: A Randomized Controlled Trial. Nutrients. 2015; 7(11):9508-9522. https://doi.org/10.3390/nu7115483
Chicago/Turabian StyleLoftus, Hayley L., Katie J. Astell, Michael L. Mathai, and Xiao Q. Su. 2015. "Coleus forskohlii Extract Supplementation in Conjunction with a Hypocaloric Diet Reduces the Risk Factors of Metabolic Syndrome in Overweight and Obese Subjects: A Randomized Controlled Trial" Nutrients 7, no. 11: 9508-9522. https://doi.org/10.3390/nu7115483