The Effect of Increasing the Protein Content of Human Milk Fortifier to 1.8 g/100 mL on Growth in Preterm Infants: A Randomised Controlled Trial

 , and
, and
Abstract
:1. Introduction
2. Materials and Methods
2.1. Study Design
2.2. Participants
2.3. Randomisation and Blinding
2.4. Interventions
2.5. Intervention Administration
2.6. Nutritional Intake
2.7. Outcome Assessments
2.7.1. Primary outcome
2.7.2. Secondary Efficacy and Safety Outcomes
2.7.3. Biochemical Analyses
2.7.4. Sample Size and Statistical Analysis
2.7.5. Ethics
3. Results
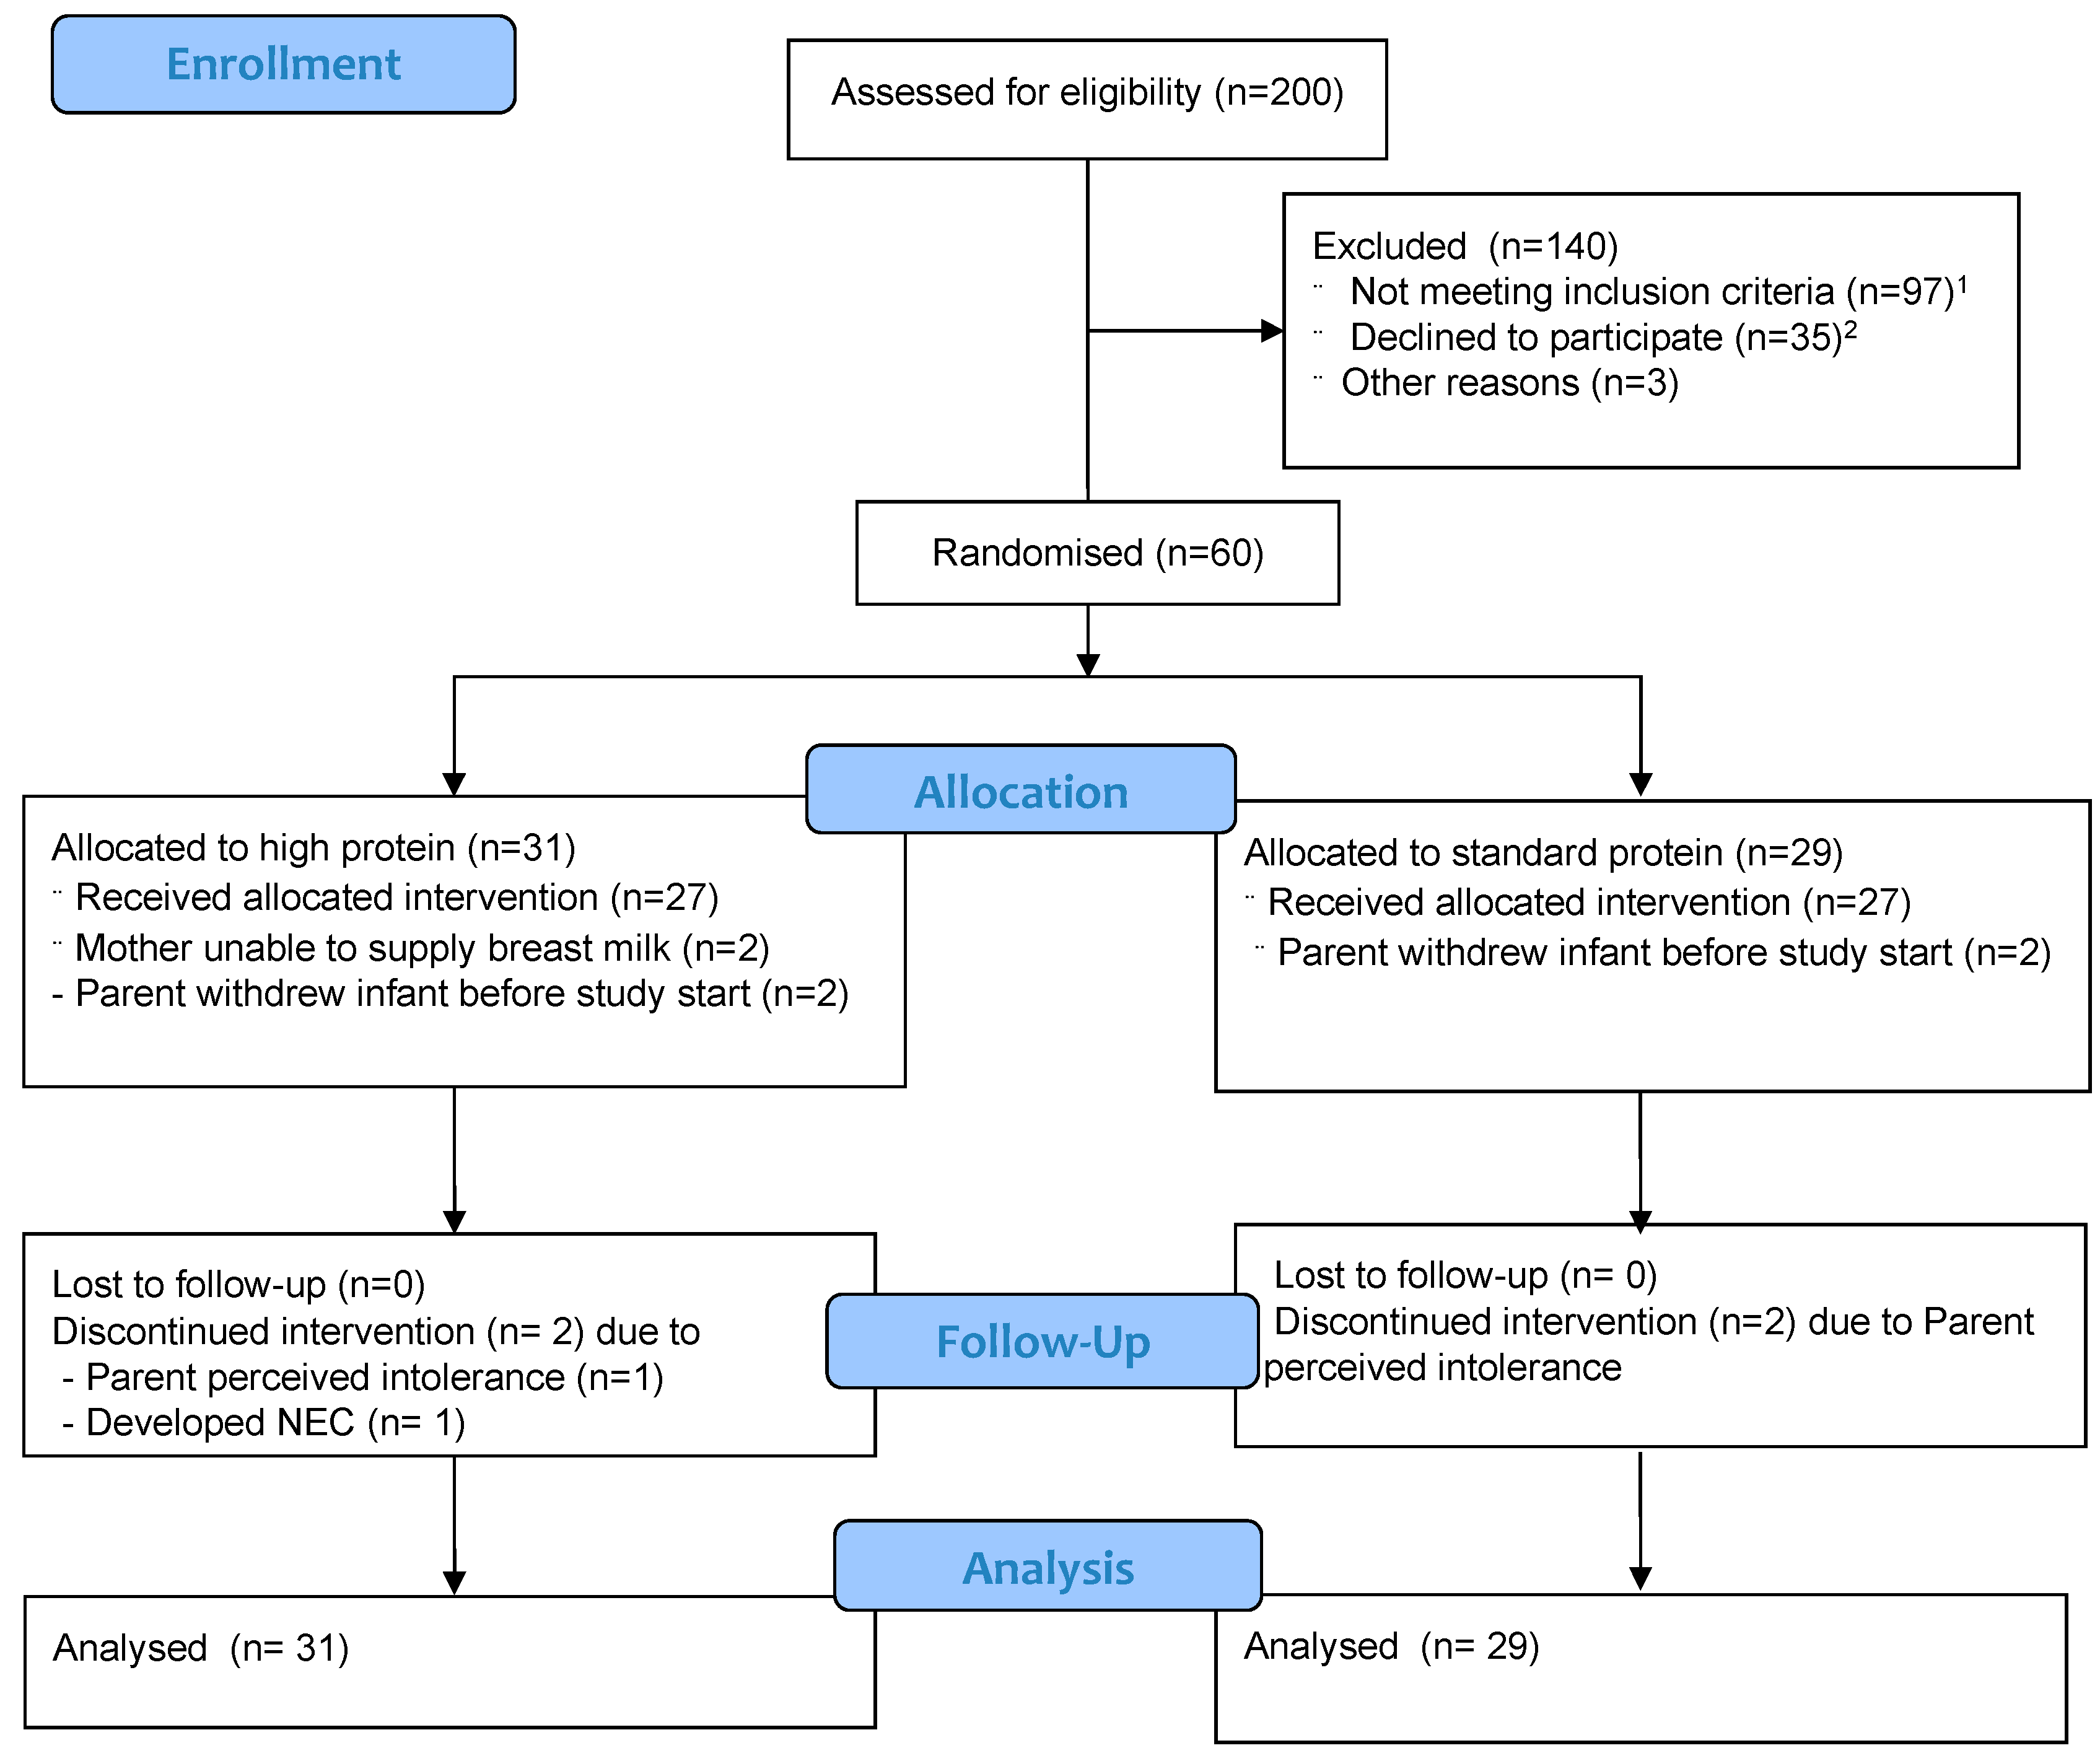
3.1. Study Population
3.2. Nutritional Management
3.3. Primary Outcome
3.4. Secondary Outcomes
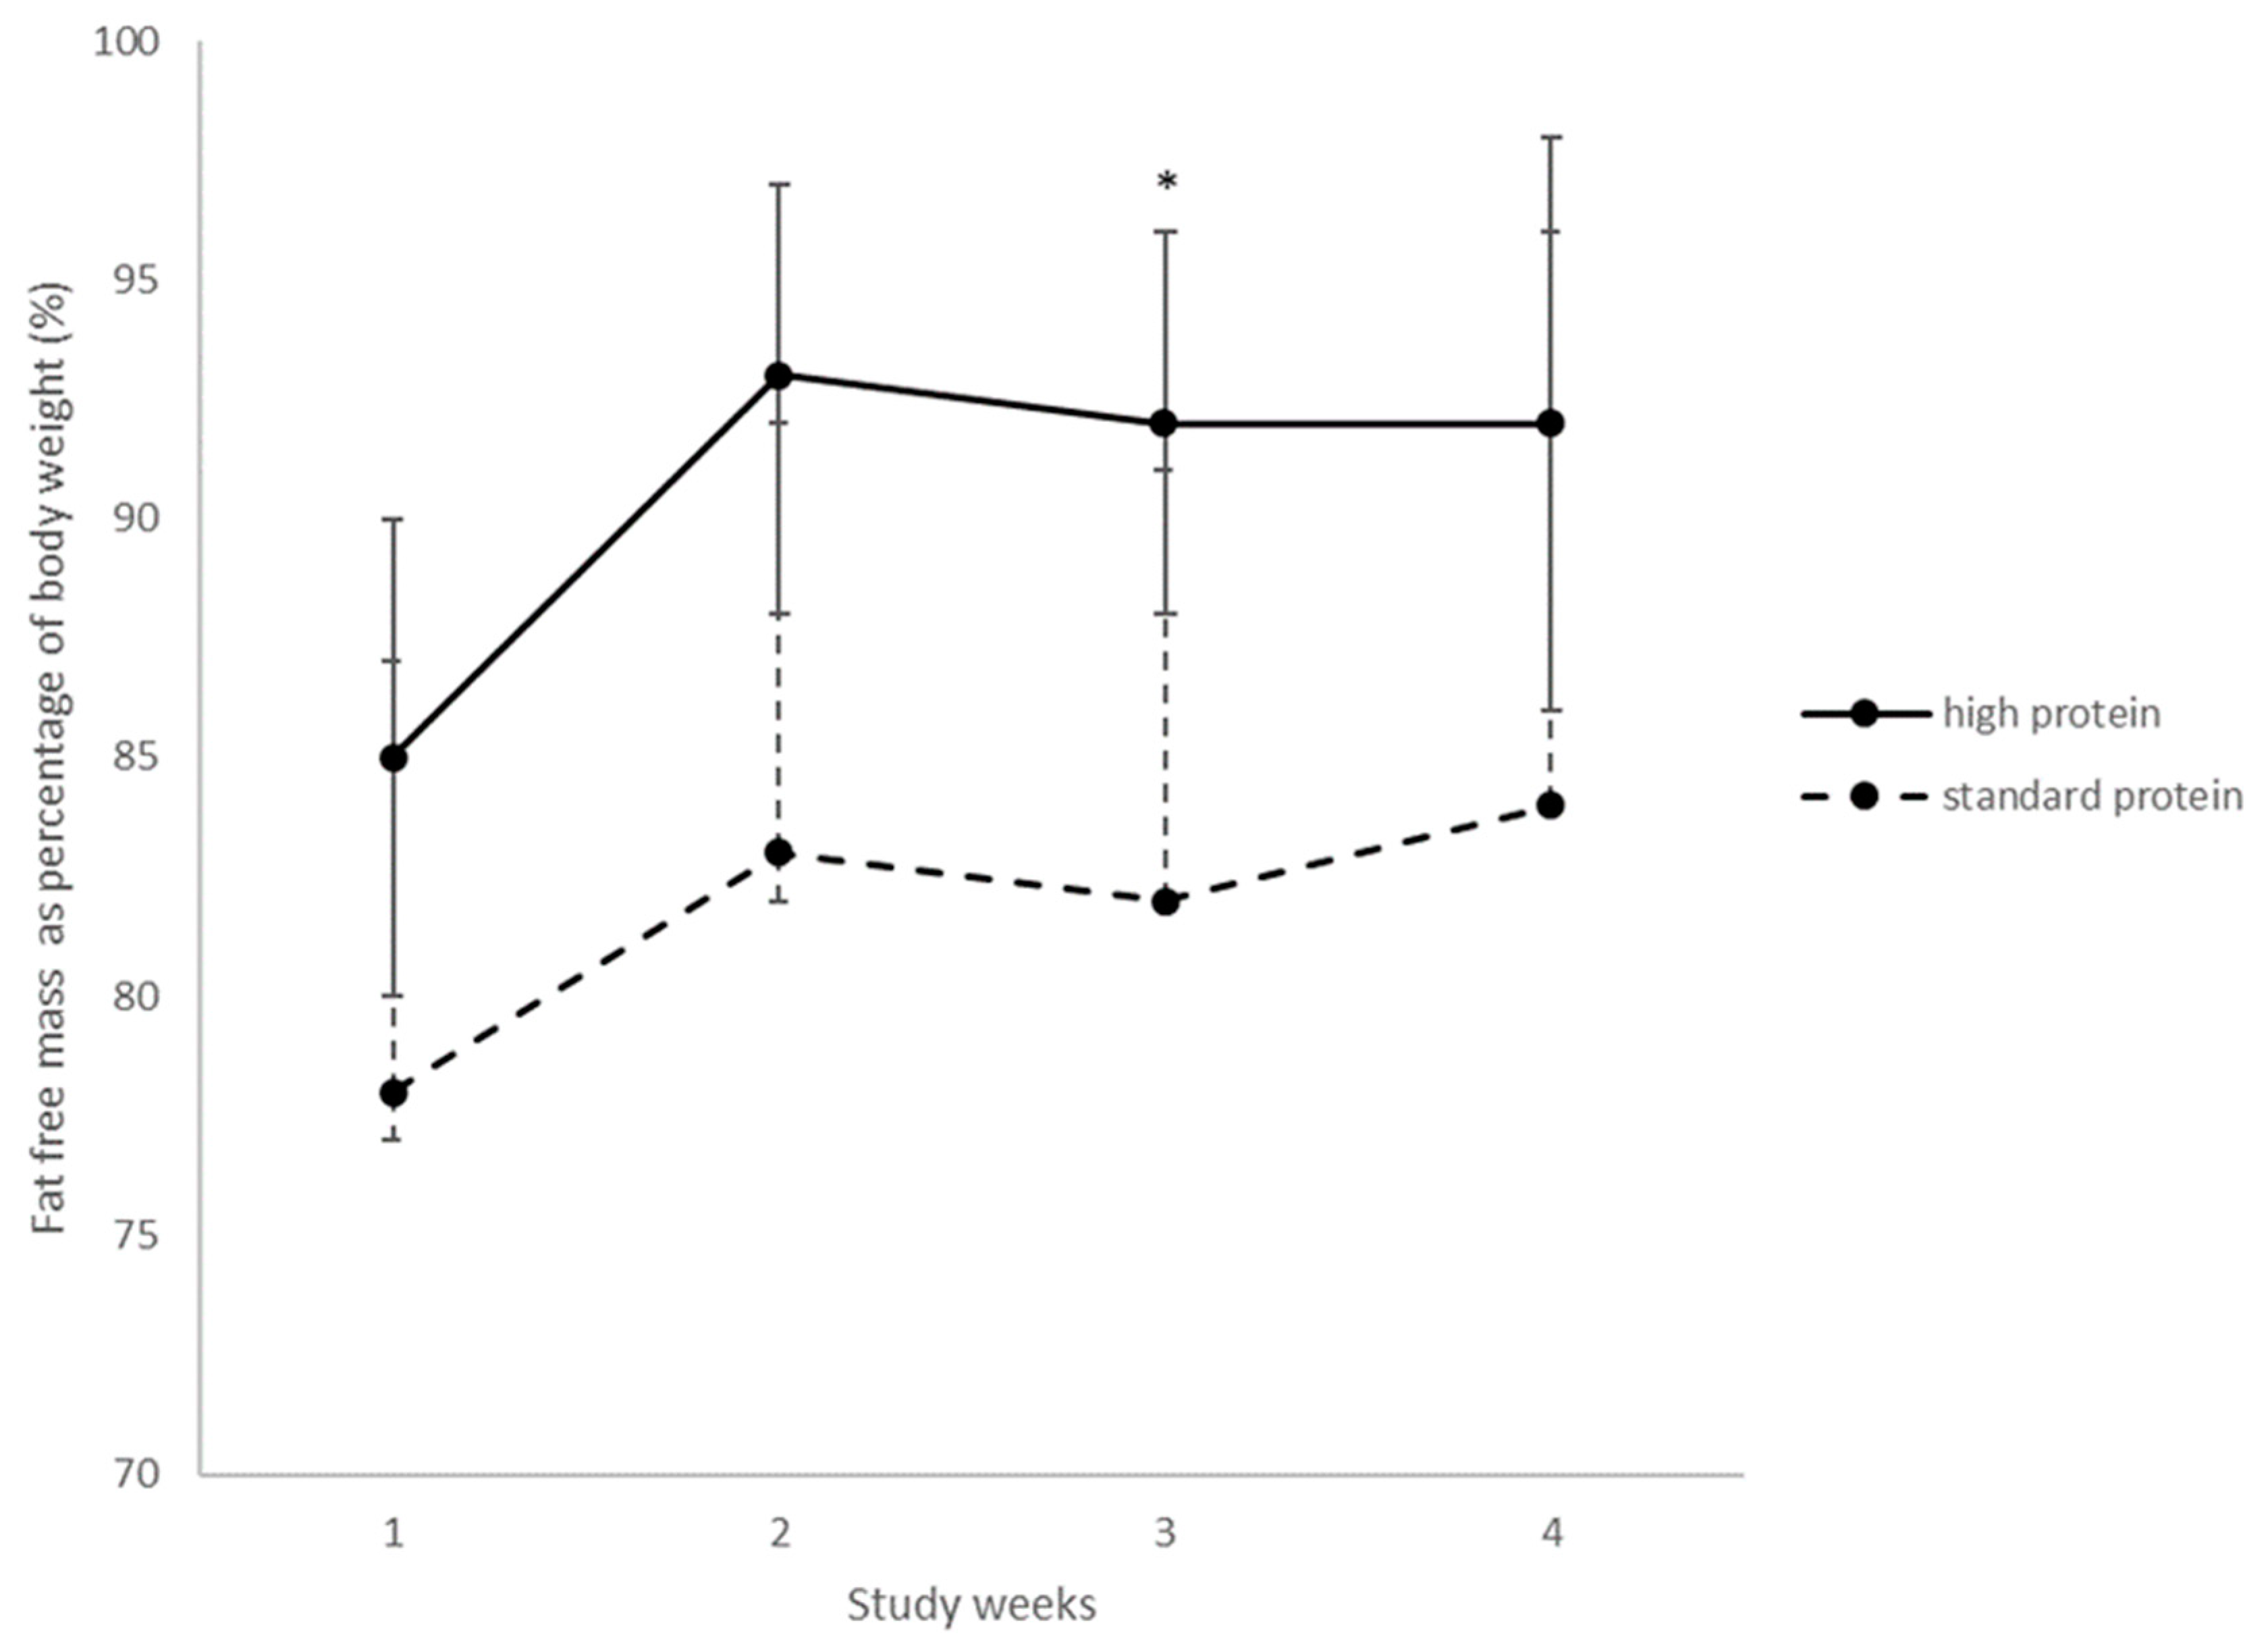
3.4.1. Growth
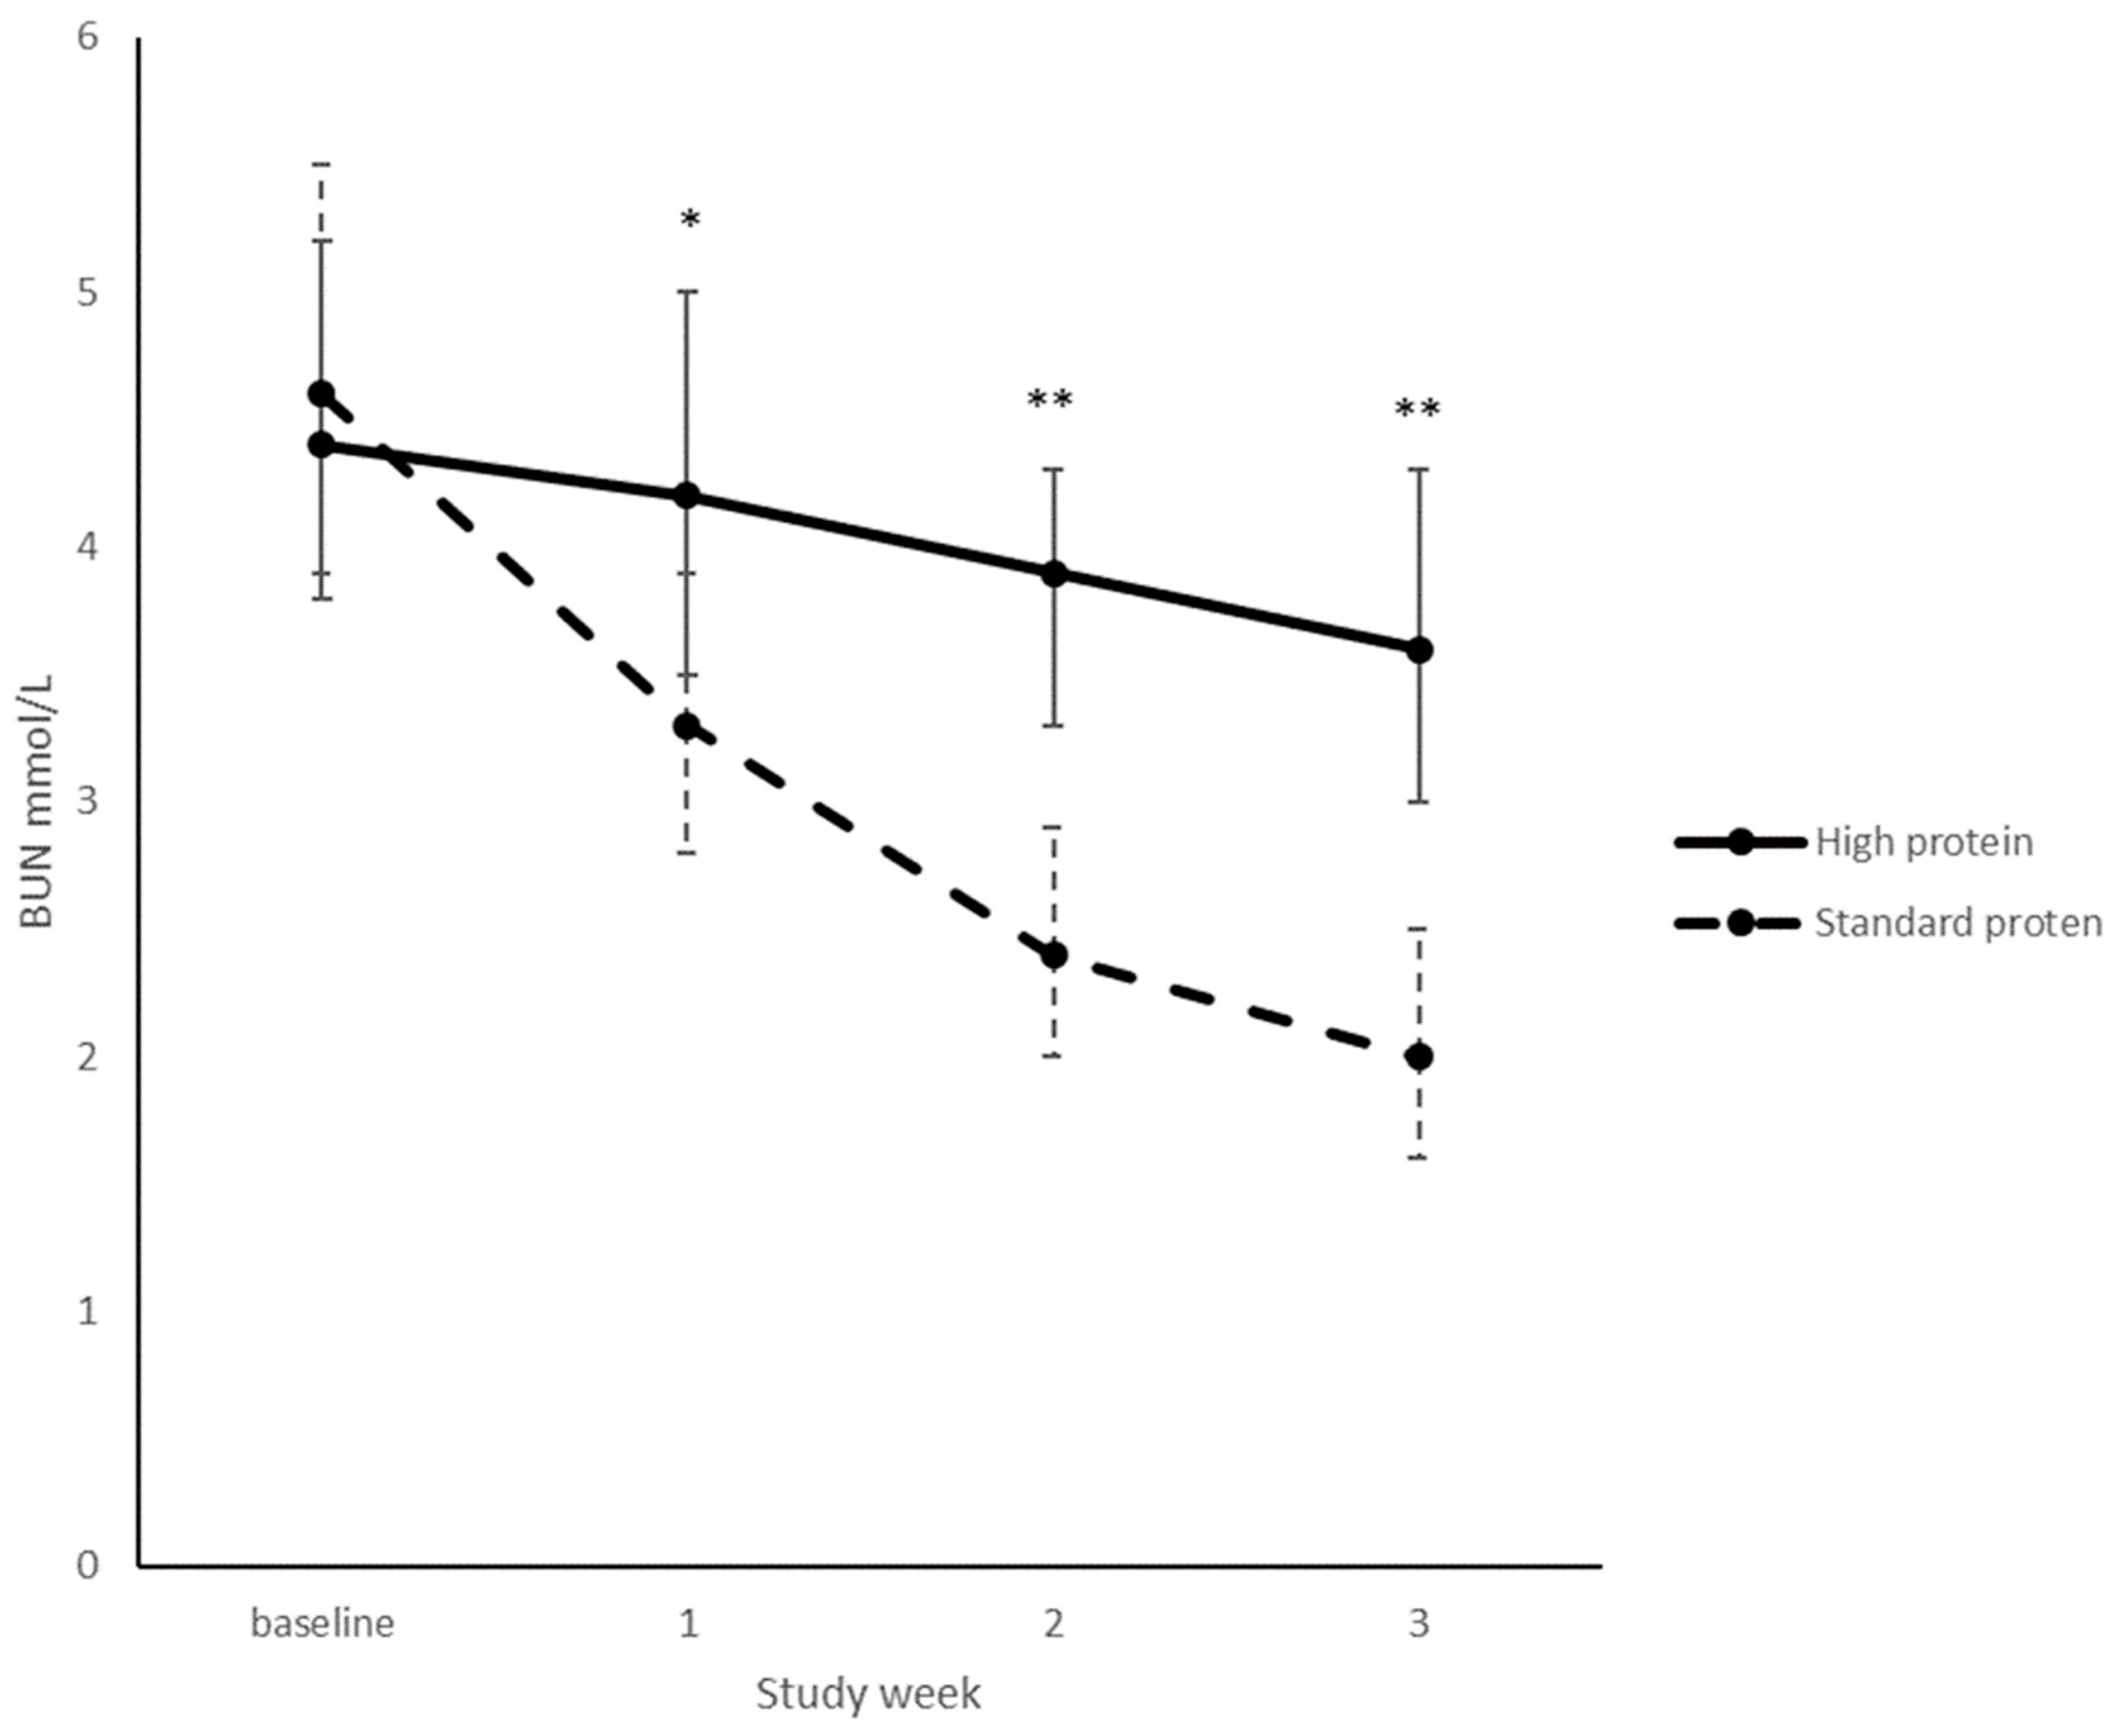
3.4.2. Biochemistry
3.4.3. Clinical Outcomes
4. Discussion
5. Conclusions
Author Contributions
Funding
Acknowledgments
Conflicts of Interest
References
- Adamkin, D.H.; Radmacher, P.G. Fortification of human milk in very low birth weight infants (VLBW <1500 g birth weight). Clin. Perinatol. 2014, 41, 405–421. [Google Scholar] [CrossRef] [PubMed]
- Moro, G.E.; Arslanoglu, S.; Bertino, E.; Corvaglia, L.; Montirosso, R.; Picaud, J.C.; Polberger, S.; Schanler, R.J.; Steel, C.; van Goudoever, J.; et al. Human milk in feeding premature infants: Consensus statement. J. Pediatr. Gastroenterol. Nutr. 2015, 61 (Suppl. 1), S16–S19. [Google Scholar] [CrossRef] [PubMed]
- Brown, J.V.E.; Embleton, N.D.; Harding, J.E.; McGuire, W. Multi-nutrient fortification of human milk for preterm infants. Cochrane Database Syst. Rev. 2016. [Google Scholar] [CrossRef] [PubMed]
- Agostoni, C.; Buonocore, G.; Carnielli, V.P.; De Curtis, M.; Darmaun, D.; Decsi, T.; Domellof, M.; Embleton, N.D.; Fusch, C.; Genzel-Boroviczeny, O.; et al. Enteral nutrient supply for preterm infants: Commentary from the European Society of Paediatric Gastroenterology, Hepatology and Nutrition committee on nutrition. J. Pediatr. Gastroenterol. Nutr. 2010, 50, 85–91. [Google Scholar] [CrossRef] [PubMed]
- Colaizy, T.T.; Carlson, S.; Saftlas, A.F.; Morriss, F.H., Jr. Growth in vlbw infants fed predominantly fortified maternal and donor human milk diets: A retrospective cohort study. BMC Pediatr. 2012, 12, 124. [Google Scholar] [CrossRef] [PubMed]
- Embleton, N.E.; Pang, N.; Cooke, R.J. Postnatal malnutrition and growth retardation: An inevitable consequence of current recommendations in preterm infants? Pediatrics 2001, 107, 270–273. [Google Scholar] [CrossRef] [PubMed]
- Maas, C.; Wiechers, C.; Bernhard, W.; Poets, C.F.; Franz, A.R. Early feeding of fortified breast milk and in-hospital-growth in very premature infants: A retrospective cohort analysis. BMC Pediatr. 2013, 13, 178. [Google Scholar] [CrossRef] [PubMed]
- Cibulskis, C.C.; Armbrecht, E.S. Association of metabolic acidosis with bovine milk-based human milk fortifiers. J. Perinatol. 2015, 35, 115–119. [Google Scholar] [CrossRef] [PubMed]
- Arslanoglu, S.; Moro, G.E.; Ziegler, E.E. Adjustable fortification of human milk fed to preterm infants: Does it make a difference? J. Perinatol. 2006, 26, 614–621. [Google Scholar] [CrossRef] [PubMed]
- Alan, S.; Atasay, B.; Cakir, U.; Yildiz, D.; Kilic, A.; Kahvecioglu, D.; Erdeve, O.; Arsan, S. An intention to achieve better postnatal in-hospital-growth for preterm infants: Adjustable protein fortification of human milk. Early Hum. Dev. 2013, 89, 1017–1023. [Google Scholar] [CrossRef] [PubMed]
- Biasini, A.; Marvulli, L.; Neri, E.; China, M.; Stella, M.; Monti, F. Growth and neurological outcome in ELBW preterms fed with human milk and extra-protein supplementation as routine practice: Do we need further evidence? J. Matern. Fetal Neonatal Med. 2012, 25 (Suppl. 4), 72–74. [Google Scholar] [CrossRef] [PubMed]
- Rochow, N.; Fusch, G.; Choi, A.; Chessell, L.; Elliott, L.; McDonald, K.; Kuiper, E.; Purcha, M.; Turner, S.; Chan, E.; et al. Target fortification of breast milk with fat, protein, and carbohydrates for preterm infants. J. Pediatr. 2013, 163, 1001–1007. [Google Scholar] [CrossRef] [PubMed]
- McLeod, G.; Sherriff, J.; Hartmann, P.E.; Nathan, E.; Geddes, D.; Simmer, K. Comparing different methods of human breast milk fortification using measured v. Assumed macronutrient composition to target reference growth: A randomised controlled trial. Br. J. Nutr. 2016, 115, 431–439. [Google Scholar] [CrossRef] [PubMed]
- Miller, J.; Makrides, M.; Gibson, R.A.; McPhee, A.J.; Stanford, T.E.; Morris, S.; Ryan, P.; Collins, C.T. Effect of increasing protein content of human milk fortifier on growth in preterm infants born at <31 wk gestation: A randomized controlled trial. Am. J. Clin. Nutr. 2012, 95, 648–655. [Google Scholar] [CrossRef] [PubMed]
- Beeby, P.J.; Bhutap, T.; Taylor, L.K. New South Wales population-based birthweight percentile charts. J. Paediatr. Child Health 1996, 32, 512–518. [Google Scholar] [CrossRef] [PubMed]
- Maas, C.; Mathes, M.; Bleeker, C.; Vek, J.; Bernhard, W.; Wiechers, C.; Peter, A.; Poets, C.F.; Franz, A.R. Effect of increased enteral protein intake on growth in human milk–fed preterm infants: A randomized clinical trial. JAMA Pediatr. 2017, 171, 16–22. [Google Scholar] [CrossRef] [PubMed]
- Moya, F.; Sisk, P.M.; Walsh, K.R.; Berseth, C.L. A new liquid human milk fortifier and linear growth in preterm infants. Pediatrics 2012, 130, e928–e935. [Google Scholar] [CrossRef] [PubMed]
- Kim, J.H.; Chan, G.; Schanler, R.; Groh-Wargo, S.; Bloom, B.; Dimmit, R.; Williams, L.; Baggs, G.; Barrett-Reis, B. Growth and tolerance of preterm infants fed a new extensively hydrolyzed liquid human milk fortifier. J. Pediatr. Gastroenterol. Nutr. 2015, 61, 665–671. [Google Scholar] [CrossRef] [PubMed]
- Rigo, J.; Hascoet, J.M.; Billeaud, C.; Picaud, J.C.; Mosca, F.; Rubio, A.; Saliba, E.; Radke, M.; Simeoni, U.; Guillois, B.; et al. Growth and nutritional biomarkers of preterm infants fed a new powdered human milk fortifier: A randomized trial. J. Pediatr. Gastroenterol. Nutr. 2017, 65, e83–e93. [Google Scholar] [CrossRef] [PubMed]
- Polberger, S.K.; Axelsson, I.E.; Raiha, N.C. Urinary and serum urea as indicators of protein metabolism in very low birthweight infants fed varying human milk protein intakes. Acta Paediatr. Scand. 1990, 79, 737–742. [Google Scholar] [CrossRef] [PubMed]
- Collins, C.T.; Reid, J.; Makrides, M.; Lingwood, B.E.; McPhee, A.J.; Morris, S.A.; Gibson, R.A.; Ward, L.C. Prediction of body water compartments in preterm infants by bioelectrical impedance spectroscopy. Eur. J. Clin. Nutr. 2013, 67 (Suppl. 1), S47–S53. [Google Scholar] [CrossRef] [PubMed]


| Characteristic | High Protein (n = 31) | Standard Protein (n = 29) |
|---|---|---|
| Infant characteristics | ||
| Singleton | 15 (48) | 16 (55) |
| Twin | 15 (48) | 12 (41) |
| Triplet | 2 (7) | 1 (3) |
| Gestational age (week) | 30.5 ± 1.5 | 30.1 ± 1.4 |
| 28–29 weeks’ gestation | 10 (32) | 9 (31) |
| 30–32 weeks’ gestation | 21 (68) | 20 (69) |
| Male infants | 16 (52) | 12 (41) |
| Birth weight (g) | 1483 ± 423 | 1551 ± 407 |
| SGA for weight at birth | 5 (16) | 1 (3) |
| Birth length (cm) | 40.0 ± 3.3 | 40.2 ± 2.8 |
| Head circumference (cm) | 28.5 ± 3 | 28.5 ± 1.8 |
| Infants received standard ward HMF before randomisation | 18 (58) | 22 (76) |
| Length of standard ward fortification before trial HMF start (day) | 1.3 ± 1.7 | 2.0 ± 1.5 |
| Time between birth and trial HMF start (day) | 8.9 ± 3.2 | 9.0 ± 2.5 |
| Maternal characteristics | ||
| Maternal age (years) | 29.9 ± 6.3 | 31.7 ± 5.3 |
| Mother smoked during pregnancy | 5 (16.1) | 3 (10.3) |
| Caucasian | 27 (96) | 23 (82) |
| Primiparous | 19 (61.3) | 12 (41.4) |
| Previous preterm birth | 4 (33.3) | 6 (35.3) |
| Intention to Treat Analyses | Per Protocol Analyses 1 | |||||||
|---|---|---|---|---|---|---|---|---|
| High Protein (n = 31) | Standard Protein (n = 29) | Adjusted Mean Difference 2 | p2 | High Protein (n = 21) | Standard Protein (n = 23) | Adjusted Mean Difference 2 | p2 | |
| Weight gain (g/week) | 245 (230, 260) | 258 (244, 272) | −14 (−32, 4) | 0.12 | 245 (228, 262) | 262 (247, 277) | −15 (−36, 5) | 0.14 |
| Length gain (cm/week) | 1.1 (1.1, 1.2) | 1.1 (1.1, 1.2) | −0.01 (−0.06, 0.03) | 0.45 | 1.1 (1.1, 1.2) | 1.2 (1.1, 1.2) | −0.01 (−0.06, 0.04) | 0.62 |
| Head circumference gain (cm/week) | 1.1 (1.0, 1.1) | 1.1 (1.0,1.1) | 0.007 (−0.05, 0.06) | 0.79 | 1.1 (1.1, 1.1) | 1.1 (1.1, 1.1) | −0.004 (−0.06, 0.05) | 0.88 |
| Weight at study end (g) 3 | 2658 (2544, 2771) | 2757 (2632, 2883) | −100 (−251, 50) | 0.19 | 2646 (2489, 2805) | 2815 (2675, 2955) | −157 (−341, 28) | 0.1 |
| Length at study end (cm) | 45.2 (44.5, 45.9) | 45.8 (45.0, 46.6) | −0.5 (−1.3, 0.3) | 0.19 | 45.2 (44.4, 46.0) | 46.3 (45.6, 47) | −0.86 (−1.85, 0.12) | 0.09 |
| Head circumference at study end (cm) | 33.1 (32.5, 33.6) | 33.0 (32.4, 33.7) | 0.03 (−0.6, 0.7) | 0.92 | 33.3 (32.7, 33.9) | 33.6 (33.0, 34.1) | −0.16 (−0.90, 0.57) | 0.66 |
| Variable | High Protein (n = 31) | Standard Protein (n = 29) | p |
|---|---|---|---|
| Infant required enteral protein supplementation 1 | 0 | 1 (3.4) | 0.48 |
| Feeding interrupted 2 | 11 (35) | 6 (21) | 0.01 |
| Days receiving parenteral nutrition | 10 (7, 13) | 9 (7, 11) | 0.34 |
| Days of intravenous lipid | 4 (3, 7) | 4 (3, 6) | 0.72 |
| Days to full enteral feeds 3 | 8 (6, 10) | 8 (7, 10) | 0.72 |
| Confirmed necrotizing enterocolitis | 1 (3.2) | 0 | >0.99 |
| Oxygen at discharge | 2 (6.5) | 1 (3.4) | 0.15 |
| Late onset sepsis | 1 (3.2) | 0 | >0.99 |
© 2018 by the authors. Licensee MDPI, Basel, Switzerland. This article is an open access article distributed under the terms and conditions of the Creative Commons Attribution (CC BY) license (http://creativecommons.org/licenses/by/4.0/).
Share and Cite
Reid, J.; Makrides, M.; McPhee, A.J.; Stark, M.J.; Miller, J.; Collins, C.T. The Effect of Increasing the Protein Content of Human Milk Fortifier to 1.8 g/100 mL on Growth in Preterm Infants: A Randomised Controlled Trial. Nutrients 2018, 10, 634. https://doi.org/10.3390/nu10050634
Reid J, Makrides M, McPhee AJ, Stark MJ, Miller J, Collins CT. The Effect of Increasing the Protein Content of Human Milk Fortifier to 1.8 g/100 mL on Growth in Preterm Infants: A Randomised Controlled Trial. Nutrients. 2018; 10(5):634. https://doi.org/10.3390/nu10050634
Chicago/Turabian StyleReid, Jessica, Maria Makrides, Andrew J. McPhee, Michael J. Stark, Jacqueline Miller, and Carmel T. Collins. 2018. "The Effect of Increasing the Protein Content of Human Milk Fortifier to 1.8 g/100 mL on Growth in Preterm Infants: A Randomised Controlled Trial" Nutrients 10, no. 5: 634. https://doi.org/10.3390/nu10050634