Article

Total and Nonheme Dietary Iron Intake Is Associated with Metabolic Syndrome and Its Components in Chinese Men and Women

1
National Institute for Nutrition and Health, Chinese Center for Disease Control and Prevention, 27 Nanwei Road, Xicheng District, Beijing 100050, China
2
Division of Health Risk Factors Monitoring and Control, Shanghai Municipal Center for Disease Control and Prevention, 1380 West Zhongshan Road, Shanghai 20036, China
3
Division of Non-Communicable Diseases Prevention and Control, Shanghai Municipal Center for Disease Control and Prevention, 1380 West Zhongshan Road, Shanghai 20036, China
4
Department of Profession Management, Shanghai Municipal Center for Disease Control and Prevention, 1380 West Zhongshan Road, Shanghai 20036, China
5
Department of Public Health, Shanghai Xuhui District Center for Disease Control and Prevention, 50 Yongchuan Road, Shanghai 200237, China
6
Department of Public Health, Shanghai Jiading District Center for Disease Control and Prevention, 264 Tacheng Road, Shanghai 201800, China
*
Author to whom correspondence should be addressed.
Nutrients 2018, 10(11), 1663; https://doi.org/10.3390/nu10111663
Submission received: 13 October 2018 / Revised: 29 October 2018 / Accepted: 31 October 2018 / Published: 4 November 2018
(This article belongs to the Special Issue Iron Intake and Human Health)

Abstract

:
The causal relationship between serum ferritin and metabolic syndrome (MetS) remains inconclusive. Dietary iron intake increases serum ferritin. The objective of this study was to evaluate associations of total, heme, and nonheme dietary iron intake with MetS and its components in men and women in metropolitan China. Data from 3099 participants in the Shanghai Diet and Health Survey (SDHS) obtained during 2012–2013 were included in this analysis. Dietary intake was assessed by 24-h diet records from 3 consecutive days. Multivariate generalized linear mixed models were used to evaluate the associations of dietary iron intake with MetS and its components. After adjustment for potential confounders as age, sex, income, physical exercise, smoking status, alcohol use, and energy intake, a positive trend was observed across quartiles of total iron intake and risk of MetS (p for trend = 0.022). Compared with the lowest quartile of total iron intake (<12.72 mg/day), the highest quartile (≥21.88 mg/day) had an odds ratio (95% confidence interval), OR (95% CI), of 1.59 (1.15,2.20). In addition, the highest quartile of nonheme iron intake (≥20.10 mg/day) had a 1.44-fold higher risk of MetS compared with the lowest quartile (<11.62 mg/day), and higher risks of MetS components were associated with the third quartiles of total and nonheme iron intake. There was no association between heme iron intake and risk of MetS (p for trend = 0.895). Associations for total and nonheme iron intake with MetS risk were found in men but not in women. Total and nonheme dietary iron intake was found to be positively associated with MetS and its components in the adult population in metropolitan China. This research also revealed a gender difference in the association between dietary iron intake and MetS.

1. Introduction

China has experienced a cardiovascular disease epidemic in recent decades [1]. Metabolic syndrome (MetS) refers to a constellation of interrelated risk factors that increase the development of both cardiovascular disease and type 2 diabetes mellitus [2]. The current nationwide prevalence of MetS among Chinese adults is 24.2%, which is an astonishing increase compared with the value of 9.8% calculated one decade ago based on the same diagnostic criteria [3,4].
A few studies have demonstrated an association between serum ferritin and MetS [5,6,7,8], but whether MetS is causally related to higher levels of iron metabolic markers or whether higher levels of iron metabolic markers lead to MetS remains inconclusive. Iron overload is characterized physiologically by an increase in the serum ferritin levels [9], and some studies have shown that meat or heme iron intake is related to the ferritin levels in serum [10,11]. However, high levels of serum ferritin can also be produced as a consequence of metabolic disorders, regardless of the iron overload status [12].
Few studies have investigated the relationship between dietary iron intake and MetS, which could potentially address the causative nature of the association between iron metabolic markers and MetS. Iron is present in foods in a heme or nonheme form. Heme iron is in most animal foods, and the rest of the iron in animal or plant food is nonheme iron [13]. Heme iron is more efficiently absorbed than nonheme iron as approximately 25% heme iron and 5% nonheme iron from diet absorbed by body [14]. The Chinese diet is known to be plant-based, which implies a low bioavailability of dietary iron. The primary objective of this study was to evaluate the associations of dietary iron intake, in terms of total, heme and nonheme iron intake, with MetS and its components in the adult population in metropolitan China. Considering the different physiologic mechanisms underlying body iron loss among men and women, it was intended to also analyze these associations stratified by gender. To the best of our knowledge, this population-based study constitutes the first investigation of the relationship between dietary iron intake and MetS in a Chinese population.

2. Materials and Methods

2.1. Study Population

The data used in this study were obtained from a cross-sectional investigation, the first wave of the Shanghai Diet and Health Survey (SDHS), which was conducted in Shanghai, one of the most developed cities in China, during the period 2012–2013. The SDHS was designed to examine the associations of food consumption, energy and nutrient intake, and behavioral factors with nutrition-related health outcomes among local residents. The investigation enrolled 4504 community-dwelling men and women aged at least 18 years from 54 randomly stratified-sampled communities. The participants were initially selected to constitute a random representative sample of the local adult population (n = 1725), and their family members aged at least 18 years were then recruited (approximately 2.6 persons per family). Those who had lived in the area for less than 6 months in total during the last year of the survey were excluded. The Shanghai Municipal Center for Disease Control and Prevention was responsible for the implementation of the SDHS.
Participants with missing anthropometric measurements (n = 251) or lack of blood pressure assessed (n = 54) or whose blood samples were not collected or tested (n = 817) for indicators of MetS diagnosis, as well as those who reported an energy intake less than 300 kcal/d or greater than 3500 kcal/d for the average energy intake (mean ± SD) was 1766 ± 880 kcal in the study population and the mean ± 2SD interval was finally used for the acceptable range (n = 51), were excluded. Participants with missing dietary survey information (n = 38) or other pertinent covariates (n = 194) were also excluded. The data from 3099 participants were ultimately included in the present analysis.
The SDHS was approved by the Shanghai Municipal Center for Disease Control and Prevention’s Institutional Review Board on 31 January 2012. Informed consent was obtained from each participant before the survey. The study complied with the code of ethics of the World Medical Association (Declaration of Helsinki).

2.2. Dietary Assessment

The dietary survey included a 24-h dietary record for 3 consecutive days (including 2 weekdays and 1 weekend day) in the consideration of different dietary behavior between working days and rest, as well as the feasibility of investigation. Household condiments mainly containing fat or sodium, including cooking oil, salt, soy sauce, chili sauce, etc., were weighed before and after the 3 survey days. The interviewers were public health doctors from 54 local community health centers who received a standard training course on the recording of dietary information. Each participant was orally instructed to record their daily food intake both at home and out of home on draft paper at the beginning and interviewed face-to-face by interviewers in the consecutive survey days at home. At each survey day, the interviewers collected and checked though the draft paper, and afterward, revised the food weight and transcribed the draft dietary information into a structured form. Furthermore, the participants were instructed not to change their typical diet or physical activity during the survey period. The diet records in the structured form were reviewed by nutrition specialists from local centers of disease control and prevention. No disastrous events such as rain or snow disasters that would have affected the normal food supply occurred during the survey period.
Daily food consumption was calculated from the 3-day, 24-h diet record. The 3-day consumption of condiments based on the calculated weight difference was divided into individual intake according to the eating times in the home and the individuals’ energy intake (only from food) proportion among family members. That consumption of condiments from meals out of home was simulated according to the previously calculated condiments’ densities in food consumed at home. The intake of dietary energy, macronutrients and iron was estimated according to daily food and condiment consumption using the Chinese food composition database [15,16]. Dietary supplements and medications were excluded from nutrient intake. Heme iron was estimated as 40% of the total iron from animal foods, including red meat, poultry, fish, and animal organs, and nonheme iron was calculated as the remaining portion of the total iron from all foods [14,17].

2.3. Potential Confounders

Information on each participant’s age, sex, education, income, smoking status, alcohol use, physical activity level, and intentional physical exercise was recorded using an interviewer-administered questionnaire at each participant’s home. The educational level of the participants was reported as years of education. The yearly income was calculated by dividing the total family yearly income by the number of family members. The physical activity level was recorded as sedentary, moderate, or vigorous according to professional and nonprofessional activities. Intentional physical exercise was defined as physical exercise performed for the purpose of health maintenance or fitness. The smoking status was categorized as never smoked, former smoker, or current smoker. With respect to alcohol use, the respondents were classified as follows according to their alcohol consumption during the seven days prior to the interview: lifetime abstainers, the respondent did not consume an alcoholic beverage; nonheavy drinkers (social drinkers), the respondent consumed 5+ standard drinks once (1 day) in the 1-week period; infrequent heavy drinkers (binge drinkers), the respondent consumed 5+ standard drinks on 2–3 days in the 1-week period; or frequent heavy drinkers, the respondent consumed 5+ standard drinks on at least 4 days in the 1-week period.

2.4. Anthropometric and Laboratory Measurements

All anthropometric measurements were conducted in the community health centers located in each participant’s community. The waist circumference was measured using a Graham-Field 1340-2 tape measure. The blood pressure was measured three times after a quiet rest for 5 min using an Omron HEM-7071 electronic sphygmomanometer (Omron Healthcare, Kyoto, Japan).
Each participant was asked to fast for more than 10 h, and their blood was then collected and analyzed at the laboratory of the Shanghai Municipal Centers for Disease Control and Prevention. The serum concentrations of glucose, triglycerides, and high-density lipoprotein-cholesterol (HDL-C) were measured using a HITACHI 7080 Automatic Biochemical Analyzer with reagents from Wako Pure Chemical Industries, Ltd. (Tokyo, Japan).

2.5. Definition of Metabolic Syndrome

MetS was identified based on the criteria in the US National Cholesterol Education Program Adult Treatment Panel III (NCEP-ATP III) for Asian populations [2], which states that at least three of the following metabolic abnormalities should be present: (1) elevated waist circumference (WC ≥ 90 cm for men and WC ≥ 80 cm for women); (2) elevated triglycerides (triglycerides ≥ 150 mg/dL) or on drug treatment for elevated triglycerides; (3) reduced HDL-C (HDL-C < 40 mg/dL for men and < 50 mg/dL for women) or on drug treatment for reduced HDL-C; (4) elevated blood pressure (systolic blood pressure ≥ 130 mmHg and/or diastolic blood pressure ≥ 85 mmHg) or on antihypertensive drug treatment with a history of hypertension; and (5) elevated fasting glucose (100 mg/dL) or on drug treatment for elevated glucose.

2.6. Statistical Analyses

Statistical analyses were conducted using SAS statistical software (v. 9.2; SAS Institute, Cary, NC, USA). Given that the occurrence of MetS might aggregate in families due to a similar genetic background, which would potentially cause aggregation bias, multilevel models were introduced in the analysis. Multivariate generalized linear mixed models for binary data with a logit link function were applied to determine the odds ratios (ORs) and 95% confidence intervals (CIs) of the occurrence of MetS and its five components as the dependent variables based on four tertiles of total, heme, and nonheme dietary iron intake as the independent fixed-effect variables and family aggregation as the random-effect variable. No covariate was included in the crude model. Potential confounders, including age, sex, income, physical activity level, intentional physical exercise, dietary energy intake, smoking status, and alcohol use, were introduced as covariates in the adjusted models. To examine the linear trend between dietary iron intake and the occurrence of MetS, the medians in each quartile of dietary iron intake were used as the independent fixed-effect variables, and the occurrences of MetS and its five components were used as the dependent variables. A two-sided p value < 0.05 was considered to indicate statistical significance.

3. Results

3.1. Characteristics of the Participants

The analysis sample included 3099 participants, consisting of 1430 male adults and 1669 female adults. Among the participants, the total, heme, and nonheme dietary iron intake was 19.7 mg/day, 1.6 mg/day, and 18.1 mg/day, respectively, and the prevalence of MetS was 23.9%. The characteristics of the participants are shown in Table 1.

3.2. Dietary Sources of Iron Intake

In present study population, the main dietary sources of total iron intake were plant-based foods. Specifically, the top three dietary sources of total iron intake were grains/potatoes, vegetables, and condiments, and this finding was obtained for both males (6.62 mg/day, 4.92 mg/day, and 2.28 mg/day, respectively) and females (5.10 mg/day, 4.29 mg/day, and 1.97 mg/day, respectively). Red meat was ranked first among the animal food sources of total dietary iron intake consumed by both genders (Figure 1).

3.3. Quartiles of Dietary Iron Intake and MetS Risk

After adjusting for age, sex, income, physical activity level, intentional physical exercise, dietary energy intake, smoking status, and alcohol use, a significant positive trend was found across quartiles of total dietary iron intake and risk of MetS (p for trend = 0.022). Compared with the lowest quartile of dietary total iron intake (<12.72 mg/day), the highest quartile (≥21.88 mg/day) had an odds ratio (95% confidence interval), OR (95% CI), of 1.59 (1.15,2.20). However, after adjusting for the same confounders, there was no association between heme dietary iron intake and risk of MetS (p for trend = 0.895), and compared with the lowest quartile of heme iron intake, the second to fourth tertiles did not show significant differences in ORs. Although the quartiles of nonheme iron intake were not in line with the risk of MetS (p for trend = 0.065), the highest quartile of nonheme iron intake (≥20.10 mg/day) had a 1.44-fold higher risk of MetS compared with the lowest quartile (<11.62 mg/day). After adjustment, higher risks for the five components of MetS were observed in the third and fourth quartiles of total and nonheme dietary iron intake. However, no differences in the risks for the MetS components were found between the second to fourth quartiles of heme iron intake and the reference quartile (Table 2, Table 3 and Table 4).
After stratifying by gender, the linear trend between the quartiles of total dietary iron intake and risk of MetS was still significant in male participants (p for trend = 0.016) but not in female participants (p for trend = 0.322). In men, a higher risk (OR = 2.11, 95% CI: 1.29–3.45) of MetS was observed in the fourth quartile of total dietary iron intake (≥23.68 mg/day) compared with the first quartile (<14.12 mg/day), whereas in women, the risks of MetS were not significantly different between the lowest quartile of total iron intake and the other quartiles. A positive association was found between nonheme iron intake and MetS risk in men (p for trend = 0.025) but not in women (p for trend = 0.150). Finally, heme iron intake was not associated with MetS in either men or women (Men, Table 5, Table 6 and Table 7; Women, Table 8, Table 9 and Table 10).
After stratifying by age group, a higher risk of MetS was observed in the third and fourth quartile of total dietary iron intake among the age group of above 60 (Table A1).

4. Discussion

The current findings were consistent with two previous studies indicating that the consumption of a certain type of dietary iron is related to the risk of developing MetS or its components [18,19]. Compared with the total dietary iron intake of the Western population, the average intake of Chinese adults is reportedly much higher, which is consistent with the iron intake determined in this study [18,20,21,22]. Free iron has strong pro-oxidant properties and generates reactive oxygen species by participating in Fenton chemistry, which results in the induction of oxidative damage and apoptosis [23]. Although iron plays an indispensable role in some physiological processes, excess iron can cause tissue damage or subclinical inflammation [24]. These side effects of iron are balanced out through binding to ferritin, an iron storage protein [13]. Given that several population-based human observational studies have reported a positive association between dietary iron intake and serum ferritin [10,11,21,25,26], the elevated concentration of serum ferritin is regarded as an indicator of iron overload. This research potentially supported the hypothesis that excessive iron in the body might play a causal role in the development of MetS. Nevertheless, MetS has been found to increase the inflammatory status and thereby induces changes in iron homeostasis; thus, the influence of MetS on iron metabolism cannot be ruled out [27,28]. These two mechanisms might mutually correspond to a continuous circle between iron metabolism and MetS.
In present study population, we observed that nonheme iron intake but not heme iron intake was associated with MetS. This finding was inconsistent with studies on Western populations, which concluded that heme iron intake is correlated with MetS [18,20,29]. Dietary iron is present in two forms: heme iron (animal food) and nonheme iron (plant and animal food) [
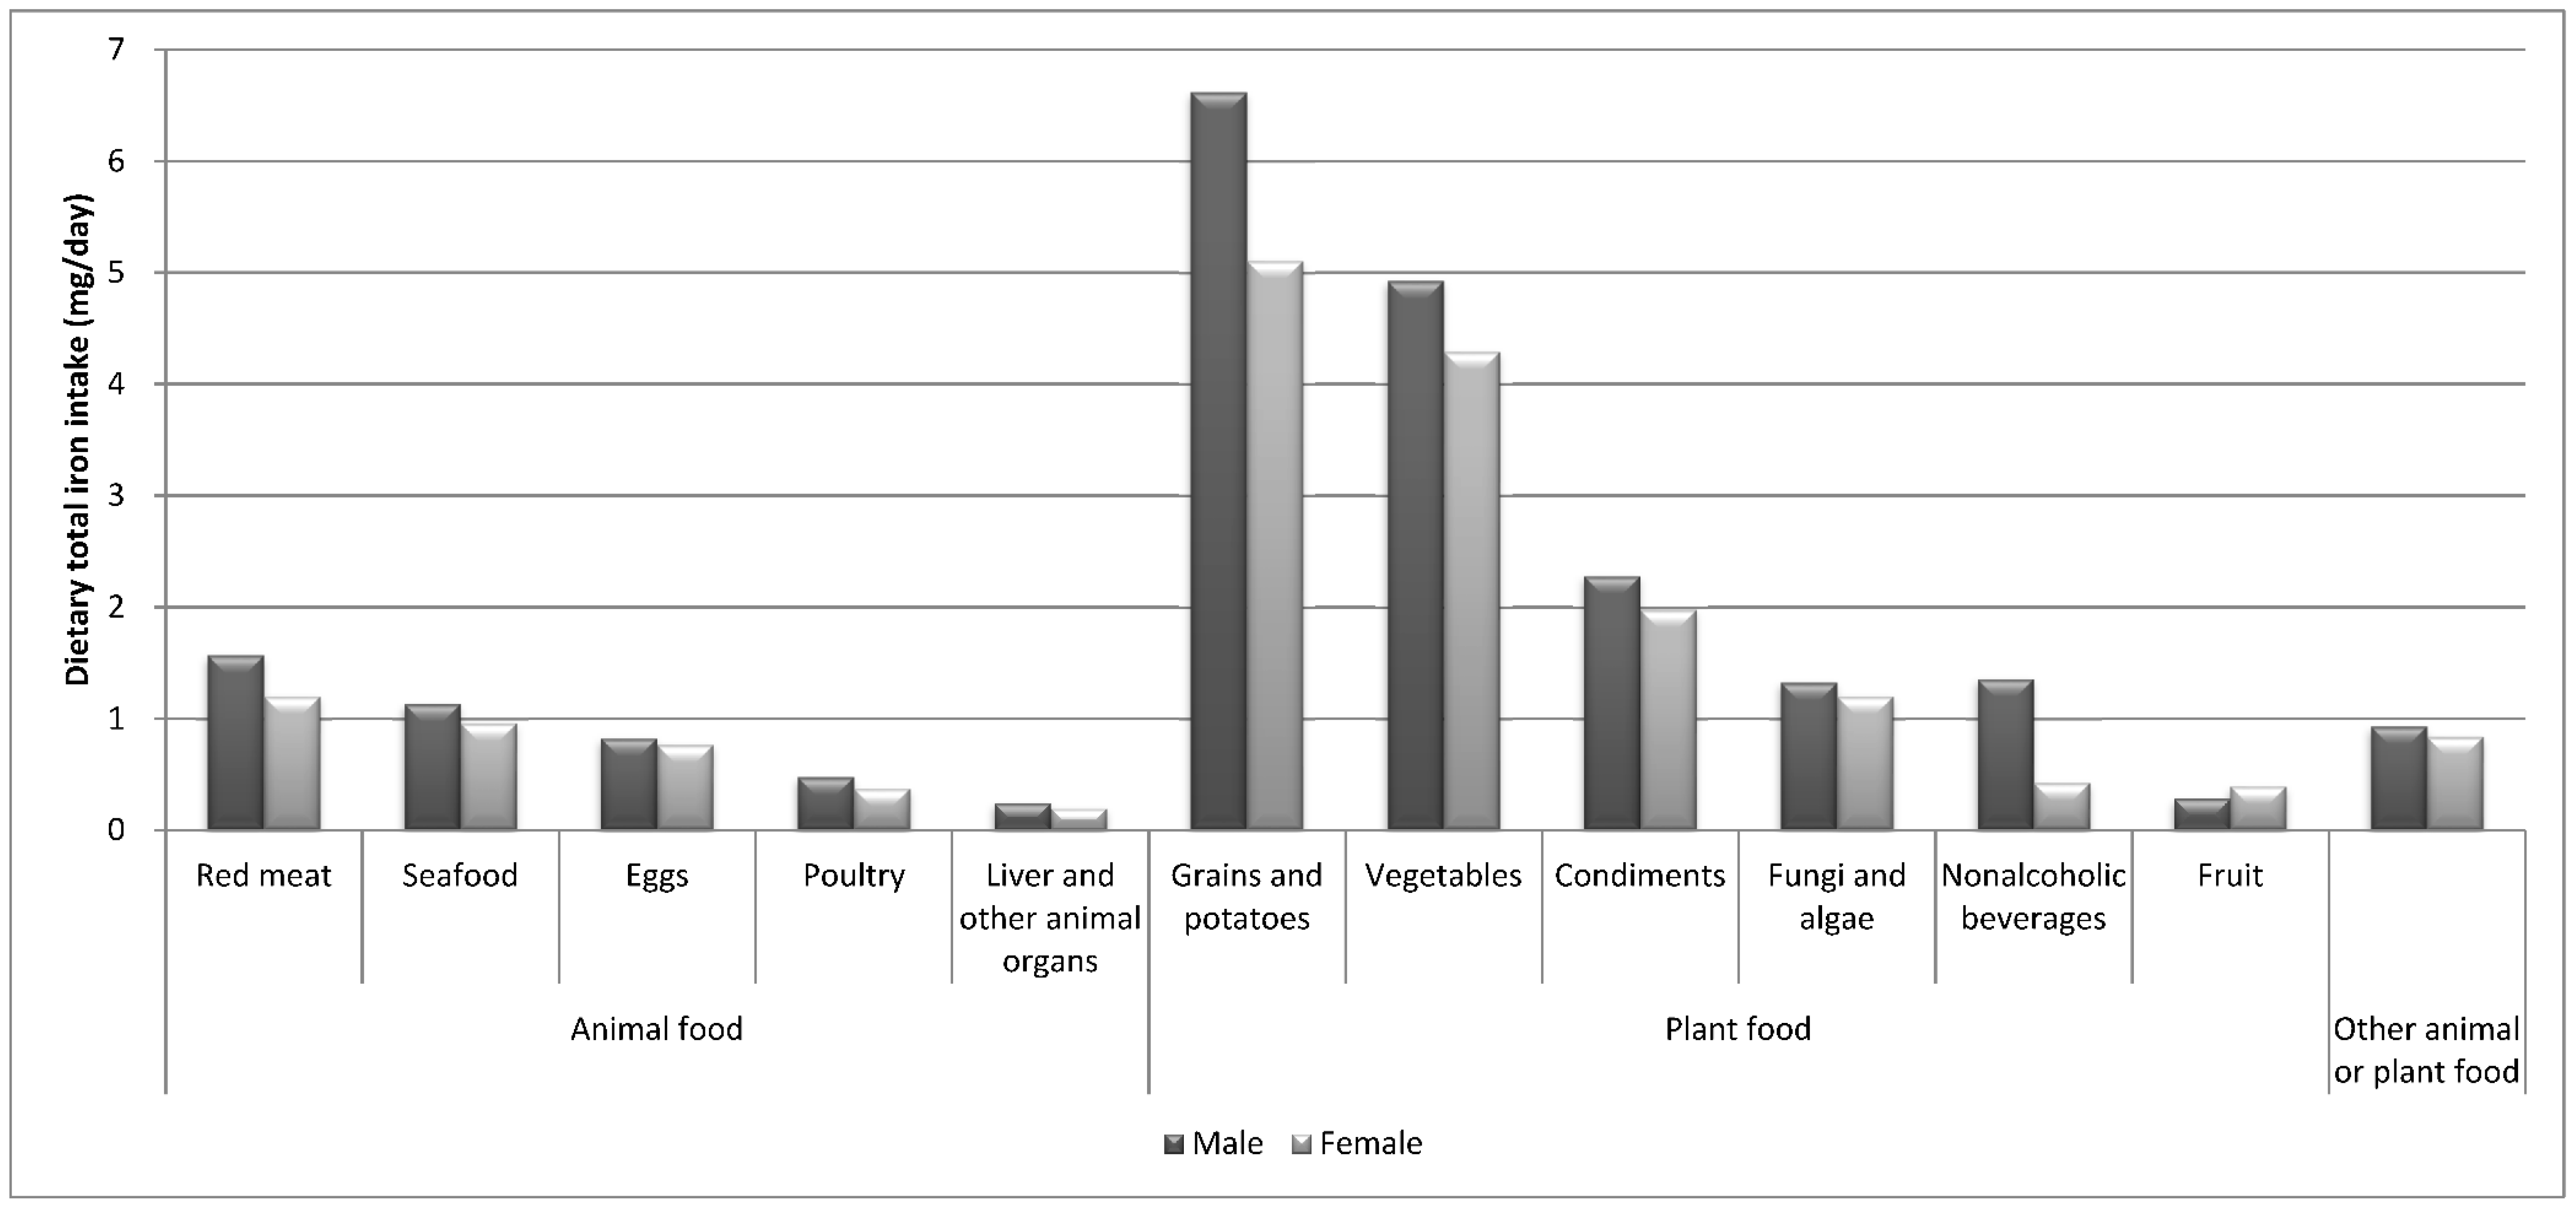
13]. The Chinese diet is well known to be a predominantly plant-based diet. The major food sources of dietary iron in the current analysis were grains/potatoes, vegetables, and condiments. These foods are quite different from those in the typical diet of the Western population, in which a greater proportion of dietary iron is obtained from animal food [22], which indicated more heme iron intake. The dominance of plant-based food sources of dietary iron in the Chinese diet indicates a larger proportion of nonheme iron. In a Chinese study, no definite association was found for heme iron intake with iron status [25]. Another study on a Japanese population also found that heme iron intake is not correlated with iron status [30]. The difference between Western and Chinese dietary patterns could partially explain the difference in the associations of heme iron with MetS between the present findings and results from Western populations. Heme iron has been widely acknowledged to have better bioavailability than nonheme iron [31]. However, the ascorbic acid found in fruits and vegetables can enhance nonheme iron absorption [13]. In a study focusing on Chinese females, nonheme iron intake was found to be associated with serum ferritin [25]. This finding could support the correlation between nonheme iron intake and MetS observed in the present study.
In this study, higher risks of the four components of MetS, including elevated waist circumference, elevated triglycerides, reduced HDL-C, and elevated blood pressure, were observed with moderately higher total iron intake (the third quartile of total iron intake). Moderately higher nonheme iron intake (the third quartile of nonheme iron intake) was associated with higher risks of all five components of MetS. However, no associations were found between heme iron intake and the five components of MetS. Meanwhile, previous published studies indicated that iron overload in the body is correlated with all features of abnormal metabolism, such as obesity, hypertension, hyperlipidemia, and hyperglycemia [5,9,19,32,33].
We found that total iron and nonheme iron intake was associated with risk of MetS in male participants, but an association between iron intake and MetS was not observed in female participants in the current study. In the male population, the highest quartile of total iron intake was associated with a 2.1-fold higher risk of MetS compared with the lowest quartile. The Chinese recommended daily iron intakes for male and female adults are 12 mg and 20 mg, respectively, and the tolerable upper iron intake is 42 mg [34]. In this study, although the average dietary iron intake of both genders was far from the tolerable upper limit, the average total dietary iron intake of the male participants was almost double the recommended level, whereas that of the females was slightly under the recommended level. In addition, women experience greater iron loss than men due to menses. Increased iron stores are correlated with markers of chronic inflammation and risk of MetS [35,36]. The relatively higher iron intake and lower iron loss in men might explain the gender difference in the association between dietary iron intake and the occurrence of MetS observed in this study. Assessing the blood loss in the case of women warrants further study.
A limitation of this study is the methodology used to assess dietary intake. We used 3-day, 24-h dietary records to obtain food consumption information, and this information was then used to calculate the total, heme, and nonheme iron intake based on Chinese food composition data. Thus, the estimates of dietary iron intake were limited by the accuracy of the participants’ recall and estimation. Furthermore, although we adjusted for several potential confounding factors, including dietary energy intake, we did not treat other iron intake-related dietary components, such as saturated fat or zinc, as covariates to avoid multicollinearity. Therefore, we cannot avoid the possibility that recall bias, nonresponse bias, and other unknown confounding factors might influence the result of the risk factor analysis. Finally, it is logical to hypothesize that dietary iron intake influences the body’s metabolism, but the cross-sectional nature of the current study did not allow us to draw causal associations between total, heme, and nonheme dietary iron intake and MetS. Therefore, prospective observational studies or random clinical trials are needed to clarify the causal relationship between dietary iron and MetS.

5. Conclusions

Total and nonheme dietary iron intake was positively associated with MetS and its components in the adult population in metropolitan China, but an association between heme iron intake and MetS was not observed in this population. Moreover, a gender difference in the association between dietary iron intake and the occurrence of MetS was found: higher levels of total and nonheme iron intake were associated with greater risks of MetS in men but not in women.

Author Contributions

Conceptualization, G.D. and Z.Z.; Methodology, F.W. and Y.L.; Investigation, C.W., Z.W., C.G., X.J., J.Y. and H.P.; Data Analysis, J.Z. and Z.Z.; Writing-Original Draft Preparation, Z.Z.; Writing-Review & Editing, Y.H., J.S. and J.H.; Supervision and manuscript review, G.D. and F.W.

Funding

This study was supported by the National Key Research and Development Program of China (2016YFD0400602), the Three-year Action Plan on Public Health (15GWZK0801), Foundation of Shanghai Municipal Commission of Health and Family Planning (201740073) and DANONE International Prize for Nutrition (DIC2015-01).

Acknowledgments

We are grateful to all the individuals who participated in the study. We also thank our colleagues at the local districts’ Centers for Disease Control and Prevention and local community health centers for their assistance with data collection.

Conflicts of Interest

The authors declare no conflict of interest.

Appendix A

Table A1. ORs (95% CI) for metabolic syndrome according to the quartiles of total iron intake (mg/day) by age group in the SDHS 2012–2013.
Quartiles of Dietary Iron Intake, ORs (95% CI)
Q1Q2Q3Q4p-Value for Trend 1
18–44 years
Total Iron Intake (mg/day)<12.84(12.84–16.02)(16.02–21.50)≥21.50
n241241241241
Metabolic syndrome
   Crude modelReference1.55(0.81,2.94)1.72(0.92,3.24)1.88(1.00,3.51) *0.237
   Adjusted model 2Reference1.53(0.77,3.03)1.66(0.82,3.34)1.96(0.86,4.46)0.430
45–59 years
Total Iron Intake (mg/day)<13.03(13.03–17.04)(17.04–20.00)≥22.31
n280279279279
Metabolic syndrome
   Crude modelReference1.10(0.74,1.65)1.35(0.91,2.00)1.05(0.70,1.58)0.448
   Adjusted model 2Reference1.16(0.77,1.76)1.41(0.92,2.16)1.18(0.71,1.96)0.458
60-years
Total Iron Intake (mg/day)<12.31(12.31–16.28)(16.28–20.00)≥21.86
n255254255254
Metabolic syndrome
   Crude modelReference1.03(0.70,1.50)1.11(0.77,1.62)1.03(0.70,1.51)0.949
   Adjusted model 2Reference1.24(0.83,1.86)1.54(1.00,2.37) *1.77(1.06,2.96) *0.135
* p < 0.05. 1 The p-value for the trend was examined using the medians in each quartile of dietary iron intake. 2 The models were adjusted for sex, income, physical activity level, intentional physical exercise, smoking status, alcohol use, and dietary total energy intake.

References

  1. Zhou, M.; Wang, H.; Zhu, J.; Chen, W.; Wang, L.; Liu, S.; Li, Y.; Wang, L.; Liu, Y.; Yin, P.; et al. Cause-specific mortality for 240 causes in China during 1990–2013: A systematic subnational analysis for the Global Burden of Disease Study 2013. Lancet 2016, 387, 251–272. [Google Scholar] [CrossRef]
  2. Grundy, S.M.; Cleeman, J.I.; Daniels, S.R.; Donato, K.A.; Eckel, R.H.; Franklin, B.A.; Gordon, D.J.; Krauss, R.M.; Savage, P.J.; Smith, S.J.; et al. Diagnosis and management of the metabolic syndrome: An American Heart Association/National Heart, Lung, and Blood Institute Scientific Statement. Circulation 2005, 112, 2735–2752. [Google Scholar] [CrossRef] [PubMed]
  3. Gu, D.; Reynolds, K.; Wu, X.; Chen, J.; Duan, X.; Reynolds, R.F.; Whelton, P.K.; He, J. Prevalence of the metabolic syndrome and overweight among adults in China. Lancet 2005, 365, 1398–1405. [Google Scholar] [CrossRef]
  4. Li, Y.; Zhao, L.; Yu, D.; Wang, Z.; Ding, G. Metabolic syndrome prevalence and its risk factors among adults in China: A nationally representative cross-sectional study. PLoS ONE 2018, 13, e199293. [Google Scholar] [CrossRef] [PubMed]
  5. Felipe, A.; Guadalupe, E.; Druso, P.; Carlos, M.; Pablo, S.; Oscar, C.; Luis, V.; Diego, M.; Jaime, R.; Inés, U.; Federico, L. Serum Ferritin Is Associated with Metabolic Syndrome and Red Meat Consumption. Oxid. Med. Cell. Longev. 2015, 2015, 1–8. [Google Scholar] [CrossRef] [PubMed]
  6. Cho, M.; Park, J.; Choi, W.; Cho, A.; Lee, Y. Serum ferritin level is positively associated with insulin resistance and metabolic syndrome in postmenopausal women: A nationwide population-based study. Maturitas 2017, 103, 3–7. [Google Scholar] [CrossRef] [PubMed]
  7. Kilani, N.; Vollenweider, P.; Waeber, G.; Marques-Vidal, P. Iron metabolism and incidence of metabolic syndrome. Nutr. Metab. Cardiovasc. Dis. 2015, 25, 1025–1032. [Google Scholar] [CrossRef] [PubMed]
  8. Jehn, M.; Clark, J.M.; Guallar, E. Serum ferritin and risk of the metabolic syndrome in U.S. adults. Diabetes Care 2004, 27, 2422–2428. [Google Scholar] [CrossRef] [PubMed]
  9. Fleming, R.E.; Ponka, P. Iron overload in human disease. N. Engl. J. Med. 2012, 366, 348–359. [Google Scholar] [CrossRef] [PubMed]
  10. Cade, J.E.; Moreton, J.A.; O’Hara, B.; Greenwood, D.C.; Moor, J.; Burley, V.J.; Kukalizch, K.; Bishop, D.T.; Worwood, M. Diet and genetic factors associated with iron status in middle-aged women. Am. J. Clin. Nutr. 2005, 82, 813–820. [Google Scholar] [CrossRef] [PubMed] [Green Version]
  11. Fleming, D.J.; Jacques, P.F.; Dallal, G.E.; Tucker, K.L.; Wilson, P.W.; Wood, R.J. Dietary determinants of iron stores in a free-living elderly population: The Framingham Heart Study. Am. J. Clin. Nutr. 1998, 67, 722–733. [Google Scholar] [CrossRef] [PubMed] [Green Version]
  12. Ferreira, C.; Santambrogio, P.; Martin, M.E.; Andrieu, V.; Feldmann, G.; Henin, D.; Beaumont, C. H ferritin knockout mice: A model of hyperferritinemia in the absence of iron overload. Blood 2001, 98, 525–532. [Google Scholar] [CrossRef] [PubMed]
  13. Geissler, C.; Singh, M. Iron, Meat and Health. Nutrients 2011, 3, 283–316. [Google Scholar] [CrossRef] [PubMed]
  14. Monsen, E.R.; Hallberg, L.; Layrisse, M.; Hegsted, D.M.; Cook, J.D.; Mertz, W.; Finch, C.A. Estimation of available dietary iron. Am. J. Clin. Nutr. 1978, 31, 134. [Google Scholar] [CrossRef] [PubMed]
  15. Yang, Y.; Wang, G.; Pan, X. Chinese Food Composition Book 2; Peking University Medical Press: Beijing, China, 2005; pp. 75–216. ISBN 9787810716789. [Google Scholar]
  16. Yang, Y.; Wang, G.; Pan, X. Chinese Food Composition Book 1; Peking University Medical Press: Beijing, China, 2009; pp. 45–192. ISBN 9787811167276. [Google Scholar]
  17. Pretorius, B.; Schonfeldt, H.C.; Hall, N. Total and haem iron content lean meat cuts and the contribution to the diet. Food Chem. 2016, 193, 97–101. [Google Scholar] [CrossRef] [PubMed] [Green Version]
  18. De Oliveira Otto, M.C.; Alonso, A.; Lee, D.; Delclos, G.L.; Bertoni, A.G.; Jiang, R.; Lima, J.A.; Symanski, E.; Jacobs, D.R.; Nettleton, J.A. Dietary Intakes of Zinc and Heme Iron from Red Meat, but Not from Other Sources, Are Associated with Greater Risk of Metabolic Syndrome and Cardiovascular Disease. J. Nutr. 2012, 142, 526–533. [Google Scholar] [CrossRef] [PubMed] [Green Version]
  19. Choi, J.S.; Koh, I.; Lee, H.J.; Kim, W.H.; Song, J. Effects of excess dietary iron and fat on glucose and lipid metabolism. J. Nutr. Biochem. 2013, 24, 1634–1644. [Google Scholar] [CrossRef] [PubMed]
  20. Dos Santos Vieira, D.; Hermes Sales, C.; Galvão Cesar, C.; Marchioni, D.; Fisberg, R. Influence of Haem, Non-Haem, and Total Iron Intake on Metabolic Syndrome and Its Components: A Population-Based Study. Nutrients 2018, 10, 314. [Google Scholar] [CrossRef] [PubMed]
  21. Young, I.; Parker, H.; Rangan, A.; Prvan, T.; Cook, R.; Donges, C.; Steinbeck, K.; O’Dwyer, N.; Cheng, H.; Franklin, J.; et al. Association between Haem and Non-Haem Iron Intake and Serum Ferritin in Healthy Young Women. Nutrients 2018, 10, 81. [Google Scholar] [CrossRef] [PubMed]
  22. Samaniego-Vaesken, M.; Partearroyo, T.; Olza, J.; Aranceta-Bartrina, J.; Gil, Á.; González-Gross, M.; Ortega, R.; Serra-Majem, L.; Varela-Moreiras, G. Iron Intake and Dietary Sources in the Spanish Population: Findings from the ANIBES Study. Nutrients 2017, 9, 203. [Google Scholar] [CrossRef] [PubMed]
  23. Hansen, J.B.; Moen, I.W.; Mandrup-Poulsen, T. Iron: The hard player in diabetes pathophysiology. Acta Physiol. 2014, 210, 717–732. [Google Scholar] [CrossRef] [PubMed]
  24. Day, S.M.; Duquaine, D.; Mundada, L.V.; Menon, R.G.; Khan, B.V.; Rajagopalan, S.; Fay, W.P. Chronic iron administration increases vascular oxidative stress and accelerates arterial thrombosis. Circulation 2003, 107, 2601–2606. [Google Scholar] [CrossRef] [PubMed]
  25. He, J.; Shen, X.; Fang, A.; Song, J.; Li, H.; Guo, M.; Li, K. Association between predominantly plant-based diets and iron status in Chinese adults: A cross-sectional analysis. Br. J. Nutr. 2016, 116, 1621–1632. [Google Scholar] [CrossRef] [PubMed]
  26. Davis, C.D.; Malecki, E.A.; Greger, J.L. Interactions among dietary manganese, heme iron, and nonheme iron in women. Am. J. Clin. Nutr. 1992, 56, 926–932. [Google Scholar] [CrossRef] [PubMed]
  27. MacDonald, M.J.; Cook, J.D.; Epstein, M.L.; Flowers, C.H. Large amount of (apo)ferritin in the pancreatic insulin cell and its stimulation by glucose. FASEB J. 1994, 8, 777–781. [Google Scholar] [CrossRef] [PubMed]
  28. Deugnier, Y.; Bardou-Jacquet, E.; Le Lan, C.; Brissot, P. Hyperferritinemia not related to hemochromatosis. Gastroenterol. Clin. Biol. 2009, 33, 323. [Google Scholar] [CrossRef] [PubMed]
  29. Azadbakht, L.; Esmaillzadeh, A. Red meat intake is associated with metabolic syndrome and the plasma C-reactive protein concentration in women. J. Nutr. 2009, 139, 335–339. [Google Scholar] [CrossRef] [PubMed]
  30. Asakura, K.; Sasaki, S.; Murakami, K.; Takahashi, Y.; Uenishi, K.; Yamakawa, M.; Nishiwaki, Y.; Kikuchi, Y.; Takebayashi, T.; Group, J.D.S.S.; et al. Iron intake does not significantly correlate with iron deficiency among young Japanese women: A cross-sectional study. Public Health Nutr. 2009, 12, 1373–1383. [Google Scholar] [CrossRef] [PubMed]
  31. Hallberg, L. Bioavailability of dietary iron in man. Annu. Rev. Nutr. 1981, 1, 123–147. [Google Scholar] [CrossRef] [PubMed]
  32. Piperno, A.; Trombini, P.; Gelosa, M.; Mauri, V.; Pecci, V.; Vergani, A.; Salvioni, A.; Mariani, R.; Mancia, G. Increased serum ferritin is common in men with essential hypertension. J. Hypertens. 2002, 20, 1513–1518. [Google Scholar] [CrossRef] [PubMed]
  33. Bozzini, C.; Girelli, D.; Olivieri, O.; Martinelli, N.; Bassi, A.; De Matteis, G.; Tenuti, I.; Lotto, V.; Friso, S.; Pizzolo, F.; et al. Prevalence of body iron excess in the metabolic syndrome. Diabetes Care 2005, 28, 2061–2063. [Google Scholar] [CrossRef] [PubMed]
  34. Chinese Nutrition Society. Chinese Dietary Reference Intakes; Science Press: Beijing, China, 2013. [Google Scholar]
  35. Vari, I.S.; Balkau, B.; Kettaneh, A.; André, P.; Tichet, J.; Fumeron, F.; Caces, E.; Marre, M.; Grandchamp, B.; Ducimetière, P. Ferritin and Transferrin Are Associated with Metabolic Syndrome Abnormalities and Their Change Over Time in a General Population. Diabetes Care 2007, 30, 1795. [Google Scholar] [CrossRef] [PubMed]
  36. Fumeron, F.; Pean, F.; Driss, F.; Balkau, B.; Tichet, J.; Marre, M.; Grandchamp, B. Ferritin and transferrin are both predictive of the onset of hyperglycemia in men and women over 3 years: The data from an epidemiological study on the Insulin Resistance Syndrome (DESIR) study. Diabetes Care 2006, 29, 2090–2094. [Google Scholar] [CrossRef] [PubMed]
Figure 1. Dietary sources of total iron intake for the different genders in the SDHS 2012–2013.
Nutrients 10 01663 g001
Table 1. Characteristics of the participants by gender in the SDHS 2012–2013.
AllMaleFemalep-Value
n (%)3099 (100.0)1430 (46.1)1669 (53.9)
Age, % 0.513
 18–44 years30.830.131.4
 45–59 years36.236.336.1
 60-years33.033.632.6
Yearly Income, % 0.523
 Above average level (>60,000 RMB 1)7.27.07.4
 Average level (30,000–59, RMB)30.932.130.0
 Below average level (<30,000 RMB)57.256.058.2
 No answer4.74.94.5
Years of Education, years (SD 2)9.5 (4.53)10.2 (4.01)8.9 (4.86)<0.001
Physical Activity Level, % <0.001
 Sedentary84.278.789.0
 Moderate13.818.110.2
 Vigorous2.03.30.8
Intentional Physical Exercise, %24.825.224.50.940
Smoking Status, %
 Never smoked72.040.898.8
 Former smoker5.010.50.3
 Current smoker23.048.81.0
Alcohol Use, % <0.001
 Lifetime abstainers80.764.094.9
 Nonheavy drinkers15.127.34.6
 Infrequent heavy drinkers1.32.60.3
 Frequent heavy drinkers3.06.10.3
Dietary Intake
 Energy, kcal/day (SD)1760.9 (842.5)1938.5 (884.5)1608.9(773.4)<0.001
 Carbohydrate, g/day (SD)207.4(119.3)226.8(131.5)190.8(105.1)<0.001
 Protein, g/day (SD)67.9(45.6)75.0(53.1)61.9(37.1)<0.001
 Total fat, g/day (SD)74.6(41.8)81.1(40.7)69.0(41.9)<0.001
 Total iron, mg/day (SD)19.7(16.3)22.0(20.4)17.7(11.3)<0.001
 Heme iron, mg/day (SD)1.6(1.4)1.7(1.4)1.5(1.4)<0.001
 Nonheme iron, mg/day (SD)18.1(15.8)20.3(20.0)16.2(10.6)<0.001
Metabolic Syndrome, %23.921.825.70.011
Metabolic Syndrome Components
 Elevated blood pressure, %52.456.848.7<0.001
 Elevated waist circumference, %33.625.540.5<0.001
 Elevated fasting glucose, %23.125.421.10.007
 Elevated triglycerides, %27.230.324.4<0.001
 Reduced HDL-C 3, %21.014.826.2<0.001
1 RMB, renminbi, China’s currency; 2 SD, standard deviation; 3 HDL-C, high-density lipoprotein-cholesterol.
Table 2. Odds ratios (ORs) (95% CI) for metabolic syndrome and its components according to the quartiles of total iron intake (mg/day) among all participants in the SDHS 2012–2013.
Quartiles of Dietary Iron Intake, ORs (95% CI)
Q1Q2Q3Q4p-Value for Trend 1
Total Iron Intake (mg/day)<12.72(12.72–16.50)(16.50–21.88)≥21.88
n776773776774
Metabolic syndrome
   Crude modelReference1.12(0.88,1.42)1.24(0.98,1.57)1.17(0.92,1.48)0.335
   Adjusted model 2Reference1.37(1.06,1.78) *1.47(1.11,1.94) **1.59(1.15,2.20) **0.022
p-Value for interaction 3 = 0.060
Metabolic syndrome components
  Elevated blood pressure
   Crude modelReference0.95(0.79,1.13)1.19(1.00,1.42) *1.07(0.89,1.27)0.063
   Adjusted model 2Reference1.14(0.92,1.41)1.33(1.06,1.66) *1.21(0.93,1.57)0.100
  Elevated waist circumference
   Crude modelReference1.07(0.89,1.29)1.09(0.91,1.32)1.00(0.83,1.21)0.691
   Adjusted model 2Reference1.25(1.01,1.53) *1.29(1.04,1.60) *1.25(0.96,1.61)0.096
  Elevated fasting glucose
   Crude modelReference1.03(0.83,1.27)1.16(0.94,1.42)1.12(0.91,1.38)0.458
   Adjusted model 2Reference1.18(0.94,1.49)1.25(0.98,1.60)1.33(1.00,1.77)0.221
  Elevated triglycerides
   Crude modelReference1.17(0.95,1.43)1.46(1.20,1.77) **1.34(1.10,1.64) **0.001
   Adjusted model 2Reference1.14(0.92,1.42)1.37(1.09,1.72) **1.31(1.00,1.71) *0.047
  Reduced HDL-C 4
   Crude modelReference1.09(0.86,1.38)1.11(0.87,1.41)0.91(0.71,1.16)0.348
   Adjusted model 2Reference1.27(0.98,1.65)1.42(1.08,1.87) *1.31(0.94,1.83)0.088
* p < 0.05, ** p < 0.001. 1 The p-value for the trend was examined using the medians in each quartile of dietary iron intake. 2 The models were adjusted for age, sex, income, physical activity level, intentional physical exercise, smoking status, alcohol use and dietary total energy intake. 3 The p-value for the interaction was tested for the quartiles of dietary iron intake by gender. 4 HDL-C: high-density lipoprotein-cholesterol.
Table 3. ORs (95% CI) for metabolic syndrome and its components according to the quartiles of heme iron intake (mg/day) among all participants in the SDHS 2012–2013.
Quartiles of Dietary Iron Intake, ORs (95% CI)
Q1Q2Q3Q4p-Value for Trend 1
Heme Iron Intake (mg/day)<0.83(0.83–1.28)(1.28–1.94)≥1.94
n776774773776
Metabolic syndrome
   Crude modelReference0.91(0.72,1.15)0.92(0.73,1.16)0.85(0.67,1.07)0.593
    Adjusted model 2Reference1.06(0.82,1.36)1.11(0.86,1.44)1.06(0.80,1.39)0.895
p-Value for interaction 3 = 0.096
Metabolic syndrome components
  Elevated blood pressure
   Crude modelReference0.76(0.64,0.91) **0.73(0.61,0.87) **0.73(0.61,0.87) **0.001
   Adjusted model 2Reference0.91(0.74,1.13)0.98(0.79,1.22)1.05(0.83,1.32)0.620
  Elevated waist circumference
   Crude modelReference0.89(0.74,1.08)0.95(0.79,1.14)0.93(0.77,1.12)0.681
   Adjusted model 2Reference1.07(0.87,1.31)1.20(0.98,1.48)1.24(0.99,1.55)0.189
  Elevated fasting glucose
   Crude modelReference0.90(0.73,1.11)0.82(0.67,1.01)0.89(0.73,1.10)0.330
   Adjusted model 2Reference1.02(0.82,1.28)0.96(0.76,1.21)1.11(0.87,1.41)0.661
  Elevated triglycerides
   Crude modelReference1.05(0.86,1.29)1.12(0.92,1.36)1.08(0.89,1.32)0.723
   Adjusted model 2Reference1.03(0.83,1.28)1.10(0.88,1.36)1.00(0.79,1.26)0.784
  Reduced HDL-C 4
   Crude modelReference1.05(0.83,1.35)1.16(0.91,1.47)0.99(0.78,1.27)0.547
   Adjusted model 2Reference1.17(0.91,1.52)1.29(0.99,1.68)1.15(0.87,1.53)0.291
* p < 0.05, ** p < 0.001. 1 The p-value for the trend was examined using the medians in each quartile of dietary iron intake. 2 The models were adjusted for age, sex, income, physical activity level, intentional physical exercise, smoking status, alcohol use and dietary total energy intake. 3 The p-value for the interaction was tested for the quartiles of dietary iron intake by gender. 4 HDL-C: high-density lipoprotein-cholesterol.
Table 4. ORs (95% CI) for metabolic syndrome and its components according to the quartiles of nonheme iron intake (mg/day) among all participants in the SDHS 2012–2013.
Quartiles of Dietary Iron Intake, ORs (95% CI)
Q1Q2Q3Q4p-Value for Trend 1
Nonheme Iron Intake (mg/day)<11.62(11.62–15.10)(15.10–20.10)≥20.10
n774774775776
Metabolic syndrome
   Crude modelReference1.07(0.84,1.36)1.23(0.97,1.55)1.12(0.89,1.42)0.364
   Adjusted model 2Reference1.28(0.98,1.66)1.43(1.09,1.87) *1.44(1.04,1.99) *0.065
p-Value for interaction 3 = 0.086
Metabolic syndrome components
  Elevated blood pressure
   Crude modelReference0.91(0.77,1.09)1.26(1.06,1.50) **1.08(0.91,1.29)0.003
   Adjusted model 2Reference1.07(0.86,1.32)1.34(1.07,1.67) *1.18(0.91,1.53)0.058
  Elevated waist circumference
   Crude modelReference1.07(0.89,1.29)1.10(0.91,1.32)1.00(0.83,1.20)0.662
   Adjusted model 2Reference1.22(0.99,1.50)1.26(1.02,1.57) *1.19(0.92,1.53)0.149
  Elevated fasting glucose
   Crude modelReference0.92(0.74,1.14)1.19(0.97,1.46)1.08(0.88,1.33)0.088
   Adjusted model 2Reference1.01(0.80,1.28)1.28(1.01,1.63) *1.25(0.94,1.66)0.107
  Elevated triglycerides
   Crude modelReference1.21(0.99,1.48)1.42(1.17,1.73) **1.34(1.10,1.64) **0.003
   Adjusted model 2Reference1.15(0.93,1.44)1.33(1.06,1.66) *1.26(0.96,1.64)0.100
  Reduced HDL-C 4
   Crude modelReference1.11(0.87,1.40)1.06(0.83,1.35)0.91(0.71,1.16)0.425
   Adjusted model 2Reference1.29(0.99,1.67)1.34(1.02,1.76) *1.30(0.93,1.81)0.157
* p < 0.05, ** p < 0.001. 1 The p-value for the trend was examined using the medians in each quartile of dietary iron intake. 2 The models were adjusted for age, sex, income, physical activity level, intentional physical exercise, smoking status, alcohol use, and dietary total energy intake. 3 The p-value for the interaction was tested for the quartiles of dietary iron intake by gender. 4 HDL-C: high-density lipoprotein-cholesterol.
Table 5. ORs (95% CI) for metabolic syndrome and its components according to the quartiles of total iron intake (mg/day) among men in the SDHS 2012–2013.
Quartiles of Dietary Iron Intake, ORs (95% CI)
Q1Q2Q3Q4p-Value for Trend 1
Total Iron Intake (mg/day)<14.12(14.12–17.87)(17.87–23.68)≥23.68
n357358358357
Metabolic syndrome
   Crude modelReference1.22(0.84,1.77)1.66(1.16,2.39) **1.65(1.15,2.36) **0.013
   Adjusted model 2Reference1.36(0.90,2.07)1.83(1.19,2.81) **2.11(1.29,3.45) **0.016
Metabolic syndrome components
  Elevated blood pressure
   Crude modelReference1.07(0.83,1.38)1.15(0.90,1.48)1.16(0.90,1.49)0.619
   Adjusted model 2Reference1.35(1.00,1.84)1.33(0.97,1.82)1.43(0.99,2.06)0.164
  Elevated waist circumference
   Crude modelReference1.65(1.21,2.24) **1.74(1.29,2.36) **1.84(1.36,2.49) **0.000
   Adjusted model 2Reference1.59(1.14,2.21) **1.61(1.15,2.27) **1.65(1.12,2.43) *0.019
  Elevated fasting glucose
   Crude modelReference0.94(0.70,1.26)1.00(0.75,1.33)0.98(0.74,1.31)0.973
   Adjusted model 2Reference1.14(0.82,1.58)1.17(0.83,1.66)1.40(0.94,2.10)0.431
  Elevated triglycerides
   Crude modelReference1.24(0.94,1.64)1.38(1.05,1.82) *1.32(1.01,1.74) *0.096
   Adjusted model 2Reference1.21(0.89,1.65)1.30(0.95,1.78)1.34(0.93,1.94)0.361
  Reduced HDL-C
   Crude modelReference0.98(0.65,1.48)1.23(0.83,1.83)1.08(0.72,1.62)0.658
   Adjusted model 2Reference0.92(0.59,1.45)1.38(0.87,2.19)1.34(0.77,2.32)0.287
* p < 0.05, ** p < 0.001. 1 The p-value for the trend was examined using the medians in each quartile of dietary iron intake. 2 The models were adjusted for age, income, physical activity level, intentional physical exercise, smoking status, alcohol use, and dietary total energy intake.
Table 6. ORs (95% CI) for metabolic syndrome and its components according to the quartiles of heme iron intake (mg/day) among men in the SDHS 2012–2013.
Quartiles of Dietary Iron Intake, ORs (95% CI)
Q1Q2Q3Q4p-Value for Trend 1
Heme Iron Intake (mg/day)<0.93(0.93–1.40)(1.40–2.02)≥2.02
n357358357358
Metabolic syndrome
   Crude modelReference1.27(0.89,1.81)1.09(0.76,1.56)1.21(0.85,1.73)0.547
   Adjusted model 2Reference1.38(0.94,2.02)1.12(0.75,1.68)1.21(0.80,1.82)0.415
Metabolic syndrome components
  Elevated blood pressure
   Crude modelReference0.99(0.76,1.28)0.73(0.57,0.95) *0.85(0.66,1.09)0.059
   Adjusted model 2Reference1.29(0.95,1.75)1.05(0.77,1.43)1.23(0.89,1.69)0.308
  Elevated waist circumference
   Crude modelReference1.25(0.91,1.69)1.37(1.01,1.86) *1.82(1.36,2.45) **0.001
   Adjusted model 2Reference1.26(0.91,1.76)1.33(0.95,1.86)1.89(1.35,2.65) **0.003
  Elevated fasting glucose
   Crude modelReference1.02(0.76,1.36)0.85(0.63,1.14)0.92(0.69,1.23)0.597
   Adjusted model 2Reference1.12(0.82,1.54)1.02(0.73,1.42)1.18(0.84,1.65)0.729
  Elevated triglycerides
   Crude modelReference1.02(0.78,1.35)1.06(0.81,1.39)1.01(0.77,1.33)0.978
   Adjusted model 2Reference0.90(0.67,1.22)0.96(0.71,1.30)0.82(0.59,1.12)0.607
  Reduced HDL-C
   Crude modelReference1.06(0.71,1.59)1.03(0.69,1.54)1.06(0.71,1.58)0.991
   Adjusted model 2Reference1.05(0.68,1.61)0.96(0.62,1.49)0.98(0.62,1.55)0.982
* p < 0.05, ** p < 0.001. 1 The p-value for the trend was examined using the medians in each quartile of dietary iron intake. 2 The models were adjusted for age, income, physical activity level, intentional physical exercise, smoking status, alcohol use, and dietary total energy intake.
Table 7. ORs (95% CI) for metabolic syndrome and its components according to the quartiles of nonheme iron intake (mg/day) among men in the SDHS 2012–2013.
Quartiles of Dietary Iron Intake, ORs (95% CI)
Q1Q2Q3Q4p-Value for Trend 1
Nonheme Iron Intake (mg/day)<12.76(12.76–16.31)(16.31–21.72)≥21.72
n358357357358
Metabolic syndrome
   Crude modelReference1.29(0.89,1.87)1.65(1.15,2.37) **1.60(1.11,2.30) *0.026
   Adjusted model 2Reference1.49(0.99,2.25)1.79(1.17,2.74) **2.05(1.26,3.35) **0.025
Metabolic syndrome components
  Elevated blood pressure
   Crude modelReference0.97(0.75,1.25)1.16(0.91,1.50)1.11(0.86,1.43)0.443
   Adjusted model 2Reference1.21(0.89,1.64)1.24(0.91,1.70)1.28(0.88,1.84)0.494
  Elevated waist circumference
   Crude modelReference1.43(1.06,1.94) *1.49(1.10,2.01) **1.71(1.27,2.31) **0.004
   Adjusted model 2Reference1.40(1.01,1.94) *1.37(0.98,1.92)1.48(1.01,2.17) *0.143
  Elevated fasting glucose
   Crude modelReference0.86(0.64,1.15)0.94(0.71,1.25)0.97(0.72,1.29)0.769
   Adjusted model 2Reference1.02(0.74,1.42)1.10(0.78,1.55)1.33(0.89,1.98)0.500
  Elevated triglycerides
   Crude modelReference1.28(0.97,1.69)1.37(1.04,1.79) *1.31(0.99,1.73)0.113
   Adjusted model 2Reference1.25(0.92,1.69)1.23(0.90,1.69)1.33(0.92,1.92)0.399
  Reduced HDL-C
   Crude modelReference1.04(0.70,1.57)1.20(0.81,1.78)1.06(0.71,1.58)0.822
   Adjusted model 2Reference1.06(0.68,1.65)1.38(0.87,2.20)1.35(0.78,2.33)0.495
* p < 0.05, ** p < 0.001. 1 The p-value for the trend was examined using the medians in each quartile of dietary iron intake. 2 The models were adjusted for age, income, physical activity level, intentional physical exercise, smoking status, alcohol use, and dietary total energy intake.
Table 8. ORs (95% CI) for metabolic syndrome and its components according to the quartiles of total iron intake (mg/day) among women in the SDHS 2012–2013.
Quartiles of Dietary Iron Intake, ORs (95% CI)
Q1Q2Q3Q4p-Value for Trend 1
Total Iron Intake (mg/day)<11.67(11.67–15.10)(15.10–20.00)≥20.00
n416419416418
Metabolic syndrome
   Crude modelReference1.02(0.74,1.40)1.21(0.88,1.65)0.96(0.70,1.32)0.476
   Adjusted model 2Reference1.25(0.88,1.78)1.41(0.98,2.02)1.27(0.82,1.96)0.322
Metabolic syndrome components
  Elevated blood pressure
   Crude modelReference0.86(0.68,1.10)1.08(0.85,1.37)0.85(0.67,1.09)0.163
   Adjusted model 2Reference1.01(0.75,1.37)1.29(0.94,1.76)1.05(0.73,1.52)0.306
  Elevated waist circumference
   Crude modelReference0.97(0.76,1.24)1.01(0.79,1.29)0.93(0.72,1.19)0.914
   Adjusted model 2Reference1.09(0.83,1.44)1.13(0.85,1.50)1.15(0.82,1.62)0.839
  Elevated fasting glucose
   Crude modelReference0.90(0.67,1.22)1.23(0.92,1.64)1.09(0.81,1.47)0.216
   Adjusted model 2Reference1.01(0.73,1.41)1.33(0.95,1.85)1.23(0.83,1.83)0.274
  Elevated triglycerides
   Crude modelReference1.01(0.75,1.34)1.13(0.85,1.50)1.08(0.81,1.44)0.814
   Adjusted model 2Reference1.06(0.77,1.44)1.16(0.85,1.60)1.18(0.81,1.72)0.773
  Reduced HDL-C
   Crude modelReference1.19(0.88,1.62)1.14(0.84,1.56)1.14(0.84,1.56)0.710
   Adjusted model 2Reference1.37(0.98,1.91)1.31(0.93,1.85)1.40(0.93,2.10)0.264
1 The p-value for the trend was examined using medians in each quartile of dietary iron intake. 2 The models were adjusted for age, income, physical activity level, intentional physical exercise, smoking status, alcohol use, and dietary total energy intake.
Table 9. ORs (95% CI) for metabolic syndrome and its components according to the quartiles of heme iron intake (mg/day) among women in the SDHS 2012–2013.
Quartiles of Dietary Iron Intake, ORs (95% CI)
Q1Q2Q3Q4p-Value for Trend 1
Heme Iron Intake (mg/day)<0.76(0.76–1.19)(1.19–1.81)≥1.81
n416419419415
Metabolic syndrome
   Crude modelReference0.88(0.65,1.19)0.81(0.60,1.11)0.74(0.54,1.01)0.273
   Adjusted model 2Reference1.08(0.78,1.52)1.06(0.75,1.51)1.08(0.74,1.57)0.967
Metabolic syndrome components
  Elevated blood pressure
   Crude modelReference0.71(0.55,0.90) **0.63(0.49,0.80) **0.58(0.45,0.74) **0.000
   Adjusted model 2Reference0.93(0.69,1.26)0.90(0.67,1.23)0.91(0.66,1.26)0.924
  Elevated waist circumference
   Crude modelReference0.94(0.74,1.21)0.91(0.71,1.16)0.77(0.59,0.99) *0.193
   Adjusted model 2Reference1.18(0.90,1.54)1.22(0.92,1.61)1.05(0.78,1.42)0.439
  Elevated fasting glucose
   Crude modelReference0.85(0.63,1.13)0.75(0.55,1.00)0.87(0.65,1.17)0.285
   Adjusted model 2Reference0.98(0.72,1.35)0.94(0.67,1.30)1.12(0.79,1.58)0.755
  Elevated triglycerides
   Crude modelReference1.06(0.79,1.41)1.01(0.76,1.35)1.00(0.75,1.34)0.979
   Adjusted model 2Reference1.17(0.87,1.59)1.14(0.83,1.57)1.20(0.86,1.67)0.700
  Reduced HDL-C
   Crude modelReference1.13(0.83,1.55)1.54(1.13,2.09) **1.11(0.81,1.53)0.033
   Adjusted model 2Reference1.24(0.89,1.73)1.65(1.18,2.31) **1.25(0.87,1.79)0.027
* p < 0.05, ** p < 0.001. 1 The p-value for the trend was examined using medians in each quartile of dietary iron intake. 2 The models were adjusted for age, income, physical activity level, intentional physical exercise, smoking status, alcohol use, and dietary total energy intake.
Table 10. ORs (95% CI) for metabolic syndrome and its components according to the quartiles of nonheme iron intake (mg/day) among women in the SDHS 2012–2013.
Quartiles of Dietary Iron Intake, ORs (95% CI)
Q1Q2Q3Q4p-Value for Trend 1
Nonheme Iron Intake (mg/day)<10.69(10.69–13.76)(13.76–18.24)≥18.24
n418418416417
Metabolic syndrome
   Crude modelReference0.87(0.64,1.21)1.25(0.92,1.70)0.92(0.67,1.27)0.111
   Adjusted model 2Reference1.01(0.71,1.44)1.42(0.99,2.03)1.14(0.74,1.75)0.150
Metabolic syndrome components
  Elevated blood pressure
   Crude modelReference0.93(0.73,1.18)1.17(0.92,1.49)0.93(0.73,1.19)0.214
   Adjusted model 2Reference1.10(0.81,1.49)1.42(1.03,1.94) *1.15(0.80,1.66)0.140
  Elevated waist circumference
   Crude modelReference0.90(0.70,1.15)1.00(0.78,1.28) **0.90(0.70,1.15)0.689
   Adjusted model 2Reference0.99(0.75,1.30)1.08(0.81,1.44)1.05(0.74,1.47)0.918
  Elevated fasting glucose
   Crude modelReference0.96(0.71,1.31)1.29(0.97,1.73)1.16(0.86,1.56)0.181
   Adjusted model 2Reference1.09(0.78,1.51)1.40(1.00,1.95) *1.29(0.87,1.91)0.215
  Elevated triglycerides
   Crude modelReference0.92(0.68,1.23)1.24(0.94,1.64)1.02(0.76,1.35)0.194
   Adjusted model 2Reference0.94(0.68,1.28)1.26(0.92,1.72)1.06(0.73,1.54)0.243
  Reduced HDL-C
   Crude modelReference1.19(0.87,1.62)1.16(0.85,1.58)1.07(0.78,1.47)0.685
   Adjusted model 2Reference1.30(0.93,1.81)1.28(0.91,1.80)1.23(0.82,1.85)0.421
* p < 0.05, ** p < 0.001. 1 The p-value for the trend was examined using medians in each quartile of dietary iron intake. 2 The models were adjusted for age, income, physical activity level, intentional physical exercise, smoking status, alcohol use, and dietary total energy intake.

