“Kill Two Birds with One Stone”: Urban Tree Species Classification Using Bi-Temporal Pléiades Images to Study Nesting Preferences of an Invasive Bird


Abstract
:
1. Introduction
2. Materials and Methods
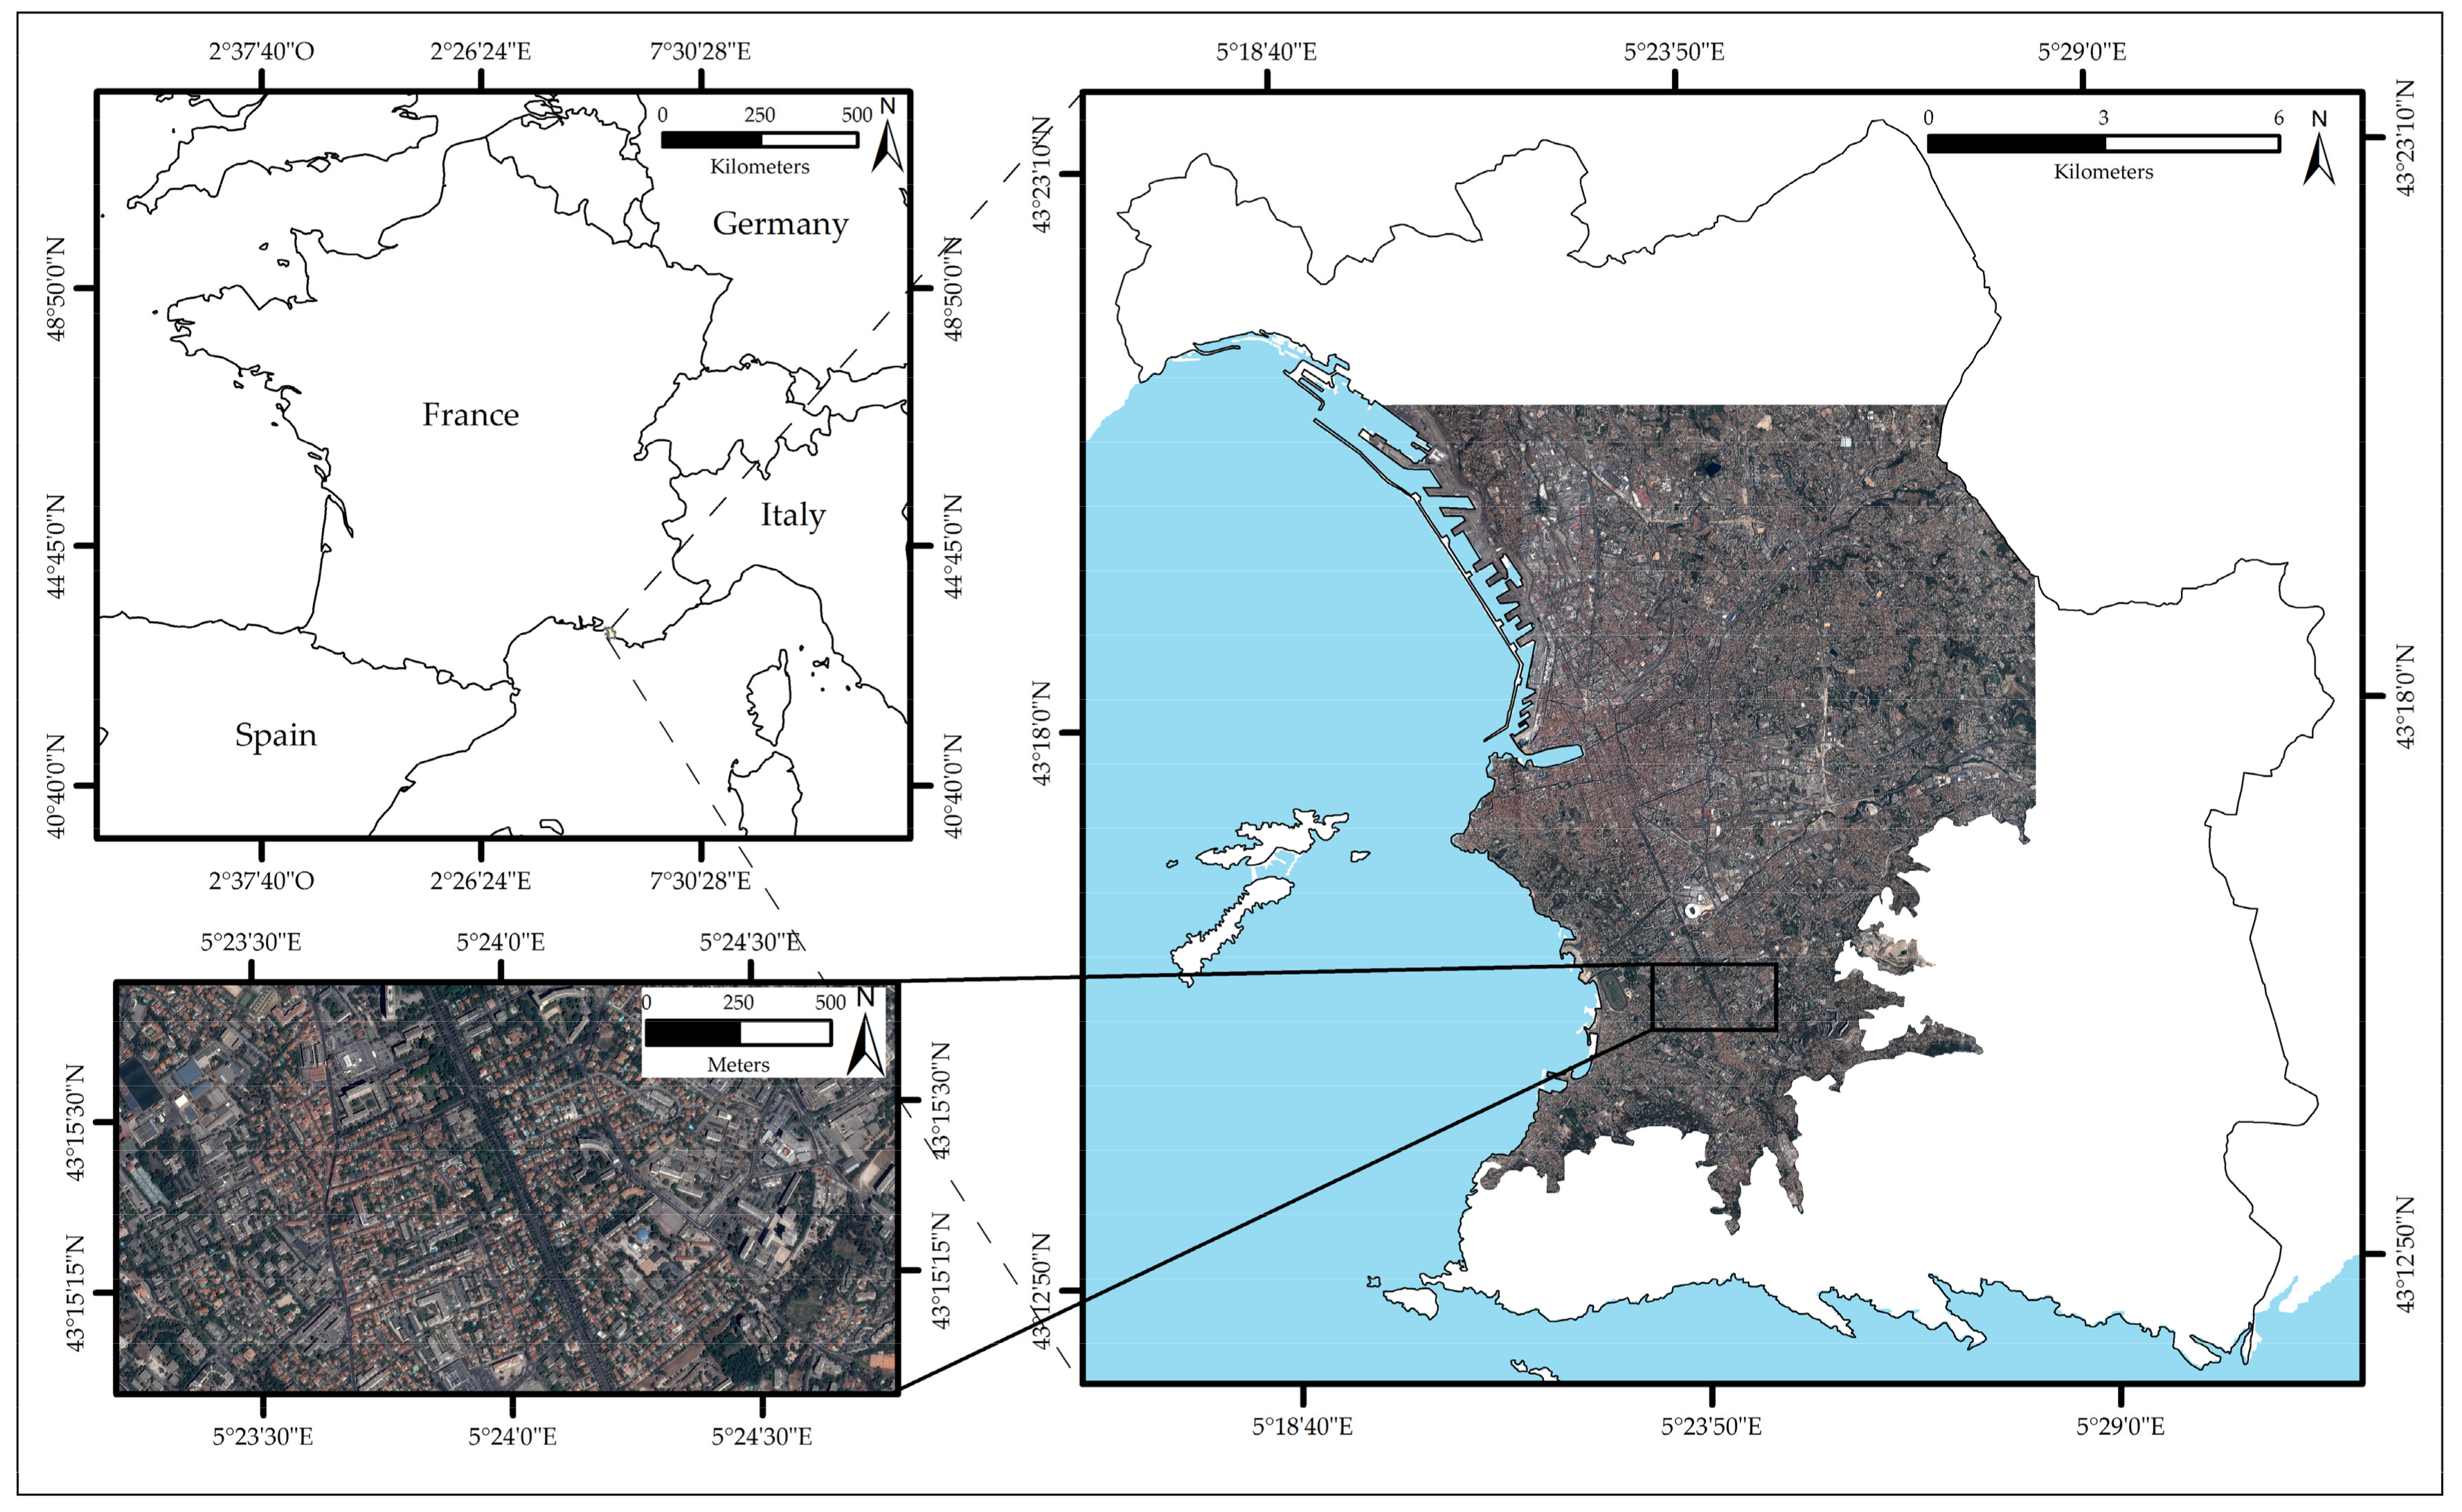
2.1. Study Area
2.2. Datasets
2.2.1. Pléiades Images
2.2.2. Reference Data
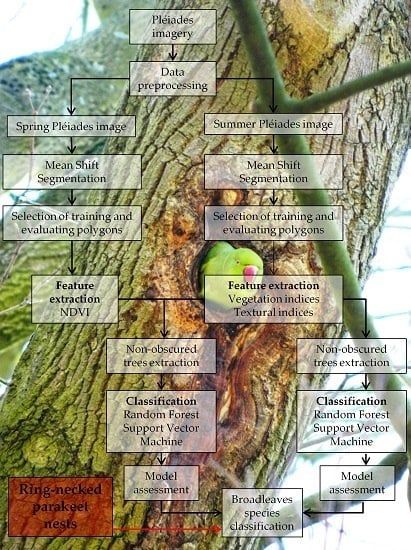
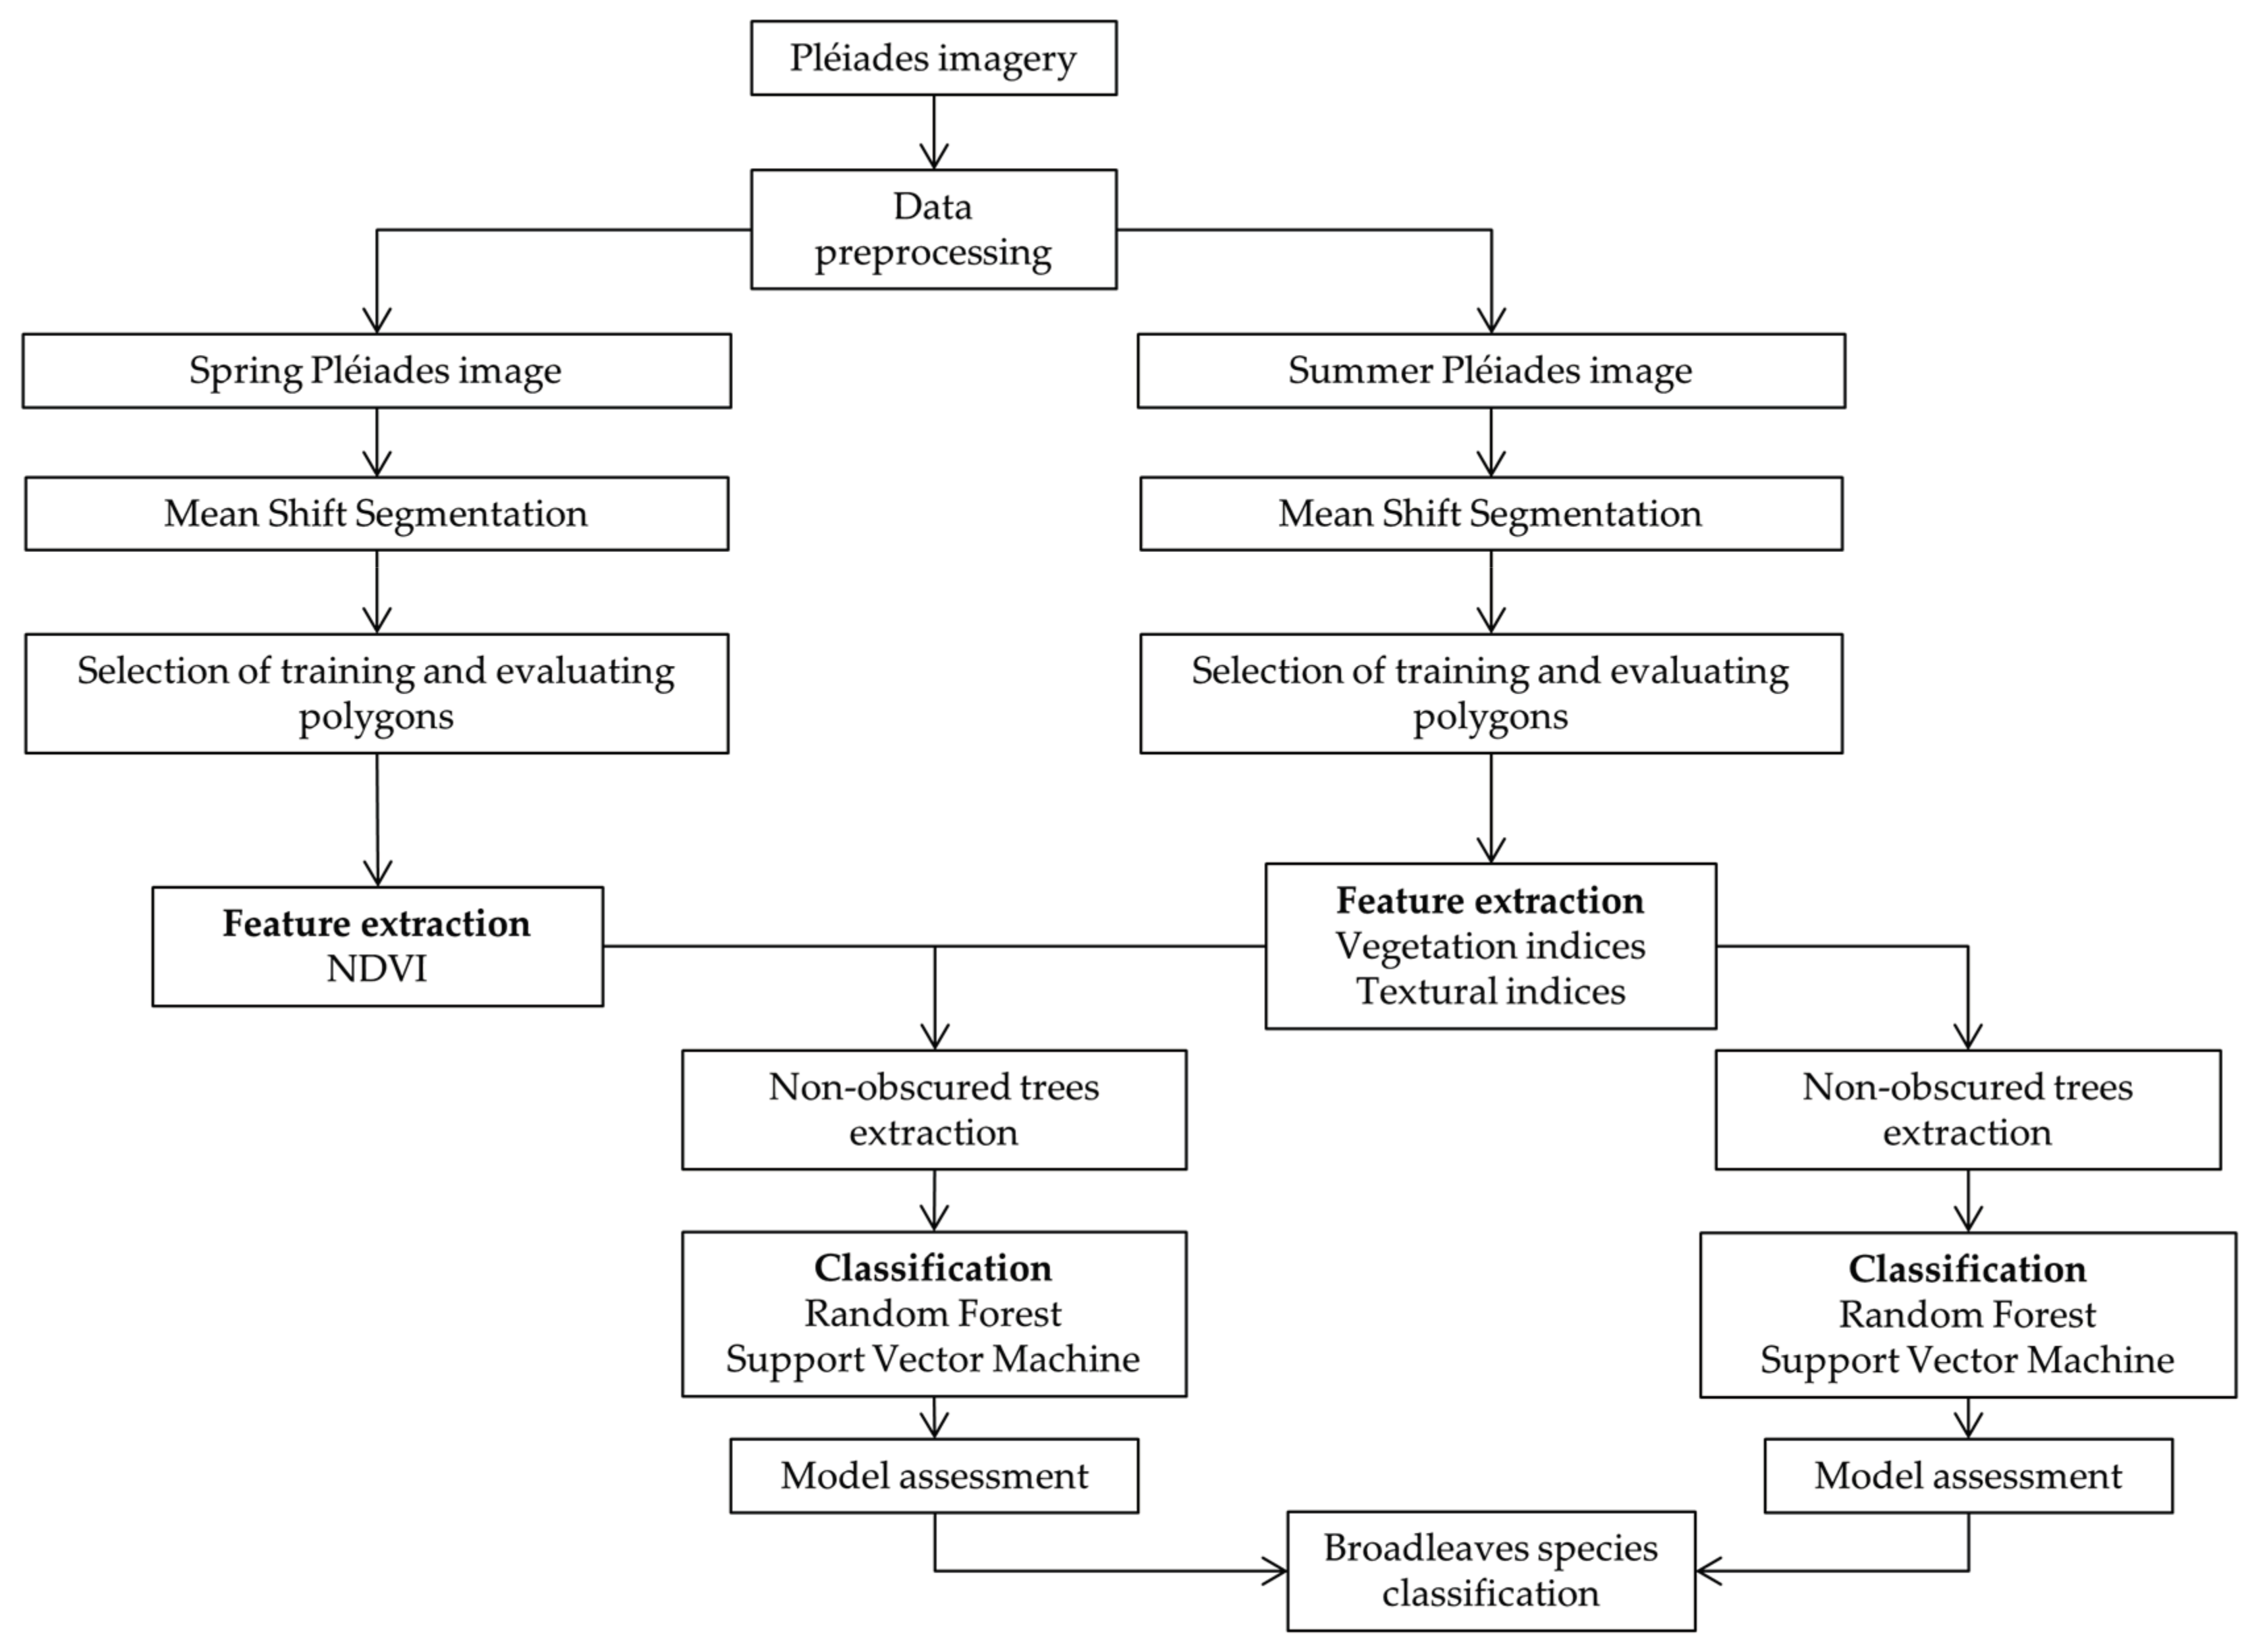
2.3. Methodology
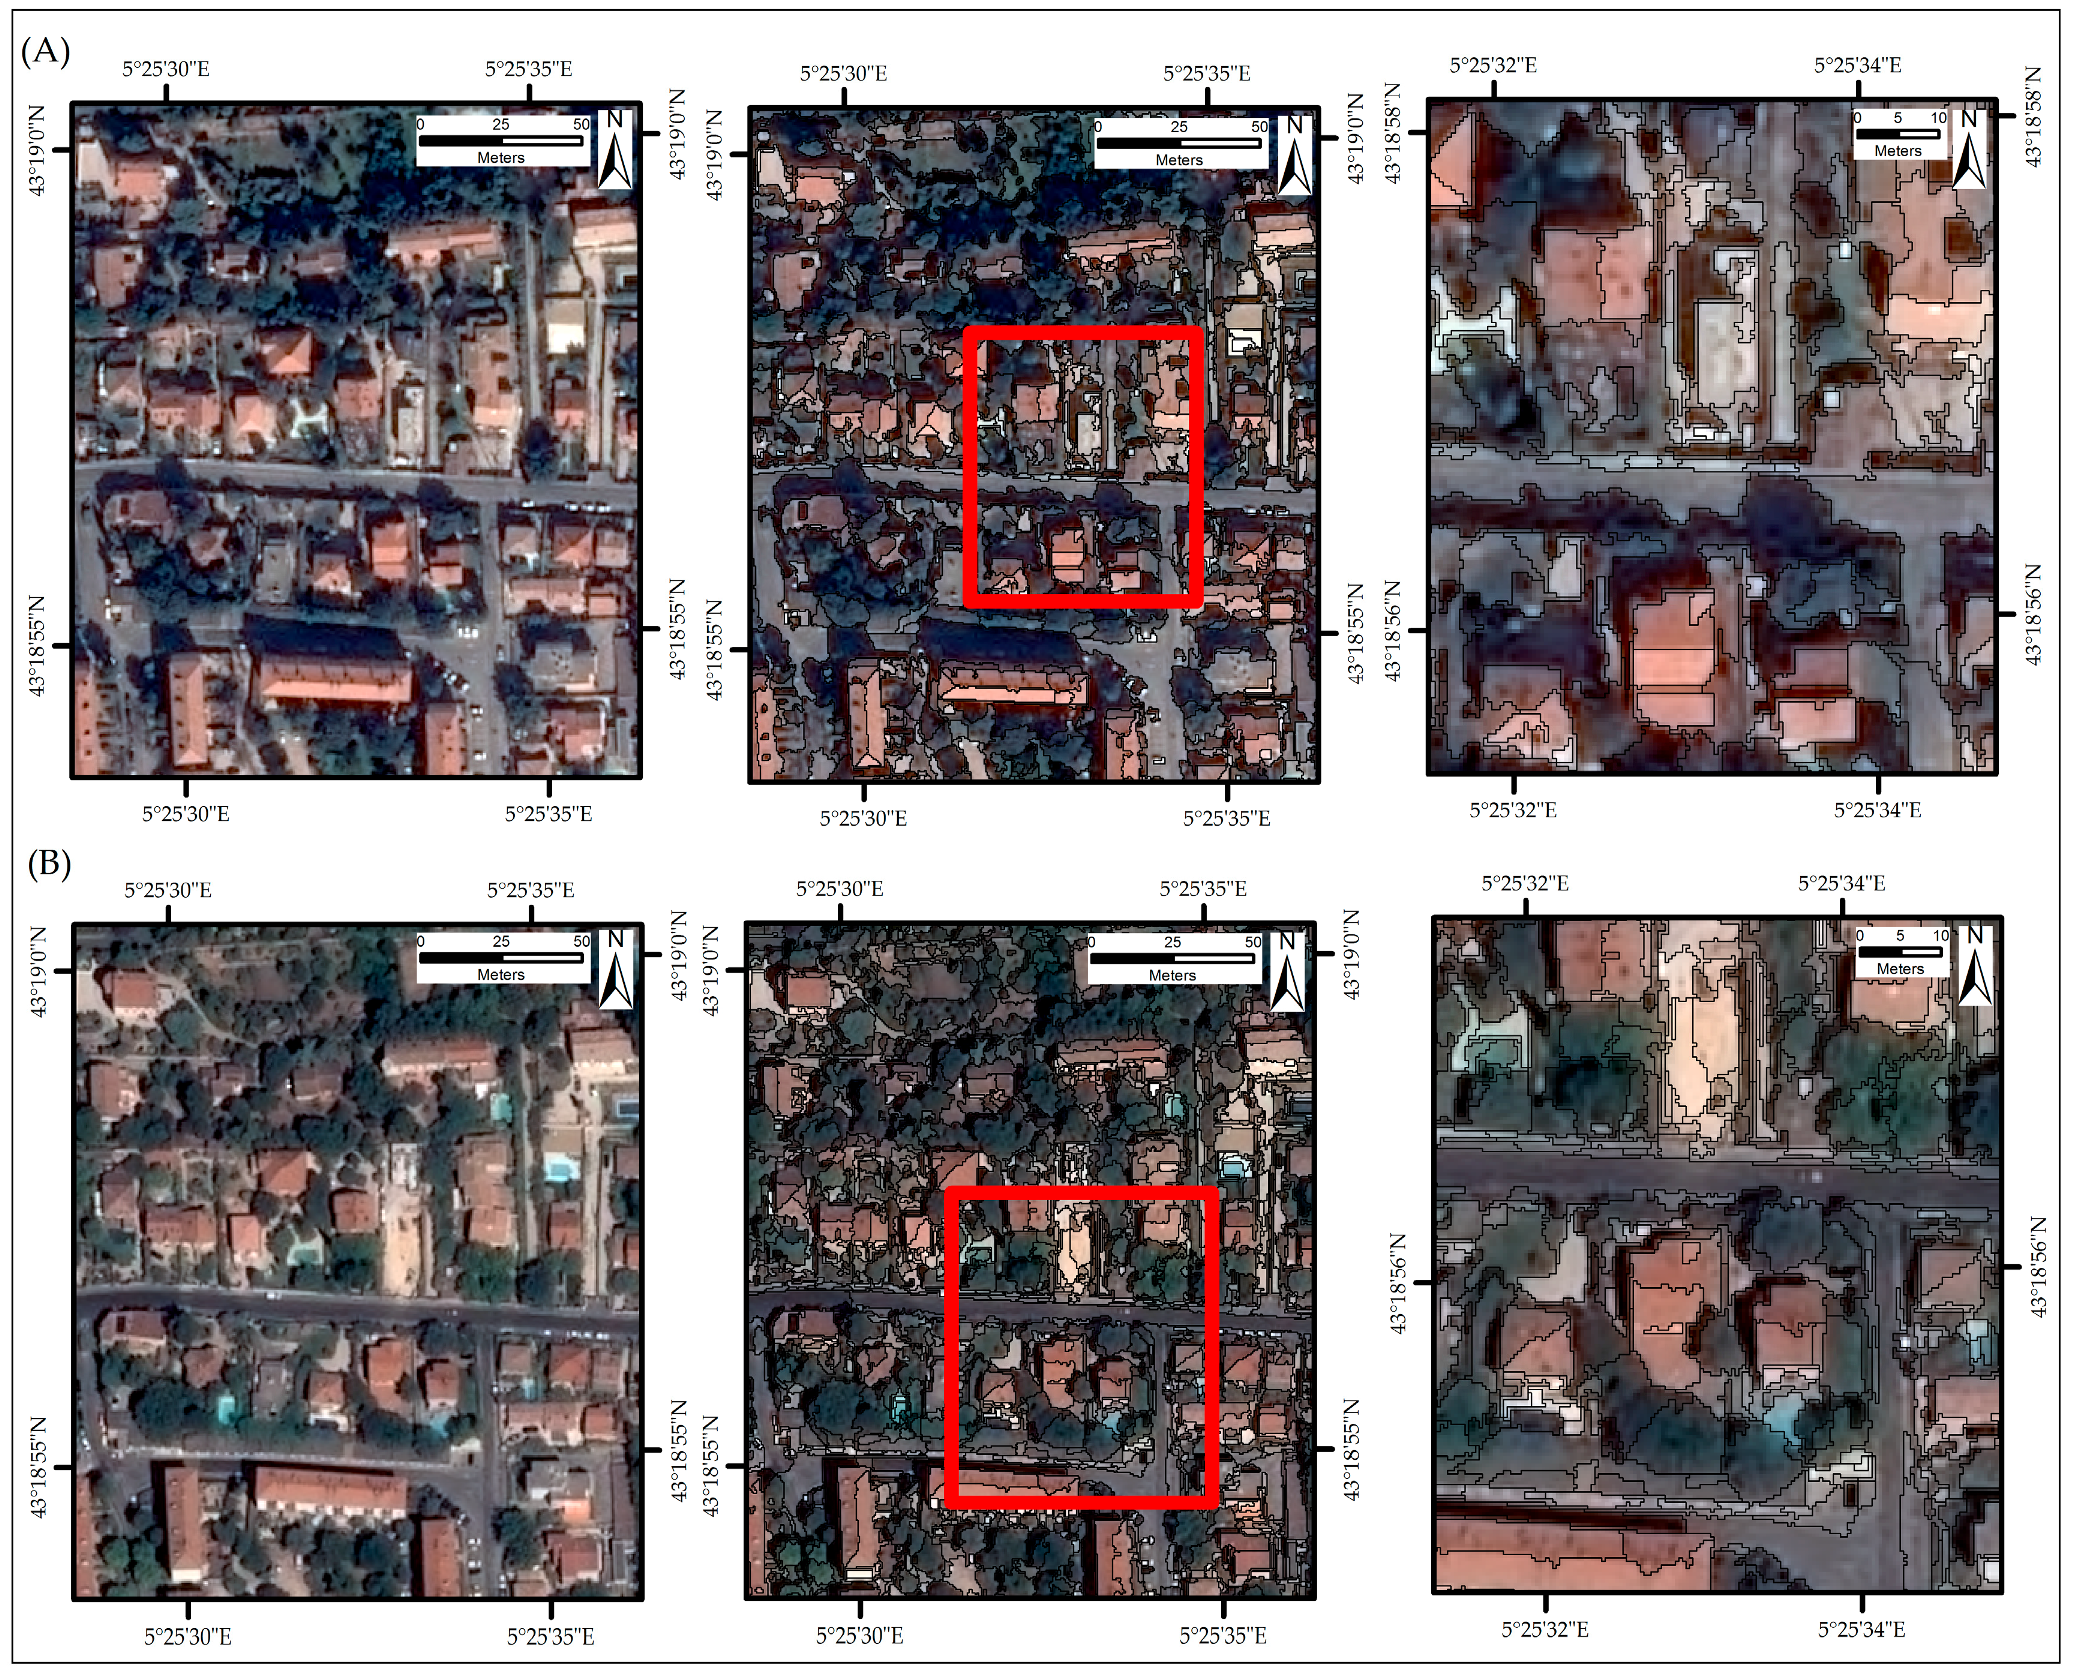
2.3.1. Segmentation
2.3.2. Extraction of Spectral and Textural Features
2.3.3. Classification and Tree Cover Mask
2.3.4. Ring-Necked Parakeet Breeding Occurrences
3. Results
3.1. Classification Results
3.2. Relative Importance of Features
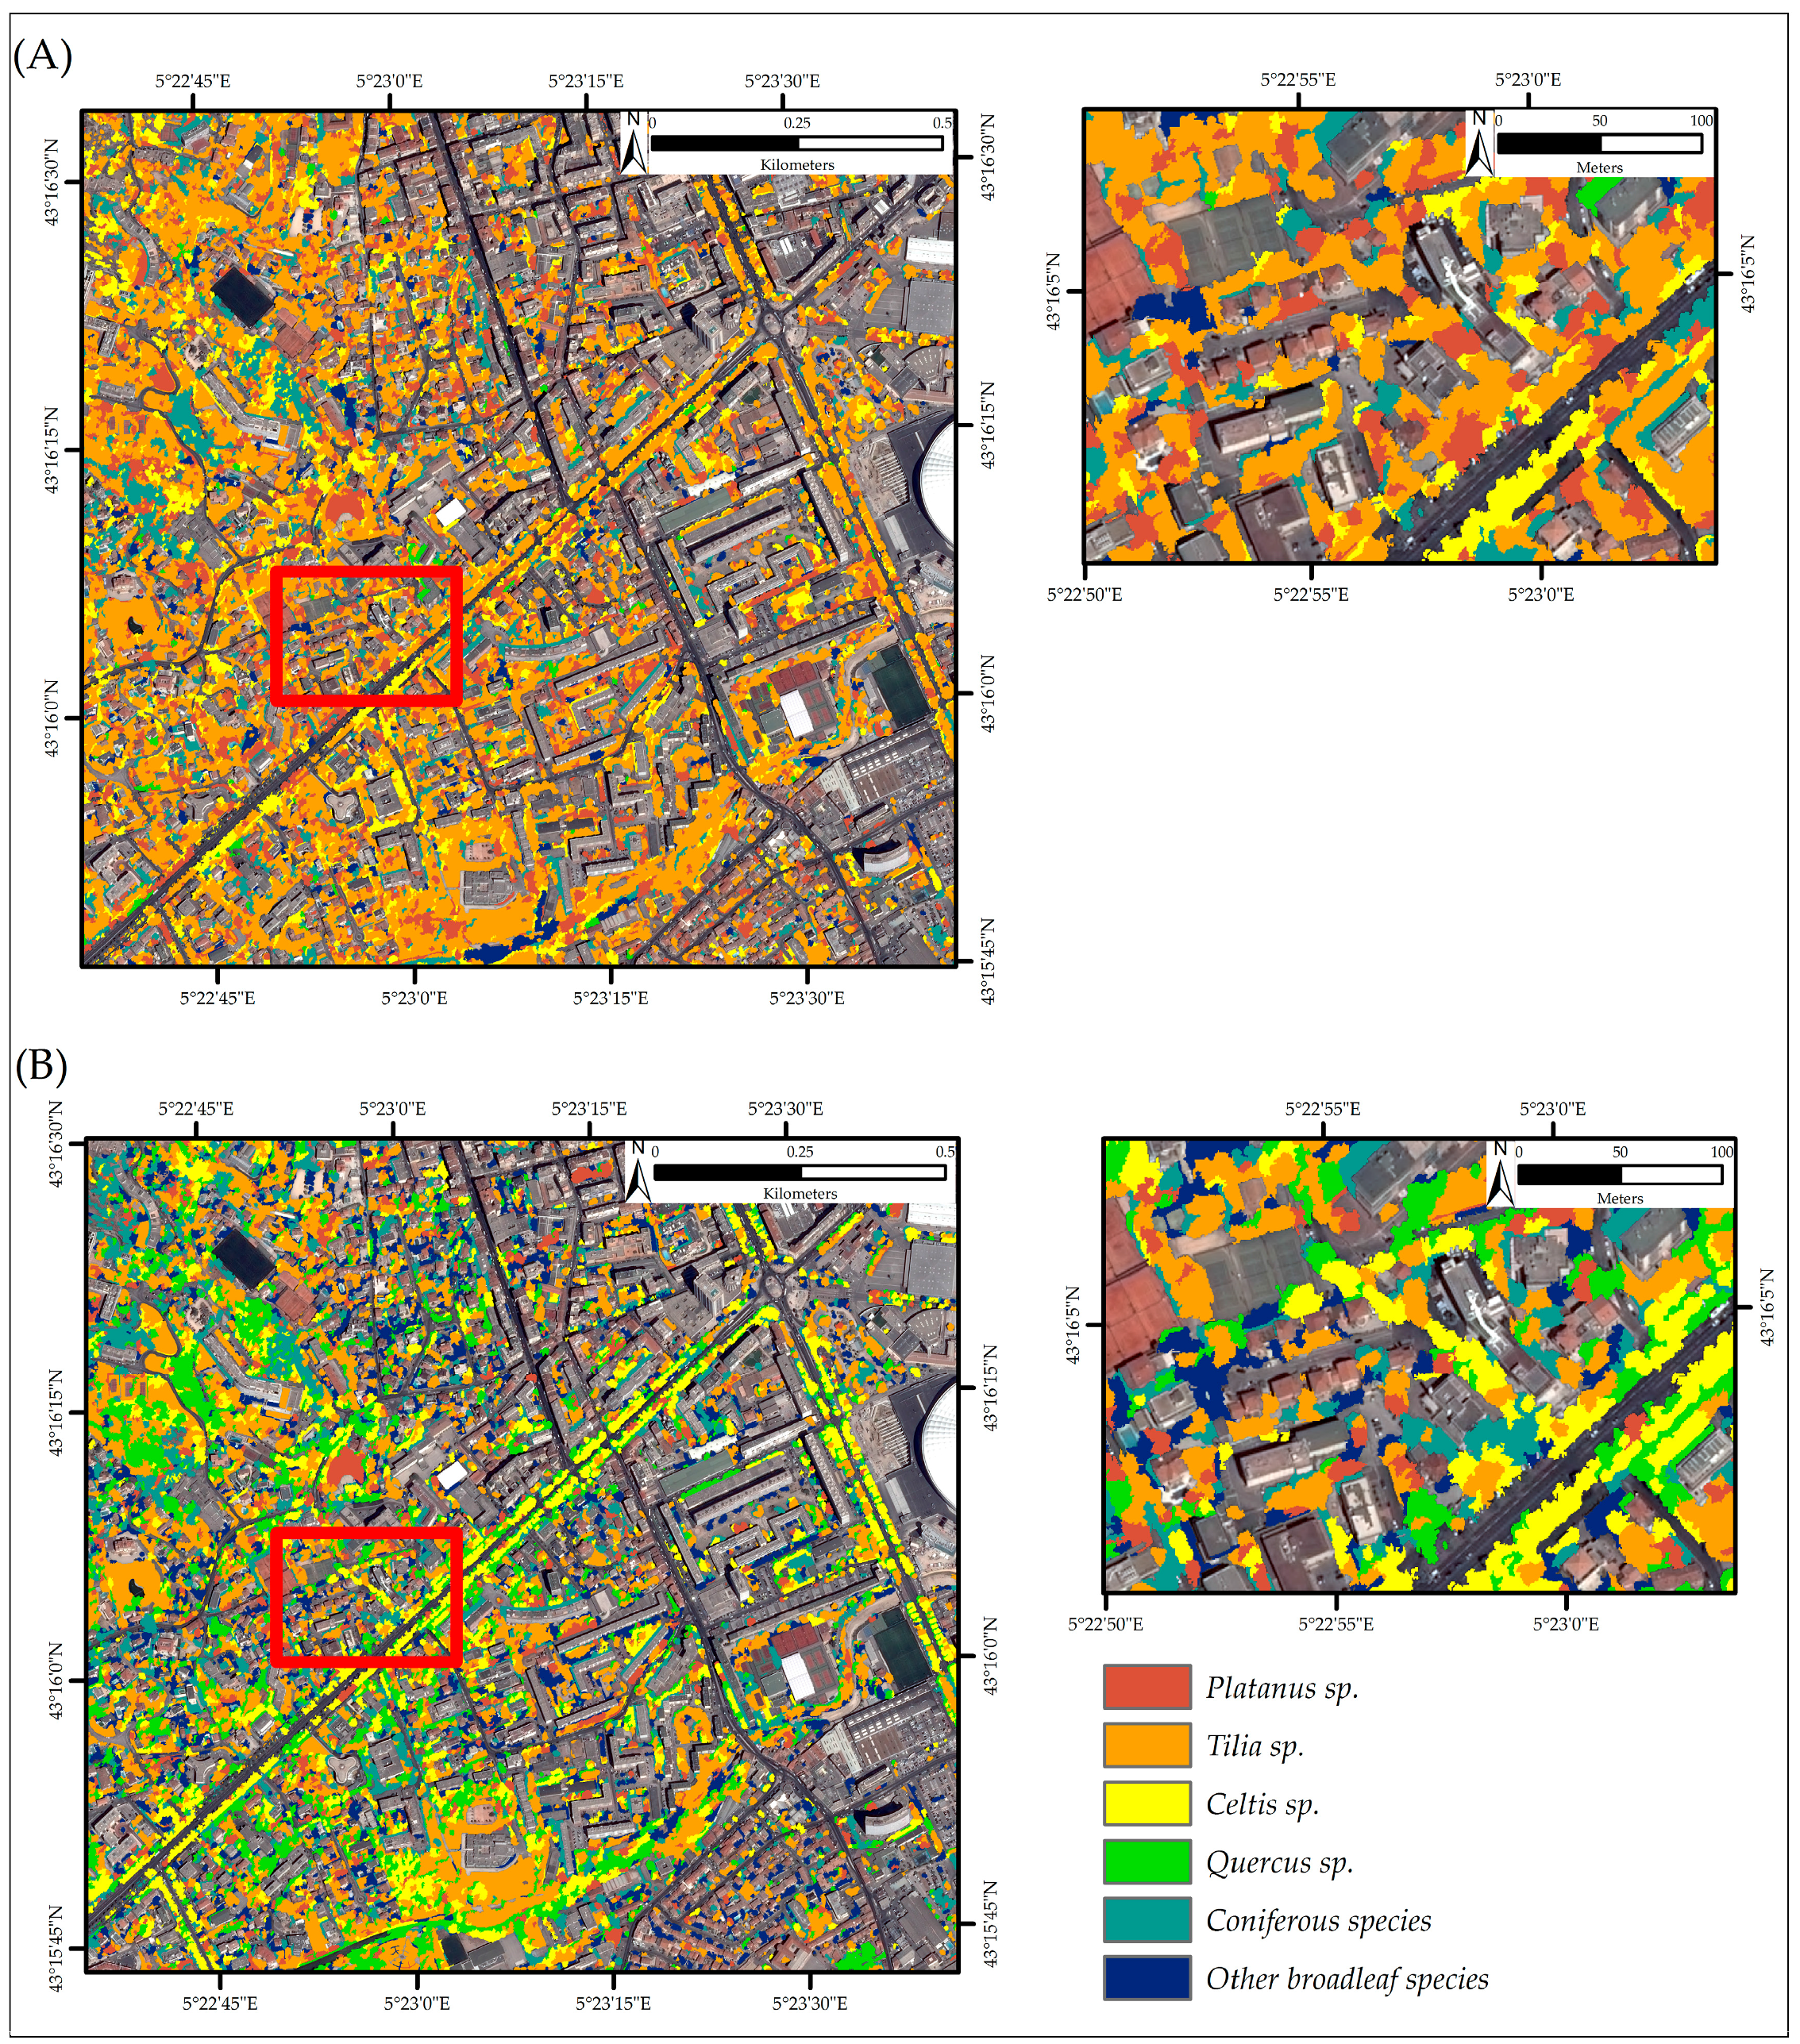
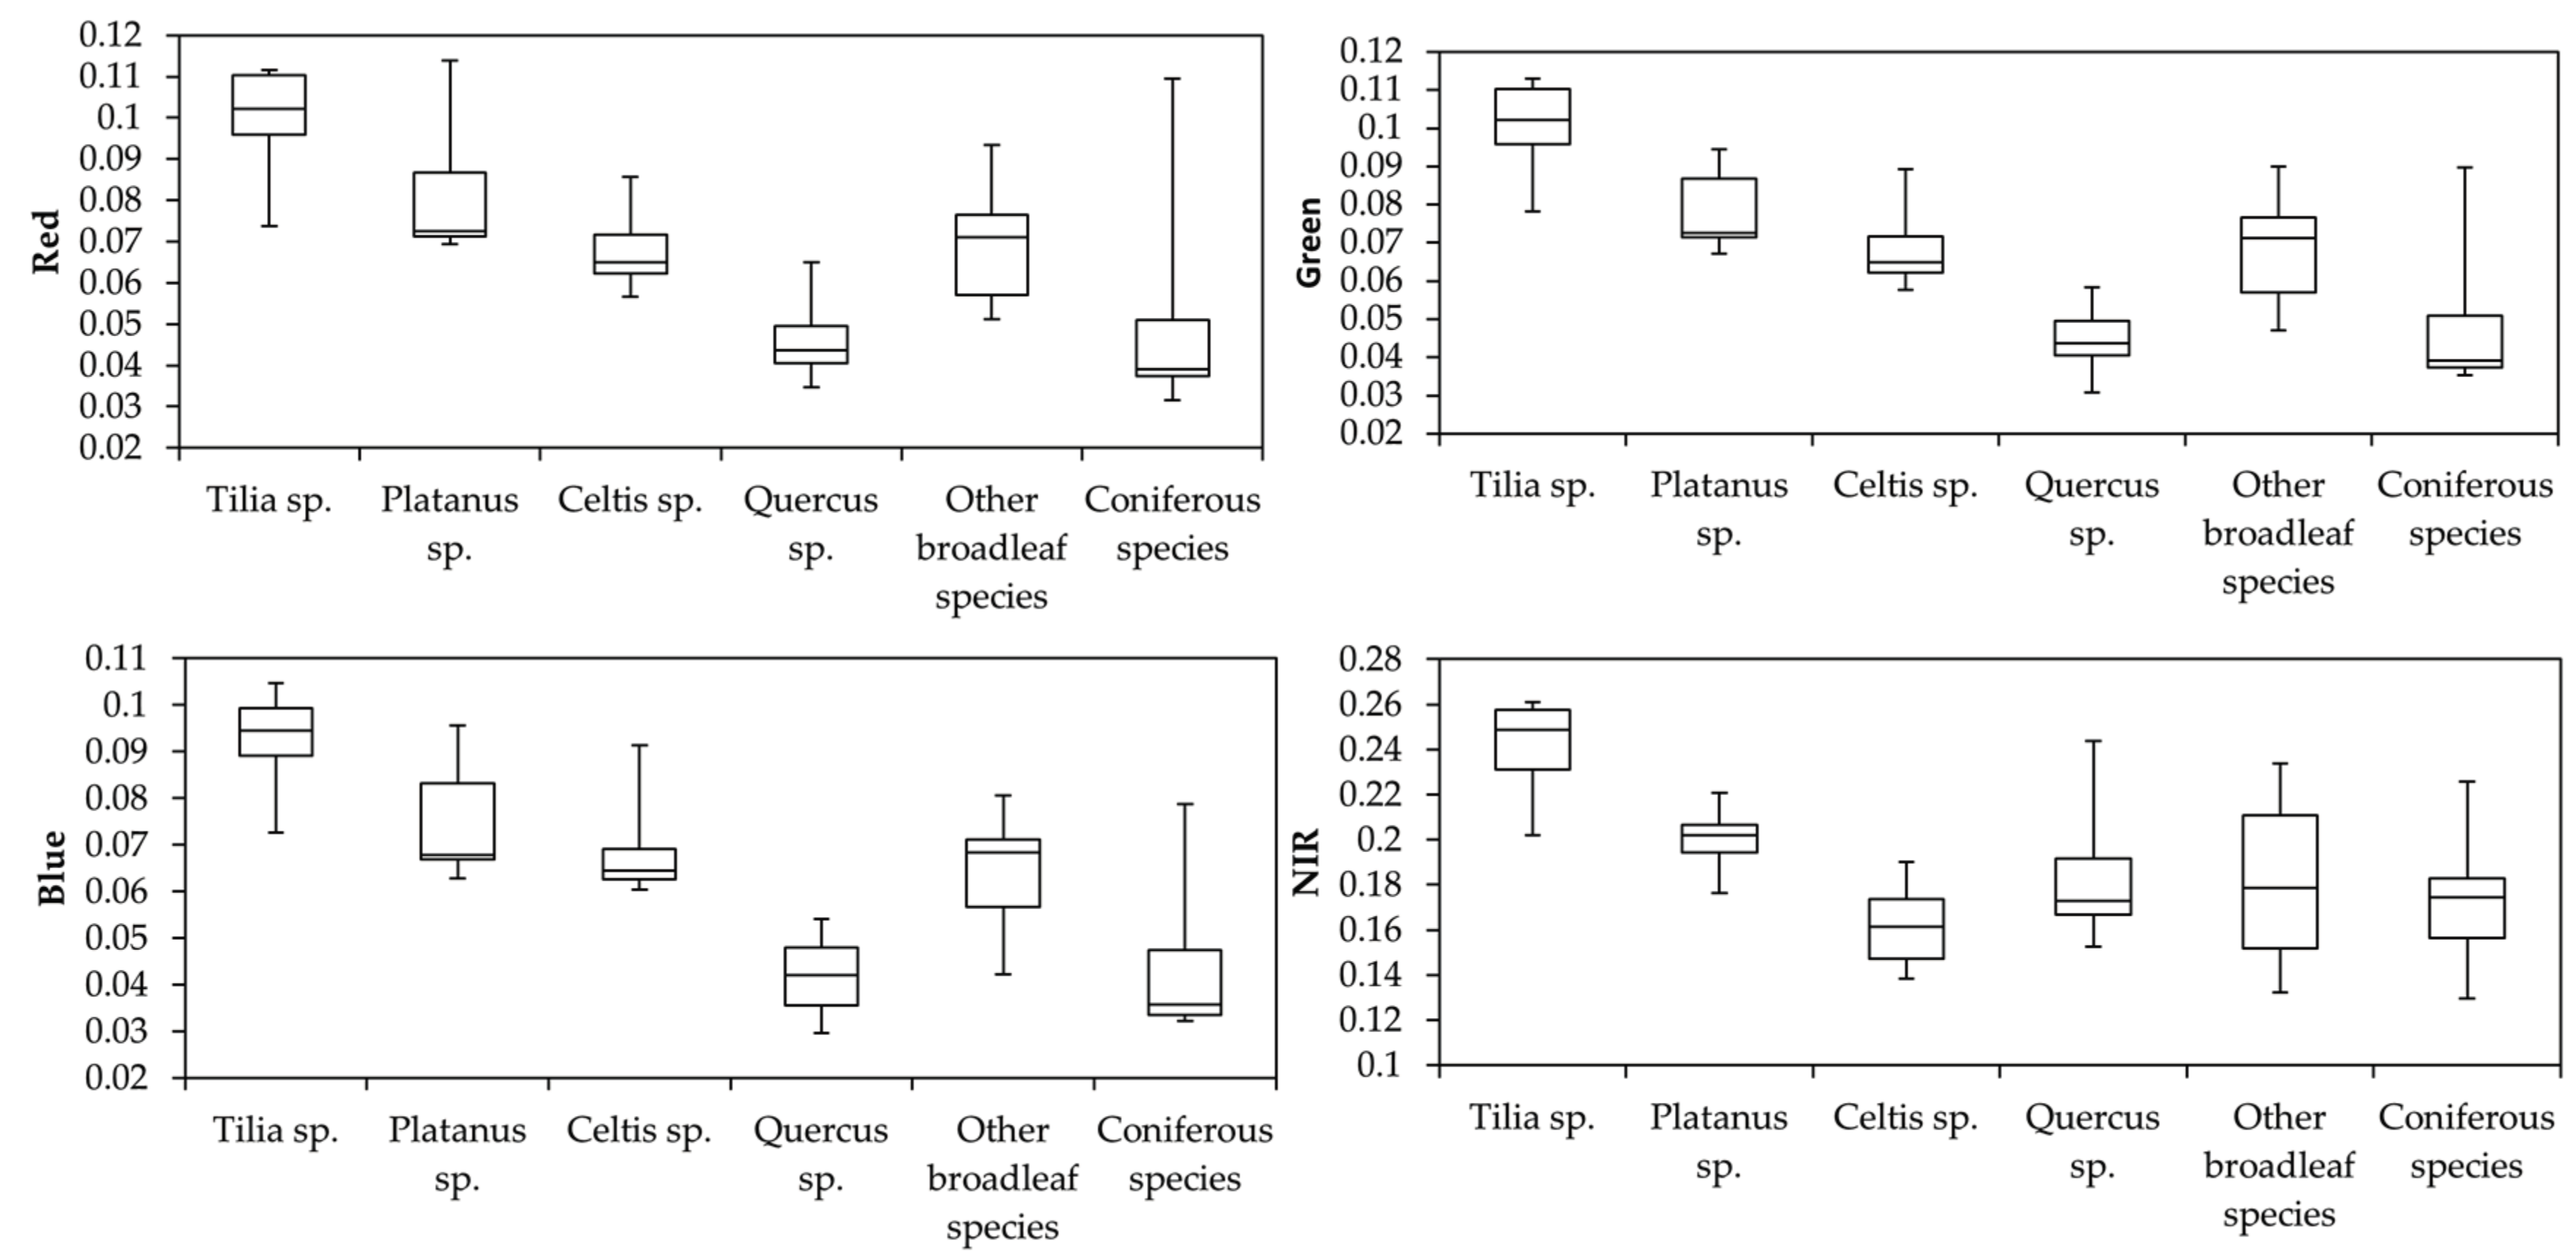
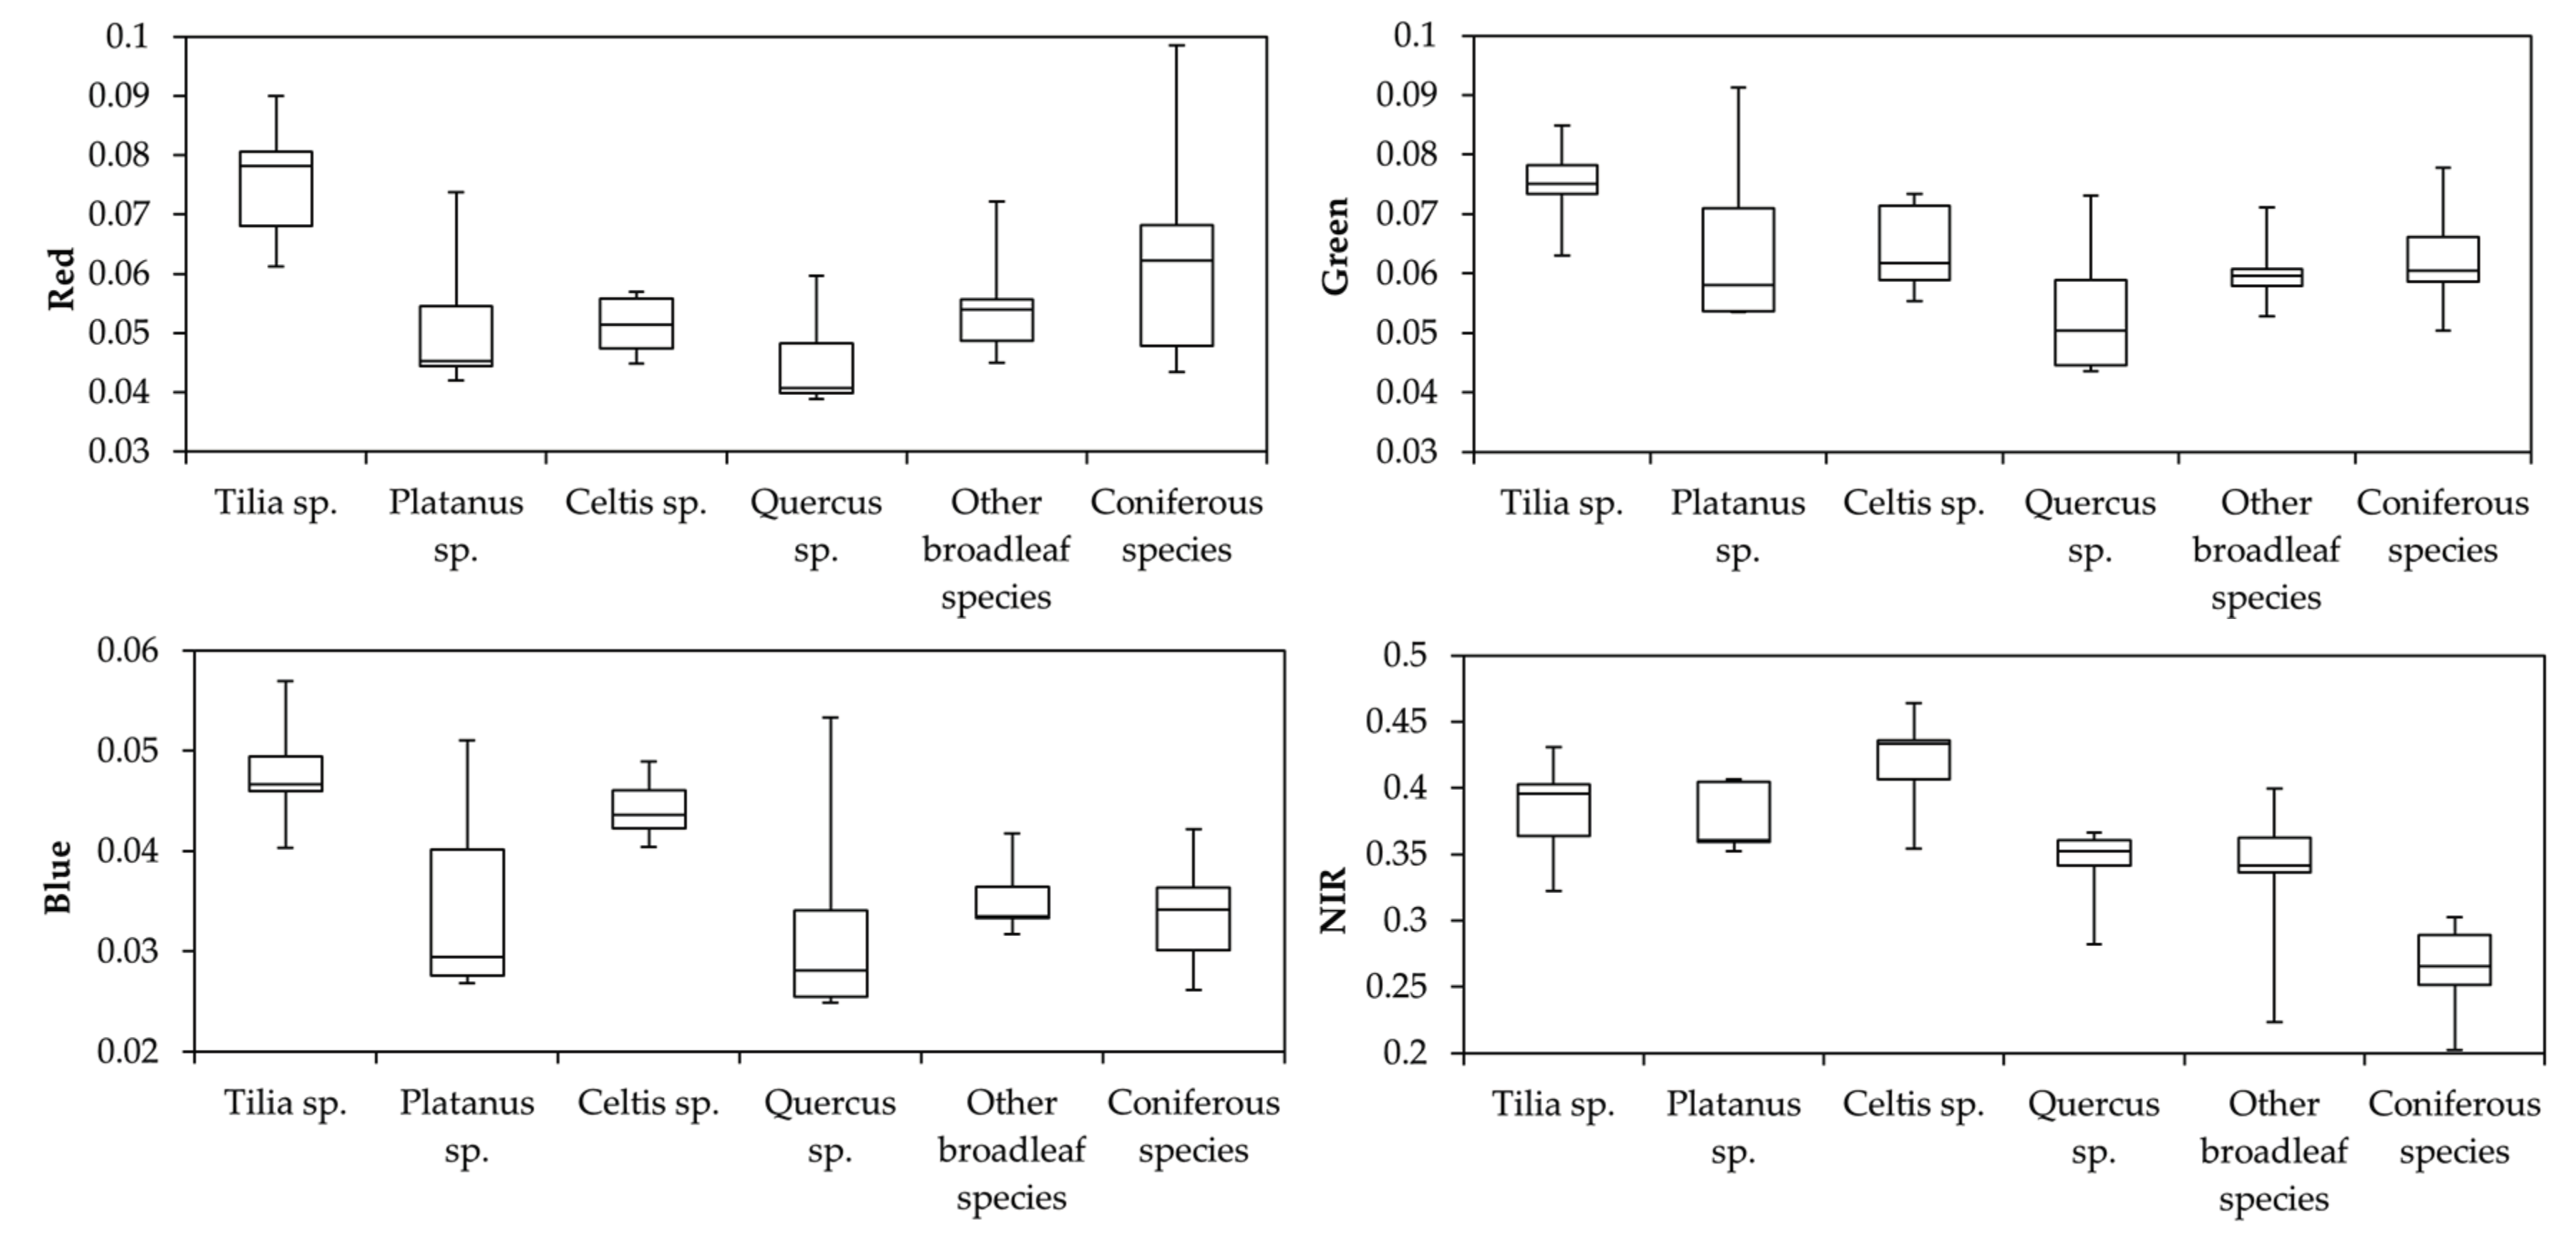
3.3. Tree Species Classification
3.4. Relative Use of Tree Species by Nesting Ring-Necked Parakeets
4. Discussion
4.1. Contribution of Bi-Temporal Pléiades Images on Urban Tree Species Classification
4.2. Random Forest and Support Vector Machine Algorithms
4.3. Spatial Distribution of Tree Species and Breeding Ring-Necked Parakeets across the City of Marseille
5. Conclusions
- (1)
- Our results showed for the first time that bi-temporal Pléiades images improve the discrimination between coniferous and broadleaf tree species, and the discrimination between the different broadleaf tree species.
- (2)
- Our findings also suggest that the combination of textural and spectral information is important for discriminating tree species, and that textural features extracted during in-leaf seasons may be sufficient to achieve good classification accuracy.
- (3)
- Object-based classification represents a powerful tool to study the ecological requirements of fauna, especially in urban areas. Remote sensing techniques using open-source software such as Orfeo ToolBox may be particularly useful for invasive species management but also for the conservation of native fauna by highlighting ecological preferences regarding their breeding and feeding areas.
Acknowledgments
Author Contributions
Conflicts of Interest
Appendix A

| Summer Pléiades Image | ||||||||
|---|---|---|---|---|---|---|---|---|
| Band 1 | ||||||||
| Energy | Entropy | Correlation | Inverse Difference Moment | Inertia | Cluster Shade | Cluster Prominence | Haralick Correlation | |
| Energy | 1.00 | −0.96 | 0.12 | 0.88 | −0.57 | −0.04 | −0.38 | −0.51 |
| Entropy | 1.00 | 0.22 | −0.95 | 0.72 | 0.06 | 0.52 | 0.68 | |
| Correlation | 1.00 | 0.40 | −0.41 | 0.05 | −0.12 | −0.04 | ||
| Inverse Difference Moment | 1.00 | −0.83 | 0.00 | −0.53 | −0.67 | |||
| Inertia | 1.00 | −0.05 | 0.71 | 0.66 | ||||
| Cluster Shade | 1.00 | −0.07 | −0.30 | |||||
| Cluster Prominence | 1.00 | 0.55 | ||||||
| Haralick Correlation | 1.00 | |||||||
| Band 2 | ||||||||
| Energy | Entropy | Correlation | Inverse Difference Moment | Inertia | Cluster Shade | Cluster Prominence | Haralick Correlation | |
| Energy | 1.00 | −0.96 | 0.12 | 0.88 | −0.57 | −0.04 | −0.38 | −0.51 |
| Entropy | 1.00 | −0.23 | −0.95 | 0.72 | 0.02 | 0.51 | 0.66 | |
| Correlation | 1.00 | 0.40 | −0.41 | 0.04 | −0.28 | −0.28 | ||
| Inverse Difference Moment | 1.00 | −0.83 | 0.00 | −0.53 | −0.67 | |||
| Inertia | 1.00 | −0.05 | 0.71 | 0.66 | ||||
| Cluster Shade | 1.00 | −0.08 | −0.31 | |||||
| Cluster Prominence | 1.00 | 0.59 | ||||||
| Band 3 | ||||||||
| Energy | Entropy | Correlation | Inverse Difference Moment | Inertia | Cluster Shade | Cluster Prominence | Haralick Correlation | |
| Energy | 1.00 | −0.97 | −0.07 | 0.89 | −0.61 | −0.07 | −0.40 | −0.53 |
| Entropy | 1.00 | −0.04 | −0.96 | 0.73 | 0.05 | 0.52 | 0.66 | |
| Correlation | 1.00 | 0.22 | −0.30 | 0.04 | −0.20 | −0.17 | ||
| Inverse Difference Moment | 1.00 | −0.84 | −0.04 | −0.55 | −0.67 | |||
| Inertia | 1.00 | −0.04 | 0.71 | 0.67 | ||||
| Cluster Shade | 1.00 | −0.09 | −0.30 | |||||
| Cluster Prominence | 1.00 | 0.58 | ||||||
| Band 4 | ||||||||
| Energy | Entropy | Correlation | Inverse Difference Moment | Inertia | Cluster Shade | Cluster Prominence | Haralick Correlation | |
| Energy | 1.00 | −0.99 | −0.46 | 0.96 | −0.77 | 0.05 | −0.57 | −0.78 |
| Entropy | 1.00 | 0.41 | −0.98 | 0.82 | −0.05 | 0.62 | 0.80 | |
| Correlation | 1.00 | −0.30 | 0.13 | −0.02 | 0.14 | 0.29 | ||
| Inverse Difference Moment | 1.00 | −0.90 | 0.05 | −0.64 | −0.80 | |||
| Inertia | 1.00 | −0.09 | 0.73 | 0.68 | ||||
| Cluster Shade | 1.00 | −0.09 | −0.27 | |||||
| Cluster Prominence | 1.00 | 0.55 | ||||||
References
- Wilcove, D.S.; Rothstein, D.; Dubow, J.; Phillips, A.; Losos, E. Quantifying Threats to Imperiled Species in the United States: Assessing the relative importance of habitat destruction, alien species, pollution, overexploitation, and disease. BioScience 1998, 48, 607–615. [Google Scholar] [CrossRef]
- Gurevitch, J.; Padilla, D.K. Are invasive species a major cause of extinctions? Trends Ecol. Evol. 2004, 19, 470–474. [Google Scholar] [CrossRef] [PubMed]
- Blackburn, T.M.; Pyšek, P.; Bacher, S.; Carlton, J.T.; Duncan, R.P.; Jarošík, V.; Wilson, J.R.U.; Richardson, D.M. A proposed unified framework for biological invasions. Trends Ecol. Evol. 2011, 26, 333–339. [Google Scholar] [CrossRef] [PubMed]
- Lockwood, J.L.; Cassey, P.; Blackburn, T. The role of propagule pressure in explaining species invasions. Trends Ecol. Evol. 2005, 20, 223–228. [Google Scholar] [CrossRef] [PubMed]
- Forshaw, J.M. Parrots of the World; Princeton University Press: Princeton, NJ, USA, 2010. [Google Scholar]
- Pârâu, L.G.; Strubbe, D.; Mori, E.; Menchetti, M.; Ancillotto, L.; van Kleunen, A.; White, R.L.; Luna, Á.; Hernández-Brito, D.; Le Louarn, M.; et al. Rose-ringed Parakeet Populations and Numbers in Europe: A Complete Overview. Open Ornithol. J. 2016, 9, 1–13. [Google Scholar] [CrossRef]
- Peck, H.L.; Pringle, H.E.; Marshall, H.H.; Owens, I.P.F.; Lord, A.M. Experimental evidence of impacts of an invasive parakeet on foraging behavior of native birds. Behav. Ecol. 2014, 25, 582–590. [Google Scholar] [CrossRef] [PubMed]
- Le Louarn, M.; Couillens, B.; Deschamps-Cottin, M.; Clergeau, P. Interference competition between an invasive parakeet and native bird species at feeding sites. J. Ethol. 2016, 34, 291–298. [Google Scholar] [CrossRef] [PubMed]
- Clergeau, P.; Vergnes, A. Bird feeders may sustain feral Rose-ringed parakeets Psittacula krameri in temperate Europe. Wildl. Biol. 2011, 17, 248–252. [Google Scholar] [CrossRef]
- Strubbe, D.; Matthysen, E.; Graham, C.H. Assessing the potential impact of invasive ring-necked parakeets Psittacula krameri on native nuthatches Sitta europeae in Belgium. J. Appl. Ecol. 2010, 47, 549–557. [Google Scholar] [CrossRef]
- Newton, I. Experiments on the limitation of bird breeding densities: A review. Ibis 1994, 136, 397–411. [Google Scholar] [CrossRef]
- Menchetti, M.; Mori, E.; Angelici, F.M. Effects of the Recent World Invasion by Ring-Necked Parakeets Psittacula krameri. In Problematic Wildlife; Angelici, F.M., Ed.; Springer International Publishing: Cham, Switzerland, 2016; pp. 253–266. [Google Scholar]
- Robertson, M.P.; Cumming, G.S.; Erasmus, B.F.N. Getting the most out of atlas data. Divers. Distrib. 2010, 16, 363–375. [Google Scholar] [CrossRef]
- Li, D.; Ke, Y.; Gong, H.; Chen, B.; Zhu, L. Tree species classification based on WorldView-2 imagery in complex urban environment. In Proceedings of the 2014 Third International Workshop on Earth Observation and Remote Sensing Applications (EORSA), Changsha, China, 11–14 June 2014; pp. 326–330. [Google Scholar]
- Zipper, S.C.; Schatz, J.; Singh, A.; Kucharik, C.J.; Townsend, P.A.; Loheide, S.P., II. Urban heat island impacts on plant phenology: Intra-urban variability and response to land cover. Environ. Res. Lett. 2016, 11, 054023. [Google Scholar] [CrossRef]
- Li, D.; Ke, Y.; Gong, H.; Li, X. Object-Based Urban Tree Species Classification Using Bi-Temporal WorldView-2 and WorldView-3 Images. Remote Sens. 2015, 7, 16917–16937. [Google Scholar] [CrossRef]
- Tigges, J.; Lakes, T.; Hostert, P. Urban vegetation classification: Benefits of multitemporal RapidEye satellite data. Remote Sens. Environ. 2013, 136, 66–75. [Google Scholar] [CrossRef]
- Dalponte, M.; Ørka, H.O.; Ene, L.T.; Gobakken, T.; Næsset, E. Tree crown delineation and tree species classification in boreal forests using hyperspectral and ALS data. Remote Sens. Environ. 2014, 140, 306–317. [Google Scholar] [CrossRef]
- MacLean, M.G.; Congalton, R.G. Map accuracy assessment issues when using an object-oriented approach. In Proceedings of the American Society for Photogrammetry and Remote Sensing 2012 Annual Conference, Sacramento, CA, USA, 19–23 March 2012; pp. 1–5. [Google Scholar]
- Blaschke, T.; Strobl, J. What’s wrong with pixels? Some recent developments interfacing remote sensing and GIS. Geo-Inf. Syst. 2002, 14, 12–17. [Google Scholar]
- Van Aardt, J.A.N.; Wynne, R.H. Examining pine spectral separability using hyperspectral data from an airborne sensor: An extension of field-based results. Int. J. Remote Sens. 2007, 28, 431–436. [Google Scholar] [CrossRef]
- Voss, M.; Sugumaran, R. Seasonal Effect on Tree Species Classification in an Urban Environment Using Hyperspectral Data, LiDAR, and an Object-Oriented Approach. Sensors 2008, 8, 3020–3036. [Google Scholar] [CrossRef] [PubMed]
- Aschmann, H. Distribution and Peculiarity of Mediterranean Ecosystems. In Mediterranean Type Ecosystems; di Castri, F., Mooney, H.A., Eds.; Springer: Berlin/Heidelberg, Germany, 1973; pp. 11–19. [Google Scholar]
- Roncayolo, W. Les grammaires d’une ville. Essai sur la genèse des structures urbaines à Marseille. Ann. Hist. Sci. Soc. 1997, 52, 1195–1198. [Google Scholar]
- Christophe, E.; Inglada, J.; Giros, A. Orfeo toolbox: A complete solution for mapping from high resolution satellite images. Int. Arch. Photogramm. Remote Sens. Spat. Inf. Sci. 2008, 37, 1263–1268. [Google Scholar]
- Fukunaga, K.; Hostetler, L. The estimation of the gradient of a density function, with applications in pattern recognition. IEEE Trans. Inf. Theory 1975, 21, 32–40. [Google Scholar] [CrossRef]
- Comaniciu, D.; Meer, P. Mean Shift: A Robust Approach toward Feature Space Analysis. IEEE Trans. Pattern Anal. Mach. Intell. 2002, 24, 603–619. [Google Scholar] [CrossRef]
- Michel, J.; Youssefi, D.; Grizonnet, M. Stable Mean-Shift Algorithm and Its Application to the Segmentation of Arbitrarily Large Remote Sensing Images. IEEE Trans. Geosci. Remote Sens. 2015, 53, 952–964. [Google Scholar] [CrossRef]
- Hoover, A.; Jean-Baptiste, G.; Jiang, X.; Flynn, P.J.; Bunke, H.; Goldgof, D.B.; Bowyer, K.; Eggert, D.W.; Fitzgibbon, A.; Fisher, R.B. An Experimental Comparison of Range Image Segmentation Algorithms. IEEE Trans. Pattern Anal. Mach. Intell. 1996, 18, 673–689. [Google Scholar] [CrossRef]
- Jiang, X.; Marti, C.; Irniger, C.; Bunke, H. Distance Measures for Image Segmentation Evaluation. EURASIP J. Appl. Signal Process. 2006, 209. [Google Scholar] [CrossRef]
- Ruiz, L.A.; Fdez-sarría, A.; Recio, J.A. Texture feature extraction for classification of remote sensing data using wavelet decomposition: A comparative study. Int. Arch. Photogramm. Remote Sens. 2004, XXXV, 1682–1750. [Google Scholar]
- Agüera, F.; Aguilar, F.J.; Aguilar, M.A. Using texture analysis to improve per-pixel classification of very high resolution images for mapping plastic greenhouses. ISPRS J. Photogramm. Remote Sens. 2008, 63, 635–646. [Google Scholar] [CrossRef]
- Puissant, A.; Hirsch, J.; Weber, C. The utility of texture analysis to improve per-pixel classification for high to very high spatial resolution imagery. Int. J. Remote Sens. 2005, 26, 733–745. [Google Scholar] [CrossRef]
- Chiu, W.Y.; Couloigner, I. Evaluation of incorporating texture into wetland mapping from multispectral images. EARSeL EProc. 2004, 3, 363–371. [Google Scholar]
- Myint, S.W.; Gober, P.; Brazel, A.; Grossman-Clarke, S.; Weng, Q. Per-pixel vs. object-based classification of urban land cover extraction using high spatial resolution imagery. Remote Sens. Environ. 2011, 115, 1145–1161. [Google Scholar] [CrossRef]
- Tsai, F.; Chou, M.-J. Texture augmented analysis of high resolution satellite imagery in detecting invasive plant species. J. Chin. Inst. Eng. 2006, 29, 581–592. [Google Scholar] [CrossRef]
- Haralick, R.M.; Shanmugam, K.; Dinstein, I. Textural Features for Image Classification. IEEE Trans. Syst. Man Cybern. 1973, SMC-3, 610–621. [Google Scholar] [CrossRef]
- Chen, D.; Stow, D.A.; Gong, P. Examining the effect of spatial resolution and texture window size on classification accuracy: An urban environment case. Int. J. Remote Sens. 2004, 25, 2177–2192. [Google Scholar] [CrossRef]
- Franklin, S.E.; Hall, R.J.; Moskal, L.M.; Maudie, A.J.; Lavigne, M.B. Incorporating texture into classification of forest species composition from airborne multispectral images. Int. J. Remote Sens. 2000, 21, 61–79. [Google Scholar] [CrossRef]
- Hall-Beyer, M. GLCM Texture Tutorial. Available online: http://www.fp.ucalgary.ca/mhallbey/tutorial.htm (accessed on 24 May 2017).
- Mountrakis, G.; Im, J.; Ogole, C. Support vector machines in remote sensing: A review. ISPRS J. Photogramm. Remote Sens. 2011, 66, 247–259. [Google Scholar] [CrossRef]
- Belgiu, M.; Drăguţ, L. Random forest in remote sensing: A review of applications and future directions. ISPRS J. Photogramm. Remote Sens. 2016, 114, 24–31. [Google Scholar] [CrossRef]
- Immitzer, M.; Atzberger, C.; Koukal, T. Tree Species Classification with Random Forest Using Very High Spatial Resolution 8-Band WorldView-2 Satellite Data. Remote Sens. 2012, 4, 2661–2693. [Google Scholar] [CrossRef]
- Cortes, C.; Vapnik, V. Support-Vector Networks. Mach. Learn. 1995, 20, 273–297. [Google Scholar] [CrossRef]
- Heumann, B.W. An Object-Based Classification of Mangroves Using a Hybrid Decision Tree—Support Vector Machine Approach. Remote Sens. 2011, 3, 2440–2460. [Google Scholar] [CrossRef]
- Kavzoglu, T.; Colkesen, I. A kernel functions analysis for support vector machines for land cover classification. Int. J. Appl. Earth Obs. Geoinf. 2009, 11, 352–359. [Google Scholar] [CrossRef]
- Liaw, A.; Wiener, M. Classification and regression by randomForest. R News 2002, 2, 18–22. [Google Scholar]
- Meyer, D.; Dimitriadou, E.; Hornik, K.; Weingessel, A.; Leisch, F. e1071: Misc Functions of the Department of Statistics, Probability Theory Group (Formerly: E1071), TU Wien; [R Package e1071 Version 1.6-7]. Comprehensive R Archive Network (CRAN); 2017. Available online: https://CRAN.R-project.org/package=e1071 (accessed on 1 March 2017).
- Rodriguez, J.D.; Perez, A.; Lozano, J.A. Sensitivity Analysis of k-Fold Cross Validation in Prediction Error Estimation. IEEE Trans. Pattern Anal. Mach. Intell. 2010, 32, 569–575. [Google Scholar] [CrossRef] [PubMed]
- Landis, J.R.; Koch, G.G. The measurement of observer agreement for categorical data. Biometrics 1977, 33, 159–174. [Google Scholar] [CrossRef] [PubMed]
- Foody, G.M. Thematic map comparison: Evaluating the statistical significance of differences in classification accuracy. Photogramm. Eng. Remote Sens. 2004, 70, 627–633. [Google Scholar] [CrossRef]
- Roberts, D.A.; Ustin, S.L.; Ogunjemiyo, S.; Greenberg, J.; Dobrowski, S.Z.; Chen, J.; Hinckley, T.M. Spectral and Structural Measures of Northwest Forest Vegetation at Leaf to Landscape Scales. Ecosystems 2004, 7, 545–562. [Google Scholar] [CrossRef]
- Ng, W.-T.; Rima, P.; Einzmann, K.; Immitzer, M.; Atzberger, C.; Eckert, S. Assessing the Potential of Sentinel-2 and Pléiades Data for the Detection of Prosopis and Vachellia spp. in Kenya. Remote Sens. 2017, 9, 74. [Google Scholar] [CrossRef]
- Pu, R.; Liu, D. Segmented canonical discriminant analysis of in situ hyperspectral data for identifying 13 urban tree species. Int. J. Remote Sens. 2011, 32, 2207–2226. [Google Scholar] [CrossRef]
- Sheeren, D.; Fauvel, M.; Josipovic, V.; Lopes, M.; Planque, C.; Willm, J.; Dejoux, J.-F. Tree species classification in temperate forests using formosat-2 satellite image time series. Remote Sens. 2016, 8, 734. [Google Scholar] [CrossRef]
- Eckert, S. Improved Forest Biomass and Carbon Estimations Using Texture Measures from WorldView-2 Satellite Data. Remote Sens. 2012, 4, 810–829. [Google Scholar] [CrossRef]
- Pal, M. Random forest classifier for remote sensing classification. Int. J. Remote Sens. 2005, 26, 217–222. [Google Scholar] [CrossRef]
- Czajka, C.; Braun, M.P.; Wink, M. Resource Use by Non-Native Ring-Necked Parakeets (Psittacula krameri) and Native Starlings (Sturnus vulgaris) in Central Europe. Open Ornithol. J. 2011, 4, 17–22. [Google Scholar] [CrossRef]
- Wegener, S. Verbreitung und Arealnutzung der Halsbandsittiche (Psittacula krameri) in Heidelberg. Ornithologische Gesellschaft Baden-Württember 2007, 23, 39–55. [Google Scholar]
- Clergeau, P.; Vergnes, A.; Delanoue, R. La perruche à collier Psittacula krameri introduite en Ile-de-France: Distribution et régime alimentaire. Alauda 2009, 7, 121–132. [Google Scholar]
- Hernández-Brito, D.; Carrete, M.; Popa-Lisseanu, A.G.; Ibáñez, C.; Tella, J.L. Crowding in the City: Losing and Winning Competitors of an Invasive Bird. PLoS ONE 2014, 9, e100593. [Google Scholar] [CrossRef]
- Franklin, S.E.; Wulder, M.A.; Gerylo, G.R. Texture analysis of IKONOS panchromatic data for Douglas-fir forest age class separability in British Columbia. Int. J. Remote Sens. 2001, 22, 2627–2632. [Google Scholar] [CrossRef]
- He, K.S.; Bradley, B.A.; Cord, A.F.; Rocchini, D.; Tuanmu, M.-N.; Schmidtlein, S.; Turner, W.; Wegmann, M.; Pettorelli, N. Will remote sensing shape the next generation of species distribution models? Remote Sens. Ecol. Conserv. 2015, 1, 4–18. [Google Scholar] [CrossRef]


| Title 1 | Pléiades 1 28 July 2015 | Pléiades 2 24 March 2016 |
|---|---|---|
| PAN-MS resolution (m) | 0.5–2 | 0.5–2 |
| Panchromatic | 470–830 nm | 470–830 nm |
| Blue (B) | 430–550 nm | 430–550 nm |
| Green (G) | 500–620 nm | 500–620 nm |
| Red (R) | 590–710 nm | 590–710 nm |
| Near infra-red (NIR) | 740–940 nm | 740–940 nm |
| Solar azimuth | 144 | 156 |
| Solar elevation | 62 | 46 |
| Classes | Number of Polygons | Number of Pixels |
|---|---|---|
| Platanus sp. | 101 | 4520 |
| Tilia sp. | 644 | 3095 |
| Celtis sp. | 1032 | 5282 |
| Quercus sp. | 233 | 1544 |
| Coniferous trees | 479 | 7452 |
| Other broadleaf species | 281 | 9548 |
| Feature Name | Description | Pléiades Image |
|---|---|---|
| Mean1–4 | Mean of spectral bands 1–4 | Spring and summer |
| Var1–4 | Variance of spectral bands 1–4 | Spring and summer |
| NDVI | Normalized Difference Vegetation Index NIR–R/NIR + R | Spring and summer |
| Entropy (entro1–4) | Measure of the randomness of the intensity distribution of spectral bands 1–4 −∑i,jg(i,j)log2g(i,j), or 0 if g(i,j) = 0 | Summer |
| Correlation (cor1–4) | Linear dependency of grey level values in the co-occurrence matrix of spectral bands 1–4 ∑i,jg(i,j)(i − µx)(j − µy)/σxσy | Summer |
| Cluster Shade (clusha1–4) | Measure of the skewness of spectral bands 1–4 ∑i,j((i − μ) + (j − μ))3g(i,j) | Summer |
| Cluster Prominence (clupro1–4) | Measure of the asymmetry of spectral bands 1–4 ∑i,j((i − μ) + (j − μ))4g(i,j) | Summer |
| Haralick Correlation (harcor1–3) | Measure of correlation of spectral bands 1–3 ∑i,j(i,j)g(i,j) − µ2t/σ2t | Summer |
| Dissimilarity (dis1–4) | Spectral bands 1–4 ∑i,j(i − j)g(i,j)2 | Summer |
| Information Measure of Correlation 1 (IC1–4) | Spectral bands 1–4 Hxy − Hxy1/max(Hx,Hy) | Summer |
| Sum Variance (SVar1–4) | Spectral band 4 (k − Hx+y)gi+j(k) | Summer |
| PCA1 | Mean of the first component from Principal Component Analysis | Spring and summer |
| SVM | RF | |||
|---|---|---|---|---|
| OA (%) | Kappa | OA (%) | Kappa | |
| Single-date (using Spring Pléiades image) | 64.1 | 0.53 | 65.3 | 0.55 |
| Bi-temporal Pléiades images | 75.6 | 0.65 | 79.2 | 0.72 |
| Mean Decrease Accuracy | |||
|---|---|---|---|
| Features | Single-Date | Features | Bi-Temporal |
| Summer_IC3 | 25.1 | Summer_IC1 | 24.9 |
| Summer_Mean3 | 24.3 | Spring_Mean4 | 22.8 |
| Summer_Mean4 | 23.4 | Summer_IC3 | 18.9 |
| Summer_IC1 | 21.9 | Spring_Mean3 | 18.5 |
| Summer_Cor4 | 20.4 | Summer_IC2 | 18.4 |
| Summer_Cor1 | 19.8 | Summer_Cor4 | 18.1 |
| Summer_Entro2 | 19.7 | Summer_Cor1 | 17.9 |
| Summer_Dis4 | 18.7 | Summer_ PCA1 | 17.8 |
| Summer_SVar4 | 18.6 | Spring_Var4 | 17.8 |
| Summer_Clupro4 | 18.4 | Spring_SVar4 | 17.5 |
| F-Score (%) | |||
|---|---|---|---|
| Features | Single-Date | Features | Bi-Temporal |
| Summer_Cor2 | 79.1 | Summer_Entro2 | 77.9 |
| Summer_Mean3 | 53.4 | Summer_Cor1 | 50.4 |
| Summer_Entro2 | 48.5 | Summer_Dis3 | 42.9 |
| Summer_IC3 | 42.4 | Summer_IC4 | 39.4 |
| Summer_Cor3 | 42.3 | Summer_Dis2 | 38.9 |
| Summer_Cor1 | 37.4 | Summer_IC3 | 35.7 |
| Summer_Dis2 | 36.1 | Summer_Cor2 | 35.4 |
| Summer_Mean1 | 32.4 | Summer_Entro4 | 34.8 |
| Summer_NDVI | 32.1 | Spring_Var4 | 31.4 |
| Summer_Var4 | 28.9 | Spring_Mean3 | 31.2 |
| Single-Date Classification | ||||||||
| Reference Data | ||||||||
| Classified as | Platanus sp. | Tilia sp. | Celtis sp. | Quercus sp. | Coniferous Species | Other Broadleaf Species | Σ | UA (%) |
| Platanus sp. | 82 | 21 | 5 | 0 | 0 | 37 | 145 | 56.5 |
| Tilia sp. | 15 | 561 | 404 | 127 | 0 | 132 | 1239 | 45.3 |
| Celtis sp. | 4 | 38 | 598 | 40 | 0 | 4 | 684 | 87.4 |
| Quercus sp. | 0 | 0 | 0 | 65 | 0 | 0 | 65 | 100 |
| Coniferous species | 0 | 0 | 0 | 0 | 395 | 0 | 395 | 100 |
| Other broadleaf species | 0 | 24 | 25 | 1 | 84 | 108 | 242 | 44.6 |
| Σ | 101 | 644 | 1032 | 233 | 479 | 281 | 2770 | |
| PA(%) | 81.2 | 87.1 | 57.9 | 27.9 | 82.5 | 38.4 | 65.3 | |
| Kappa | 0.55 | |||||||
| Bi-Temporal Classification | ||||||||
| Reference Data | ||||||||
| Classified as | Platanus sp. | Tilia sp. | Celtis sp. | Quercus sp. | Coniferous Species | Other Broadleaf Species | Σ | UA (%) |
| Platanus sp. | 83 | 7 | 35 | 0 | 0 | 26 | 151 | 54.9 |
| Tilia sp. | 18 | 606 | 164 | 120 | 0 | 125 | 1033 | 58.7 |
| Celtis sp. | 0 | 15 | 819 | 32 | 0 | 0 | 866 | 94.6 |
| Quercus sp. | 0 | 0 | 0 | 78 | 0 | 0 | 78 | 100 |
| Coniferous species | 0 | 0 | 0 | 0 | 479 | 0 | 479 | 100 |
| Other broadleaf species | 0 | 16 | 14 | 3 | 0 | 130 | 163 | 79.7 |
| Σ | 101 | 644 | 1032 | 233 | 479 | 281 | 2770 | |
| PA (%) | 82.2 | 94.1 | 79.4 | 33.5 | 100 | 46.3 | 79.2 | |
| Kappa | 0.72 | |||||||
| McNemar’s test significance | NS | *** | *** | NS | *** | ** | *** | |
| Number of Ring-Necked Parakeets Nests | Proportion (%) | |
|---|---|---|
| Platanus sp. | 1738 | 95 |
| Tilia sp. | 27 | 1.5 |
| Celtis sp. | 0 | 0 |
| Quercus sp. | 37 | 2 |
| Coniferous trees | 0 | 0 |
| Other broadleaf trees | 18 | 1 |
| Other | 10 | 0.50 |
| Total | 1830 | 100 |
© 2017 by the authors. Licensee MDPI, Basel, Switzerland. This article is an open access article distributed under the terms and conditions of the Creative Commons Attribution (CC BY) license (http://creativecommons.org/licenses/by/4.0/).
Share and Cite
Le Louarn, M.; Clergeau, P.; Briche, E.; Deschamps-Cottin, M. “Kill Two Birds with One Stone”: Urban Tree Species Classification Using Bi-Temporal Pléiades Images to Study Nesting Preferences of an Invasive Bird. Remote Sens. 2017, 9, 916. https://doi.org/10.3390/rs9090916
Le Louarn M, Clergeau P, Briche E, Deschamps-Cottin M. “Kill Two Birds with One Stone”: Urban Tree Species Classification Using Bi-Temporal Pléiades Images to Study Nesting Preferences of an Invasive Bird. Remote Sensing. 2017; 9(9):916. https://doi.org/10.3390/rs9090916
Chicago/Turabian StyleLe Louarn, Marine, Philippe Clergeau, Elodie Briche, and Magali Deschamps-Cottin. 2017. "“Kill Two Birds with One Stone”: Urban Tree Species Classification Using Bi-Temporal Pléiades Images to Study Nesting Preferences of an Invasive Bird" Remote Sensing 9, no. 9: 916. https://doi.org/10.3390/rs9090916