
A Simple Normalized Difference Approach to Burnt Area Mapping Using Multi-Polarisation C-Band SAR


1
CSIR Meraka Institute, Pretoria 0001, South Africa
2
Department of Geography & Environmental Studies, Stellenbosch University, Stellenbosch 7600, South Africa
*
Author to whom correspondence should be addressed.
Remote Sens. 2017, 9(8), 764; https://doi.org/10.3390/rs9080764
Submission received: 12 June 2017
/
Revised: 7 July 2017
/
Accepted: 19 July 2017
/
Published: 31 July 2017
(This article belongs to the Special Issue Remote Sensing of Wildfire)
Abstract
:In fire-prone ecosystems, periodic fires are vital for ecosystem functioning. Fire managers seek to promote the optimal fire regime by managing fire season and frequency requiring detailed information on the extent and date of previous burns. This paper investigates a Normalised Difference α-Angle (NDαI) approach to burn-scar mapping using C-band data. Polarimetric decompositions are used to derive α-angles from pre-burn and post-burn scenes and NDαI is calculated to identify decreases in vegetation between the scenes. The technique was tested in an area affected by a wildfire in January 2016 in the Western Cape, South Africa. The quad-pol H-A-α decomposition was applied to RADARSAT-2 data and the dual-pol H-α decomposition was applied to Sentinel-1A data. The NDαI results were compared to a burn scar extracted from Sentinel-2A data. High overall accuracies of 97.4% (Kappa = 0.72) and 94.8% (Kappa = 0.57) were obtained for RADARSAT-2 and Sentinel-1A, respectively. However, large omission errors were found and correlated strongly with areas of high local incidence angle for both datasets. The combined use of data from different orbits will likely reduce these errors. Furthermore, commission errors were observed, most notably on Sentinel-1A results. These errors may be due to the inability of the dual-pol H-α decomposition to effectively distinguish between scattering mechanisms. Despite these errors, the results revealed that burnt areas could be extracted and were in good agreement with the results from Sentinel-2A. Therefore, the approach can be considered in areas where persistent cloud cover or smoke prevents the extraction of burnt area information using conventional multispectral approaches.

1. Introduction
The effects of wildfires are severe and can include damage to infrastructure and the environment [1,2] as well as contributing to land degradation and affecting global warming due to an increase in CO2 emissions [3,4,5,6,7,8]. Although fires can be disastrous events with significant impacts on infrastructure and the environment, in many ecosystems, periodic fires are vital for ecosystem functioning and keeping vegetation species in a healthy condition. In these ecosystems, periodic fires stimulate species diversity, controlling age and influencing nutrient cycles [4]. In fact, without fires, many species cannot persist [9]. An example is the fynbos and renosterveld ecosystems, endemic to the Cape Floristic Region in South Africa’s Western Cape Province. Without fires, the individual plant species would die and be replaced by thicket and forest species [9]. To minimise the adverse impact of fires whilst conserving biodiversity, the key ecological aspects of fire management include: (1) fire frequency; (2) fire season and intensity; and (3) fire size [6,7,9,10,11]. In terms of fire frequency, all non-sprouting plants should have a chance to produce sufficient seed before the next burn. Therefore, fires should not occur too frequently nor too infrequently or even in the wrong season, since it could have devastating impacts on both plant and animal species in the ecosystem. For this reason, fire management practices in the region include the active management of fire recurrence intervals.
In areas where active fire management is required to conserve biodiversity, an accurate description of burnt areas over time and space is required. Specifically, the ability to derive burnt area information using a time-series of data can provide information on veld ages. Veld age maps can be used to identify vegetation stands that should be protected from fires, including immature plants that have not had the opportunity to produce seeds [9]. Additionally, stands that are due for burning can also be identified. An assessment of burnt area can also be useful for a variety of other applications and can contribute to risk management systems [2]. Burnt area assessments can assist in the investigation of trends and patterns of fire occurrence as well as in analysing the drivers of fire events [12]. This information can be used to project potential future patterns of fires with the aim of risk mitigation. Furthermore, an assessment of the burnt area can also assist disaster managers to identify affected areas for disaster recovery and disaster relief.
Due to the importance of fire management in ecologically sensitive regions as well as for risk mitigation, systems have been developed for fire prediction, active fire monitoring, and post-fire damage assessment [4]. Although field observations are considered a vital source of information for these systems, the size of affected areas are potentially large and affected areas are frequently in remote locations. This means that field observations can, in cases, be insufficient in terms of accuracy and coverage to provide reliable data for fire management practices [10]. To address these challenges, considerable amounts of research have been devoted to the extraction of fire-related information from remote sensing data.
Remote sensing data can provide valuable information for fire managers including indicators of (1) vegetation status; (2) active fire detection; and (3) burnt areas assessment [10,13,14]. The synoptic view provided by satellite data, as well as repeat observations make satellite sensors the only viable way to operationally monitor large or remote areas. Conventionally, optical and multispectral data have been widely used for fire monitoring and burn scar mapping [6,9,15]. However, data acquisition is often limited by the presence of cloud or smoke in actively burning regions. To overcome this limitation, synthetic aperture radar (SAR) data has been used to compliment the extraction of burnt area investigations from multispectral data [1,2,4,16,17,18].
This paper further explores the feasibility of using multi-temporal multiple-polarisation C-band SAR data for extracting burnt areas in a fynbos region in the Western Cape Province of South Africa. A new, multi-temporal approach to burn scar identification using polarimetric decomposition on quad-pol and dual-pol SAR scenes is introduced. An overview of the principles of SAR data for burnt area identification is provided in Section 2 and the Normalised Difference α Index (NDαI) is formulated in Section 3. An introduction to the study area and the data acquired is provided in Section 4. The results of the burnt area mapping from SAR data are provided and discussed in Section 5. Some observations and relevant conclusions are provided in Section 6.
2. The Potential for SAR Data Analysis for Burn-Scar Detection
Several studies have investigated multispectral data sources for their ability to map burnt areas in various environments [3,10,14,19]. Using a time-series of investigations, these products have been found useful for the compilation of date-of-burn maps to estimate fire season as well as for the estimation of fire recurrence period. Furthermore, the extent and season of the fire could be used to derive indicators of fire intensity [10]. Although the maturity of algorithms to derive burnt area from multispectral data has reached a level where it is operationally used in various fire management systems [10], data acquisition is frequently affected by the presence of cloud cover or smoke plumes in actively burning areas [3,5]. Furthermore, spectral overlaps between burnt areas and shadows, water bodies and unburnt canopies as well as vegetation regrowth in previously burnt areas can cause difficulties in discriminating between burnt and unburnt areas [5]. Therefore, burnt area mapping algorithms are generally focused on areas with uniform topography and vegetation characteristics [5].
To overcome the limitations of relying solely on multispectral data for burnt area detection, the use of SAR data for the mapping of burnt areas has also been considered [1,2,4,17]. This is because SAR data are unaffected by cloud and smoke cover at the time of data acquisition, allowing for the extraction of information in these conditions [1,3]. SAR is therefore considered to be complementary to multispectral data for burnt area mapping [1]. The potential of using SAR for the mapping of burnt areas lies in the sensitivity of SAR backscatter to vegetation structure and biomass. In particular, the removal of leaves and branches of vegetation due to fire would lead to a change in SAR backscatter [19]. Studies on the use of SAR data for burnt area detection generally rely on the analysis of SAR backscatter at various polarisations and its variation between burnt and unburnt areas [1,2,5] using single-pass [1,5] or multi-temporal analysis [3] approaches. In general, SAR backscatter was found to be affected by many factors including moisture conditions, surface roughness and biomass [4]. Under different conditions, SAR backscatter was found to exhibit either an increase or decrease associated with burnt conditions depending on the region under investigation, the incidence angle of the sensor and the surface conditions [5,19]. Therefore, the identification of burnt areas using a universal backscatter-based algorithm would be complicated. In other cases, the backscatter difference between burnt and unburnt land-cover classes were insufficient to identify burnt areas with a high degree of confidence [5]. Another challenge for burnt area extraction using SAR data is that SAR change detection is generally considered to be a challenging task due to SAR speckle effects, complex textures and a general heterogeneous appearance [19,20,21]. To address these challenges, region-based and object-orientated approaches based on image segmentation have been found to deal with speckle effectively [19,20,21,22]. In one investigation using ALOS PALSAR data, a normalised difference backscatter index approach was tested where the results were used as input into an image segmentation and object-based classification approach to discriminate between burnt and unburnt areas [19]. The segmentation and classification of objects, rather than single pixels, were found to effectively deal with speckle effects. However, misclassifications remained present due to similar temporal variations in SAR backscatter being observed for unburnt, un-vegetated or low-vegetation (such as grassland and agriculture) and burnt areas [19].
With the increase in the availability of multiple-polarisation SAR data, several investigations have also considered SAR polarimetry for its potential contribution to burnt area investigations [16]. The field of SAR polarimetry investigates the backscatter behaviour of surfaces using multiple-polarisation data [23]. The SAR backscatter in different polarisations is sensitive to the shape, orientation and dielectric properties of scattering elements [24]. This sensitivity allows for the identification and separation of scattering mechanisms by investigating the differences in polarimetric signatures [24,25,26,27]. Several coherent and incoherent scattering target decomposition theorems have been developed with the objective to extract information about scattering behaviour from volumes and surfaces allowing the description of ground/volume scattering scenarios [21,28,29]. The interaction of the various scattering mechanisms with different polarisations implies that polarimetric image analysis can provide information on the dominant scattering mechanisms observed in a resolution cell (i.e., surface scattering from the ground or volume scattering from a vegetation canopy, etc.). Furthermore, a time series approach can be included to extract information on the evolution of the dominant scattering mechanisms over time.
One of the commonly used polarimetric decompositions for the description of natural surfaces is the H-A-α (Cloude–Pottier) decomposition [26,28,30]. When fully polarimetric data are used, the H-A-α decomposition calculates three parameters: (1) polarimetric entropy (H); (2) polarimetric anisotropy (A); and (3) the alpha angle (α) [17,27,28]. The α-angle provides an indication of the dominant scattering mechanism with α = 0° indicating single-bounce surface scattering produced by a rough surface, α = 45° indicates volume scattering and α = 90° indicates dihedral reflector or multiple scattering [31]. Therefore, the α-angle can be exploited to extract information on dominant scattering mechanisms in vegetated areas. Although the H-A-α decomposition is generally applied to quad-polarisation data, a modified H-A-α decomposition has also been developed for dual-polarisation data [26,32,33].
Due to the sensitivity to scattering mechanisms, the polarimetric decomposition approaches have been considered for its ability to detect burnt areas and to derive indicators of burn severity [16]. It was observed that, for burnt areas, the α-angle derived from quad-pol C-band data was less than 45° due to the lower contribution of volume scatterers in burnt areas compared to unburnt areas [16]. It was noted, however, that low α-angle would also be expected in areas that were associated with low-vegetation densities or areas that were bare before the burn [16].
An analysis of the polarimetric behaviours of burnt versus unburnt areas was performed in two test sites in Canada and China [17]. Both the H-A-α decomposition and the Freeman–Durden three-component decomposition was applied. The analysis revealed that, while forested areas exhibited strong volume scattering contributions, fire scars showed relatively strong surface scattering contributions together with mixed volume and double-bounce scattering. This provided the ability to extract fire scar areas with an overall accuracy of 85% compared to a reference classification provided by SPOT-5 data. The results suggested that the quad-pol RADARSAT-2 data provided complementary information to multispectral data for burnt area mapping. However, it was observed that both clear-cut and exposed land showed strong surface scattering contributions creating potential for confusion.
Although the polarimetric decomposition approaches have been found to reduce the uncertainty associated with analysing SAR backscatter intensity alone [11,12], the presence of clear-cut or previously bare surfaces also contributed to low α-angles causing a potential avenue for confusion. To address these challenges, we propose a multi-temporal approach to burn scar extraction using polarimetric decompositions. The approach adopted is outlined in Section 3.
3. The Normalised Difference Alpha-Angle Index for Burn Scar Identification
Due to the success achieved in mapping burnt areas using polarimetric decompositions, we propose a technique for mapping burnt areas using polarimetric decomposition while minimizing the potential for identifying previously bare areas as burnt areas. The approach relies on the acquisition of two multiple-polarisation SAR scenes with one scene acquired before the burn, and one scene acquired shortly after the burn. In the case of quad-pol data, the scenes are subject to the H-A-α decomposition [28]. The resulting α-angle provides an indication of scattering mechanism with α-angles of lower than 40° being associated with a higher contribution by surface scatterers [16], and α-angles of between 40° and 50° being associated with volume scattering mechanisms. The modified dual-polarisation H-α decomposition [32], is used for dual-polarisation scenes.
To exploit the reduction in the contribution of volume scatterers associated with the removal of vegetation after a burn, a Normalised Difference Index approach, similar to the approach adopted in [19], was used with the exception that α-angle rather than SAR backscatter was considered. The Normalised Difference α-Angle Index (NDαI) was formularised as:
where is the α-angle associated with the image captured before the burn and is the α-angle after the burn. The resulting NDαI is designed to exhibit values between −1 and 1 with NDαI > 1 being associated with a decrease in α-angles between the pre-burn image and the post-burn image. A simple threshold-based image segmentation approach can then be used to extract the extent of the burn scar while minimising the impact of SAR speckle on the results.
Since the algorithm exploits both a pre-burn image as well as a post-burn image, it is believed that this approach would minimize the inclusion of previously bare areas in the burnt area assessment. Furthermore, since the α-angle extracted from the polarimetric decompositions exploits only the phase of the SAR signal, different moisture conditions at the time of data acquisition would not affect the ability to differentiate between burnt and unburnt areas. Therefore, the approach is expected to be more generally applicable compared to backscatter-based attempts.
4. Test Site, Data Acquisition and Processing
4.1. Introduction to the Test Site
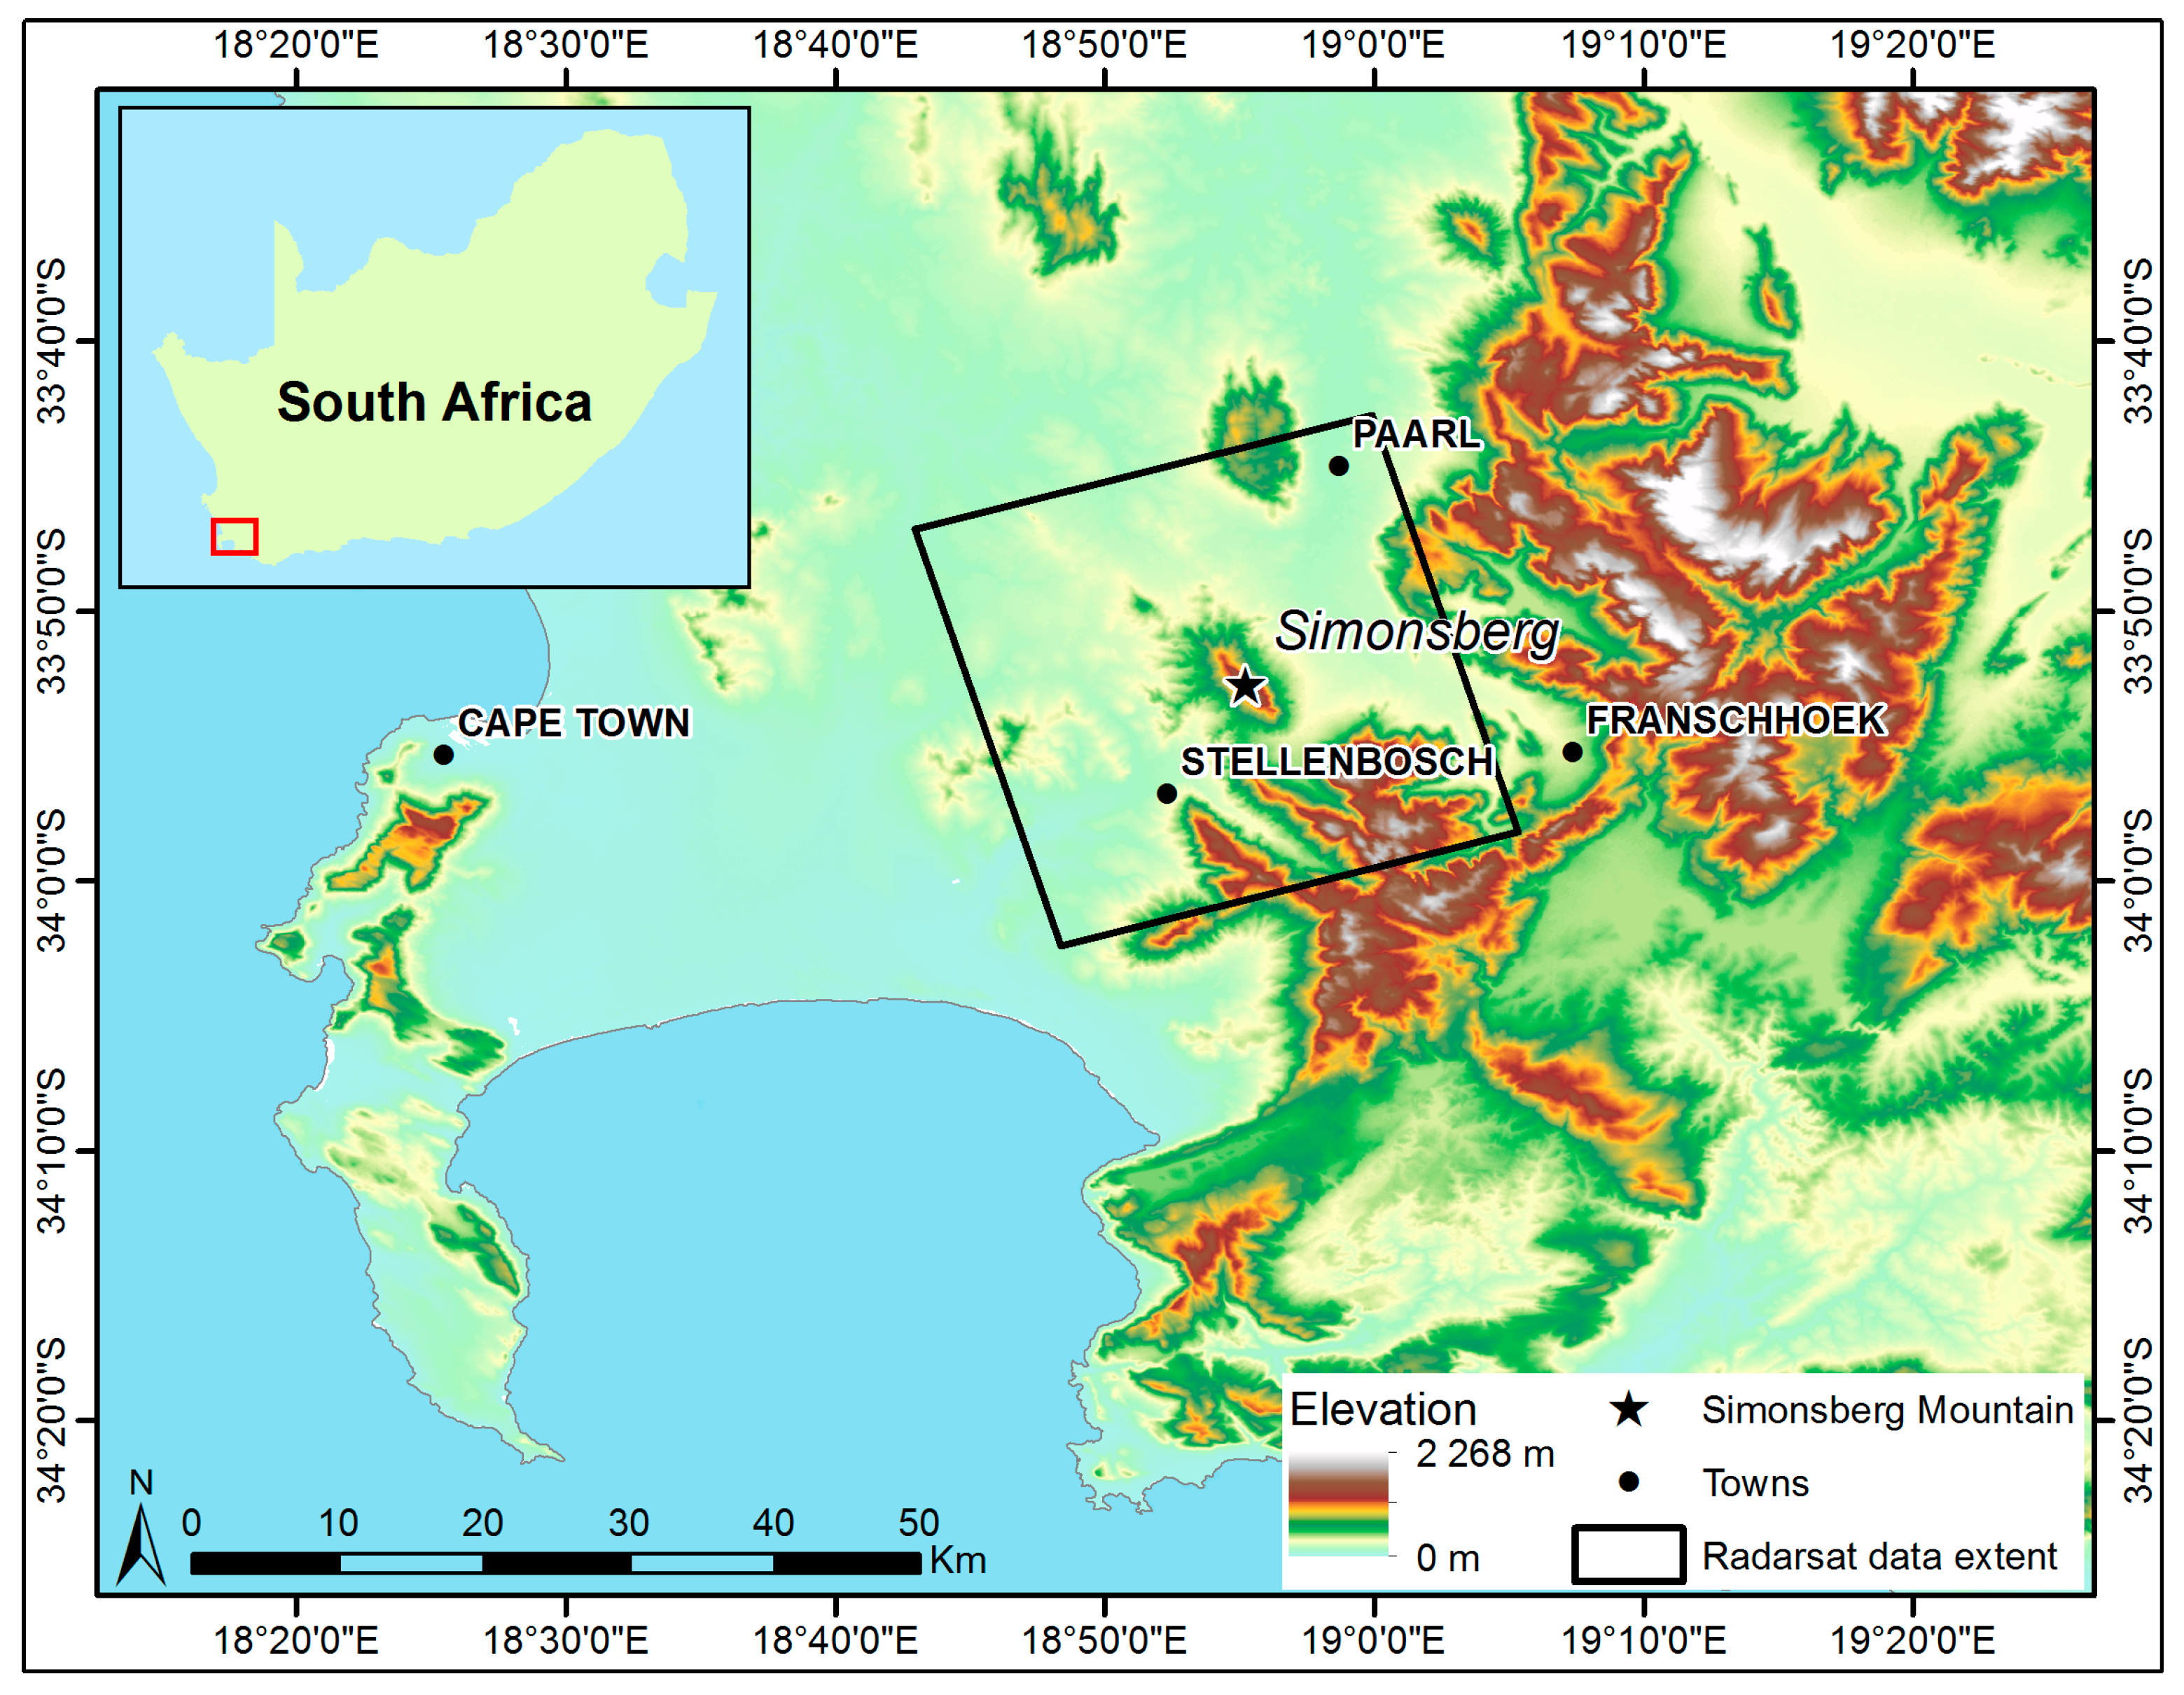
To test the ability of the NDαI to identify burnt areas and thereby contribute to operational fire monitoring systems, the algorithm was tested in an area located near Simonsberg Mountain, situated between the towns of Stellenbosch and Paarl in the Western Cape Province of South Africa (Figure 1). Simonsberg Mountain is 1399 m high at the peak with slopes averaging 20° although slopes of up to ~72° are present. Slopes face in a north-to-north-easterly direction as well as in a south-to-south-westerly direction. The mountain is situated in an area hosting Swartland Shale Renosterveld and Mountain Fynbos vegetation types, while the surrounding areas are characterised by vineyards, plantations and agricultural land. The climate in the area has been described as typically Mediterranean with warm dry summers and cool, wet winters [34]. Average daily maximum temperatures range between 27 °C and 34 °C in summer with almost no rainfall occurring during the summer months. The hot, dry conditions are ideal for the occurrence of wild fires, which are generally experienced between the months of November and March [11]. One such fire started on the lower slopes of Simonsberg Mountain on 19 January 2016. The fire engulfed most of the mountain, destroying farmland, vineyards and natural vegetation in the process.
Due to the ecological importance of fires in the region, the area is monitored, in real-time, for the presence of fire by the Advanced Fire Information System (AFIS) developed by the Council for Scientific and Industrial Research (CSIR) Meraka Institute in South Africa. Once a fire is detected, information is sent to fire management agencies and the local Centre for Disaster Management and the appropriate response is taken. In addition to monitoring fire spread and fire location, burnt area maps are derived and disseminated to interested parties. The burnt area maps are derived using multispectral data including Sentinel-2A and Landsat 8.
4.2. Multispectral Burnt Area Mapping: Data Acquisition and Processing
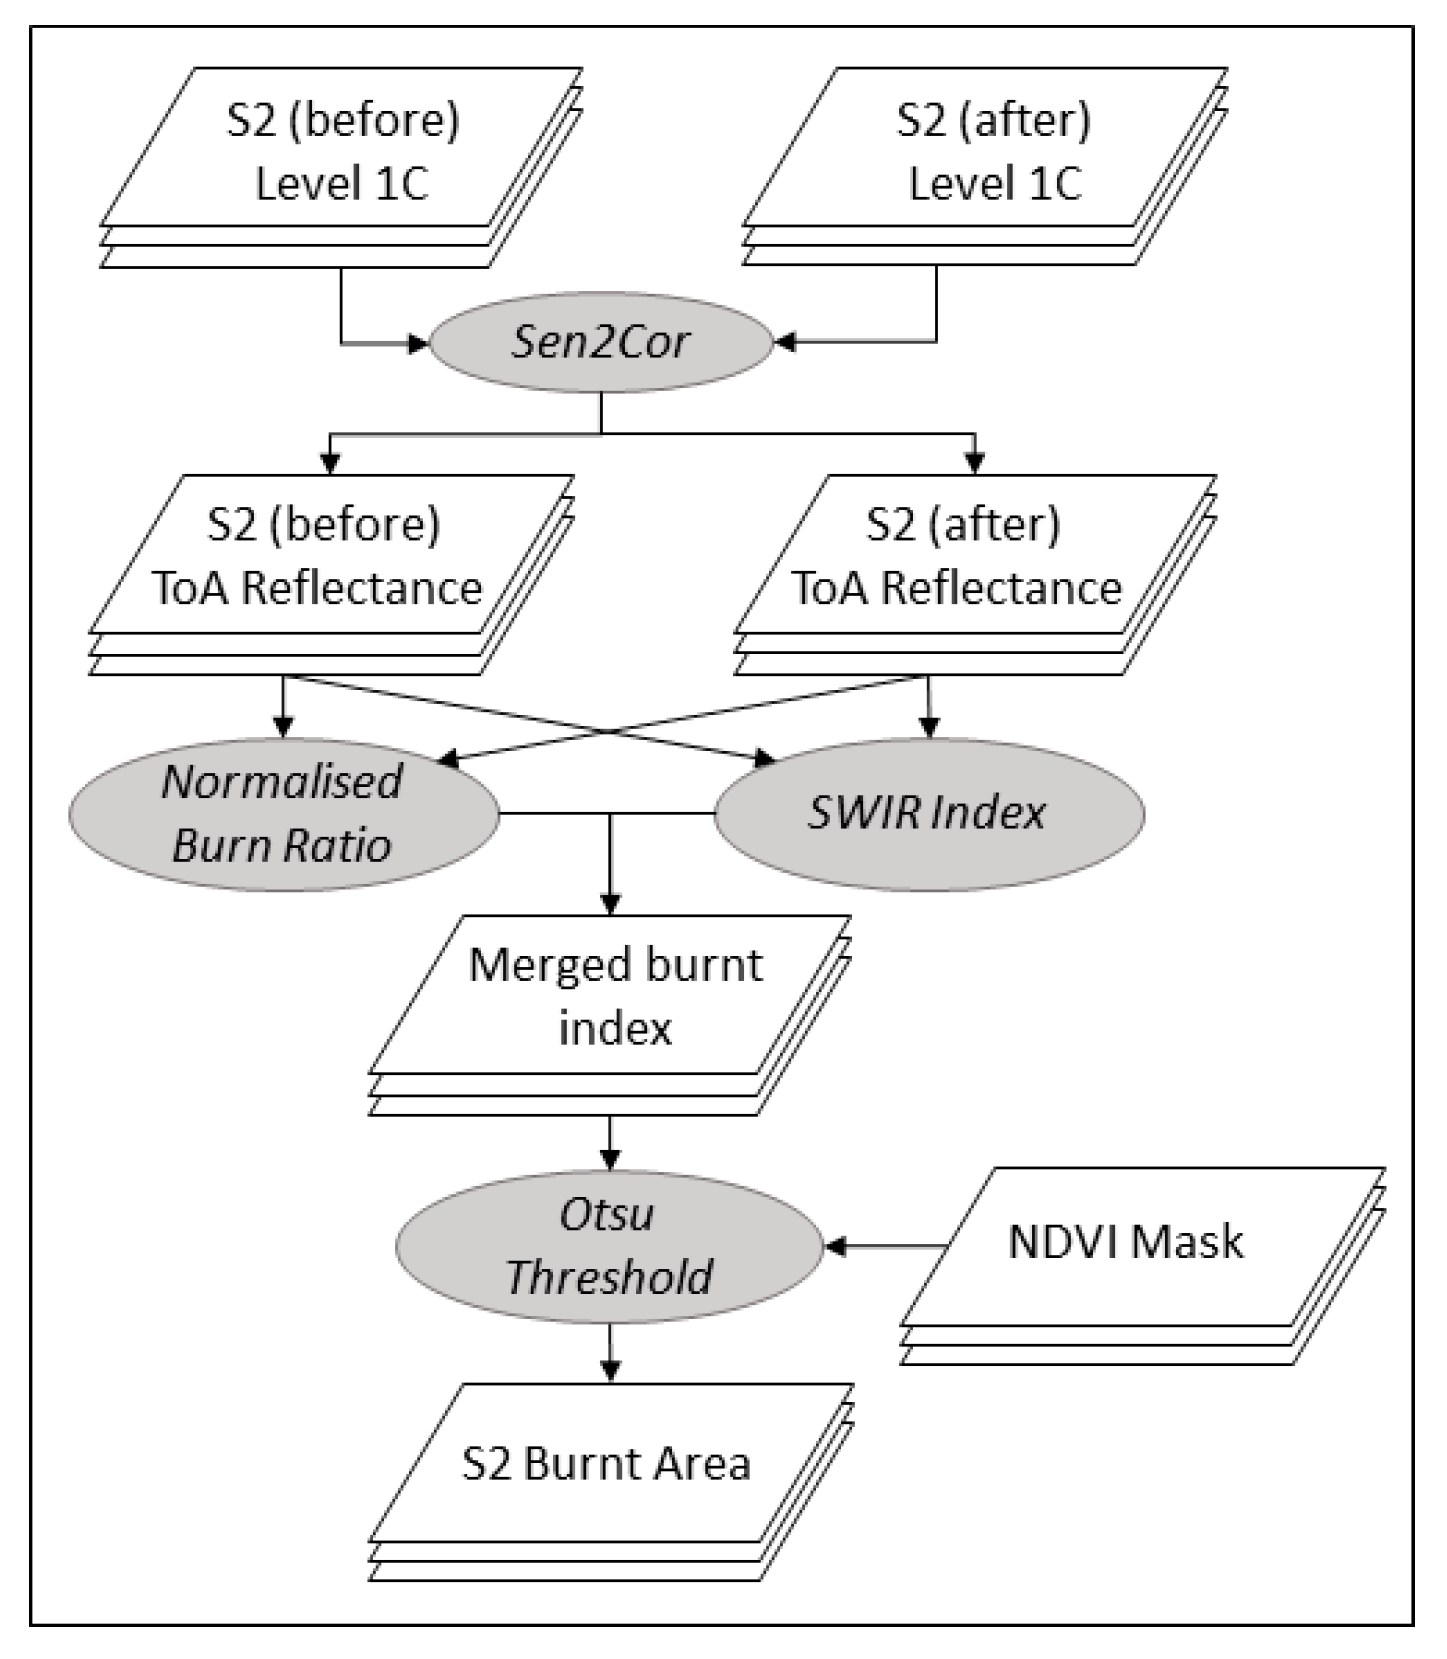
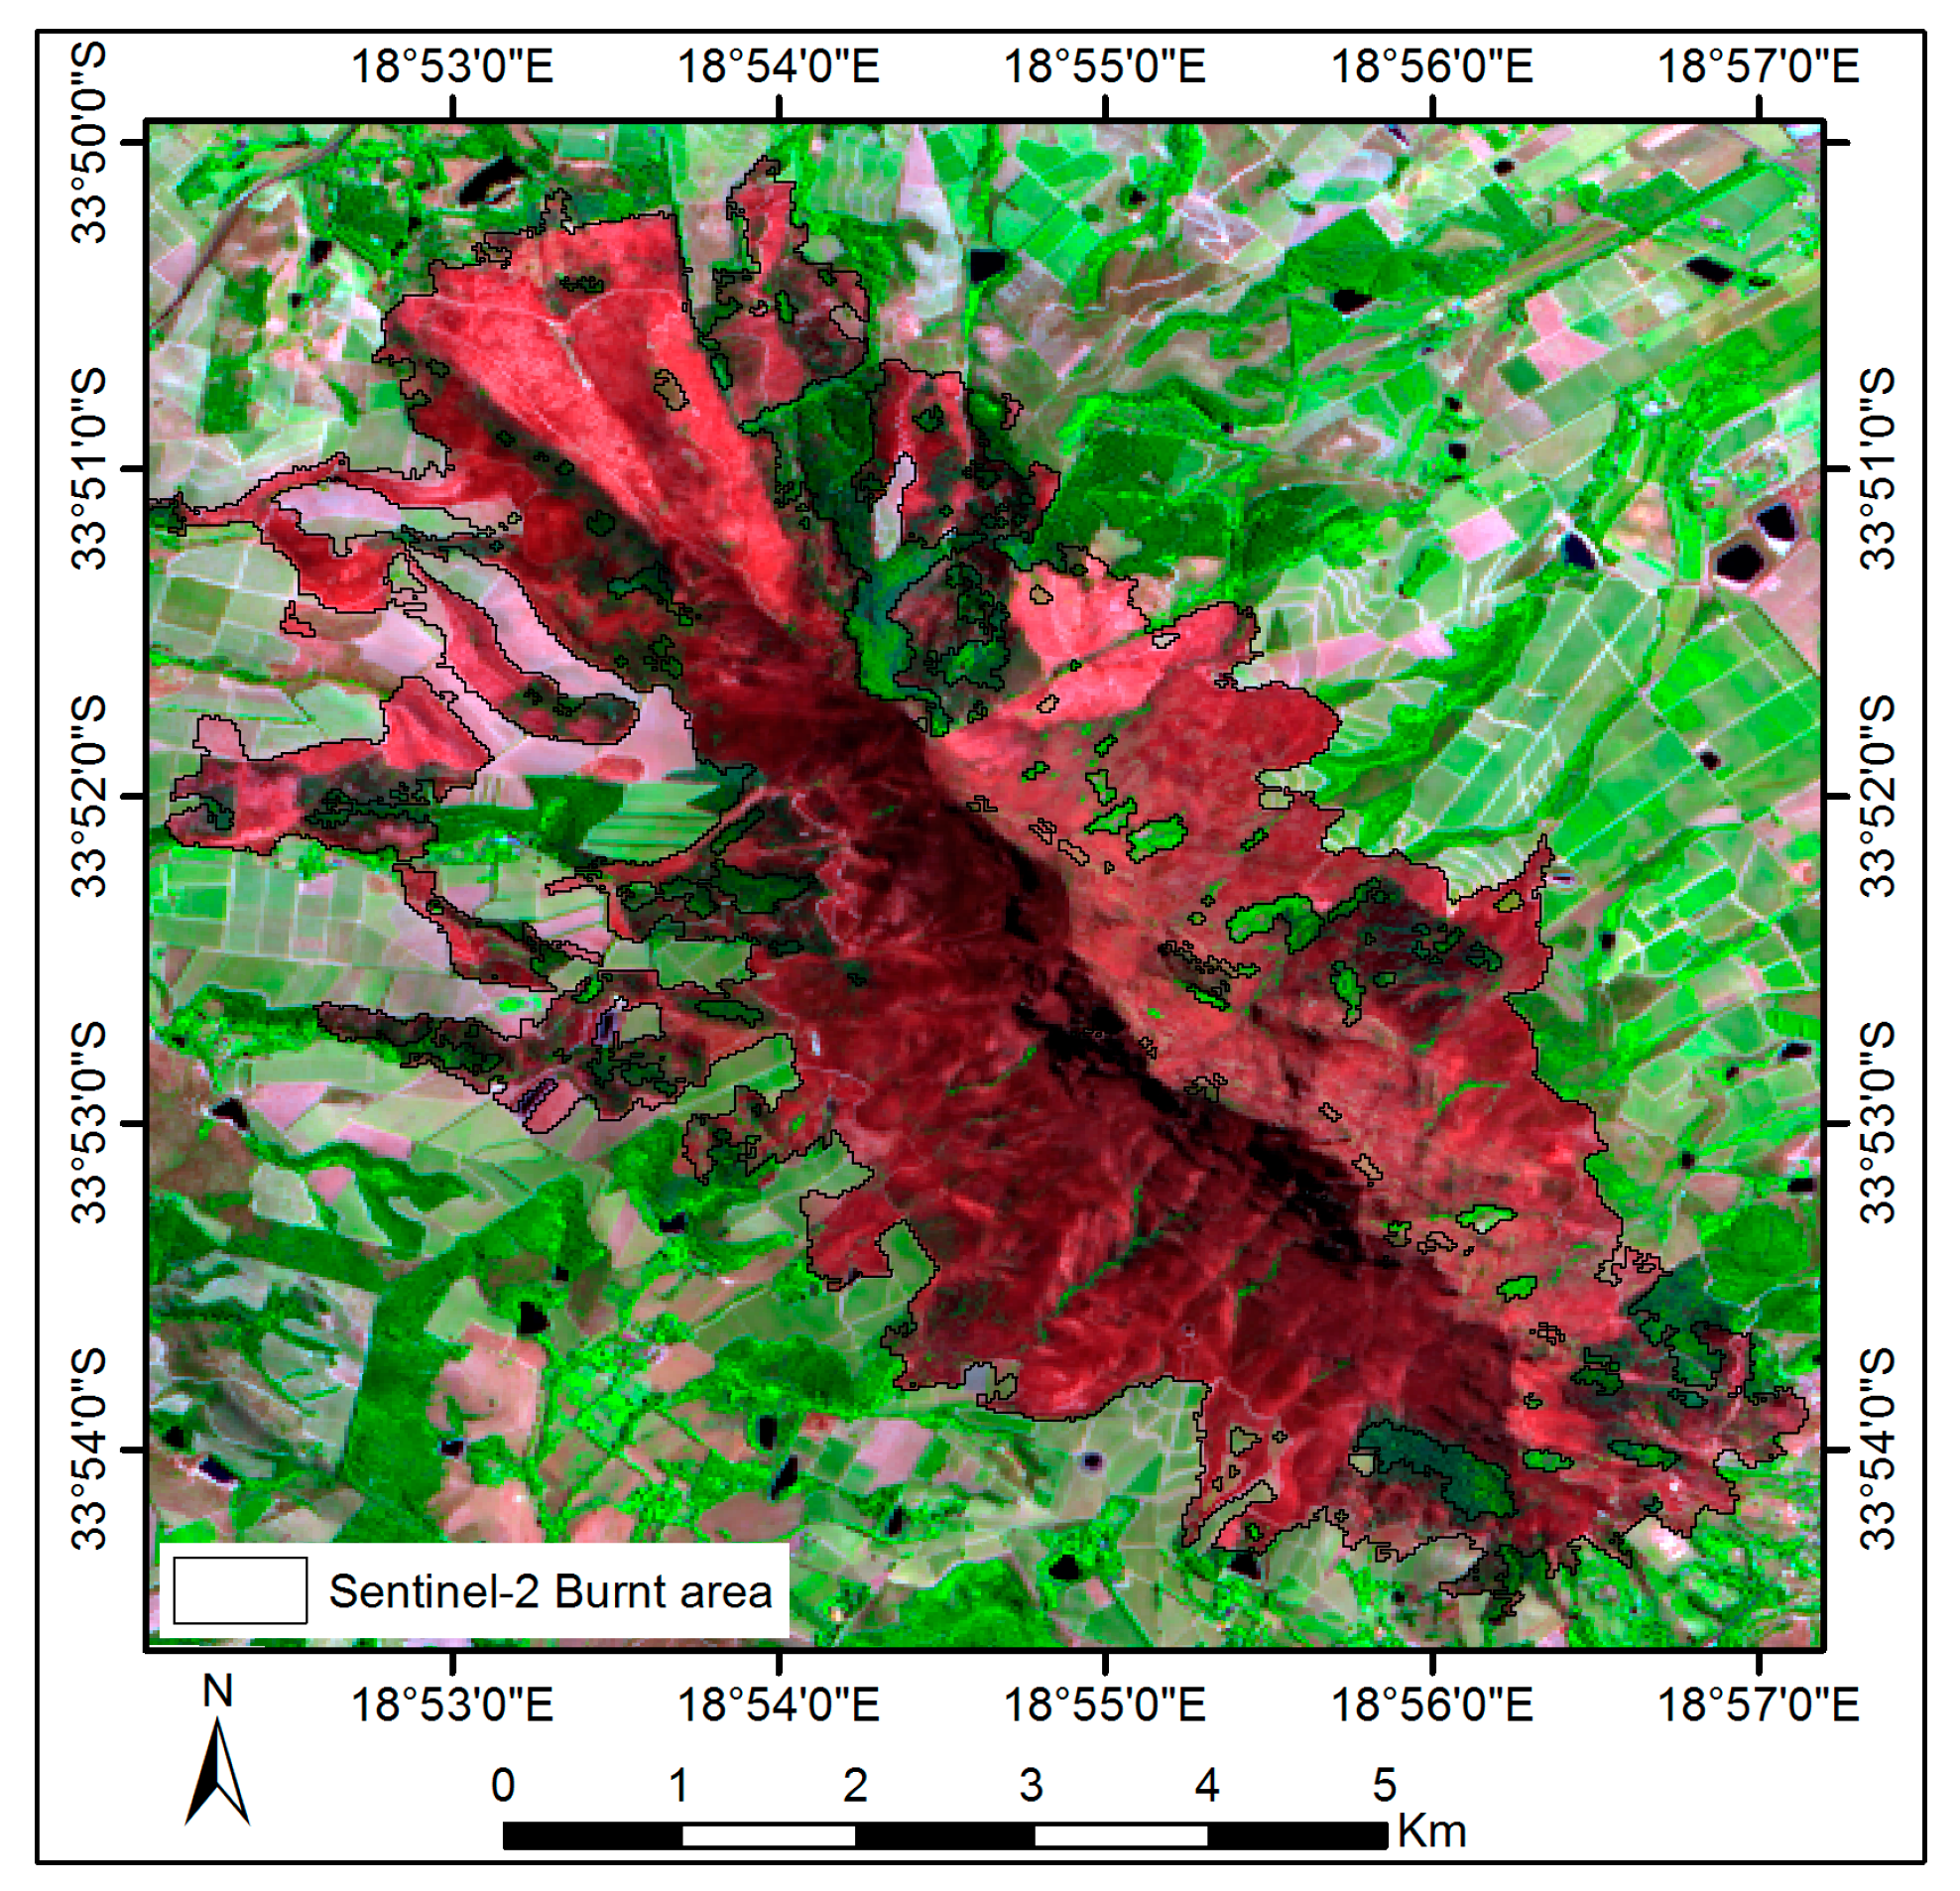
For the multispectral burnt area assessment for the Simonsberg fire, Sentinel-2A data was obtained. One pre-burn scene and one post-burn scene, acquired on 17 January 2016 and 16 February 2016, respectively, were obtained. The Sentinel-2A sensor captures data in 13 spectral bands in the visible, near-infrared and shortwave infrared range. The resolution ranges between 10 and 60 m depending on the band in question. The data was provided in Level-1C processing level, representing top of atmosphere (TOA) reflectance. Atmospheric correction was performed using the radiative transfer-based SEN2COR atmospheric correction [35] to derive surface reflectance. For the extraction of burnt area, multiple burnt area indices, using Near Infrared (NIR) Band 8 (0.842 µm) and Shortwave Infrared (SWIR) Band 12 (2.190 µm), were merged. Normalised Difference Vegetation Index (NDVI) values were used to mask out non-burnable pixels. Finally, a threshold value was automatically estimated using the Otsu algorithm [36] and applied to distinguish between burnt and unburnt areas. The processing workflow is summarised in Figure 2. The burn scar, presented in Figure 3, revealed a total area burnt of about 2400 ha.
4.3. NDαI Burnt Area Mapping: Data Acquisition and Processing
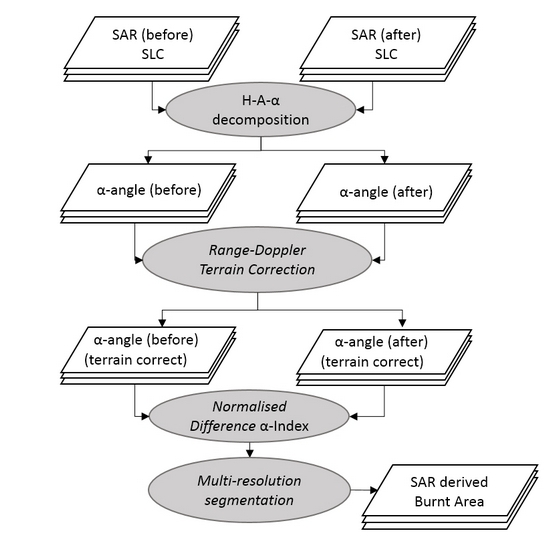
To test the ability of the NDαI for burnt area extraction in the area of interest, two sources of C-band SAR data were acquired. The dataset included two RADARSAT-2 scenes captured in Fine Beam quad-pol mode with ~35° incidence angle and pixel spacing of ~4.7 m in the range direction and ~4.9 m in azimuth direction. The scenes were captured on 12 January 2016 (coinciding with pre-burn conditions) and 5 February 2016 (coinciding with post-burn conditions). The RADARSAT-2 data was subject to the quad-pol H-A-α decomposition, using a 5 × 5 window size, to derive the α-angles for the pre- and post-burn scenes. Two Sentinel-1A IW dual-polarisation (VV and VH) scenes captured on 1 January 2016 (coinciding with pre-burn conditions) and 18 February 2016 (coinciding with post-burn conditions) were obtained. The Sentinel-1A data provided a nominal pixel spacing of ~2.3 m in range and ~14 m in azimuth direction and incidence angle range between 29° and 26°. The Sentinel-1A data was subject to the dual-pol H-α decomposition (using a 5 × 5 window size) as implemented in SNAP 5.0. Both Sentinel-1A and RADARSAT-2 α-angle results were subject to terrain correction using the Range-Doppler approach using SRTM 1 Arc-Second DEM as input. The output pixel spacing was set to 15 m for both scenes. The dual-pol α-angle output by SNAP 5.0 was inverted by applying a scale factor expressed as 90° − α to derive the α-angle in the expected scale range. The resulting datasets were used as input to derive NDαI data for the Sentinel-1A and RADARSAT-2 observations respectively.
To deal with SAR speckle effects, an object-based image analysis approach (OBIA) was adopted whereby thresholding was performed on regions characterised by similar statistics [21]. These regions were identified using multiresolution image segmentation, a region-based algorithm that merges neighbouring segments in multiple resolutions, starting at pixel level [19,37]. The scale parameter was determined heuristically and a scale parameter of 10 was found to be optimal. Similarly, the shape and compactness factors were set to 0.5 and 0.1, respectively. Objects representing burnt areas were then extracted by setting appropriate threshold values of NDαI. It was found that burnt segments were associated with higher mean NDαI values than non-burnt areas. Segmentation parameters and threshold values were determined through an empirical approach. In the case of RADARSAT-2, a threshold of NDαI > 0.025 was found to represent areas where vegetation cover decreased significantly due to the fire. In the case of Sentinel-1A, the threshold was adapted and NDαI > 0.050 was used. The processing workflow is presented graphically in Figure 4.
5. Results
The results of the NDαI algorithm as applied to RADARSAT-2 data and Sentinel-1A are presented in Figure 5A,B respectively. For comparison with the Sentinel-2A burn scar results, the Sentinel-2A-derived burnt area is overlain as black outlines in both Figure 5A,B. The results suggest that high NDαI values are associated with the burnt areas as would be expected. However, the relationship appears to be more prominent on quad-pol Radarsat-2-derived NDαI compared to Sentinel-1A-derived NDαI.
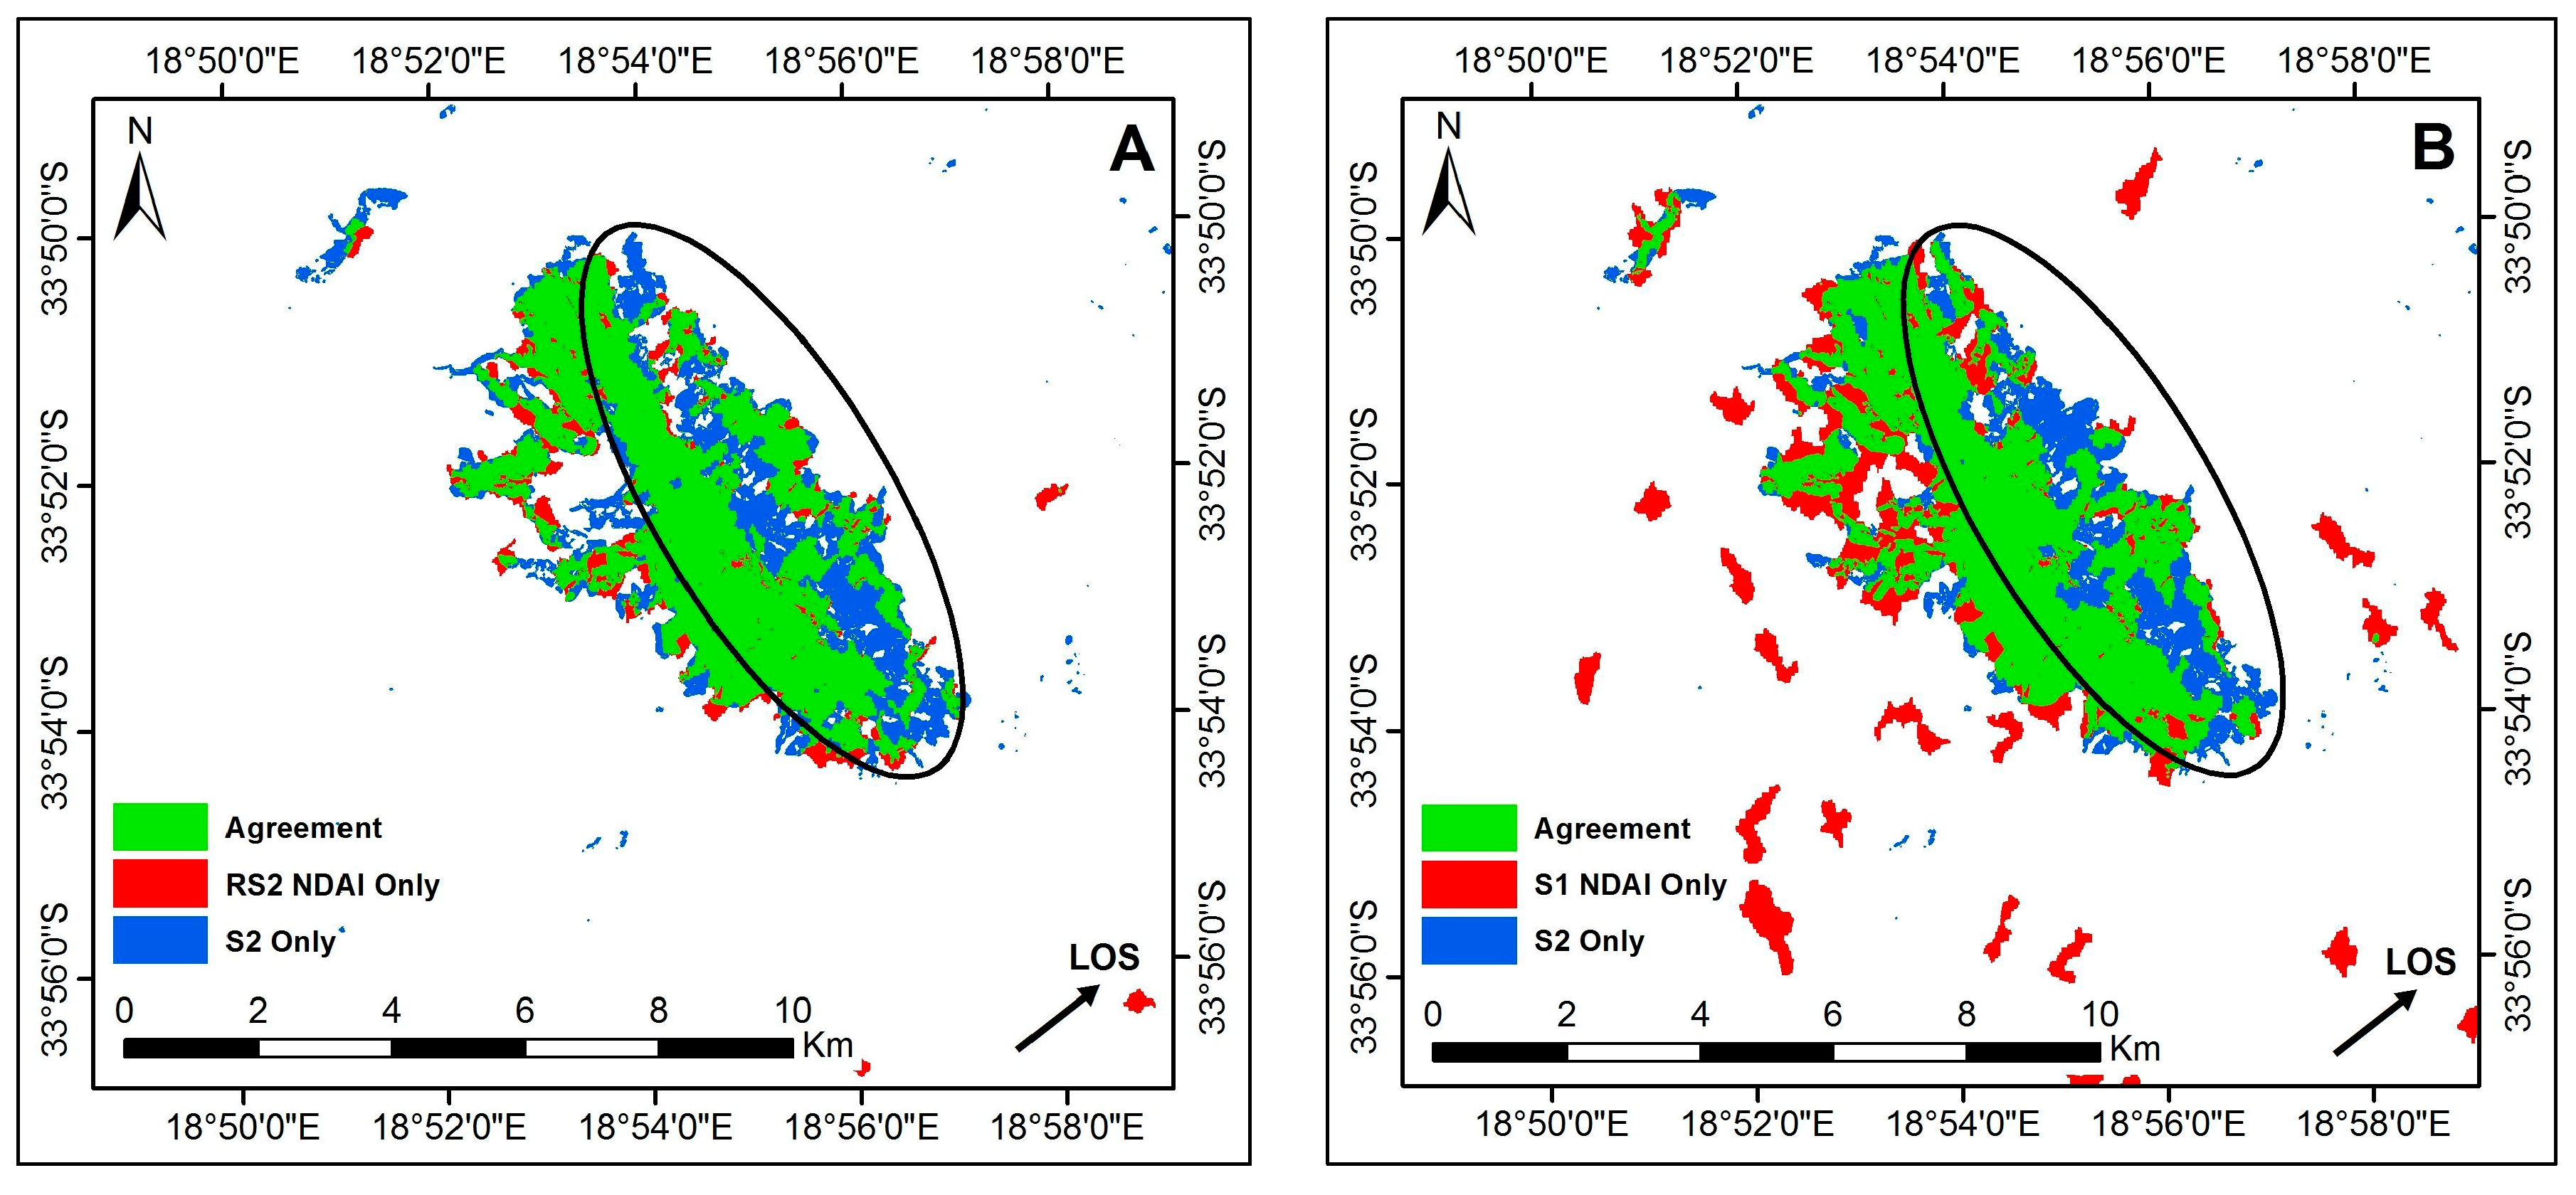
A comparison between the Sentinel-2A and SAR-derived burn scars is presented in Figure 6A,B respectively. Areas identified as burn scars on both Sentinel-2A and NDαI data are presented in green. Areas identified as burn scars using the NDαI only are presented in red and areas identified as burnt on Sentinel-2A only are displayed in blue. In lieu of ground-truth information, a classification accuracy assessment using the Sentinel-2A burn scar as reference data was performed. Standard error metrics were used to express the reliability of the classifications, including overall accuracy (percent correctly classified) and kappa statistic (how well the classification performed relative to a random assignment of classes). Also calculated was the commission error (percentage of area classified as “burnt” which was, in fact, not burnt) and omission error (percentage of actual burnt area incorrectly classified as “not burnt”). The results reveal that, for RADARSAT-2, an overall classification accuracy of 97.4% (Kappa = 0.72) was achieved. For the “Burnt” class, a commission error of 17.7%, and an omission error of 33.1% was achieved. This corresponds to a detection efficiency rate (or “producer’s accuracy”) of 66.9%. For Sentinel-1A, an overall accuracy of 94.8% (Kappa = 0.57) was achieved. The corresponding errors of commission and omission were 48.2% and 29.3%, respectively, with a detection efficiency rate of 70.7%.
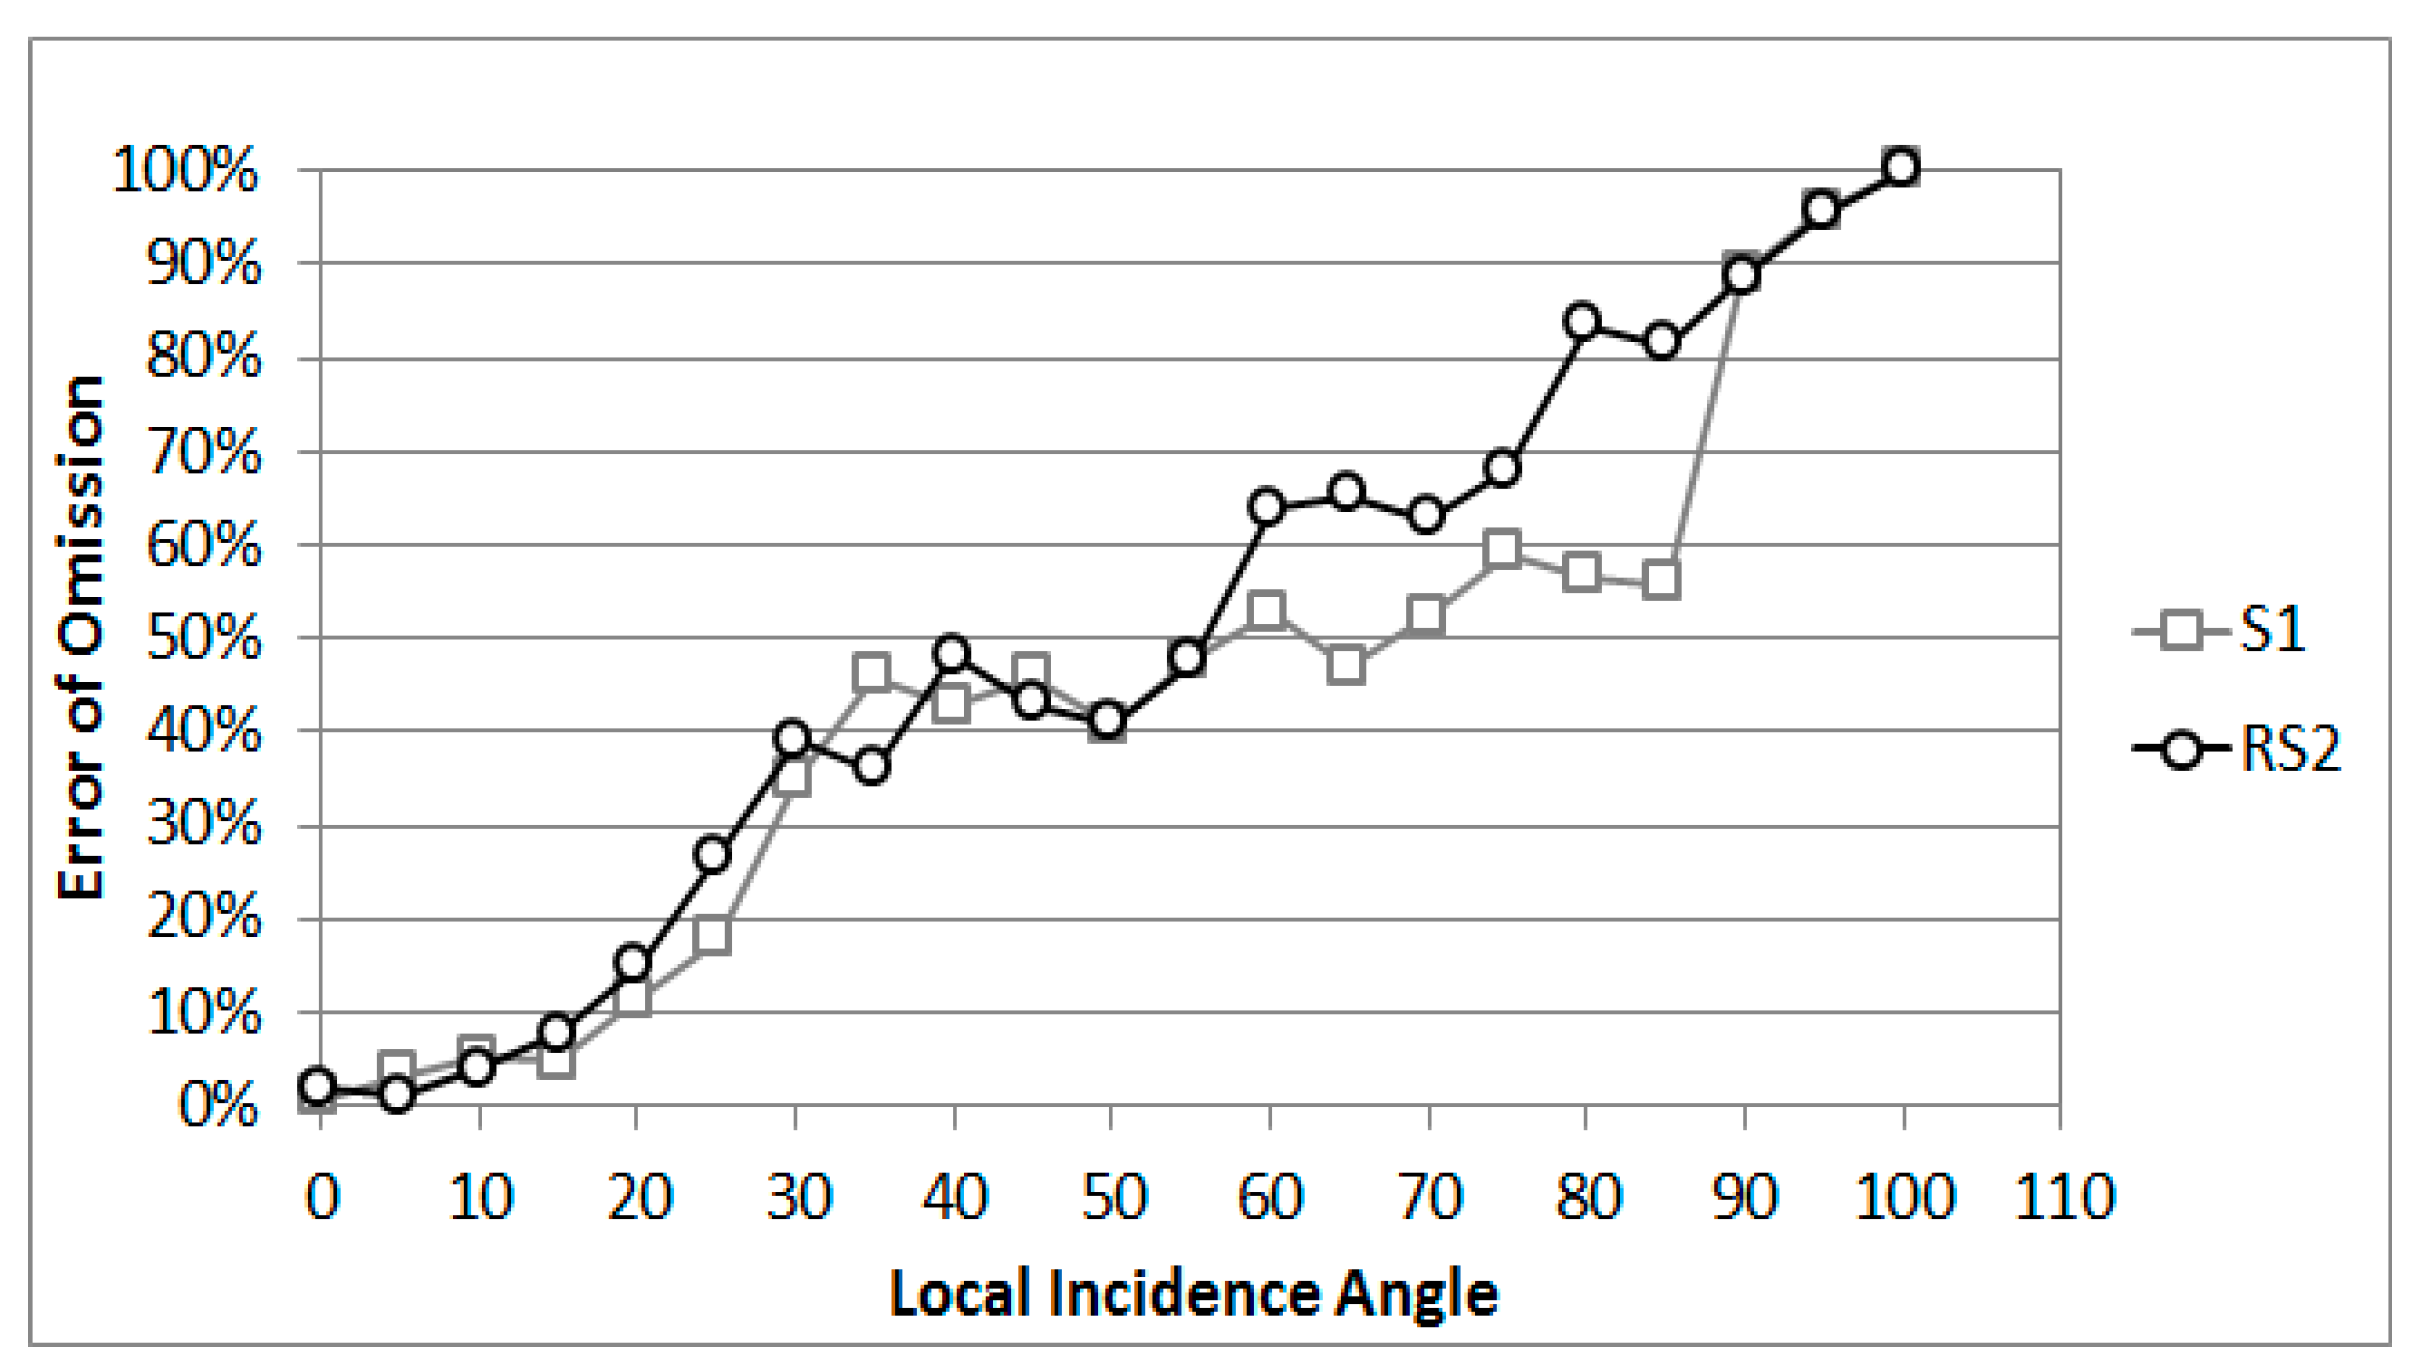
When the errors of omission are considered, it is observed that a strip of the burnt area trending in a north-westerly to south-easterly direction (highlighted with a black oval in Figure 6) was identified as burnt only on the Sentinel-2A imagery and not by either of the SAR sensors. This area is associated with slopes facing away from the sensor in a north-easterly direction, similar to the line-of-sight direction of the scenes. The omission of these pixels in the burnt area classification on the SAR data suggests that the terrain distortions inherent to SAR scenes, most notably radar shadowing effects, may limit the ability to extract burn scars using this approach. When the correspondence between the reference data and the SAR classifications are considered as a function of local incidence angle (Figure 7), it becomes clear that severe errors of omission occur at high local incidence angles. In future, the combination of SAR data captured from different look directions may partially overcome this limitation.
In addition to the errors of omission, some areas were incorrectly classified as burnt (i.e., errors of commission). These are shown in red on Figure 6. Although some of these errors could be due to omissions in the Sentinel-2A burn scar classification, true errors of commission are present. It was also observed that the classification derived from Sentinel-1A had significantly higher commission errors than those from RADARSAT-2 (48.2% vs. 17.7%).
6. Discussion of the Results
Both Sentinel-1A and RADARSAT-2 results demonstrated the ability to extract the burnt area with overall accuracies of 97.4% and 94.8%, respectively, compared to single-date polarimetric decompositions that provided overall accuracies of 85% [17]. It should be noted, however, that these overall accuracies are somewhat inflated due to the fact that far more non-burnt areas exist than burnt areas (by a factor of 17), leading to unbalanced class sizes in the confusion matrix. The moderately high kappa values of 0.72 and 0.59 (for RADARSAT-2 and Sentinel-1A, respectively) therefore provide a more reliable metric of classification accuracy, coupled with the errors of omission and commission. The errors of omission for RADARSAT-2 and Sentinel-1A data were similar (33.1% and 29.3%, respectively), suggesting that both sources of information would be able to provide a reasonable detection of burnt areas. The results also suggest that more accurate results would be obtained in areas of relatively flat topography and low local incidence angles. In rugged terrain, reasonable accuracies will be obtained on slopes facing towards the sensor. However, in areas of steep topography where high local incidence angles are associated with slopes facing away from the SAR sensor, the classification accuracies would decrease due to an increase in errors of omission. These effects would be present irrespective of whether quad-pol or dual-pol scenes were used. In these areas, burnt area extraction from SAR scenes can be complemented by the addition of multispectral burnt area assessment techniques assuming that cloud- and smoke-free data is available. However, in areas where multispectral approaches fail to extract burn scars in areas of steep topography in the presence of shadows, the NDαI approach may fail to increase the ability to extract burnt area information depending on the sensor geometry and local topography. However, the combined use of SAR scenes from different look directions is expected to overcome these limitations and is recommended for testing in future research. One potential limitation in an approach combining multiple look directions lies in the rotational invariance (to yield the same results irrespective of viewing angle) of the α-angle used in the NDαI approach. Although the H, A and α parameters of the Cloude–Pottier algorithm are rotational-invariant [38], recent investigations have demonstrated that the rotational invariance does not hold for dual-polarisation Cloude–Pottier decompositions [26]. The effects of rotational invariance on dual-pol decomposition will need to be tested to assess the robustness of the algorithm in a variety of data acquisition and scattering geometries.
In addition to errors of omission, significant errors of commission were observed for dual-pol NDαI results compared to quad-pol NDαI results (48.2% compared to 17.7% respectively). Although the threshold values used during the segmentation of the Sentinel-1A NDαI could be adjusted to minimise the errors of commission, the result was found to be associated with a corresponding increase in errors of omission. Changing the threshold from 0.050 to 0.075, for example, lowers commission error from 48.2% to 20.5%, but raises omission error from 29.3% to 50.0%. Therefore, the selection of optimal threshold values should be based on a trade-off between the over- or under-estimation of burnt area. The high commission errors observed on Sentinel-1A NDαI burnt area results are likely due to the inability of the α-angle from the modified H-α decomposition to effectively separate scattering mechanisms when one like-polarised and one cross-polarised band is used [33]. In fact, the lack of co-polarisation was found to degrade the ability to extract scattering mechanisms with medium- and low-entropy scattering mechanisms being highly confused [33]. Furthermore, high-entropy scattering mechanisms were found to be confused by medium-entropy and multiple scattering mechanisms [33]. To further investigate the commission errors on dual-polarisation data, the areas associated with high commission errors were compared to the land-cover map of the area [39]. The results suggest that high commission errors on Sentinel-1 burnt area results were associated with areas that were sparsely vegetated, or corresponding to low-vegetation (urban sports fields or golf courses, cultivated fields, and young plantations). This suggests that, for unburnt, un-vegetated or low-vegetation areas (such as grassland and agriculture) and burnt areas, a similar temporal signature of α-angle is observed when dual-pol data is used. This is similar to the observation for the change in SAR backscatter using the normalised difference index approach [19]. Therefore, the probability of false alarms are expected to be higher for the dual-polarisation NDαI approach. Future investigations will consider the inclusion of additional observables, including interferometric coherence, for the minimisation of errors of commission on dual-polarisation data.
The image segmentation and thresholding parameters selected in this investigation were selected empirically. The selection of optimal threshold value when change detection using ratioing techniques are involved is a well-known problem. Although “trial-and-error” approaches are commonplace, they are known to be time-consuming and prone to operator bias [40,41]. Furthermore, the robustness of the algorithm in different areas of investigation and data acquisition geometries have not been tested. If the same segmentation parameters and threshold values do not apply in different scenarios, the trial-and-error-based approach will be time-consuming to implement. For this reason, automation of the threshold and segmentation parameter selection process, by implementation of, for example, the Kittler and Illingworth minimum-error thresholding algorithm [41] is recommended for future research.
7. Concluding Remarks
This paper has demonstrated the potential of a thresholded, multi-temporal, α-angle-based index (NDαI) for mapping burn scars in a fire-prone region using Sentinel-1A and RADARSAT-2 data. The multi-temporal approach adopted in this investigation assumed that the confusion between burnt areas and previously bare areas would be minimised compared to single-date approaches assuming that data acquisition is limited to time periods as close as possible before and after the burn. With larger day differences between data acquisitions, the probability of the removal of vegetation due to causes other than burns, for example harvesting or deforestation, would result in a misclassification of burnt versus unburnt areas. Furthermore, rapid changes can take place after a fire including regrowth of vegetation. Therefore, effort should be made to acquire data at the shortest temporal baseline possible.
Although the confusion between low—or no—vegetation areas and burnt areas were minimised when quad-pol RADARSAT-2 data were used, significant errors of commission (48.2%) were present in the burnt area results derived from Sentinel-1A dual-polarisation results. The errors were associated with unburnt areas characterised by low or no vegetation. This suggests that the confusion between burnt areas and previously bare areas using the dual-polarisation NDαI would not be reduced as significantly as expected. Furthermore, omission errors on slopes facing away from the sensor in rugged terrain, and therefore associated with steep local incidence angles, were associated with both RADARSAT-2 and Sentinel-1A burnt area results. This suggests that the algorithm would be more suitable in areas of flat topography unless data from multiple orbits can be combined successfully.
Further research on this technique should investigate the use of multiple look directions to compensate for the effect of local incidence angle and the minimisation of errors of omission. Furthermore, the reduction of errors commission in previously bare or low-vegetation areas should be considered by incorporating additional SAR observables, including interferometric coherence. To minimise both errors of omission and errors of commission, the SAR burnt area estimates can be complemented by the addition of multispectral burnt area estimates assuming that smoke and cloud free data are available.
Despite the limitations highlighted above, the results of the investigation suggest that the SAR-based NDαI algorithm for burn scar extraction can be used to compliment observations by conventional multispectral approaches. This would be particularly useful in areas where persistent cloud -cover or smoke in actively burning areas prevents the use of conventional techniques. The ability to complement multispectral burn scar extractions with the NDαI mapping algorithms using SAR data increases the information available for informed fire management practices. Furthermore, employing freely available imagery such as Sentinel-1 would aid in reducing the cost of deriving such information.
Acknowledgments
This work is based on the research funded, in part, by the Council for Scientific and Industrial Research (CSIR), as well as the National Research Foundation (NRF) of South Africa for the grant, Unique Grant No. 94023. The authors also wish to thank the anonymous reviewers for their valuable feedback and guidance.
Author Contributions
J.E. conceived the paper and designed the experiments and processed the SAR data. A.T. performed the image segmentation to extract burnt areas from SAR derived datasets. L.V. processed the Sentinel-2 data and derived the Sentinel-2 burnt areas. J.K. performed the accuracy assessments and the analysis of the influence of terrain morphology on the results. J.E. analysed the outcomes and wrote the paper.
Conflicts of Interest
The authors declare no conflict of interest.
References
- Gimeno, M.; San-Miguel-Ayanz, J.; Liberta, G. Fire scar detection in Central Portugal using RADARSAT-1 and ERS-2 SAR data. Int. Geosci. Remote Sens. Symp. 2003, 4, 2491–2493. [Google Scholar] [CrossRef]
- Kontoes, C.C.; Poilve, H.; Florsch, G.; Keramitsoglou, I.; Paralikidis, S. A comparative analysis of a fixed thresholding vs. a classification tree approach for operational burn scar detection and mapping. Int. J. Appl. Earth Obs. Geoinf. 2009, 11, 299–316. [Google Scholar] [CrossRef]
- Bernhard, E.M.; Twele, A.; Gahler, M. Burnt area mapping in the European-Mediterranean: SAR backscatter change analysis and synergistic use of optical and SAR data. Int. Geosci. Remote Sens. Symp. 2012. [Google Scholar] [CrossRef]
- Leblon, B.; Bourgeau-Chavez, L.; San-Miguel-Ayanz, J. Use of remote sensing in wildfire management. In Sustainable Development—Authorative and leading edge content for environmental management; InTech: Rijeka, Croatia, 2015; pp. 67–99. [Google Scholar] [CrossRef]
- Menges, C.H.; Bartolo, R.E.; Bell, D.; Hill, G.J.E. The effect of savanna fires on SAR backscatter in northern Australia. Int. J. Remote Sens. 2004, 25, 4857–4871. [Google Scholar] [CrossRef]
- Balzter, H.; Gerard, F.; Gonzalez, M.C.; Riaño, D. Post-fire vegetation phenology in Siberian burn scars. Int. Geosci. Remote Sens. Symp. 2007. [Google Scholar] [CrossRef]
- George, C.; Rowland, C.; Gerard, F.; Balzter, H. Retrospective mapping of burnt areas in Central Siberia using a modification of the normalised difference water index. Remote Sens. Environ. 2006, 104, 346–359. [Google Scholar] [CrossRef]
- Bartsch, A.; Balzter, H.; George, C. The influence of regional surface soil moisture anomalies on forest fires in Siberia observed from satellites. Environ. Res. Lett. 2009, 4, 45021. [Google Scholar] [CrossRef]
- Esler, K.J.; Pierce, S.M.; de Villiers, C. Fynbos Ecology and Management; Briza Publications: Pretoria, South Africa, 2014; ISBN 978-1-920217-37-2. [Google Scholar]
- Flasse, S.I.; Trigg, S.N.; Ceccato, P.N.; Perryman, A.H.; Brockett, B.H.; Frost, P.E.; Roux, J.L. Remote sensing of vegetation fires and its contribution to a fire management information system. In Wildland Fire Management Handbook for Sub-Saharan Africa; Global Fire Monitoring Centre (GFMC): Freiburg, Germany, 2004; pp. 158–211. [Google Scholar]
- Van Wilgen, B.W.; Forsyth, G.G.; de Klerk, H.; Das, S.; Khuluse, S.; Schmitz, P. Fire management in Mediterranean-climate shrublands: A case study from the Cape fynbos, South Africa. J. Appl. Ecol. 2010, 47, 631–638. [Google Scholar] [CrossRef]
- USGS. Burned Area Essential Climate Variable (BAECV). Available online: http://remotesensing.usgs.gov/ecv/BA_overview.php (accessed on 6 December 2016).
- Balzter, H.; Balzter, H. Forest mapping and monitoring with interferometric synthetic aperture radar (InSAR). Prog. Phys. Geogr. 2001, 25, 159–177. [Google Scholar] [CrossRef]
- Giglio, L.; Loboda, T.; Roy, D.P.; Quayle, B.; Justice, C.O. An active-fire based burned area mapping algorithm for the MODIS sensor. Remote Sens. Environ. 2009, 113, 408–420. [Google Scholar] [CrossRef]
- Roy, D.; Lewis, P.; Justice, C. Burned area mapping using multi-rmoderate spatial resolution data—A bi-directional reflectance model-based expectation approach. Remote. Environ. 2002, 83, 263–286. [Google Scholar] [CrossRef]
- Czuchlewski, K.R.; Weissel, J.K. Synthetic Aperture Radar (SAR)-based mapping of wildfire burn severity and recovery. Int. Geosci. Remote Sens. Symp. 2005, 1, 1–4. [Google Scholar]
- Goodenough, D.G.; Chen, H.; Richardson, A.; Cloude, S.; Hong, W.; Li, Y. Mapping fire scars using Radarsat-2 polarimetric SAR data. Can. J. Remote Sens. 2011, 37, 500–509. [Google Scholar] [CrossRef]
- Kwoh, L.K.; Chin, S. Tropical Forest Fire Scar Studies Using Multi-Temporal ERS l/2 INSAR Data. Int. Geosci. Remote Sens. Symp. 1998, 3, 1611–1613. [Google Scholar]
- Polychronaki, A.; Gitas, I.Z.; Veraverbeke, S.; Debien, A. Evaluation of ALOS PALSAR imagery for burned area mapping in Greece using object-based classification. Remote Sens. 2013, 5, 5680–5701. [Google Scholar] [CrossRef]
- Yang, W.; Yang, X.; Yan, T.; Song, H.; Xia, G.S. Region-Based Change Detection for Polarimetric SAR Images Using Wishart Mixture Models. IEEE Trans. Geosci. Remote Sens. 2016, 54, 6746–6756. [Google Scholar] [CrossRef]
- Qi, Z.; Yeh, A.G.-O.; Li, X.; Zhang, X. A three-component method for timely detection of land cover changes using polarimetric SAR images. ISPRS J. Photogramm. Remote Sens. 2015, 107, 3–21. [Google Scholar] [CrossRef]
- Qi, Z.; Yeh, A.G.O.; Li, X.; Xian, S.; Zhang, X. Monthly short-term detection of land development using RADARSAT-2 polarimetric SAR imagery. Remote Sens. Environ. 2015, 164, 179–196. [Google Scholar] [CrossRef]
- Cloude, S.R. Polarisation Applications in Remote Sensing; Oxford University Press: New York, NY, USA, 2010. [Google Scholar]
- Papathanassiou, K.P.; Cloude, S.R. Single-baseline polarimetric SAR interferometry. IEEE Trans. Geosci. Remote Sens. 2001, 39, 2352–2363. [Google Scholar] [CrossRef]
- Papathanassiou, K.P.; Reigber, A.; Cloude, S.R. Vegetation and ground parameter estimation using polarimetric interferometry Part I: The role of polarization. In Proceedings of the CEOS SAR Workshop, Toulouse, France, 2–5 April 2000; pp. 347–352. [Google Scholar]
- Xie, L.; Zhang, H.; Wang, C.; Shan, Z. Similarity analysis of entropy/alpha decomposition between HH/VV dual- and quad-polarization SAR data. Remote Sens. Lett. 2015, 6, 228–237. [Google Scholar] [CrossRef]
- Zhao, L.; Yang, J.; Li, P.; Zhang, L. Seasonal inundation monitoring and vegetation pattern mapping of the Erguna floodplain by means of a RADARSAT-2 fully polarimetric time series. Remote Sens. Environ. 2014, 152, 426–440. [Google Scholar] [CrossRef]
- Cloude, S.R.; Pottier, E. An entropy based classification scheme for land applications ofpolarimetric SAR. IEEE Trans. Geosci. Remote Sens. 1997, 35, 68–78. [Google Scholar] [CrossRef]
- Goodenough, D.G.; Chen, H.; Dyk, A. Evaluation of Convair-580 and simulated radarsat-2 polarimetric SAR for forest change detection. Int. Geosci. Remote Sens. Symp. 2006. [Google Scholar] [CrossRef]
- Touzi, R.; Deschamps, A.; Rother, G. Phase of target scattering for wetland characterization using polarimetric C-band SAR. IEEE Trans. Geosci. Remote Sens. 2009, 47, 3241–3261. [Google Scholar] [CrossRef]
- Natural Resources Canada. Interpretation Based on Scattering Mechanisms. Available online: http://www.nrcan.gc.ca/earth-sciences/geomatics/satellite-imagery-air-photos/satellite-imagery-products/educational-resources/9533 (accessed on 24 February 2017).
- Cloude, S.R. The Dual Polarisation Entropy/Alpha Decomposition. In Proceedings of the 3rd International Workshop on Science and Applications of SAR Polarimetry and Polarimetric Interferometry, Noordwijk, The Netherlands, 22–26 January 2007; pp. 1–6. [Google Scholar]
- Ji, K.; Wu, Y. Scattering Mechanism Extraction by a Modified Cloude-Pottier Decomposition for Dual Polarization SAR. Remote Sens. 2015, 7, 7447–7470. [Google Scholar] [CrossRef]
- Yates, C.J.; Elith, J.; Latimer, A.M.; Le Maitre, D.; Midgley, G.F.; Schurr, F.M.; West, A.G. Projecting climate change impacts on species distributions in megadiverse South African Cape and Southwest Australian Floristic Regions: Opportunities and challenges. Austral Ecol. 2010, 35, 374–391. [Google Scholar] [CrossRef]
- Müller-Wilm, U. Sentinel-2 MSI-Level-2A Prototype Processor Installation and User Manual; Telespazio VEGA Deutschland GmbH: Darmstadt, Germany, 2015. [Google Scholar]
- Otsu, N.A. A threshold selection method from gray-level histograms. IEEE Trans. Syst. Man. Cybern. 1979, 9, 62–66. [Google Scholar] [CrossRef]
- Rejaur Rahman, M.; Saha, S.K. Multi-resolution segmentation for object-based classification and accuracy assessment of land use/land cover classification using remotely sensed data. J. Indian Soc. Remote Sens. 2008, 36, 189–201. [Google Scholar] [CrossRef]
- Lee, J.; Ainsworth, T.L.; Chen, K.S. The effect of orientation angle compensation on polarimetric target decompositions. IEEE Trans. Geosci. Remote Sens. 2009, 49, 849–852. [Google Scholar]
- GeoTerraImage. 2013–2014 South African National Land-Cover Dataset: Data User Report and Metadata; GeoTerraImage: Pretoria, South Africa, 2015. [Google Scholar]
- Drǎguţ, L.; Tiede, D.; Levick, S.R. ESP: A tool to estimate scale parameter for multiresolution image segmentation of remotely sensed data. Int. J. Geogr. Inf. Sci. 2010, 24, 859–871. [Google Scholar] [CrossRef]
- Moser, G.; Serpico, S.B.; Member, S. Generalized Minimum-Error Thresholding for Unsupervised Change Detection From SAR Amplitude Imagery. IEEE Trans. Geosci. Remote Sens. 2006, 44, 2972–2982. [Google Scholar] [CrossRef]
Figure 1.
The location of the Simonsberg Mountain (black star) near Stellenbosch, South Africa.

Figure 2.
The Sentinel-2A processing workflow for burnt area mapping (S2 = Sentinel-2, ToA = Top of Atmosphere, SWIR = Shortwave Infrared, NDVI = Normalised Difference Vegetation Index).
Figure 2.
The Sentinel-2A processing workflow for burnt area mapping (S2 = Sentinel-2, ToA = Top of Atmosphere, SWIR = Shortwave Infrared, NDVI = Normalised Difference Vegetation Index).
Figure 3.
The Sentinel-2A burn scar provided by Advanced Fire Information System (AFIS) for the Simonsberg fire with the Sentinel-2A scene, captured on 2 February 2016 as backdrop (RGB = Band 12, Band 8, Band 4).
Figure 3.
The Sentinel-2A burn scar provided by Advanced Fire Information System (AFIS) for the Simonsberg fire with the Sentinel-2A scene, captured on 2 February 2016 as backdrop (RGB = Band 12, Band 8, Band 4).

Figure 4.
The synthetic aperture radar (SAR) data processing workflow for burnt area mapping (SLC = Single Look Complex).
Figure 4.
The synthetic aperture radar (SAR) data processing workflow for burnt area mapping (SLC = Single Look Complex).
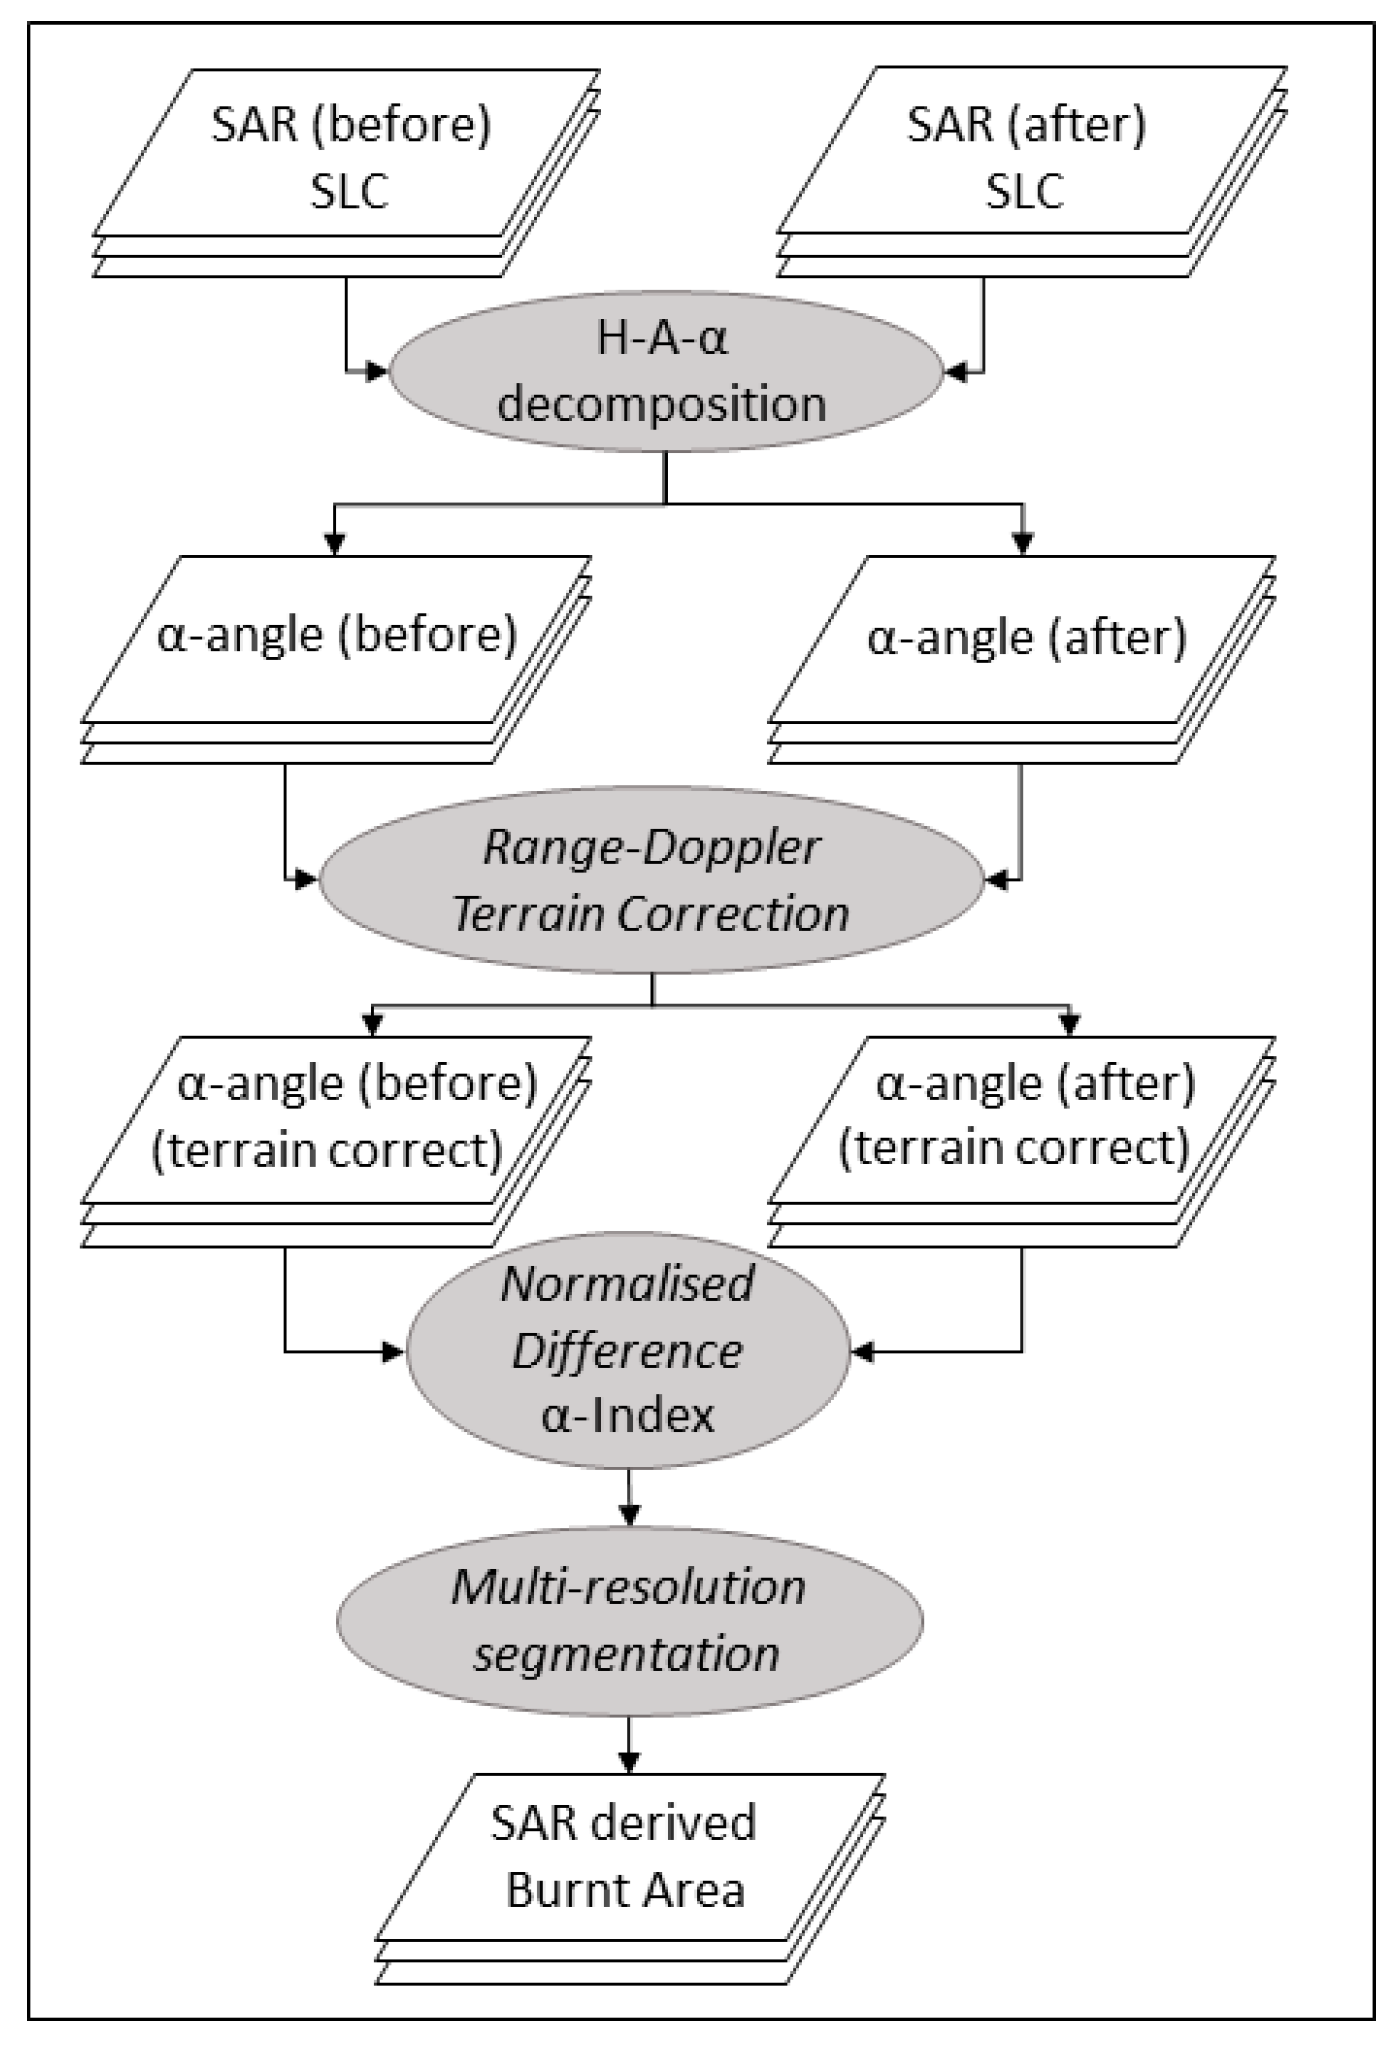
Figure 5.
The results of calculating NDαI for Radarsat-2 (RS-2) (A) and Sentinel-1A (S1) (B) data. The extent of the burn scar extracted from Sentinel-2A (black outlines) are also shown for comparison.
Figure 5.
The results of calculating NDαI for Radarsat-2 (RS-2) (A) and Sentinel-1A (S1) (B) data. The extent of the burn scar extracted from Sentinel-2A (black outlines) are also shown for comparison.
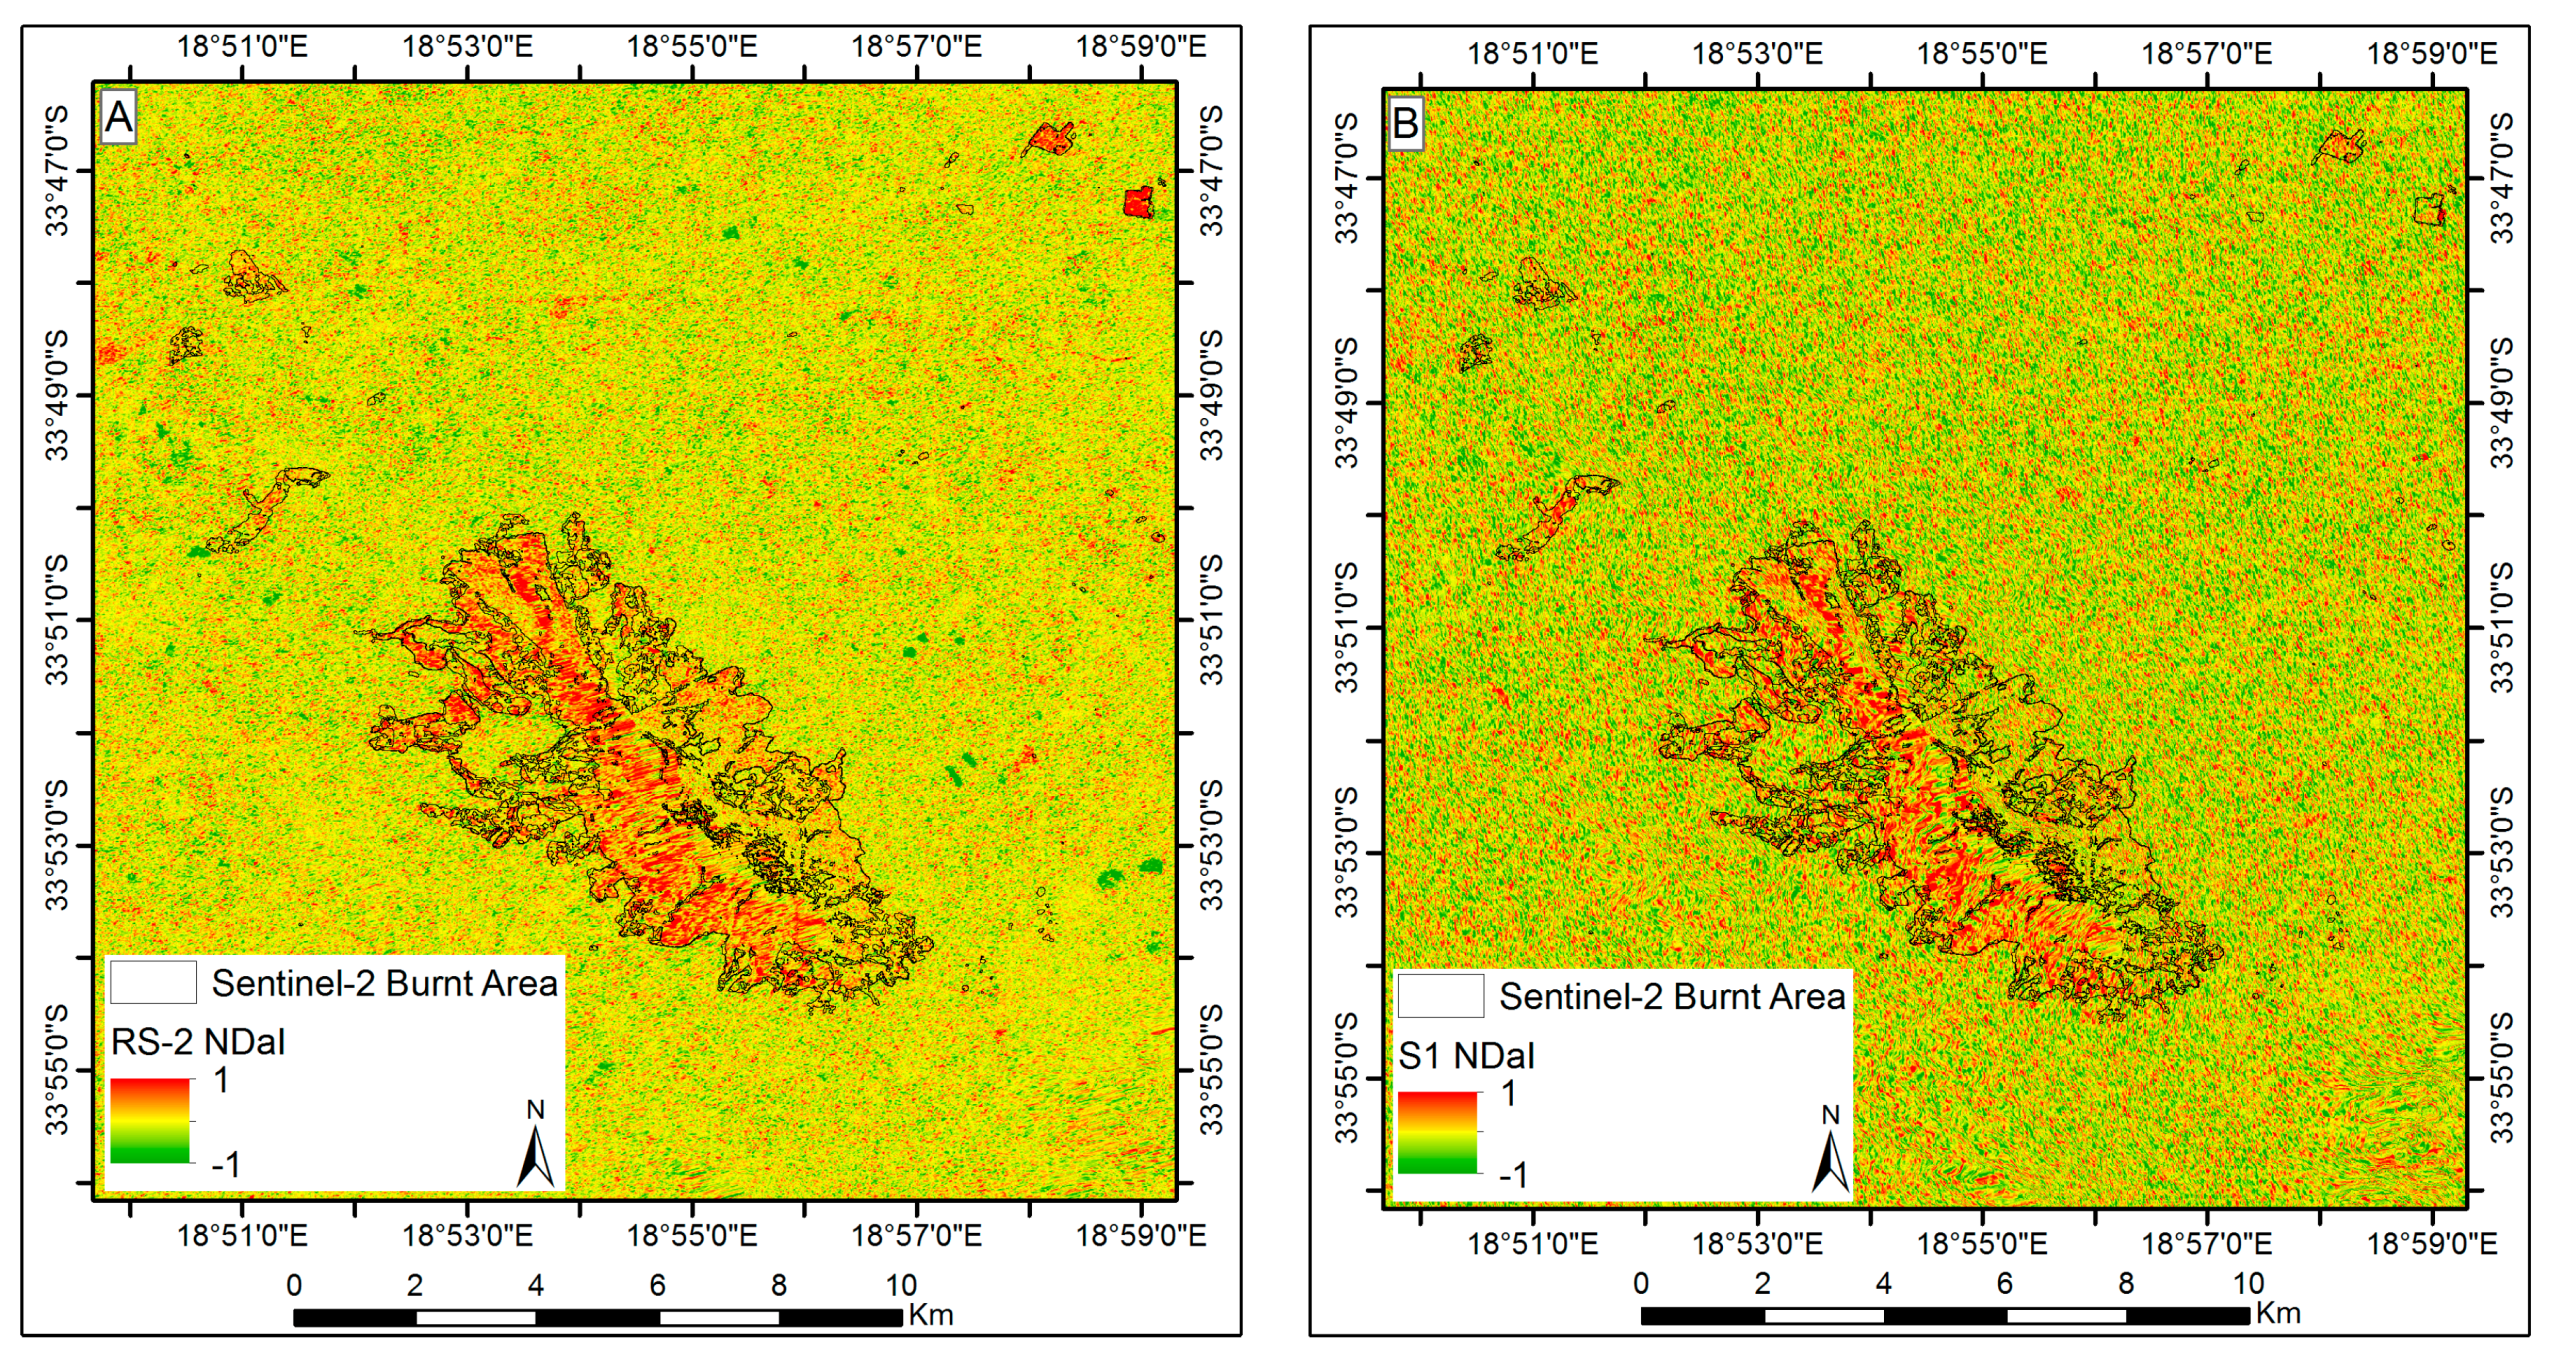
Figure 6.
Comparing the results of the Sentinel-2A burn scar extraction with the NDαI-derived burn scar from RADARSAT-2 (A) and Sentinel-1A (B).
Figure 6.
Comparing the results of the Sentinel-2A burn scar extraction with the NDαI-derived burn scar from RADARSAT-2 (A) and Sentinel-1A (B).
Figure 7.
The relationship between local incidence angle and error of omission for the “Burnt” class.
Figure 7.
The relationship between local incidence angle and error of omission for the “Burnt” class.
© 2017 by the authors. Licensee MDPI, Basel, Switzerland. This article is an open access article distributed under the terms and conditions of the Creative Commons Attribution (CC BY) license (http://creativecommons.org/licenses/by/4.0/).
Share and Cite
MDPI and ACS Style
Engelbrecht, J.; Theron, A.; Vhengani, L.; Kemp, J. A Simple Normalized Difference Approach to Burnt Area Mapping Using Multi-Polarisation C-Band SAR. Remote Sens. 2017, 9, 764. https://doi.org/10.3390/rs9080764
AMA Style
Engelbrecht J, Theron A, Vhengani L, Kemp J. A Simple Normalized Difference Approach to Burnt Area Mapping Using Multi-Polarisation C-Band SAR. Remote Sensing. 2017; 9(8):764. https://doi.org/10.3390/rs9080764
Chicago/Turabian StyleEngelbrecht, Jeanine, Andre Theron, Lufuno Vhengani, and Jaco Kemp. 2017. "A Simple Normalized Difference Approach to Burnt Area Mapping Using Multi-Polarisation C-Band SAR" Remote Sensing 9, no. 8: 764. https://doi.org/10.3390/rs9080764
Note that from the first issue of 2016, this journal uses article numbers instead of page numbers. See further details here.