1. Introduction
A disaster event occurs when a natural or anthropogenic hazard impacts human populations [
1]. Natural hazards such as severe thunderstorms, winter storms, tropical cyclones, floods, earthquakes, and landslides are frequently responsible for disaster events which can result in long-term and widespread loss of electrical power for affected locations. Other disasters may also occur from man-made hazards, such as industrial accidents, lack of maintenance on aging infrastructure, war and conflict, or similar incidents. Following the initial impact of these events, societal and community operations are disrupted (e.g., medical facilities, emergency management centers, etc.), leaving inhabitants vulnerable to environmental and health risks.
Loss of electrical power, either from direct impact to a power generation or distribution system, or indirectly from other objects like fallen trees and branches, may linger for several days or weeks following a disaster event. Accurate estimates of the number of outages needing repair following a storm are useful for calculating the time until restoration for a service territory. However, the total number of outages per storm is not known to most utilities until the storm has concluded. While predictive models exist to estimate storm outages from weather and geographic data [
2,
3,
4], near-real-time identification and independent monitoring of power outages can be difficult due to failures in communication and information systems. These systems are vital to disseminating information about the degree and extent of power outages, but are often dependent on the availability of electrical power which may be interrupted during a disaster event [
5]. Furthermore, synoptic tools and capabilities for monitoring power outage locations on a recurring basis are lacking.
Remotely-sensed satellite imagery can monitor power outages in disaster-affected areas by providing an additional source of independent, geospatial information. In particular, nighttime, visible-wavelength satellite images have the ability to monitor a wide range of reflected and emitted light from the Earth’s surface. Launched in October 2011, the National Aeronautics and Space Administration (NASA)/National Oceanic and Atmospheric Administration (NOAA) Suomi National Polar-orbiting Partnership (Suomi-NPP) provides the Visible Infrared Imaging Radiometer Suite (VIIRS) [
6]. The VIIRS instrument includes a Day/Night Band (DNB), a panchromatic, visible-near infrared channel (0.505–0.890 μm; 0.705 μm central wavelength) with 750 m spatial resolution at nadir. The DNB is highly sensitive to a broad range of artificial light emissions from city lights, boats, gas flares from mineral and oil extraction, lightning, and wildfires, in addition to moonlight reflected from cloud tops and land surfaces [
7]. Onboard radiometric gain settings adjust on-the-fly to capture a wide range of emitted or reflected, calibrated radiance (~5x10
−11 nW·cm
−2·sr
−1 to 0.02 nW·cm
−2·sr
−1). This calibration enables analyses of scene conditions between acquisition dates and times, while also capturing variability in relatively high radiance over pixels in suburban and dense urban areas [
8].
With regard to disaster response efforts, artificial nighttime light (NTL) emissions are of interest because they provide an indication of human activity patterns. Across the landscape, these emissions originate from residential single- or multi-family homes, local businesses, airports, factories and refineries, stadiums, government buildings and other facilities—in essence, a wide-range of different urban land uses. Disruptions to these light-emitting features can be observed and monitored in DNB data as darkened or unlit pixels in locations where urban infrastructure (i.e., lit pixels) are expected during normal conditions. To assist response efforts, semi-automated, near-real-time detections of light reductions or outages from the VIIRS DNB can be generated following disaster events that result in interruptions to electrical power delivery. This dataset, available on a daily basis for cloud-free portions of the entire globe, can be combined with locally-relevant geospatial information to predict outages. Such a retrieval strategy can be particularly useful for multi-day disaster events with widespread outages that can be mapped during multiple Suomi-NPP overpasses. In these scenarios, DNB-based power outage estimates can help provide insights into the timing and duration of initial loss of light emissions, in addition to the rate of light recovery as response efforts return electrical power to outage-affected areas. In this context, the aim of this study is to generate a power outage detection product based on the Suomi-NPP VIIRS DNB. This product is then used as input to a layered, feedforward neural network model that employs a synergistic combination of daily, corrected nighttime observations with electrical infrastructure and ambient population estimates to perform power outage predictions.
2. Background Literature Review
Prior to the VIIRS DNB, NTL have been studied using the Defense Meteorological Satellite Program (DMSP) Operational Linescan System (OLS). The OLS sensor and band combination has been used to map stable city lights [
9], estimate urban growth rates [
10], detect rural electrification in developing countries [
11,
12], model the spatiotemporal dynamics of electric power consumption [
13], and correlate NTL to impervious surface concentrations around the world [
14].
Previous studies have also demonstrated qualitative and quantitative techniques for estimating power outages from DMSP-OLS data. Elvidge et al. showed that qualitative, visual detection of power outages was feasible using the distribution of nighttime city lights [
15]. By comparing a reference pre-storm stable lights image to a single post-storm image, they were able to identify locations of missing or reduced lighting following Hurricane Fran in 1996 using a Red-Green-Blue (RGB) color composite image. Aubrecht et al. tracked the gradual recovery of power following Hurricane Wilma in 2005 by repeatedly generating RGB composites using the same methodology as Elvidge et al. [
16]. Kohiyama et al. extended power outage detection using DMSP-OLS by comparing post-storm radiance values, on a per pixel basis, to 95% and 99% significance levels of pre-storm radiances for a quantitative estimation of power outages following the western India earthquake in 2001 [
17].
The launch of Suomi-NPP VIIRS has allowed for the continuity of nighttime visible satellite applications. With calibrated, science-quality observations at a higher spatial resolution, this sensor provides an improved dataset over DMSP-OLS. Previous uses of this dataset have resulted in further mapping of stable city lights [
18], temporal nighttime city light compositing [
19], estimation of point source, stable light radiances [
8], political instability caused by human conflict [
20], correlation of NTL to GDP and electrical consumption [
21], modeling regional economies [
22], extraction and estimation of built urban areas [
23], and detection of oil slicks in scenes with moon glint present [
24].
The ability to detect power outages and monitor recovery has also improved with the release of VIIRS DNB data to end users in early 2012. Cao et al. used DNB radiance data to identify power outages from two severe weather events: the Washington, D.C. Derecho in June 2012 and Hurricane Sandy in October 2012 [
25]. Using a five-night, pre-storm averaged DNB radiance, coupled with single-night, post-storm radiance, they were able to estimate the percent of light reduction for each severe weather event. These percentages of normal (pre-event) emission estimates were validated using a publically-available outage dataset provided by the U.S. Department of Energy (DoE) and achieved agreeable results. Finally, Molthan et al. monitored outages and recovery during Hurricane Sandy in October 2012 via a qualitative, false color RGB composite product that built upon previous efforts using DMSP-OLS data [
26].
The application focus herein is to generate a near-real-time, nightly power outage detection product over individual DNB pixels. Building upon previous work, using the best available sensor with state-of-the-art post-processing, the following sections describe the methodology used to estimate reductions in city lights following the October 2012 landfall of Hurricane Sandy in Connecticut and western Massachusetts.
Section 3 provides a description of the improved VIIRS DNB retrievals, electrical infrastructure, and ambient population datasets used in this study, as well as the methodology used to combine these datasets into a synergistic power outage model.
Section 4 discusses the results from visualizing DNB-based power outage estimates and the accuracies of the neural network model. Finally,
Section 5 summarizes our findings and provides an insight to future work for this science application.
3. Data and Methodology
Previous studies have used data from the DMSP-OLS and Suomi-NPP VIIRS DNB to observe human activity patterns at night. These efforts post-processed images to omit cloud-contaminated and moon-lit observations using other near-infrared (NIR)/ infrared (IR) satellite bands and lunar phase information [
9]. Cao et al. attempted to account for lunar illumination on the observed DNB radiance by using a top-of-atmosphere (TOA) spectral lunar irradiance model [
27]. In this study, we expand the use of this quantitative approach by using a lunar bi-directional reflectance distribution function (BRDF), introduced by Román and Stokes, on VIIRS DNB data [
28]. The method quantifies the lunar radiance contributions, which we then use to estimate the true NTL patterns and variations within, and across, urban areas.
3.1. Gridded VIIRS DNB Data
The Terrestrial Information System Laboratory at the NASA Goddard Space Flight Center (GSFC) has prototyped a 30 arc-second (0.008333°, ~1-km), nightly, gridded BRDF-corrected DNB product, which we have used in this study as a baseline of nighttime satellite observations over the continental United States (CONUS). This experimental product seeks to provide calibrated, gridded VIIRS DNB data for a variety of nighttime satellite remote sensing science applications. Building upon the NOAA operational DNB radiance product delivered directly from the VIIRS sensor, Román et al. also provide a gridded version of the NOAA operational VIIRS cloud mask (VCM), nightly lunar phase information, and a gridded version of the NASA VIIRS fractional snow cover mask [
28]. Newly introduced capabilities include an improved BRDF retrieval, which allows for a reduction of the influence of moonlight over land pixels to further reduce the impact of moonlight on inferences of power outages. A provisional version of this product will become available through the NASA Level-1 and Atmosphere Archive and Distribution System (LAADS) in early 2017 [
29].
For test and evaluation purposes described herein, the experimental NASA DNB product is comprised of both primary and ancillary science data set (SDS) fields. The first layer contains: (1) a TOA DNB radiance, and (2) a lunar BRDF-corrected DNB radiance that corrects for the contribution of moonlight over land, both in units of nW·cm−2·sr−1. The ancillary layer contains all quality assurance (QA) flags for the corresponding DNB radiance values. These ancillary datasets allow TOA and BRDF-corrected radiance values to be quality controlled in analyses based upon cloud cover, snow cover, and correction for moonlight contributions to the observed radiance, isolating the highest quality DNB data.
The Mandatory QA Flag (band 1 of the QA GeoTIFF) is the result of a four-test process and provides fundamental corrections that apply to most science applications requiring cloud clearing and consistent pixel geometry. For a pixel to be assigned as ‘High Quality’, the sun must be below the horizon (i.e., solar zenith angle (SZA) > 101°, or nighttime observation), the VCM must have flagged the pixel as confidently clear, the pixel chosen for the final gridded product must not be in aggregation zones 29–32 (~50°–60°) of the original DNB swath, and a lunar BRDF correction must have been applied using a high-quality BRDF inversion [
30].
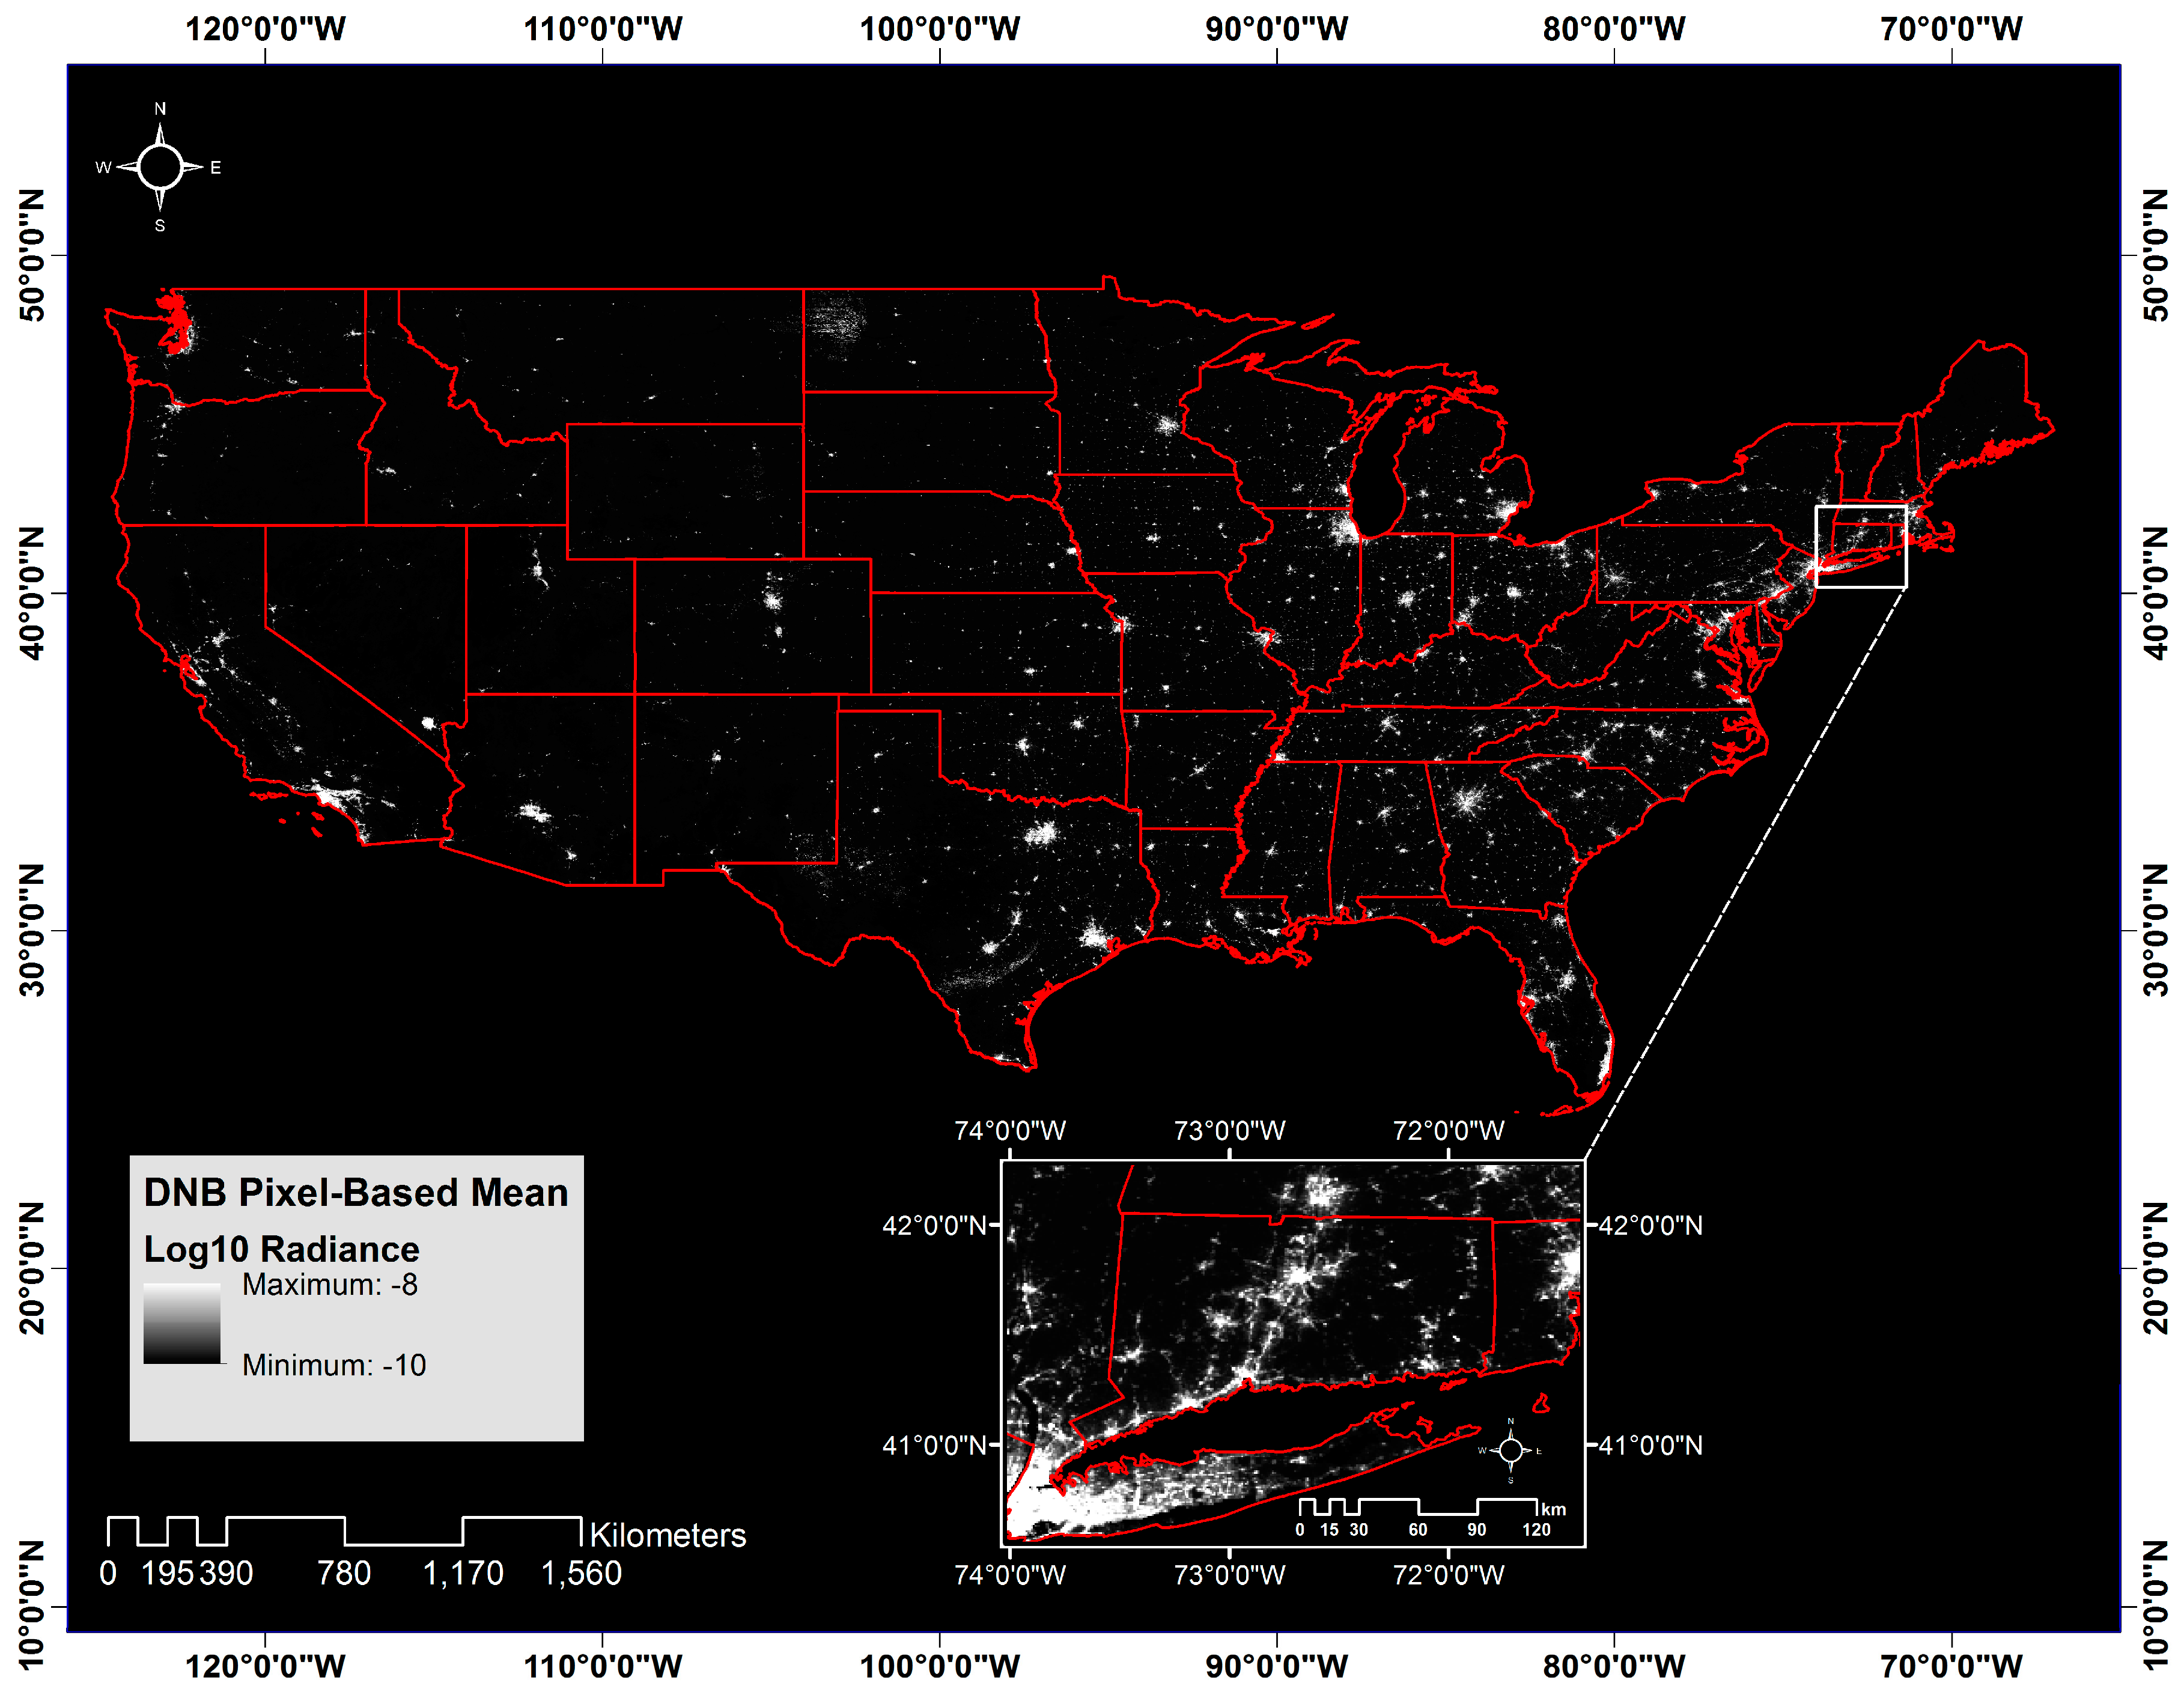
With the inclusion of a newly-generated, nightly lunar BRDF model accompanying the DNB dataset used in this study, observations during all lunar phases were included in the high quality period of record. Availability of the lunar BRDF correction provides an improved means of removing the impact of moonlight on city light emissions so that the lunar BRDF correction subtracts moonlight contributions from the resulting DNB imagery. This “turning off the moon” approach reduces the impact of changing levels of moonlight on observed radiances over populated areas, which is a major source of uncertainty when attempting to ascertain changes in light emission that result from disaster events and subsequent power outages or recovery [
25]. The resulting, BRDF-corrected DNB imagery is a depiction of city lights and lights from other activities like mineral extraction and gas flaring, as in
Figure 1, which shows pixel-based mean radiance values over CONUS between 19 January 2012 and 31 December 2015.
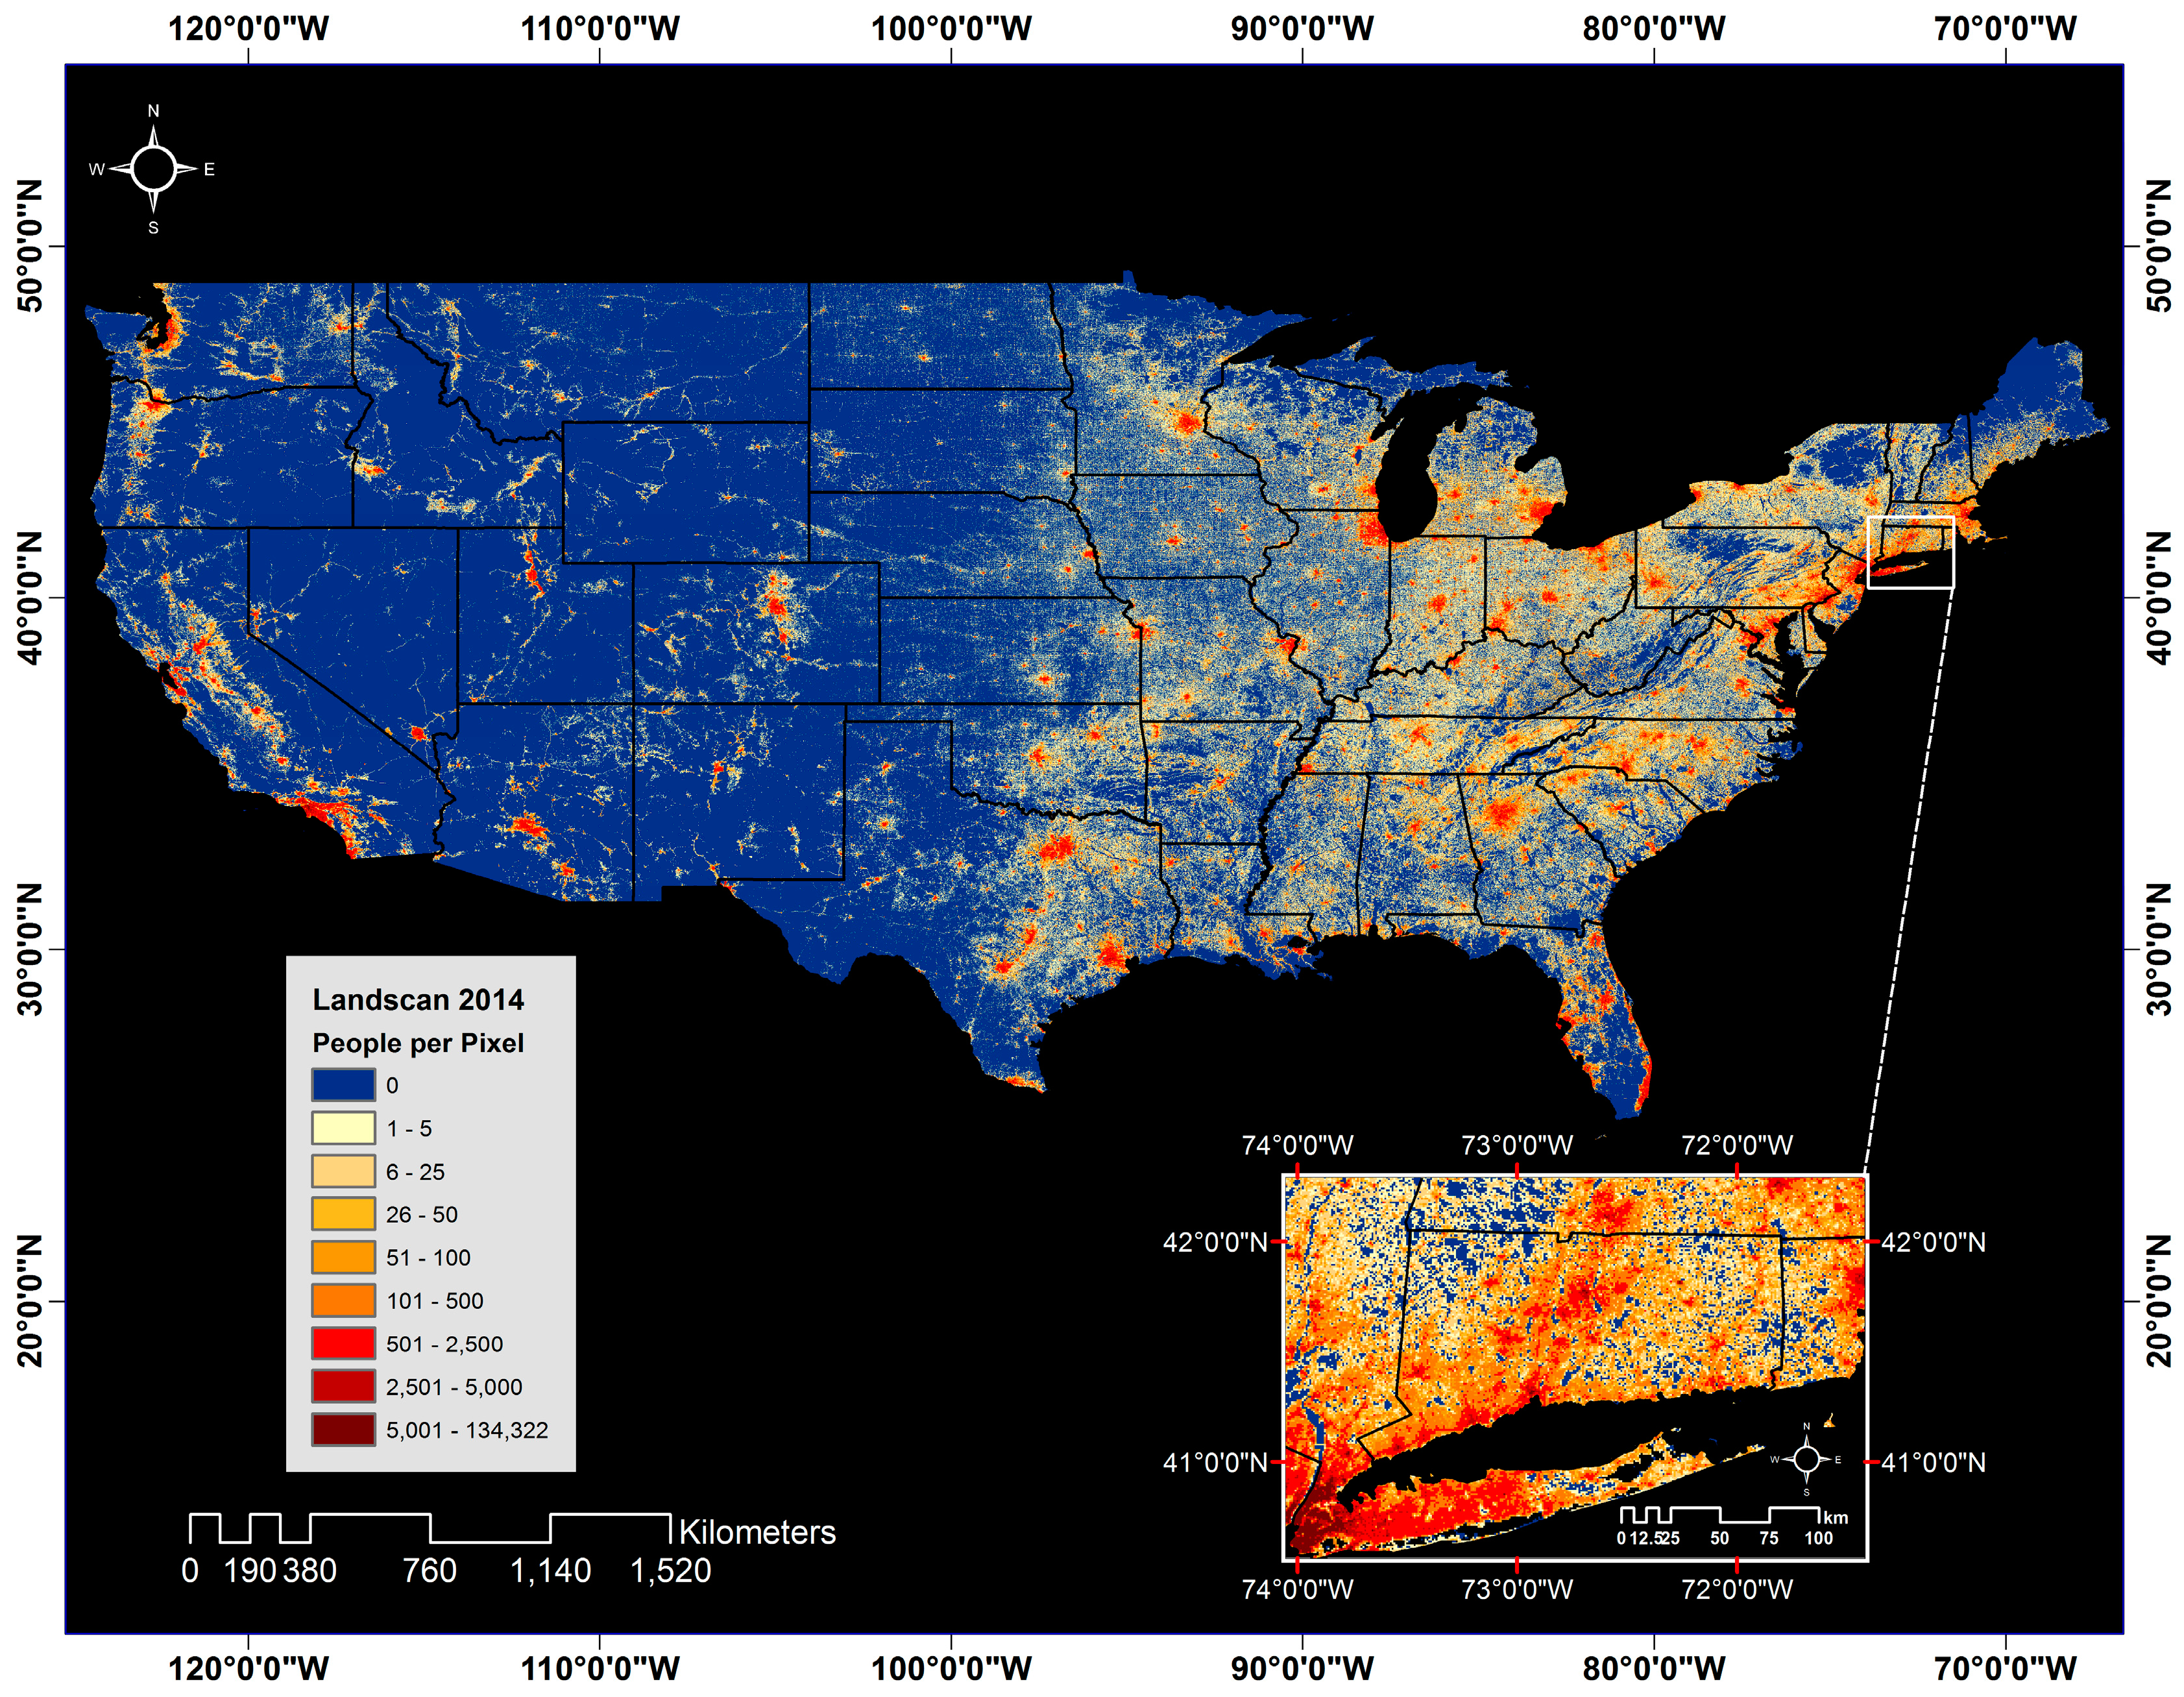
3.2. 2014 Oak Ridge National Laboratory (ORNL) Landscan Population Raster
As a reference layer for the comparison of DNB emissions to reported power outages, we used the 2014 global Landscan population dataset produced by ORNL (
Figure 2). This product is a 1 km raster image that estimates ambient (daily average) population on a latitude/longitude grid, which matches the DNB imagery. Each pixel is assigned an integer population count. Acknowledging the frequent movement of humans on a daily, weekly, and annual scale, the intent of Landscan is to provide a model of
all human movement and not just permanent settlements [
31], which makes it useful for outage prediction models. Empirically, we have found that many utilities tend to update and maintain the electric grid to benefit the largest number of customers possible; therefore, the Landscan population data may also provide implicit detail on attributes of the grid that we have not modeled directly (i.e., age of poles or equipment).
Inputs to Landscan include multiple layers of geographic data including Census information, administrative boundaries, land cover, elevation, slope, coastlines, and high-resolution satellite imagery. Each of these is then layered using a “smart interpolation” technique [
31]. In each country, the modeling process calculates a “likelihood” coefficient of the most likely population for each grid cell before comparing its results to Census data as a control check for the final output. Finally, a total population count is assigned to each pixel proportionally to the calculated population coefficient and census estimate [
31].
3.3. 2014 U.S. Census Metropolitan Statistical Area (MSA) Shapefile
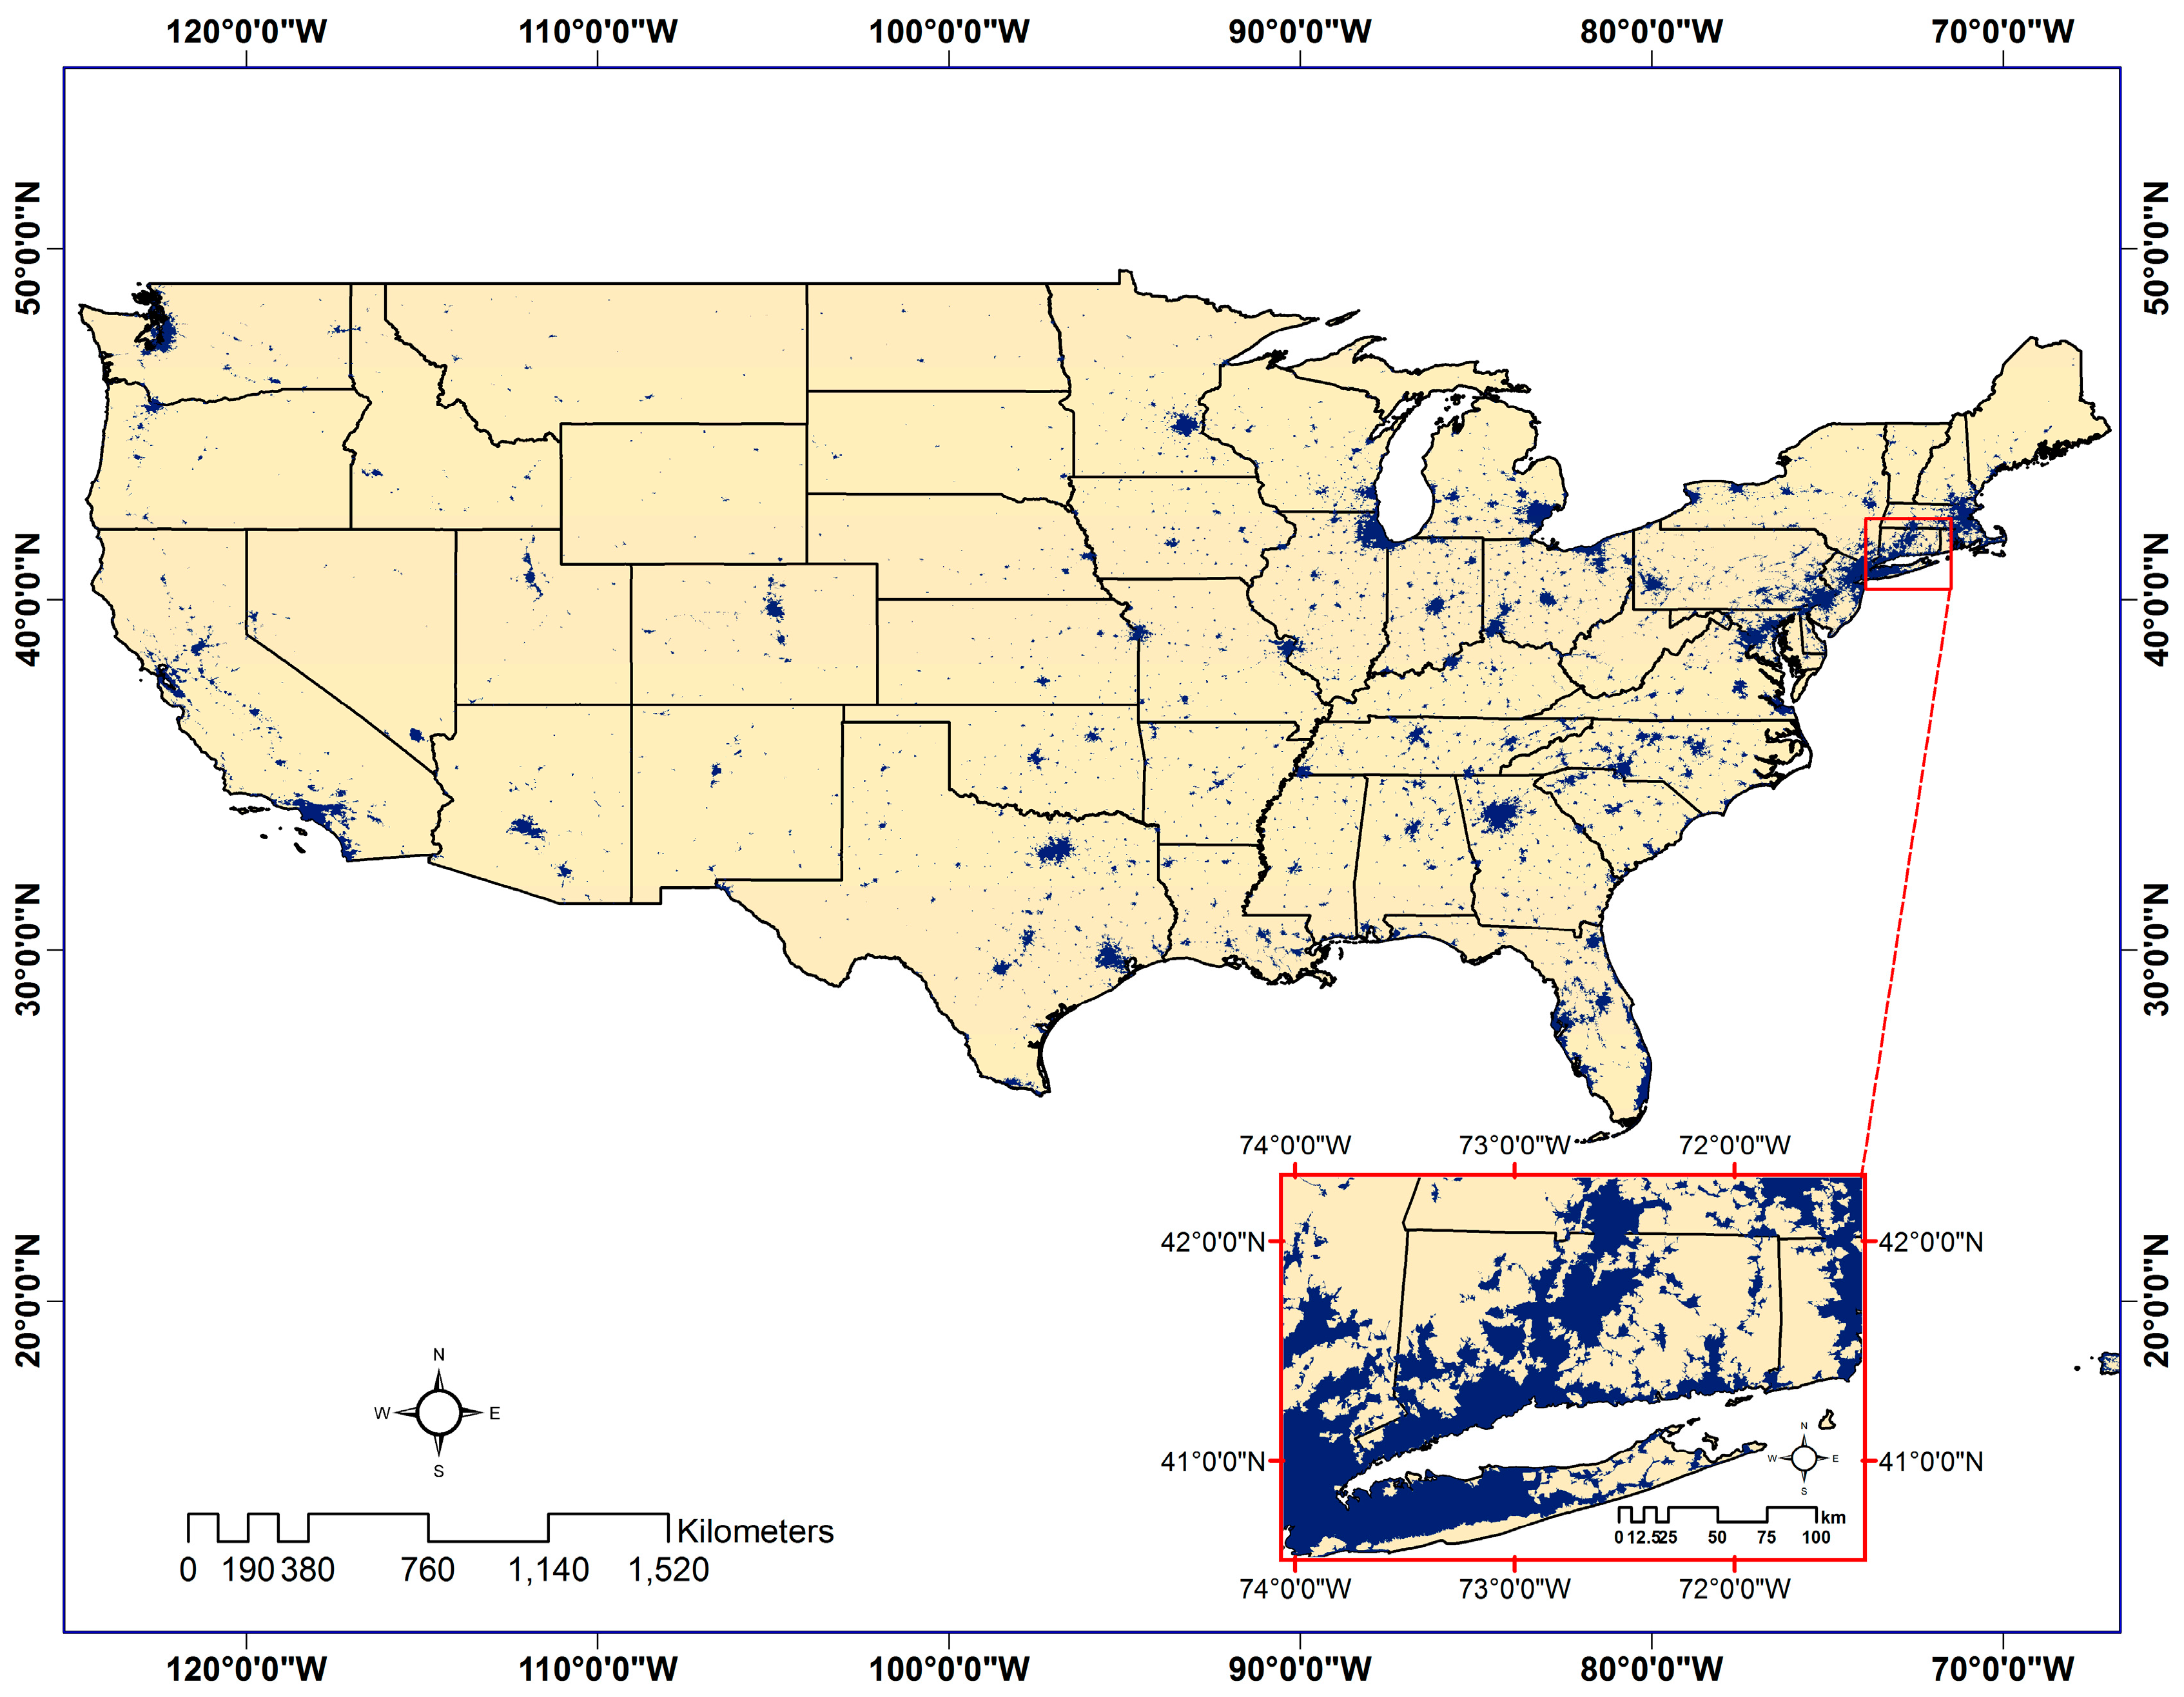
To limit the DNB product to areas of dense population, we employed a 2014 U.S. Census metropolitan statistical area (MSA) shapefile as a data mask (
Figure 3). The DNB data product does not provide a distinction between anthropogenic and natural sources of light emissions. Therefore, it is essential to use a city-extent shapefile to isolate light sources in municipal areas from all other emissions or reflective features in the imagery.
The MSA shapefile delineates U.S. urban space into two unique classes: urbanized area and urban cluster. An urbanized area is a “central county” or county-equivalent size area of land in which at least 50% of the population resides in an urban center with 10,000 or more people. An urban cluster is defined as having at least one feature of 10,000 and 50,000 or more people located in a single urban area, as defined by the previous class. The Census further classifies urban landscapes into metropolitan and micropolitan statistical areas that are used in this study. A metropolitan statistical area must include at least one urbanized area of 50,000 or more inhabitants. Micropolitan statistical areas must include one urban cluster of at least 10,000 but less than 50,000 people [
32].
3.4. Generating a Power Outage Detection Product
3.4.1. Case Study: Hurricane Sandy
Hurricane Sandy was an extra tropical cyclone by the time it made landfall in New Jersey during late October 2012, directed onshore by a trough in the eastern United States and a ridge over far eastern Canada [
33]. When it hit Atlantic City, New Jersey at 20:00 EST on 30 October 2012, 90 mph (40.23 m·s
−1) winds were recorded, not far from the official landfall at Brigantine, New Jersey with winds of 80 mph (35.76 m·s
−1) [
34,
35]. Strong, sustained winds and accompanying storm surge created ideal conditions for a devastating impact to the surrounding areas. The storm left an estimated $78–$97 billion in damage, second only to Hurricane Katrina as the costliest storm in the past 24 years [
36].
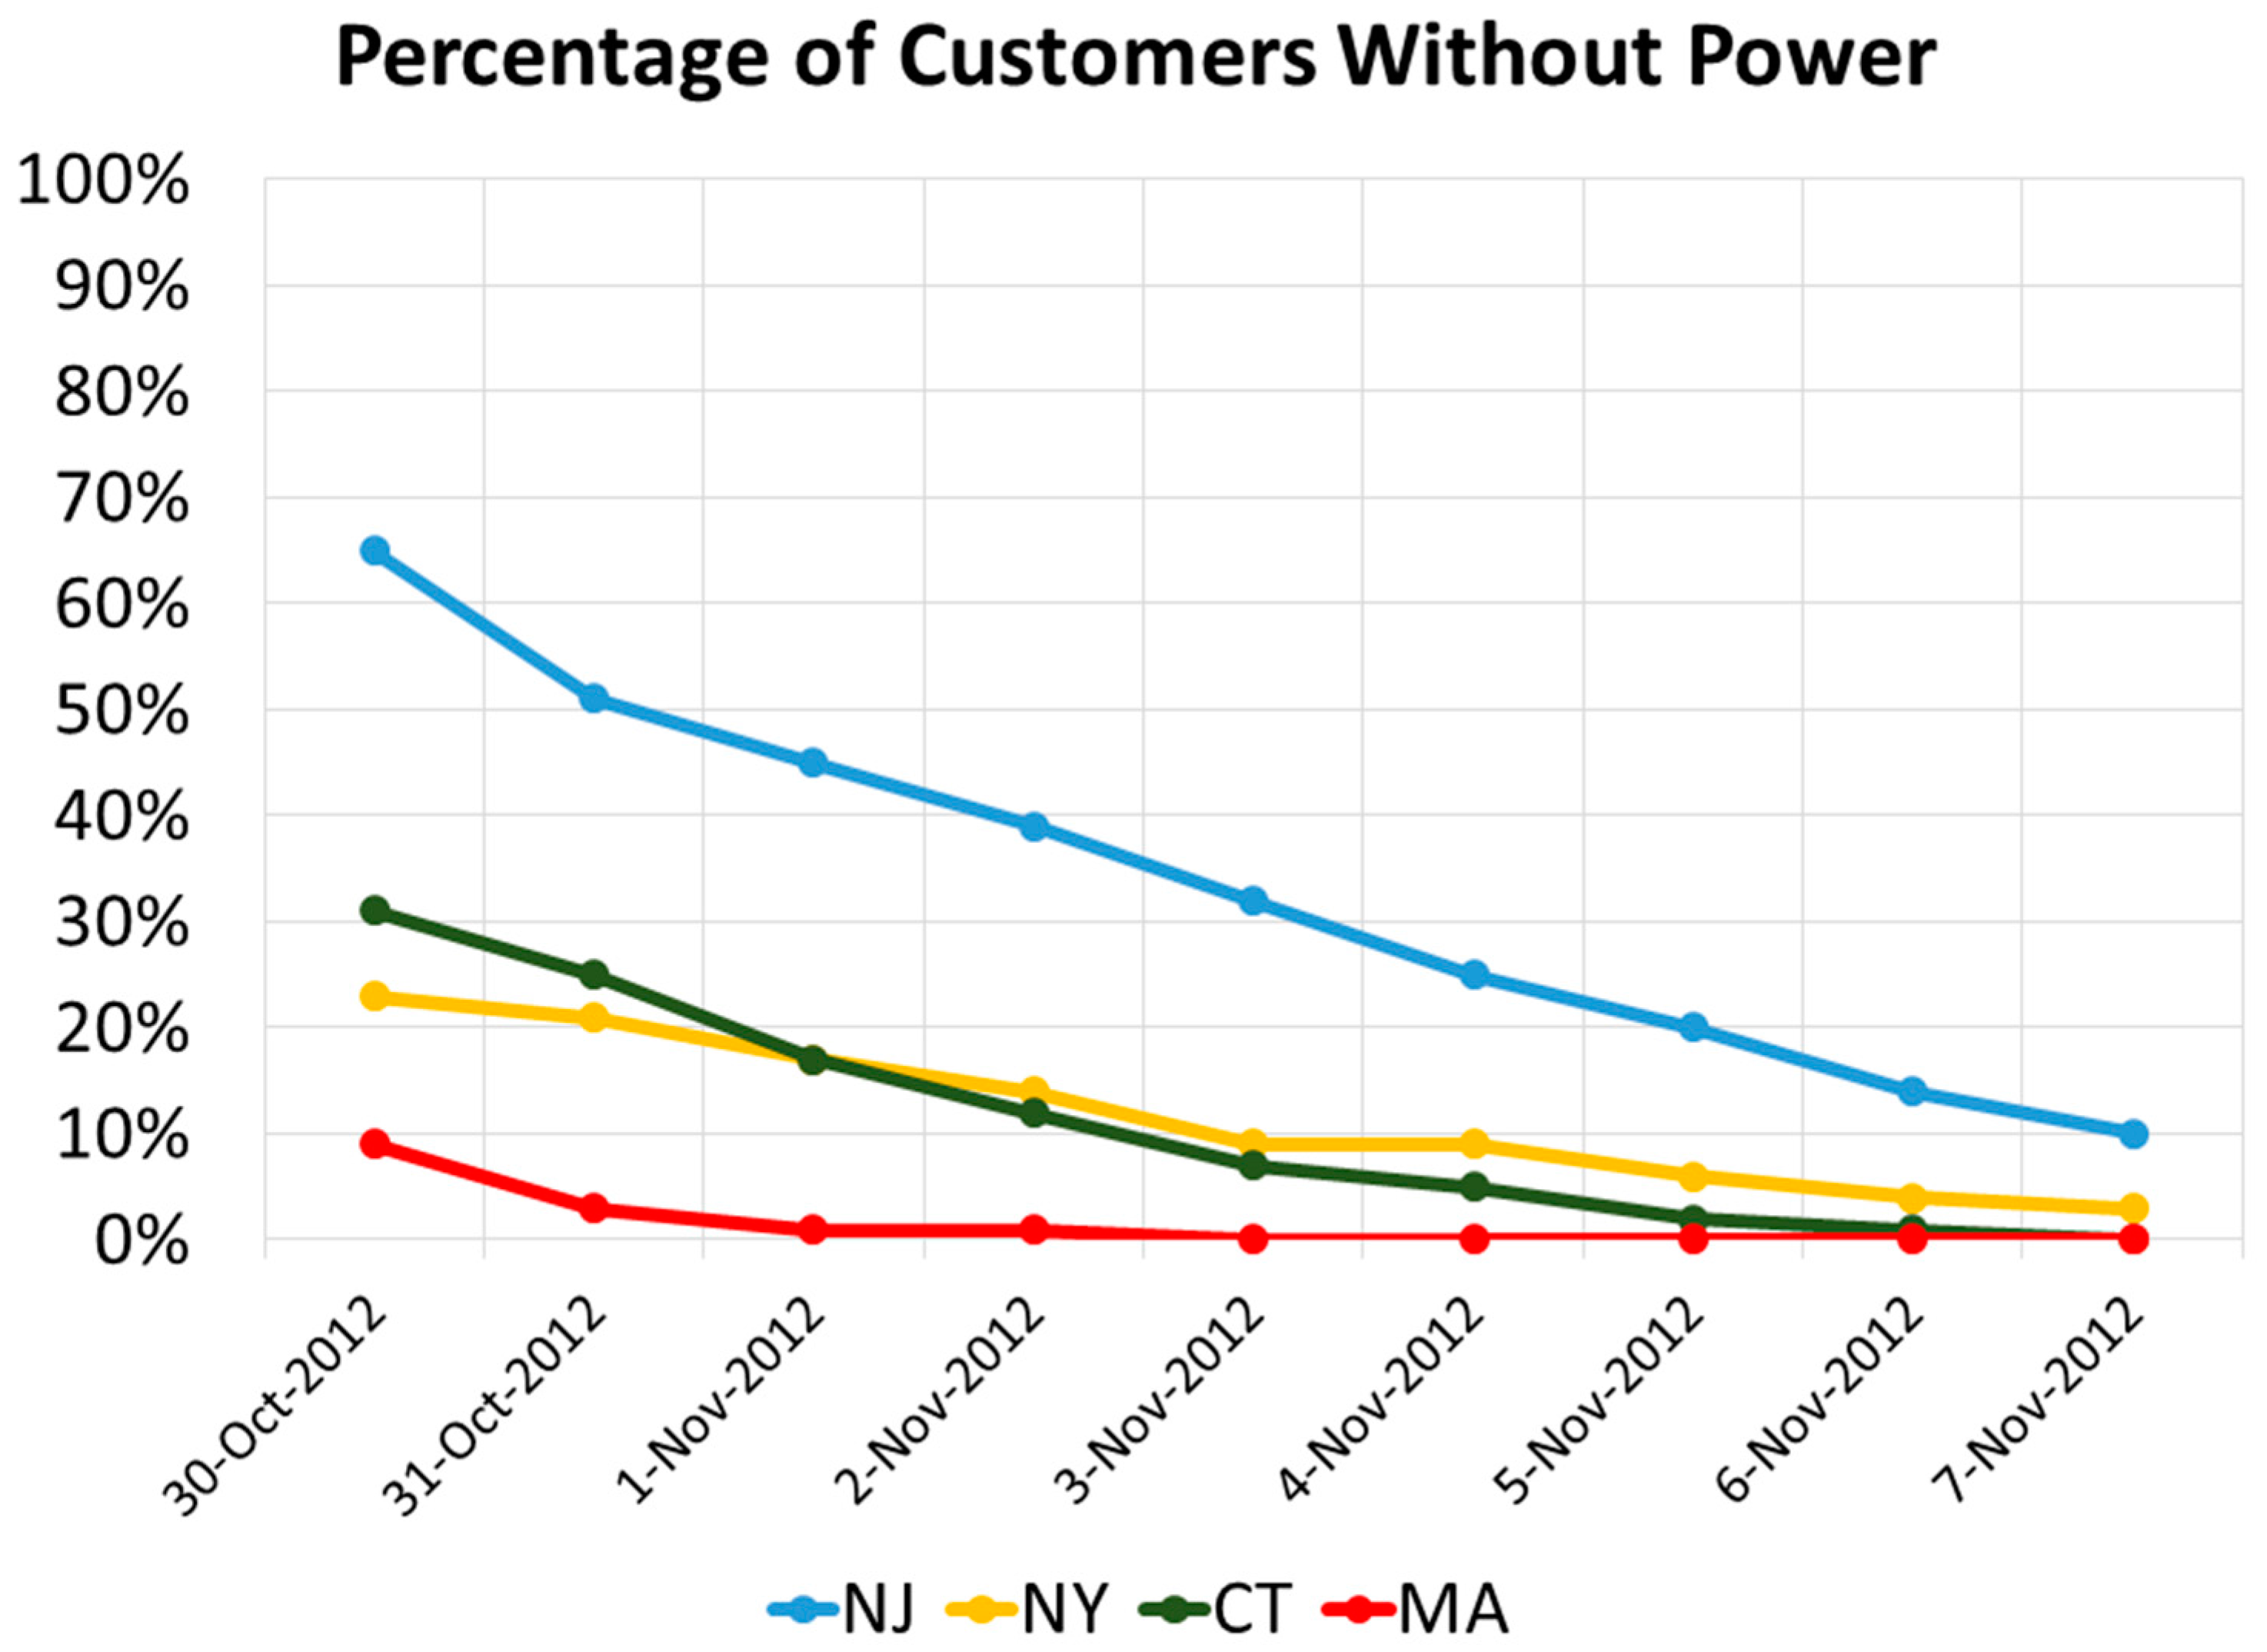
In total, 21 states from Indiana to Maine were impacted by disruptions to the power grid as a result of strong winds, flooding, storm surge, and snowfall related to Hurricane Sandy. In Lower Manhattan, the power grid was suspended as a precautionary measure for several days. Along the New Jersey coastline and into Long Island, New York, power outages peaked on 30 October and persisted through 7 November (
Figure 4). By 7 November, 84% of all affected customers had power restored to normal levels; however, customers in coastal New Jersey were not repaired until a week and a half later due to particularly acute damage in this area [
36].
3.4.2. Data Record and Processing
Pre- and post-event DNB retrievals were analyzed to identify short-term reductions in NTL emissions and the gradual recovery to normal levels as utility crews restored power. The full record of data used in this case study spanned 30 July through 6 November 2012. In addition, 30 July–28 October (90 nights) provided a pre-event baseline of “normal lights”, defined as the pixel-based
minimum radiance, and 30 October–6 November (eight nights) served as post-event, single images to compare against the pre-event composite where cloud-free observations allowed for comparison, based upon detections from the VIIRS cloud mask. Furthermore, 5 November was excluded from analysis due to complete cloud cover over the affected area, leaving a total of seven post-event images available for analysis. Each image was prepared using the DNB lunar BRDF-corrected retrievals and ancillary quality flags, as described in
Section 3.1, to remove poor-quality observations.
3.4.3. Percent of Normal Product Using a Pixel-based Minimum Composite
As an alternative to the qualitative, visual analysis provided by RGB composites used in previous studies, we produced a percent of normal DNB emission product as a pixel-based ratio comparing current observations (i.e., those following Hurricane Sandy) to “normal” pre-event radiance values. This approach follows previous efforts by Cao et al. in estimating power outages and builds upon their work by using an improved DNB product available for Hurricane Sandy [
25].
Cao et al. used a five-night, pre-event running average to represent “normal” light distributions [
25]. Accordingly, we calculated the percent of normal pre-event light emissions using the 90-night pre-event minimum composite as the “normal” distribution of NTL in the Sandy impact region (i.e., Mid-Atlantic and New England states) and estimated power outages by comparison to post-event retrievals. Clouds and snow were filtered from the seven post-event retrievals before comparison. For this study, we assumed that any post-event radiance, which fell below the minimum value from the preceding 90 nights, would indicate a reduction in light emissions, and, thus, a potential outage for the affected pixel(s). Here, use of the lunar BRDF correction was critical, as reducing contributions of varying moon phase allows for a greater sampling of nights to obtain the multi-day baseline composite. Otherwise, the lunar cycle and increase (or decrease) in lunar illumination would confine the baseline composite solely to cloud-free observations during new moon periods. Percent of normal emissions for this study was then defined using the following:
where
Post is each single, post-event image and
Pre is the pre-event baseline composite. The “Percent of Normal” product was then generated for all seven post-event images over cloud- and snow-free pixels. All available pixels with radiance less than the 90-night pre-event minimum composite were used as covariates in the neural network model, where pixels closer to zero were more likely to have experienced an outage and those closer to one hundred were likely less affected. It is important to note the full range of percent of normal estimates (0–100%) were preserved in our model and no threshold was used to “define” an outage.
3.5. Power Outage Data and Predictive Model for Power Outages
3.5.1. Power Outage Data
Reported power outage data for Hurricane Sandy were received from the Eversource Energy—Connecticut and Eversource Energy—Western Massachusetts service territories. Outages were defined as individual locations that require a two-man restoration crew to manually intervene and restore power, which are recorded at the nearest upstream isolating device (“asset”) to a fault (i.e., downed powerline, broken pole, fuses, reclosers, switches, and transformers). The count of isolating devices per 1 km grid cell were included in the model to represent the amount of infrastructure in a given area, which has been shown to be an important offset in recent studies (e.g., the count of outages per grid cell cannot exceed the count of isolating devices within a grid cell) [
3,
4]. Furthermore, no dynamics of the actual power grid infrastructure have been included in our study, as each grid cell is treated as spatially independent.
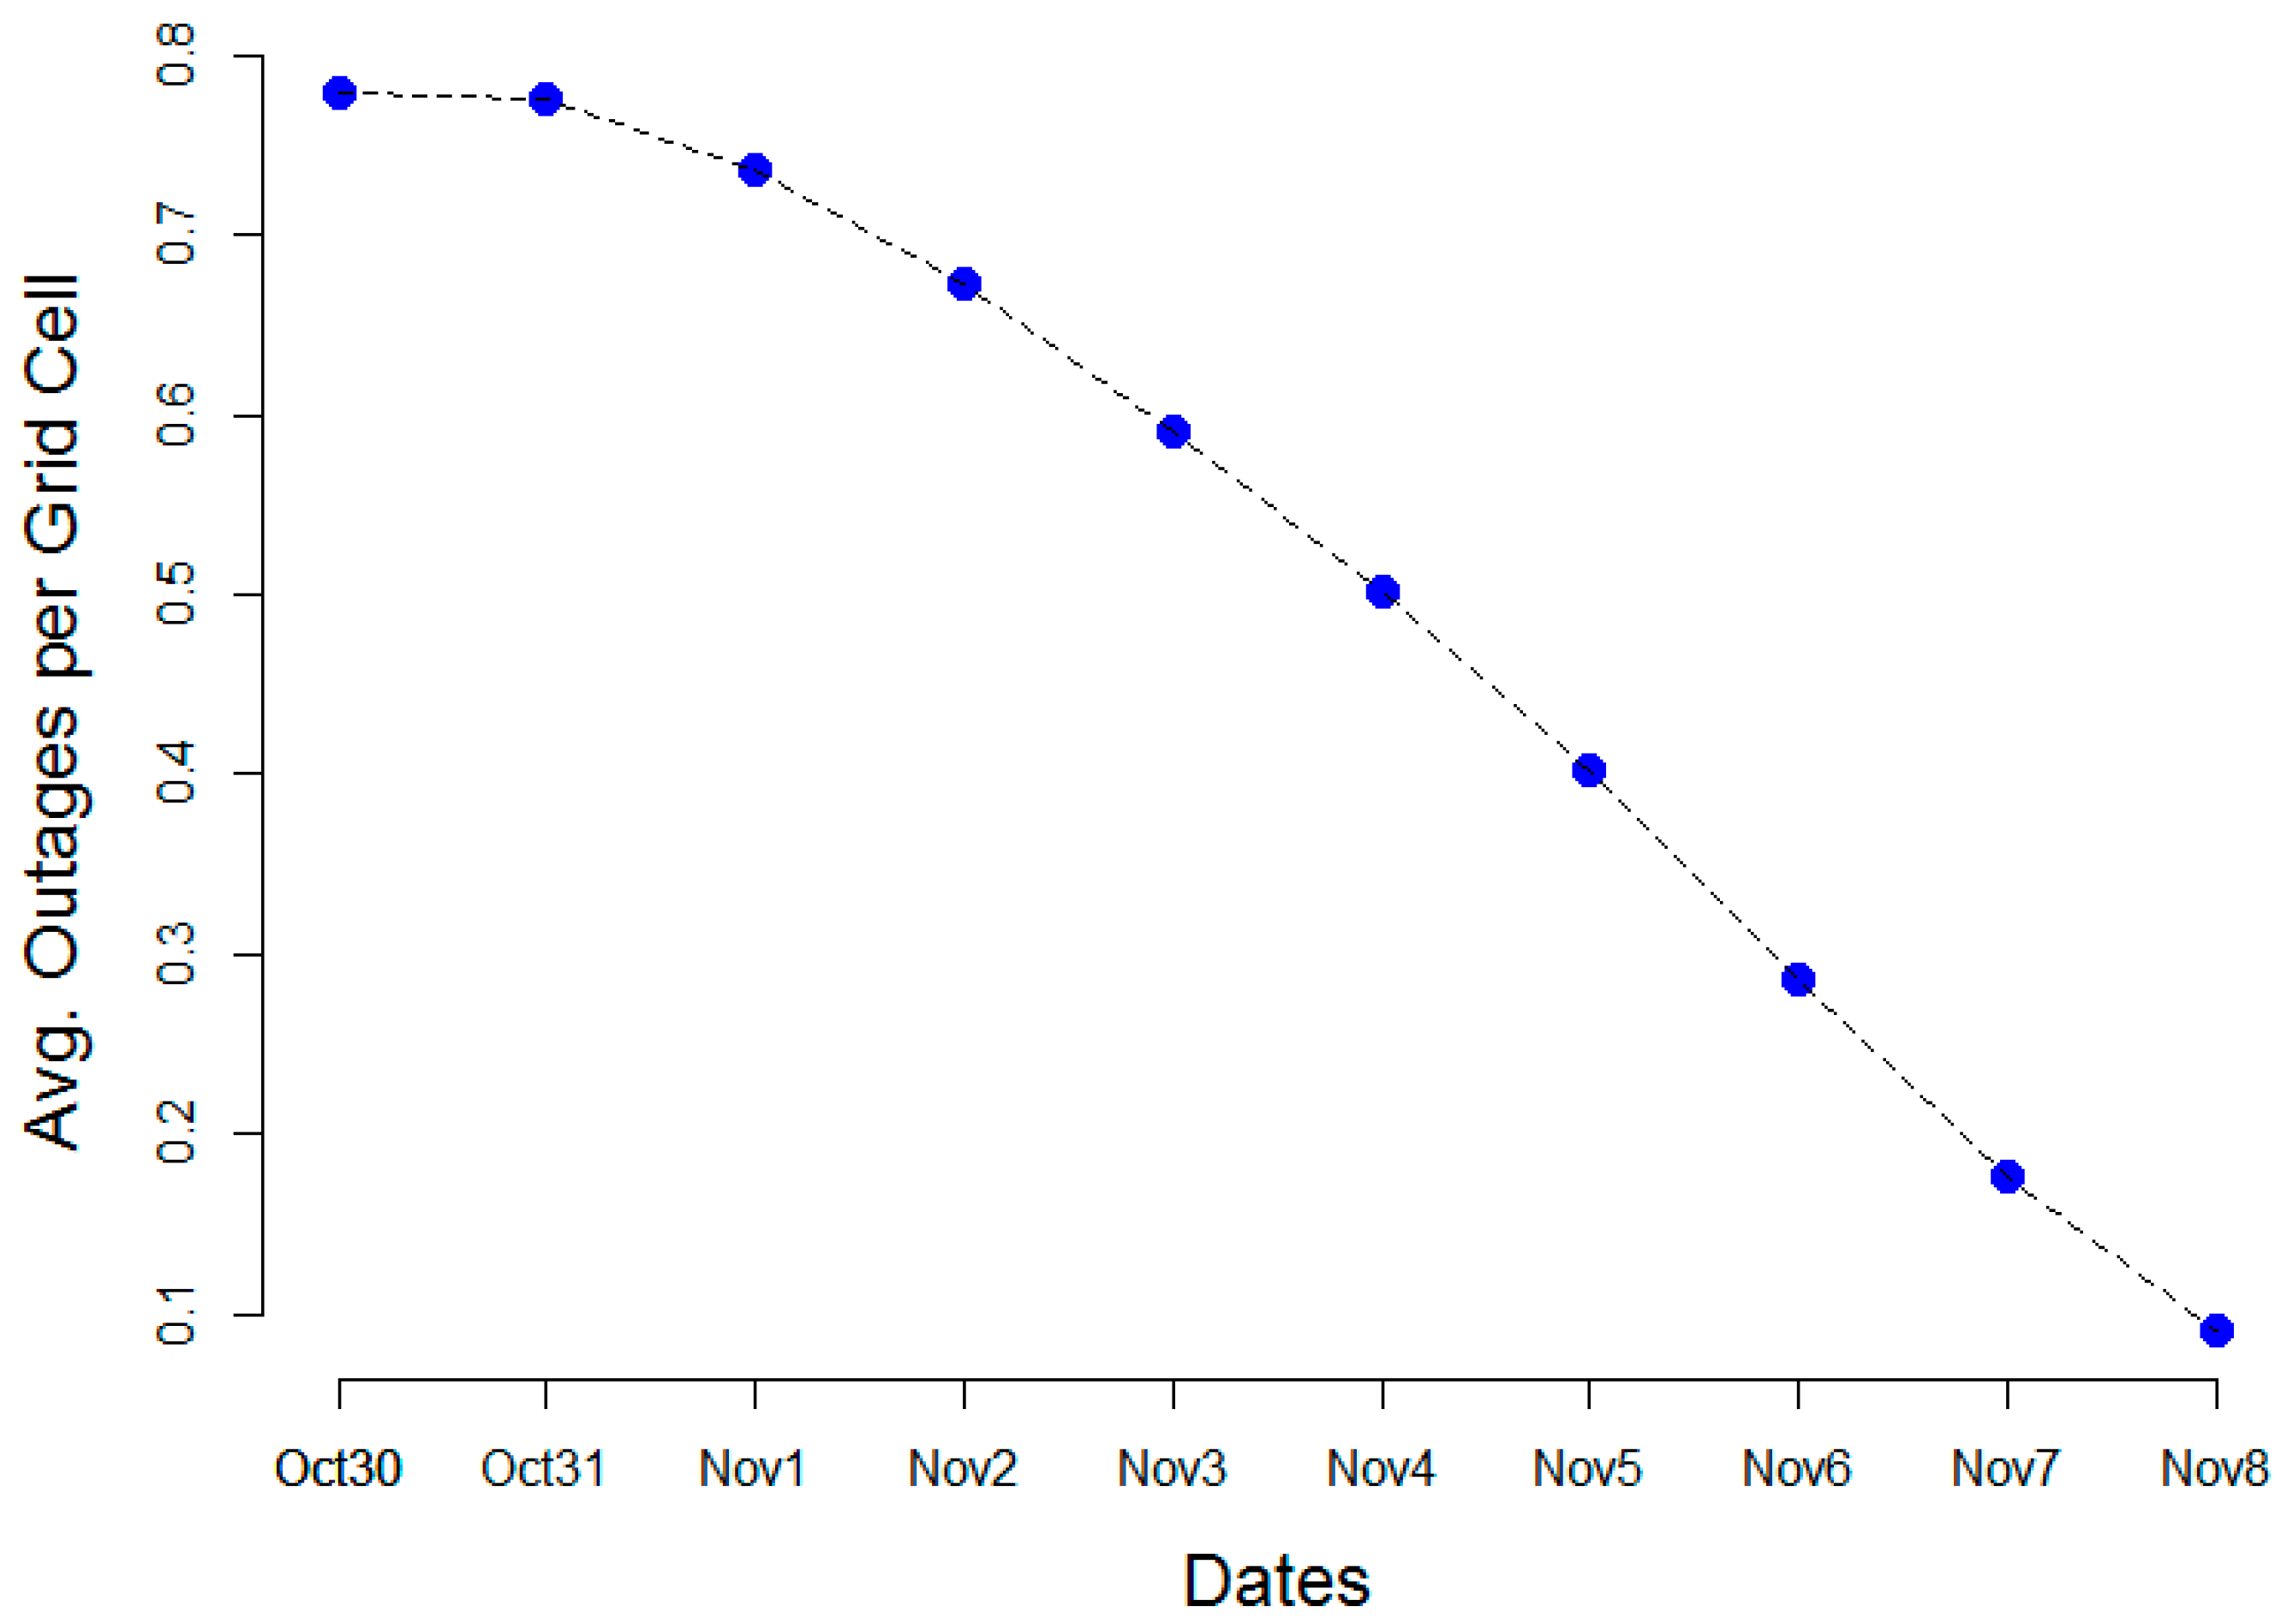
The outage data used here covers 20,195 1 km grid cells across a study area that includes the majority of Connecticut and parts of western Massachusetts. Over 400,000 isolating devices are maintained by Eversource across 5900 square miles of service territory in Connecticut and western Massachuessetts. The average number of outages per grid cell per day in
Figure 5 shows a decreasing trend, demonstrating how outages were repaired by line crews each day following the storm, comparable to overall statewide trends previously shown in
Figure 4.
To evaluate the DNB-estimated outages against reported information provided by Eversource Energy, DNB retrievals at the pixel-scale were converted to a vector “fishnet” spatial grid. The cell size of this grid was generated to match the ~1 km DNB pixel size and the extent made identical to the spatial coverage of utility information provided by Eversource Energy. In this fashion, each post-event percent of normal DNB retrieval was separately imported and subset to the geographic fishnet grid (
Table 1). Although Eversource Energy power outage data exists for each grid cell on all nights of the storm, the count of valid grid cells was determined by cloud- and snow-cover in the DNB product and containment within the MSA shapefile.
Combining the Eversource Energy reported outages and DNB-estimated outages began with a conversion of raster DNB percent of normal values to a vector point shapefile using the centroid location of each pixel. With a common file format achieved, the resulting point shapefile was “joined” with the Eversource information for grid cells that contained a valid DNB percent of normal value. Grid cells with cloud- or snow-cover were assigned known fill values. The single-night fishnet grid now contained a DNB percent of normal attribute for each grid cell free of cloud- or snow-cover. This process was repeated for each post-event night using the corresponding percent of normal product to produce a single fishnet grid containing DNB percent of normal estimates for all post-event nights. Landscan 2014 population values were attached to each grid cell for input into the outage prediction model. Finally, the full fishnet grid was clipped using the MSA shapefile as a mask, to create the final study area domain. The number of outage locations for each post-event night and the spatial extent of the fishnet grid are shown in
Figure 6.
While there is a temporal disparity between the DNB product (nightly satellite overpass times between 01:30 and 03:30, local time) and Landscan 2014 (daytime-focused ambient population estimates released once every four years), the combination of both data sets offers an indication of electrical consumption over a full 24-hour period. Landscan provides a proxy for the locations of highest concentrations of electrical consumption (i.e., more people consume more electricity). Customer data, specifically on residential and commercial utility meters, would be a more appropriate data source for estimated power consumption, but this was not available for use in our study. DNB observations provide a complimentary input to our model by identifying locations of power consumption (NTL correlates to population centers), but whose post-event radiances have been reduced.
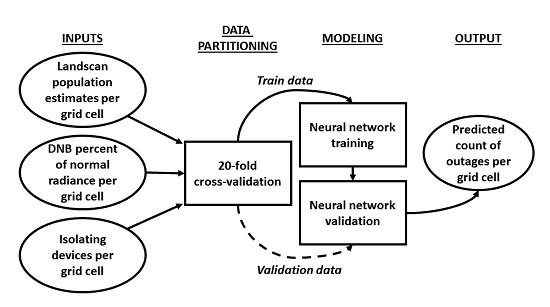
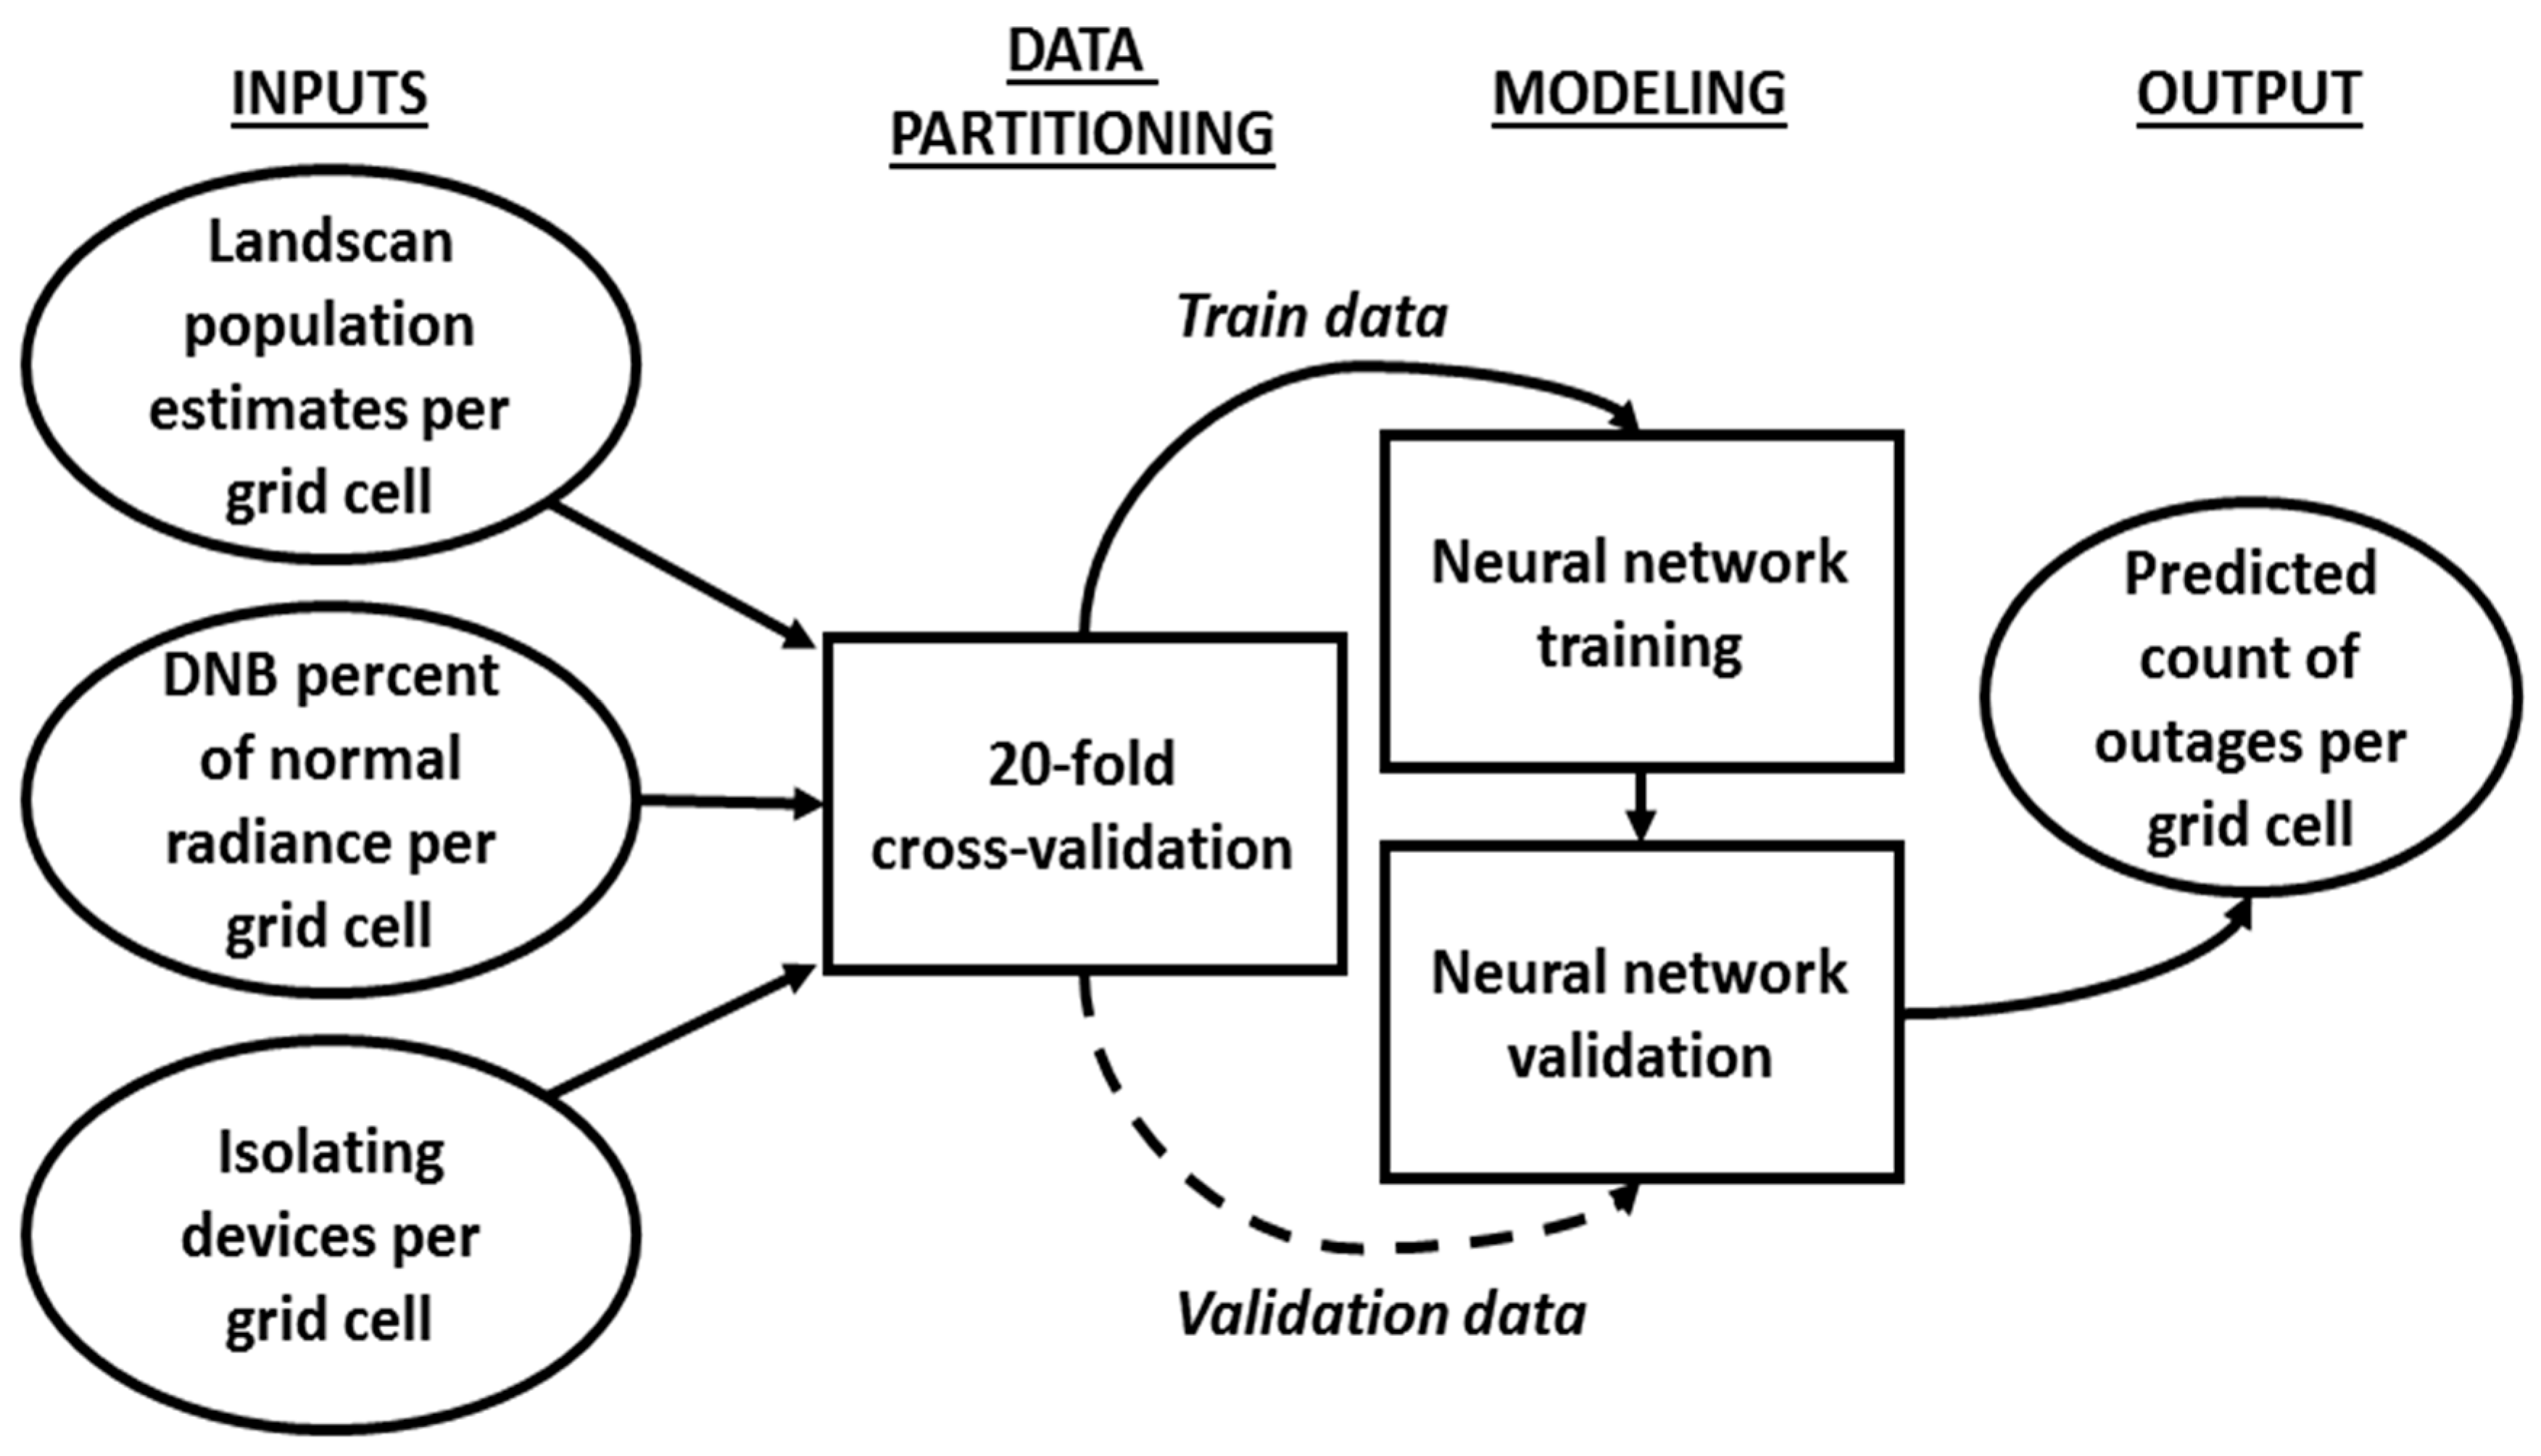
3.5.2. Artificial Neural Network Description
A layered, feedforward Artificial Neural Network model was used to predict the number of power outages per grid cell (response variable) from Landscan 2014 population estimates, isolating devices (assets), and percent of normal DNB estimates per grid cell across Connecticut and western Massachusetts (
Figure 7). This type of model defines each link in the network as a nonlinear activation function that maps the input nodes into the output node. In our study, the three input nodes (e.g., one for each explanatory variable) were inputted into a single hidden layer with three nodes, which went to a single output node. We selected this model for its ability to discern nonlinear patterns [
38]; a feature that has proven useful in a variety of remote sensing studies for change detection and extraction of damaged areas, where the objective is to assess substantial changes between single pixel-based elements [
39,
40,
41]. Other types of machine learning models such as random forest [
3,
4] and Bayesian additive regression trees [
2,
4] have been used to relate weather and geographic data to outages, but we believe that this is the first attempt at synergistically combining electrical infrastructure, population, and satellite observations of NTL to quantitatively estimate outages needing repair. To prevent overfitting and ensure model accuracy, we performed a 20-fold cross-validation such that 95% of the data was used for training and 5% of the data was used as an independent validation (without replacement). Error metrics from each fold (model validation) are discussed in
Section 4.2.
Metrics to evaluate model performance include mean error (ME), mean absolute error (MAE), root mean square error (RMSE), normalized root mean square error (nRMSE), Pearson correlation coefficient (r), and Nash–Sutcliffe efficiency (NSE). ME was used to show if the model was biased, while MAE was chosen because it provides the average magnitude of the error. RMSE helps evaluate the model for larger prediction errors. The nRMSE is simply the RMSE divided by the mean of the actual outages per grid cell, serving as the relative RMSE. While the ME, MAE, RMSE and nRMSE metrics are related to the error per grid cell, the r and NSE provides additional information on the spatial accuracy of the model. The NSE is a metric that relates the variance of the prediction to the reference, while r is used to measure the linear dependence between actual and predicted values. In the following equations,
yi are the actual outages per grid cell,
σy is the standard deviation of the actual outages per grid cell, and
ŷi are the predicted outages per grid cell:
4. Results
The following sections present results from the development of the power outage detection product and the outage prediction model using Hurricane Sandy as the case study disaster event.
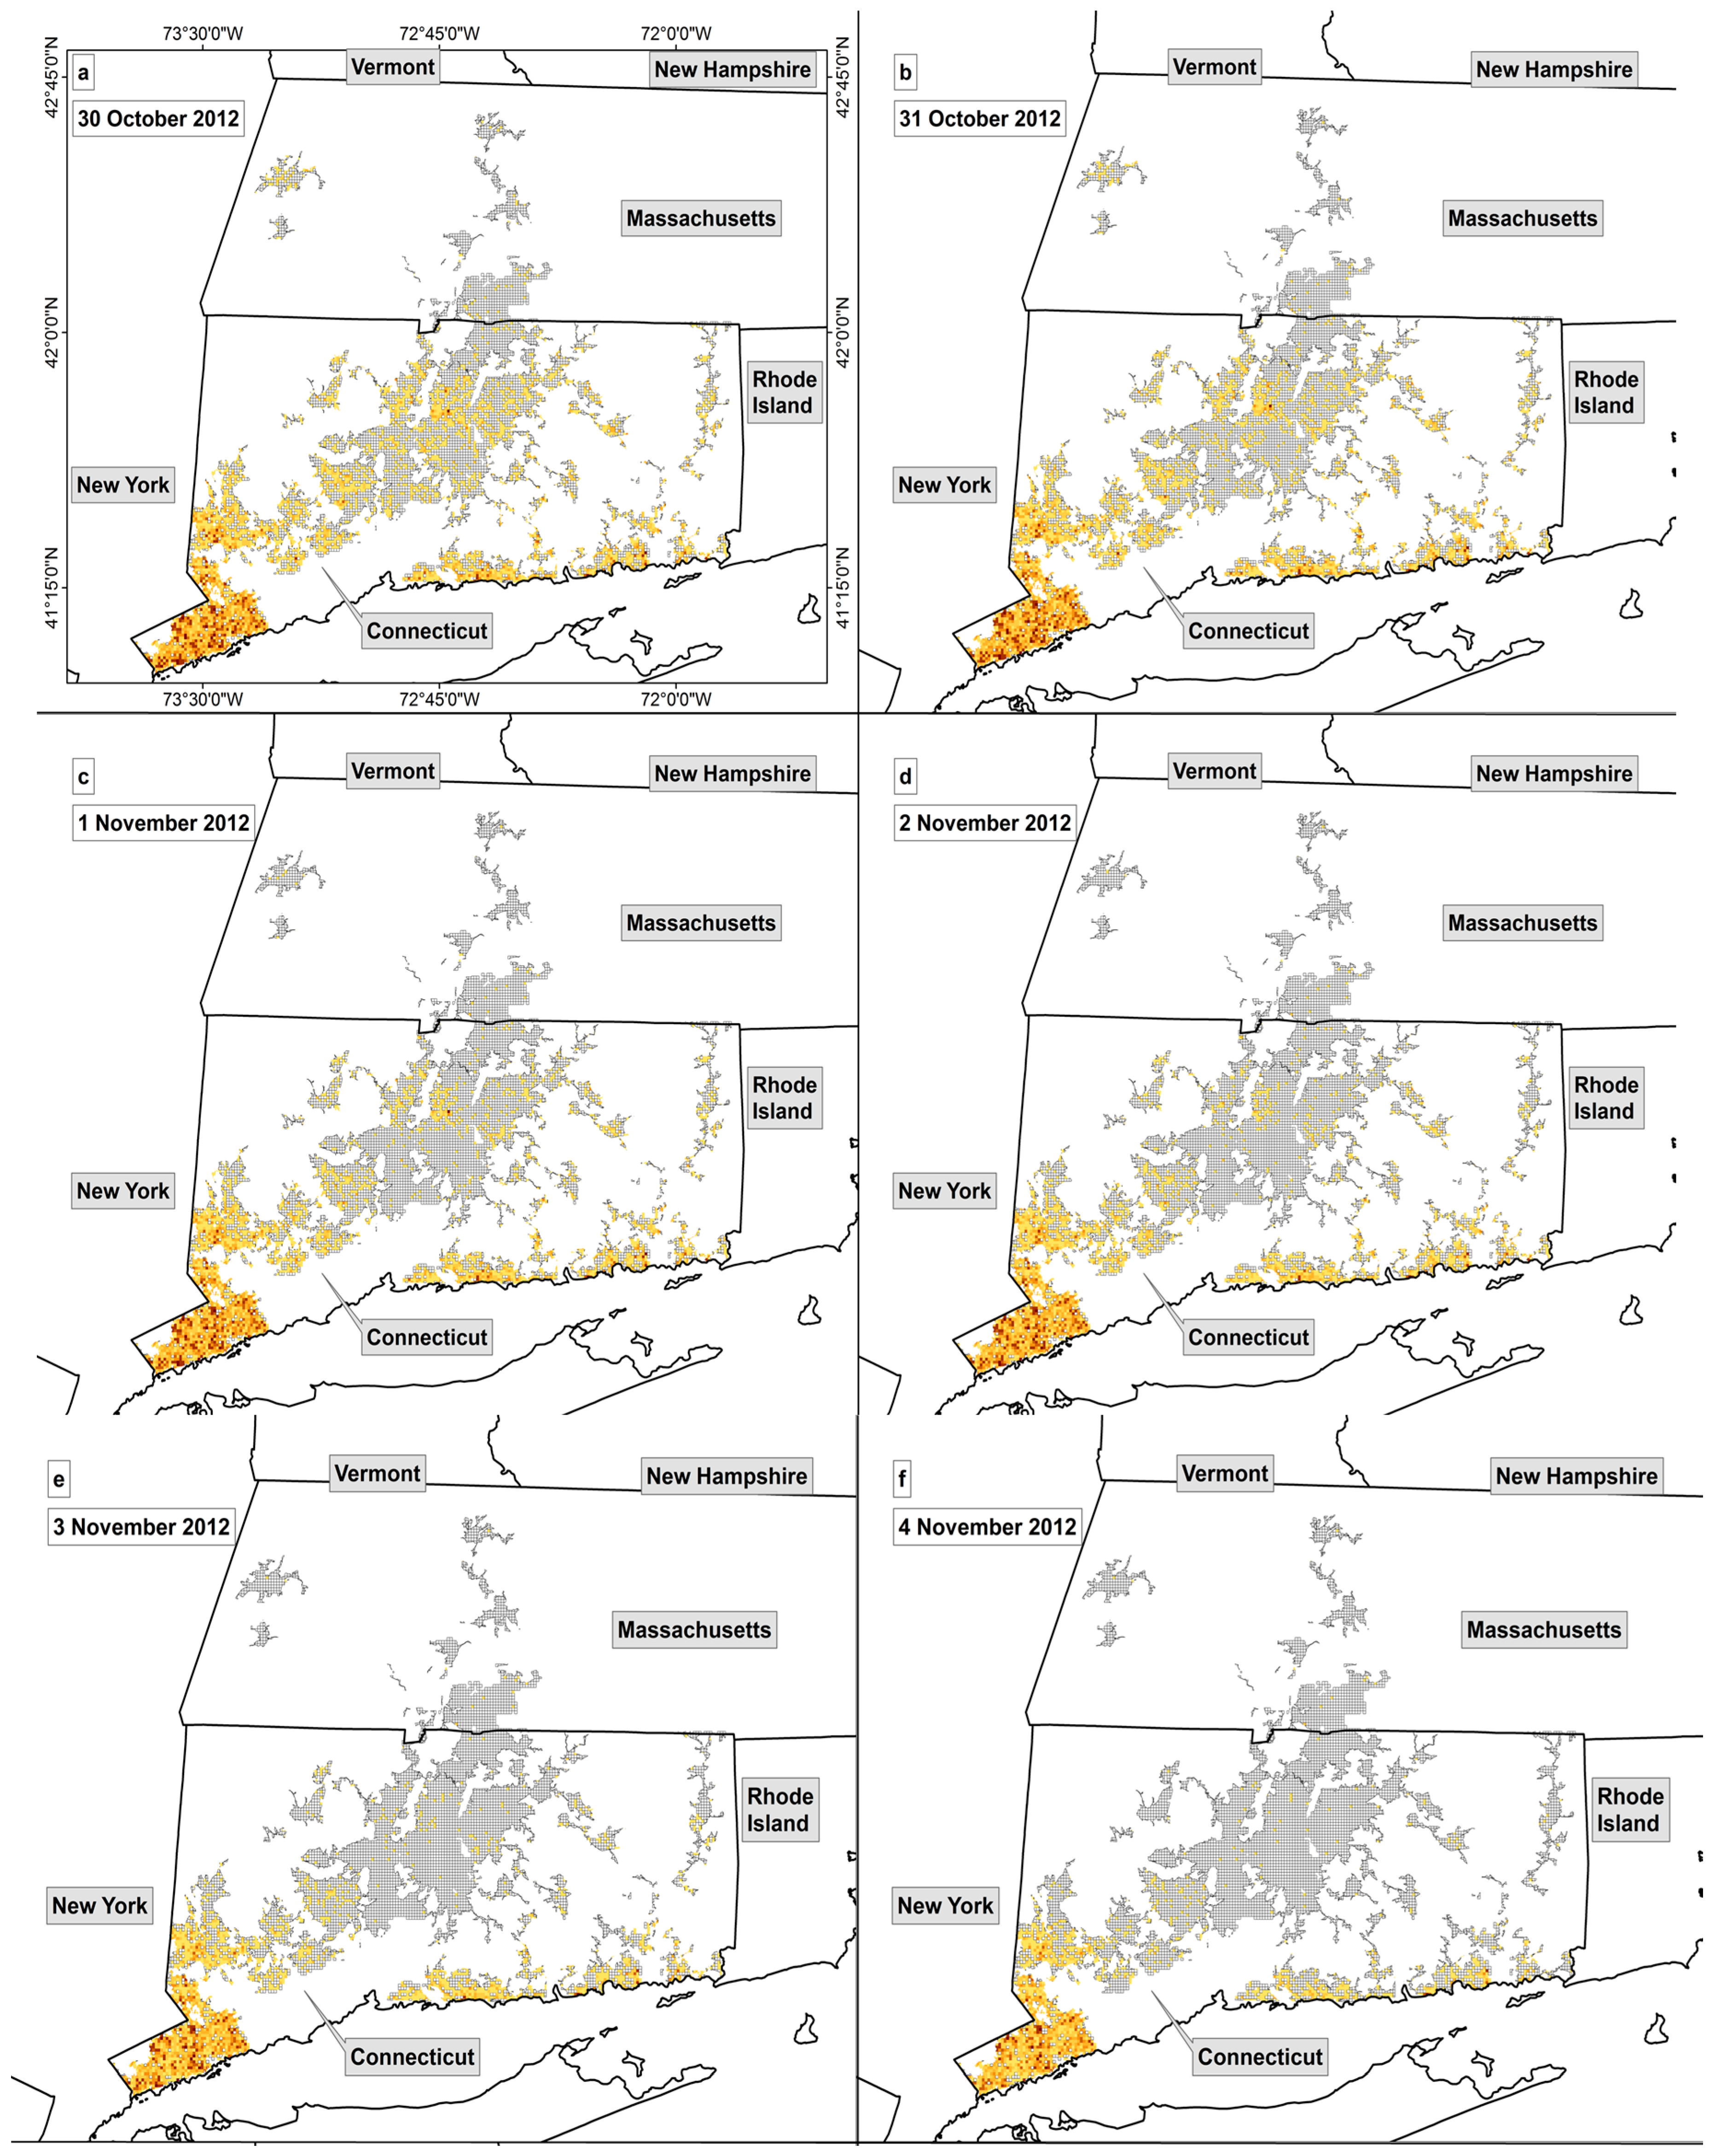
4.1. Visualizing Outages and Recovery with a DNB Percent of Normal Product
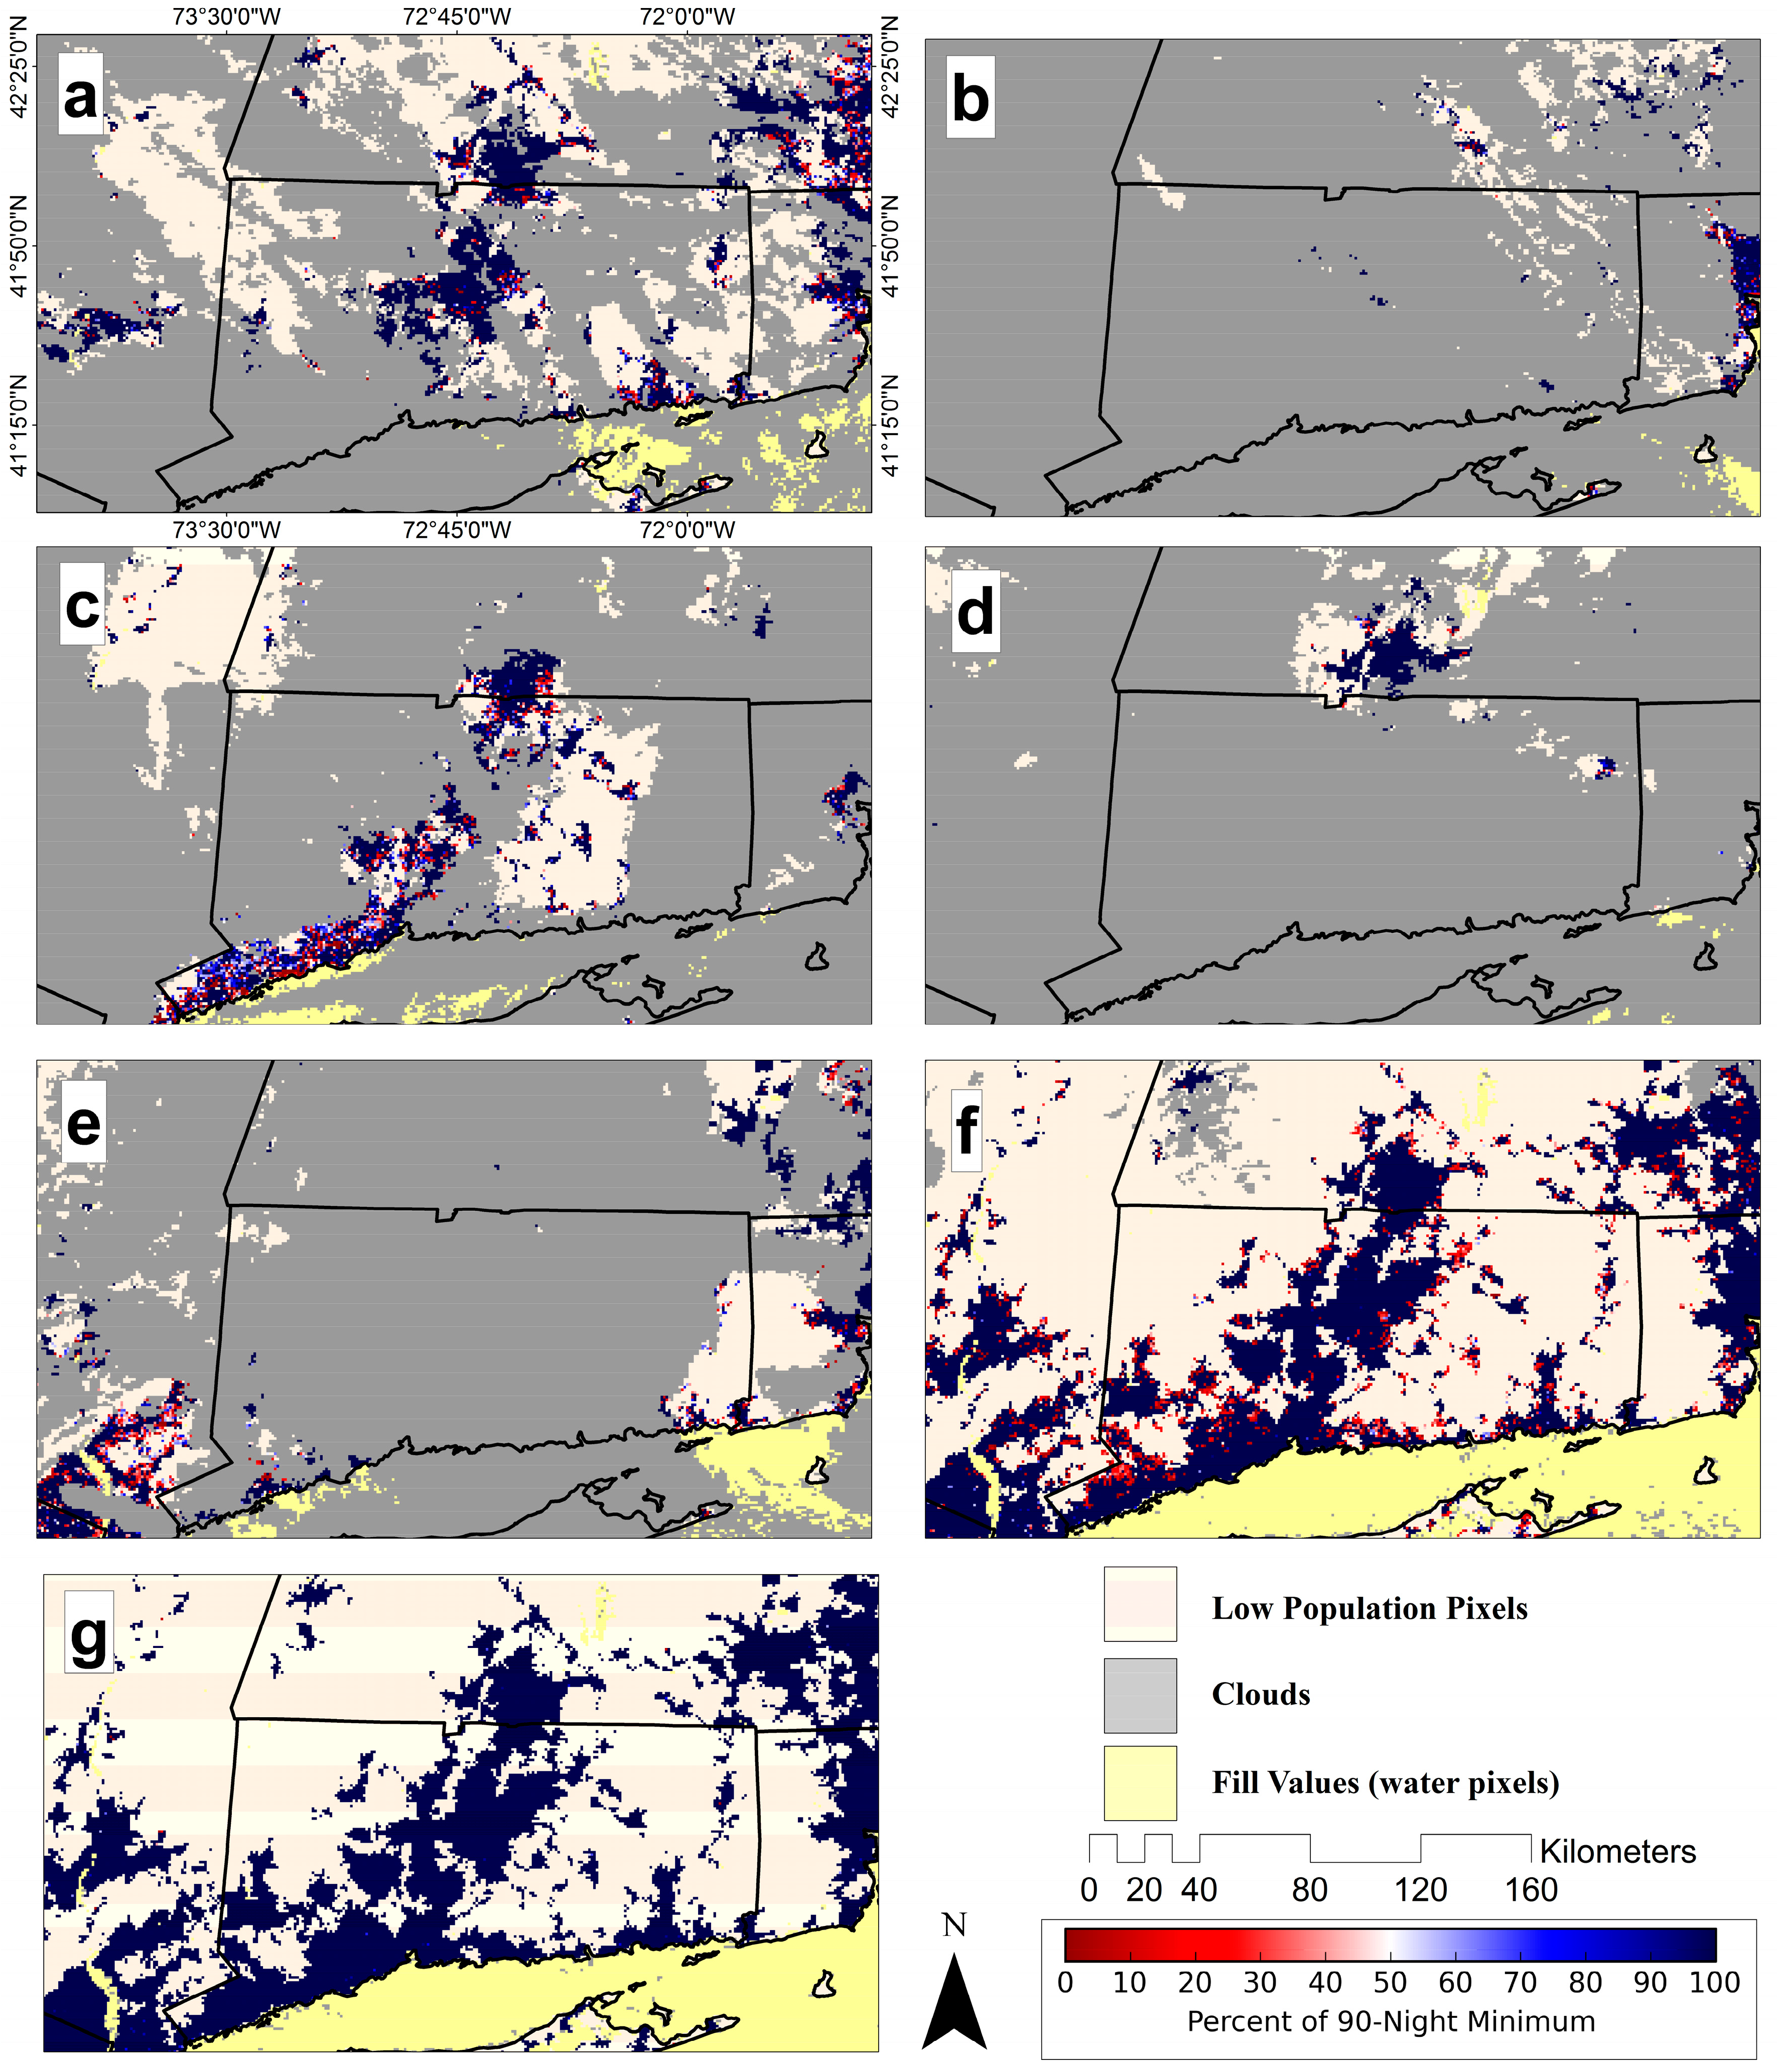
Using pixels within the Census MSA shapefile over the study area,
Figure 8 shows the DNB percent of normal product for each night following Hurricane Sandy. In each panel, available cloud- and snow-free pixels were used to estimate the reduction in NTL emissions caused by the storm and identify locations with potentially reduced power. The calculated pixels were then assigned to a color map, which thematically shows the percent of normal emissions using a red-to-blue color transition. Clouds present in each post-event image were colored grey to identify their location and coverage throughout the event. Pixels with fill values (i.e., those over water) that did not have an associated BRDF retrieval were colored yellow. As previously noted, the extent and persistent coverage of clouds hindered the ability to assess reductions in city light emissions on certain nights over several areas.
In available high-quality DNB pixels, particularly in extreme southwestern Connecticut (i.e., Fairfield county), an initial reduction in lights was identified in this product and followed by a gradual recovery to near “normal” emissions. By 1 November, the same portion of Connecticut was reduced to only 30%–60% of pre-event minimum emission levels (
Figure 8c). Cloud cover on 2 and 3 November restricted outage estimation in this area, but, by 4 November, a majority of pixels were restored to 60%–90% of normal levels (Figures 8d–f). The number of pixels near 70%–100% of normal further increased by 6 November, indicating that major progress had been made in the restoration of the electrical grid (
Figure 8g). These products demonstrate the ability to detect an initial reduction in NTL and to monitor the gradual recovery of power as utility crews service affected locations following Hurricane Sandy. Furthermore, the sharp reduction in lights one night after landfall (
Figure 8a) and eventual recovery to near-normal conditions (
Figure 8g) shows general correspondence with reported outage trends shown in
Figure 4,
Figure 5 and
Figure 6.
4.2. Evaluation of Outage Estimates
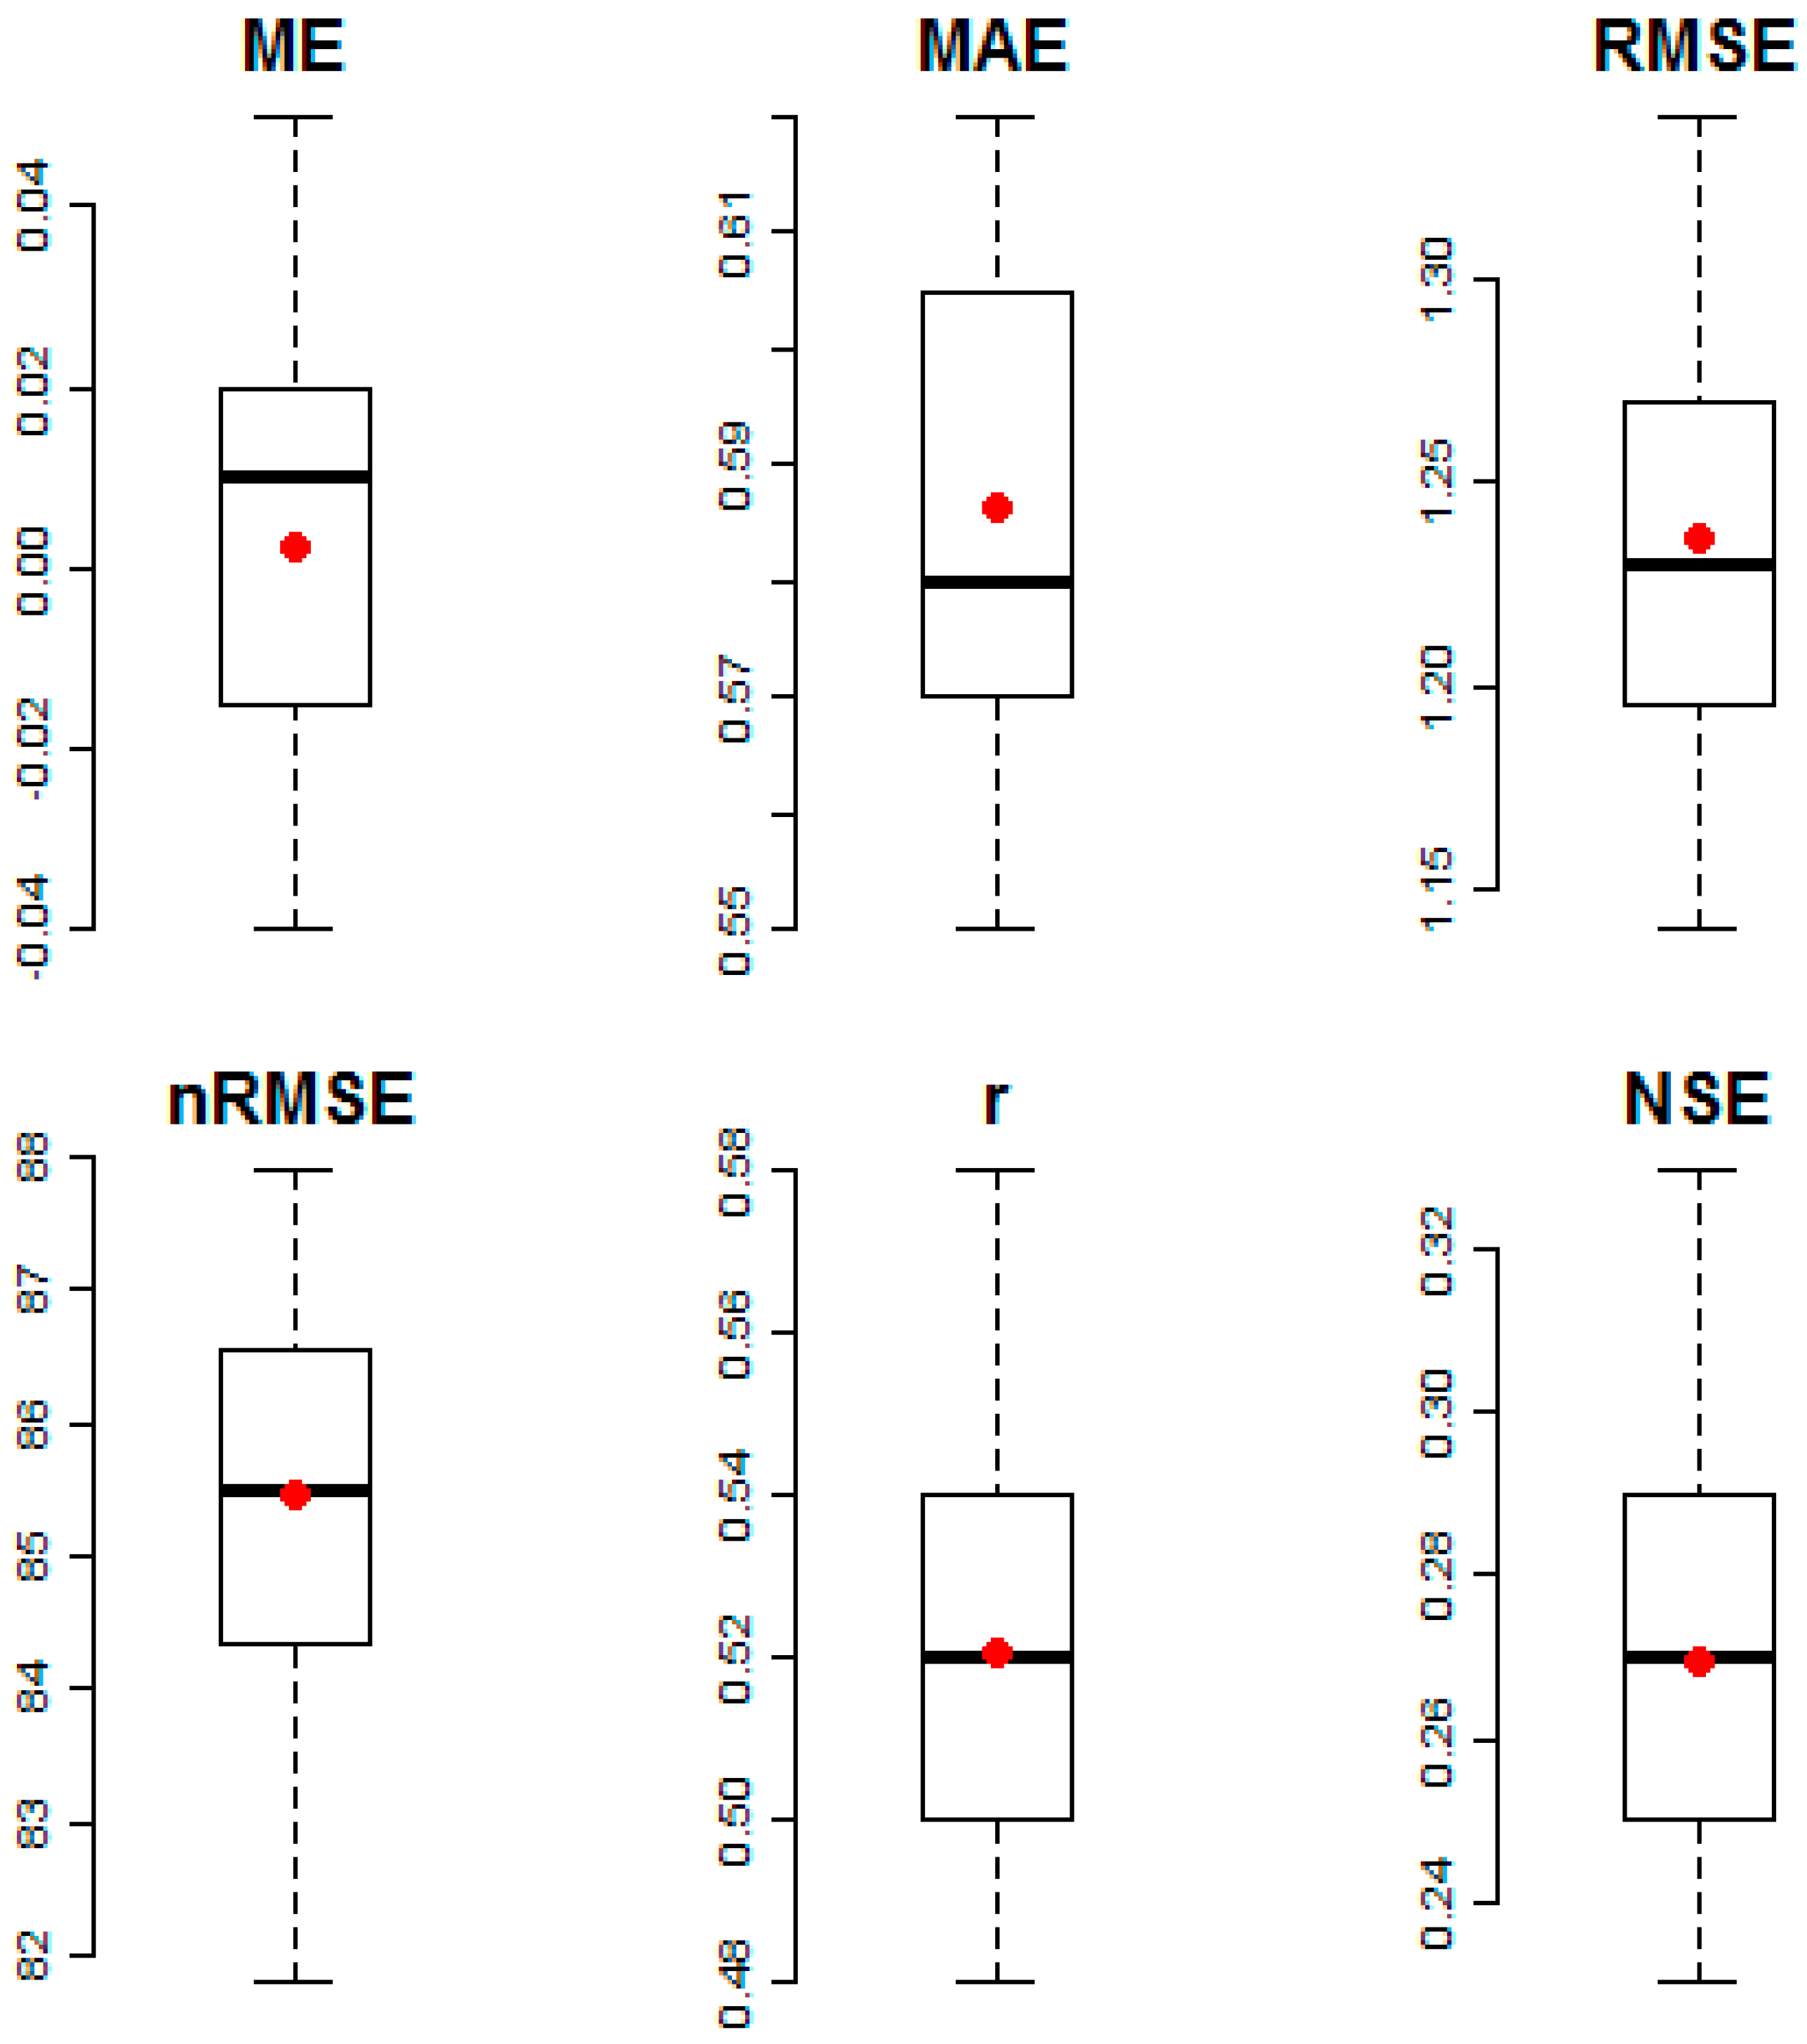
We evaluated results from the outage prediction model in terms of their magnitude and spatial accuracy because these metrics correspond with a utility’s emergency preparedness actions to secure and pre-stage mutual assistance crews in the correct geographic location(s). Results from each fold were summarized and presented in box plots (
Figure 9), and results were generally consistent across the 20 folds. Box plots with the averages (red dots) and medians (thick, black bars) were plotted for each evaluated error metric. The average mean error (ME) was near zero, which provides confidence that results were unbiased. The average mean absolute error (MAE) across all folds was 0.59 outages per grid cell, and the average root mean square error (RMSE) was 1.24 outages per grid cell, with an average normalized root mean square error (nRMSE) of 86%. Despite the high nRMSE per grid cell, which represents error in the local point estimates, the overall spatial accuracy of the outages was moderate, as explained by NSE values between 0.23 and 0.33, and Pearson correlation (r) values between 0.48 and 0.58 across all folds. A factor that may influence model accuracy was the geolocation of outages (e.g., outages are recorded at the nearest upstream isolating device, which may be geolocated in an adjacent grid cell). An additional factor that may have impacted the results of our study was the uneven number of observations per day due to cloud impacts. Furthermore, there may be additional data quality considerations that come from the combination of multiple data sources of varying temporal resolution, as we have done with our explanatory data (e.g., population, DNB radiance, and utility infrastructure assets). Future studies that analyze multiple storms will be valuable to mitigating these impacts.
Given the high-resolution of our study together with the potential societal benefits, we believe that our initial results are promising. Our results with a post-processed DNB product are improved compared to Mann et al. who used the random forest algorithm combined with raw, unprocessed DNB imagery to classify whether or not an outage occurred in a grid cell using household-level outage data [
42]. Although the overall error rate from the Mann et al. study was 2.69%, their model was much better at classifying grid cells without household outages (3.63% error) than grid cells with household outages (62% error), which the authors attribute to small sample size (<3% of all observations were actual outages). As summarized by Mann et al., multiple factors may impact the spatial accuracy of their raw DNB data, including atmospheric scattering, the accuracy of DNB radiometry, and undetected clouds. Our current study, however, is minimally affected by these impacts through the use of an improved NASA DNB product.
5. Conclusions
This study demonstrated the ability to use nighttime environmental products from the Suomi-NPP VIIRS sensor to identify power outages caused by disaster events. Using an improved DNB retrieval strategy to account for lunar BRDF artifacts in observed radiance values, we were able to incorporate nightly images independent of lunar phase conditions to estimate power outages following Hurricane Sandy in 2012. Combining DNB radiance values with population estimates and locally-relevant utility information allowed for the creation of a neural network model to predict power outages in dense, urban areas in Connecticut and Massachusetts, where outage estimates and predictions would be most valuable in near-real-time operations.
Cloud cover, temporal disparity between input datasets, and geolocation of power outages were the key limitations to our study design. Though cloud cover impacts any analysis that relies on day/night visible satellite imagery, the geographically-widespread and temporally-extensive nature of power outages from Hurricane Sandy allowed for a sufficient number of clear-sky observations. Temporal inconsistencies between the VIIRS overpass time, Landscan 2014 population estimates, and Eversource reported power outages limited the confidence in our model results. However, this discrepancy was addressed by modeling all input datasets on a mutual 1 km grid. Finally, the potential for a reported power outage to originate in an adjacent grid cell leaves the possibility for outage omission. In these instances, our grid-based model could not account for such network-like behavior, a limitation in our current design and key point of improvement for future studies.
Despite these technical limitations, our results show promise for producing a CONUS- or global-scale power outage monitoring network using satellite imagery and locally-relevant infrastructure data. Furthermore, we believe that this is the first attempt at synergistically combining utility infrastructure, population, and satellite observations of NTL to quantitatively estimate power outages needing repair. Future efforts in this area should analyze other disaster events with known power outages, perform further performance evaluations and test design schemes of the neural network model, and explore alternative methods for outage estimation using the NASA VIIRS DNB product suite.
Acknowledgments
We gratefully acknowledge the support of the Eversource and the Eversource Energy Center at the University of Connecticut, which provided data for this research. We would also like to thank the reviewers and editors for their insight and suggestions.
Author Contributions
T.C., A.M., D.W. and R.G. designed the study and methodology. M.R. developed and provided VIIRS DNB retrievals. T.C. and D.W. performed the analysis. T.C. developed DNB estimates of power outages while D.W. produced the neural network outage model. T.C., D.W., A.M. and M.R. wrote and contributed to the manuscript. All authors approved the final manuscript.
Conflicts of Interest
The authors declare no conflicts of interest.
References
- IFRC What Is a Disaster? Available online: http://www.ifrc.org/en/what-we-do/disaster-management/about-disasters/what-is-a-disaster/ (accessed on 1 January 2016).
- Guikema, S.D.; Quiring, S.M.; Han, S.-R. Prestorm Estimation of Hurricane Damage to Electric Power Distribution Systems. Risk Anal. 2010, 30, 1744–1752. [Google Scholar] [CrossRef] [PubMed]
- Wanik, D.W.; Anagnostou, E.N.; Hartman, B.M.; Frediani, M.E.B.; Astitha, M. Storm outage modeling for an electric distribution network in Northeastern USA. Nat. Hazards 2015, 79, 1359–1384. [Google Scholar] [CrossRef]
- He, J.; Wanik, D.W.; Hartman, B.M.; Anagnostou, E.N.; Astitha, M.; Frediani, M.E.B. Nonparametric Tree-Based Predictive Modeling of Storm Outages on an Electric Distribution Network. Risk Anal. 2016. [Google Scholar] [CrossRef]
- Manoj, B.S.; Baker, A.H. Communication Challenges in Emergency Response. Commun. ACM 2007, 50, 51–53. [Google Scholar] [CrossRef]
- Miller, S.D.; Mills, S.P.; Elvidge, C.D.; Lindsey, D.T.; Lee, T.F.; Hawkins, J.D. Suomi satellite brings to light a unique frontier of nighttime environmental sensing capabilities. Proc. Natl. Acad. Sci. USA 2012, 109, 15706–15711. [Google Scholar] [CrossRef] [PubMed]
- Lee, T.E.; Miller, S.D.; Turk, F.J.; Schueler, C.; Julian, R.; Deyo, S.; Dills, P.; Wang, S. The NPOESS VIIRS Day/Night visible sensor. Bull. Am. Meteorol. Soc. 2006, 87, 191–199. [Google Scholar] [CrossRef]
- Cao, C.; Bai, Y. Quantitative analysis of VIIRS DNB nightlight point source for light power estimation and stability monitoring. Remote Sens. 2014, 6, 11915–11935. [Google Scholar] [CrossRef]
- Elvidge, C.D.; Baugh, K.E.; Kihn, E.A.; Kroehl, H.W.; Davis, E.R.; Davis, C.W. Relation between satellite observed visible-near infrared emissions, population, economic activity and electric power consumption. Int. J. Remote Sens. 1997, 18, 1373–1379. [Google Scholar] [CrossRef]
- Wei, Y.; Liu, H.; Song, W.; Yu, B.; Xiu, C. Normalization of time series DMSP-OLS nighttime light images for urban growth analysis with Pseudo Invariant Features. Landsc. Urban Plan. 2014, 128, 1–13. [Google Scholar] [CrossRef]
- Min, B.; Gaba, K. Tracking electrification in Vietnam using nighttime lights. Remote Sens. 2014, 6, 9511–9529. [Google Scholar] [CrossRef]
- Min, B.; Gaba, K.M.; Sarr, O.F.; Agalassou, A. Detection of rural electrification in Africa using DMSP-OLS night lights imagery. Int. J. Remote Sens. 2013, 34, 8118–8141. [Google Scholar] [CrossRef]
- He, C.; Ma, Q.; Liu, Z.; Zhang, Q. Modeling the spatiotemporal dynamics of electric power consumption in Mainland China using saturation-corrected DMSP/OLS nighttime stable light data. Int. J. Digit. Earth 2014, 7, 993–1014. [Google Scholar] [CrossRef]
- Elvidge, C.D.; Tuttle, B.T.; Sutton, P.C.; Baugh, K.E.; Howard, A.T.; Milesi, C.; Bhaduri, B.; Nemani, R. Global distribution and density of constructed impervious surfaces. Sensors 2007, 7, 1962. [Google Scholar] [CrossRef]
- Elvidge, C.D.; Baugh, K.E.; Hobson, V.R.; Kihn, E.A.; Kroehl, H.W. Detection of fires and power outages using DMSP-OLS data. In Remote Sensing Change Detection: Environmental Monitoring Methods and Applications; Ann Arbor Press: Chelsea, MI, USA, 1999; pp. 123–135. [Google Scholar]
- Aubrecht, C.; Elvidge, C.D.; Ziskin, D.; Baugh, K.E.; Tuttle, B.T.; Erwin, E.; Kerle, N. Observing power blackouts from space - A disaster related study. In EGU General Assembly: Geophysical Research Abstracts; European Geosciences Union: Vienna, Austria, 2009; pp. 1–2. [Google Scholar]
- Kohiyama, M.; Hayashi, H.; Maki, N.; Higashida, M.; Kroehl, H.W.; Elvidge, C.D.; Hobson, V.R. Early damaged area estimation system using DMSP-OLS night-time imagery. Int. J. Remote Sens. 2004, 25, 2015–2036. [Google Scholar] [CrossRef]
- Elvidge, C. VIIRS DNB Cloud Free Composites; NGDC NOAA: Boulder, CO, USA, 2014.
- Baugh, K. Nighttime lights compositing using the VIIRS day-night band: Preliminary Results. Proc. Asia-Pacific Adv. Netw. 2013, 35, 70–86. [Google Scholar] [CrossRef]
- Li, X.; Zhang, R.; Huang, C.; Li, D. Detecting 2014 Northern Iraq Insurgency using night-time light imagery. Int. J. Remote Sens. 2015, 36, 3446–3458. [Google Scholar] [CrossRef]
- Shi, K.; Yu, B.; Huang, Y.; Hu, Y.; Yin, B.; Chen, Z.; Chen, L.; Wu, J. Evaluating the ability of NPP-VIIRS nighttime light data to estimate the gross domestic product and the electric power consumption of China at multiple scales: A Comparison with DMSP-OLS data. Remote Sens. 2014, 6, 1705–1724. [Google Scholar] [CrossRef]
- Li, X.; Xu, H.; Chen, X.; Li, C. Potential of NPP-VIIRS Nighttime Light Imagery for Modeling the Regional Economy of China. Remote Sens. 2013, 5, 3057–3081. [Google Scholar] [CrossRef]
- Shi, K.; Huang, C.; Yu, B.; Yin, B.; Huang, Y.; Wu, J. Evaluation of NPP-VIIRS night-time light composite data for extracting built-up urban areas. Remote Sens. Lett. 2014, 5, 358–366. [Google Scholar] [CrossRef]
- Hu, C.; Chen, S.; Wang, M.; Murch, B.; Taylor, J. Detecting surface oil slicks using VIIRS nighttime imagery under moon glint: A case study in the Gulf of Mexico. Remote Sens. Lett. 2015, 6, 295–301. [Google Scholar] [CrossRef]
- Cao, C.; Shao, X.; Uprety, S. Detecting light outages after severe storms using the S-NPP/VIIRS Day/Night band radiances. IEEE Geosci. Remote Sens. Lett. 2013, 10, 1582–1586. [Google Scholar] [CrossRef]
- Molthan, A.; Jedlovec, G. Satellite observations monitor outages from Superstorm Sandy. Eos Trans. Am. Geophys. Union 2013, 94, 53–54. [Google Scholar] [CrossRef]
- Miller, S.D.; Turner, R.E. A dynamic lunar spectral irradiance data set for NPOESS/VIIRS Day/Night band nighttime environmental applications. IEEE Trans. Geosci. Remote Sens. 2009, 47, 2316–2329. [Google Scholar] [CrossRef]
- Román, M.O.; Stokes, E.C. Holidays in lights: Tracking cultural patterns in demand for energy services. Earth’s Futur. 2015, 3, 182–205. [Google Scholar] [CrossRef] [PubMed]
- NASA LAADS DAAC. Available online: https://ladsweb.nascom.nasa.gov/ (accessed on 17 March 2017).
- Shuai, Y.; Schaaf, C.B.; Strahler, A.H.; Liu, J.; Jiao, Z. Quality assessment of BRDF/albedo retrievals in MODIS operational system. Geophys. Res. Lett. 2008, 35. [Google Scholar] [CrossRef]
- ORNL Landscan Documentation. Available online: http://web.ornl.gov/sci/landscan/landscan_documentation.shtml (accessed on 2 February 2016).
- Census, U.S. Metropolitan and Micropolitan. Available online: http://www.census.gov/population/metro/about/ (accessed on 2 February 2016).
- NHC Hurricane Sandy. Available online: http://www.nhc.noaa.gov/archive/2012/al18/al182012.discus.019.shtml (accessed on 9 June 2016).
- Halverson, J.B.; Rabenhorst, T. Hurricane Sandy: The science and impacts of a superstorm. Weatherwise 2013, 66, 14–23. [Google Scholar] [CrossRef]
- NHC Post-Tropical Cyclone Sandy. Available online: http://www.nhc.noaa.gov/archive/2012/al18/al182012.update.10300002.shtml (accessed on 9 June 2016).
- Kunz, M.; Mühr, B.; Kunz-Plapp, T.; Daniell, J.E.; Khazai, B.; Wenzel, F.; Vannieuwenhuyse, M.; Comes, T.; Elmer, F.; Schröter, K.; et al. Investigation of superstorm Sandy 2012 in a multi-disciplinary approach. Nat. Hazards Earth Syst. Sci. 2013, 13, 2579–2598. [Google Scholar] [CrossRef]
- United States Department of Energy. Hurricane Sandy Situation Reports; doe.gov: Washington, DC, USA, 2012.
- Gunther, F.; Fritsch, S. neuralnet: Training of Neural Networks. R J. 2010, 2, 30–38. [Google Scholar]
- Clifton, C. Change Detection in Overhead Imagery Using Neural Networks. Appl. Intell. 2003, 18, 215–234. [Google Scholar] [CrossRef]
- Chini, M.; Pacifici, F.; Emery, W.J.; Pierdicca, N.; Frate, F. Del Comparing Statistical and Neural Network Methods Applied to Very High Resolution Satellite Images Showing Changes in Man-Made Structures at Rocky Flats. IEEE Trans. Geosci. Remote Sens. 2008, 46, 1812–1821. [Google Scholar] [CrossRef]
- Ito, Y.; Hosokawa, M.; Lee, H.; Liu, J.G. Extraction of damaged regions using SAR data and neural networks. In Proceedings of the 19th ISPRS Congress, Amsterdam, The Netherlands, 16–23 July 2000; pp. 156–163.
- Mann, L.M.; Melaas, K.E.; Malik, A. Using VIIRS Day/Night Band to Measure Electricity Supply Reliability: Preliminary Results from Maharashtra, India. Remote Sens. 2016, 8, 711. [Google Scholar] [CrossRef]
Figure 1.
Mean pixel radiance for highest quality observations from 19 January 2012 through 31 December 2015. Imagery represents the base-10 logarithm of the mean radiance value (nW·cm−2·sr−1), scaled to an 8-bit grayscale image from −10 to −8. The white inset box shows the distribution of nighttime lights (NTL) in the Mid-Atlantic and New England regions.
Figure 2.
Day/Night Band (DNB)-matching continental United States (CONUS) subset of Landscan 2014 dataset. The white inset box of population density shown for the Mid-Atlantic and New England regions.
Figure 2.
Day/Night Band (DNB)-matching continental United States (CONUS) subset of Landscan 2014 dataset. The white inset box of population density shown for the Mid-Atlantic and New England regions.
Figure 3.
2014 U.S. Census metropolitan statistical area (MSA) shapefile. Areas (polygons) colored blue represent each individual urban cluster/urban areas. Red inset box of MSAs shown for the Mid-Atlantic and New England Regions.
Figure 3.
2014 U.S. Census metropolitan statistical area (MSA) shapefile. Areas (polygons) colored blue represent each individual urban cluster/urban areas. Red inset box of MSAs shown for the Mid-Atlantic and New England Regions.
Figure 4.
Timeline of the percentage of customers without power following Hurricane Sandy. Produced using emergency situation reports provided by the U.S. Department of Energy, Office of Electricity Delivery and Energy Reliability from 30 October to 7 November [
37].
Figure 4.
Timeline of the percentage of customers without power following Hurricane Sandy. Produced using emergency situation reports provided by the U.S. Department of Energy, Office of Electricity Delivery and Energy Reliability from 30 October to 7 November [
37].
Figure 5.
Average outages per grid cell across Eversource Energy—Connecticut and Eversource Energy—Western Massachusetts service territories from 30 October 2012 to 8 November 2012.
Figure 5.
Average outages per grid cell across Eversource Energy—Connecticut and Eversource Energy—Western Massachusetts service territories from 30 October 2012 to 8 November 2012.
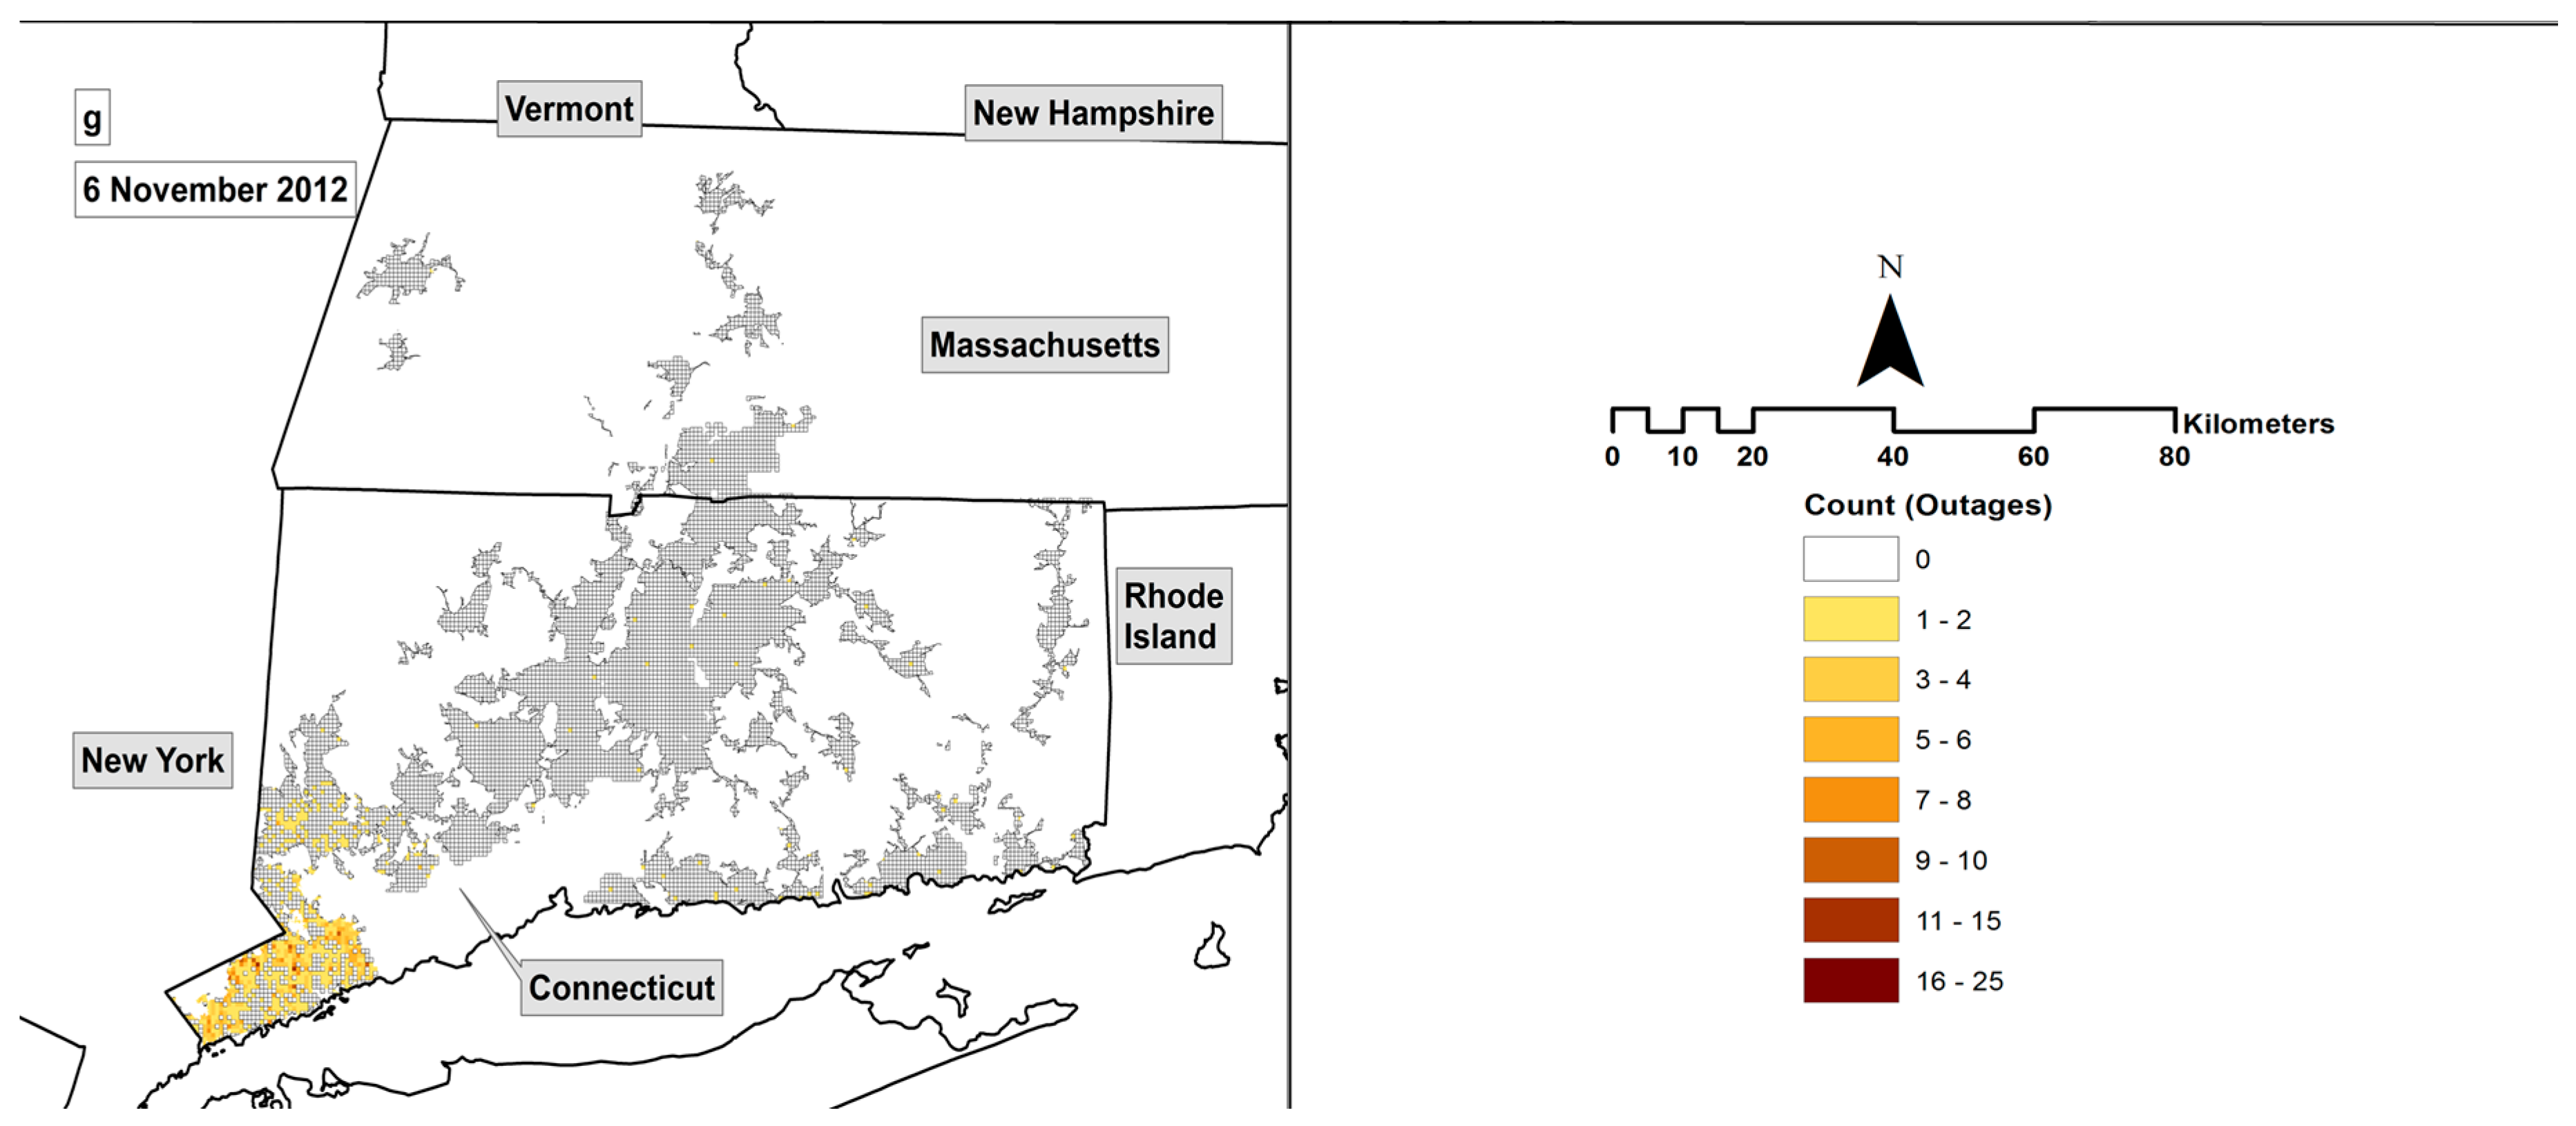
Figure 6.
Evolution of reported power outages for each post-event night, mapped to the fishnet grid, and limited to MSA areas. Each panel corresponds to (a) 30 October, (b) 31 October, (c) 1 November, (d) 2 November, (e) 3 November, (f) 4 November, and (g) 6 November 2012. Areas in white are excluded from our analysis. These areas represent the United Illuminating service territory, other municipal electricity cooperatives, and areas that do not contain an isolating device or are not included in the MSA rural/urban shapefile. Areas in grey are grid cells with no reported outages for that post-event night. Each panel covers the same geographic region and spatial extent.
Figure 7.
Flowchart detailing the model framework used, including model inputs, data partitioning, the artificial neural network model, and model output.
Figure 7.
Flowchart detailing the model framework used, including model inputs, data partitioning, the artificial neural network model, and model output.
Figure 8.
Percent of normal products generated over the Hurricane Sandy landfall region for pixels within the Census MSA shapefile. Panels correspond to post-event products on (a) 30 October, (b) 31 October, (c) 1 November, (d) 2 November, (e) 3 November, (f) 4 November, and (g) 6 November 2012, respectively. Each panel covers the same geographic region and spatial extent.
Figure 9.
Error metrics from neural network with a 20-fold cross-validation, including mean error (ME) per storm. The mean absolute error (MAE), root mean square error (RMSE) and Nash–Sutcliffe efficiency (NSE) were calculated from 1 km grid cells for each fold (n = 20 folds).
Figure 9.
Error metrics from neural network with a 20-fold cross-validation, including mean error (ME) per storm. The mean absolute error (MAE), root mean square error (RMSE) and Nash–Sutcliffe efficiency (NSE) were calculated from 1 km grid cells for each fold (n = 20 folds).
Table 1.
Post-event image dates used in power outage estimation and prediction. Number of cloud-free Day/Night Band (DNB) grid cells per day also shown.
Table 1.
Post-event image dates used in power outage estimation and prediction. Number of cloud-free Day/Night Band (DNB) grid cells per day also shown.
| Julian Day | Calendar Date | Count of Valid Grid Cells |
|---|
| 304 | 30 October 2012 | 8226 |
| 305 | 31 October 2012 | 523 |
| 306 | 1 November 2012 | 5661 |
| 307 | 2 November 2012 | 1374 |
| 308 | 3 November 2012 | 1351 |
| 309 | 4 November 2012 | 19,738 |
| 311 | 6 November 2012 | 20,091 |
© 2017 by the authors. Licensee MDPI, Basel, Switzerland. This article is an open access article distributed under the terms and conditions of the Creative Commons Attribution (CC BY) license ( http://creativecommons.org/licenses/by/4.0/).


