
Automatic Detection of Low-Rise Gable-Roof Building from Single Submeter SAR Images Based on Local Multilevel Segmentation


Abstract
:
1. Introduction
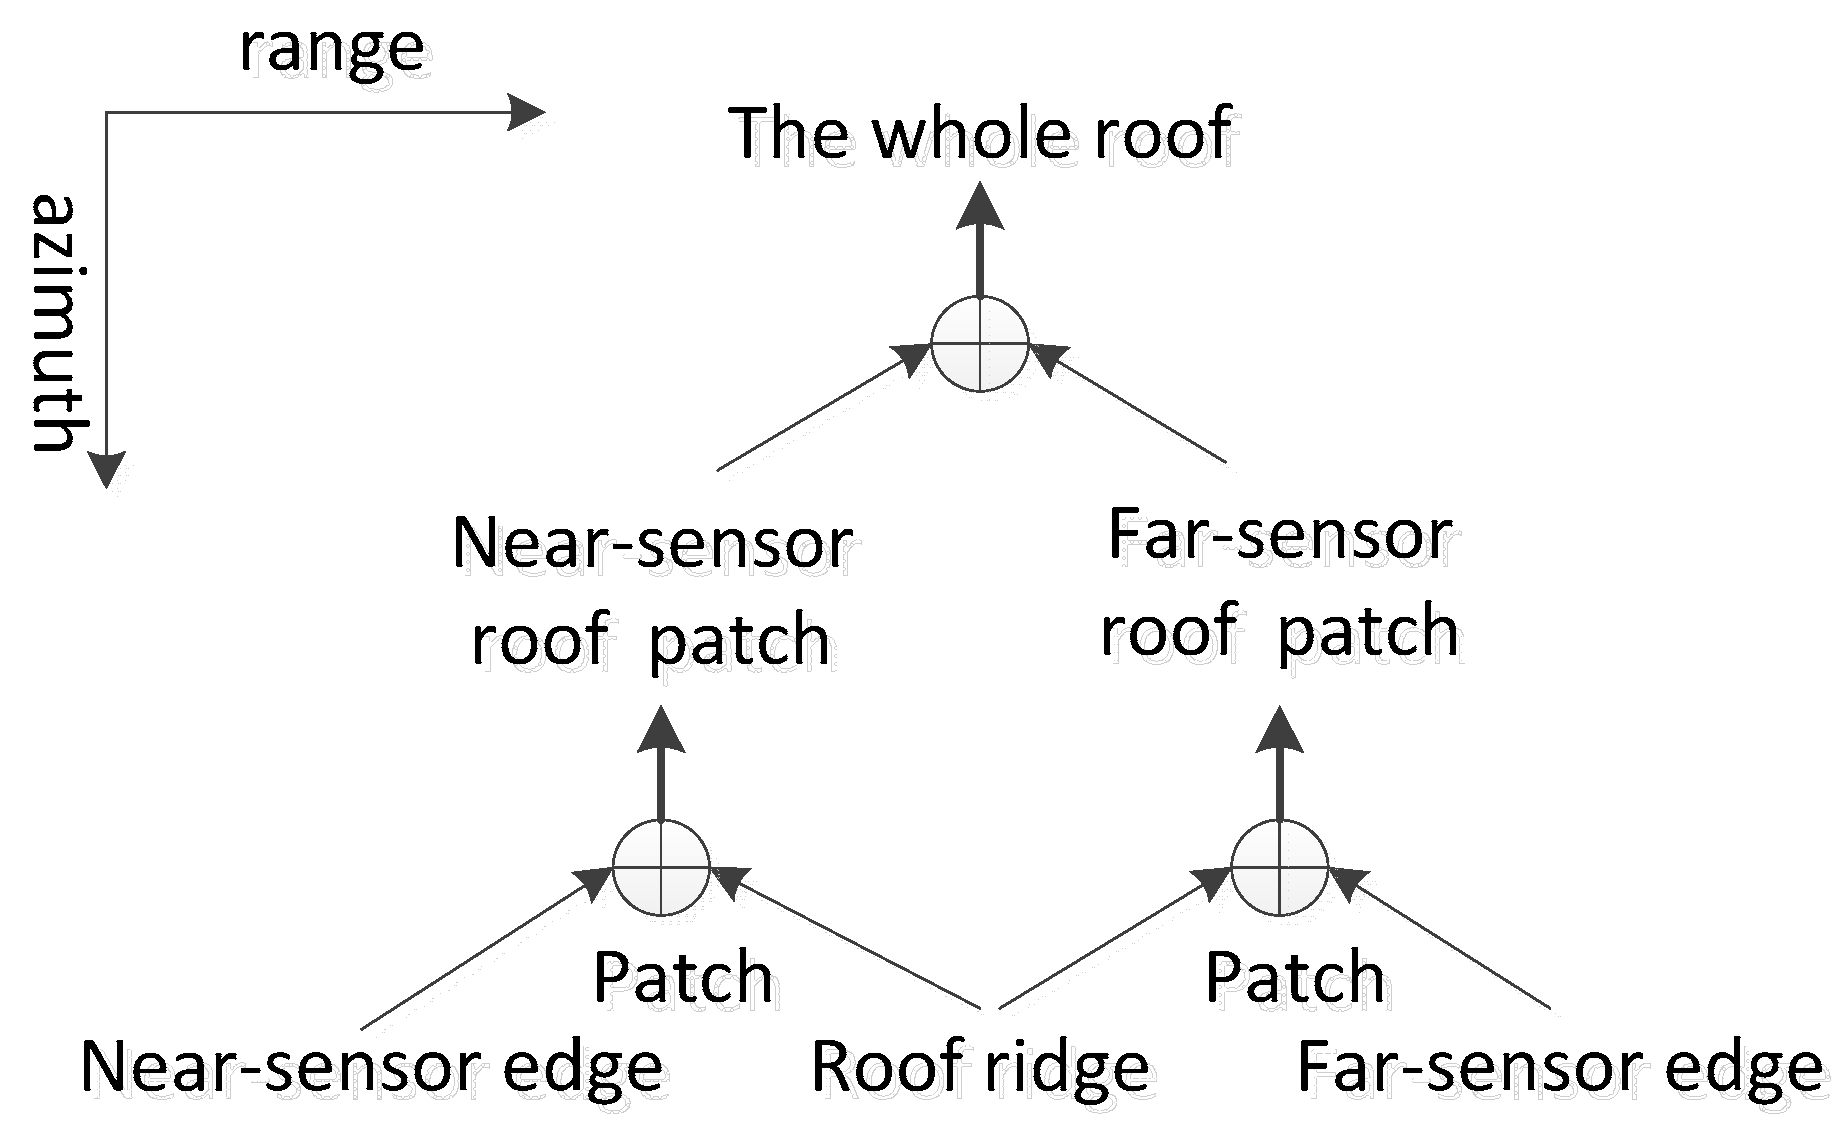
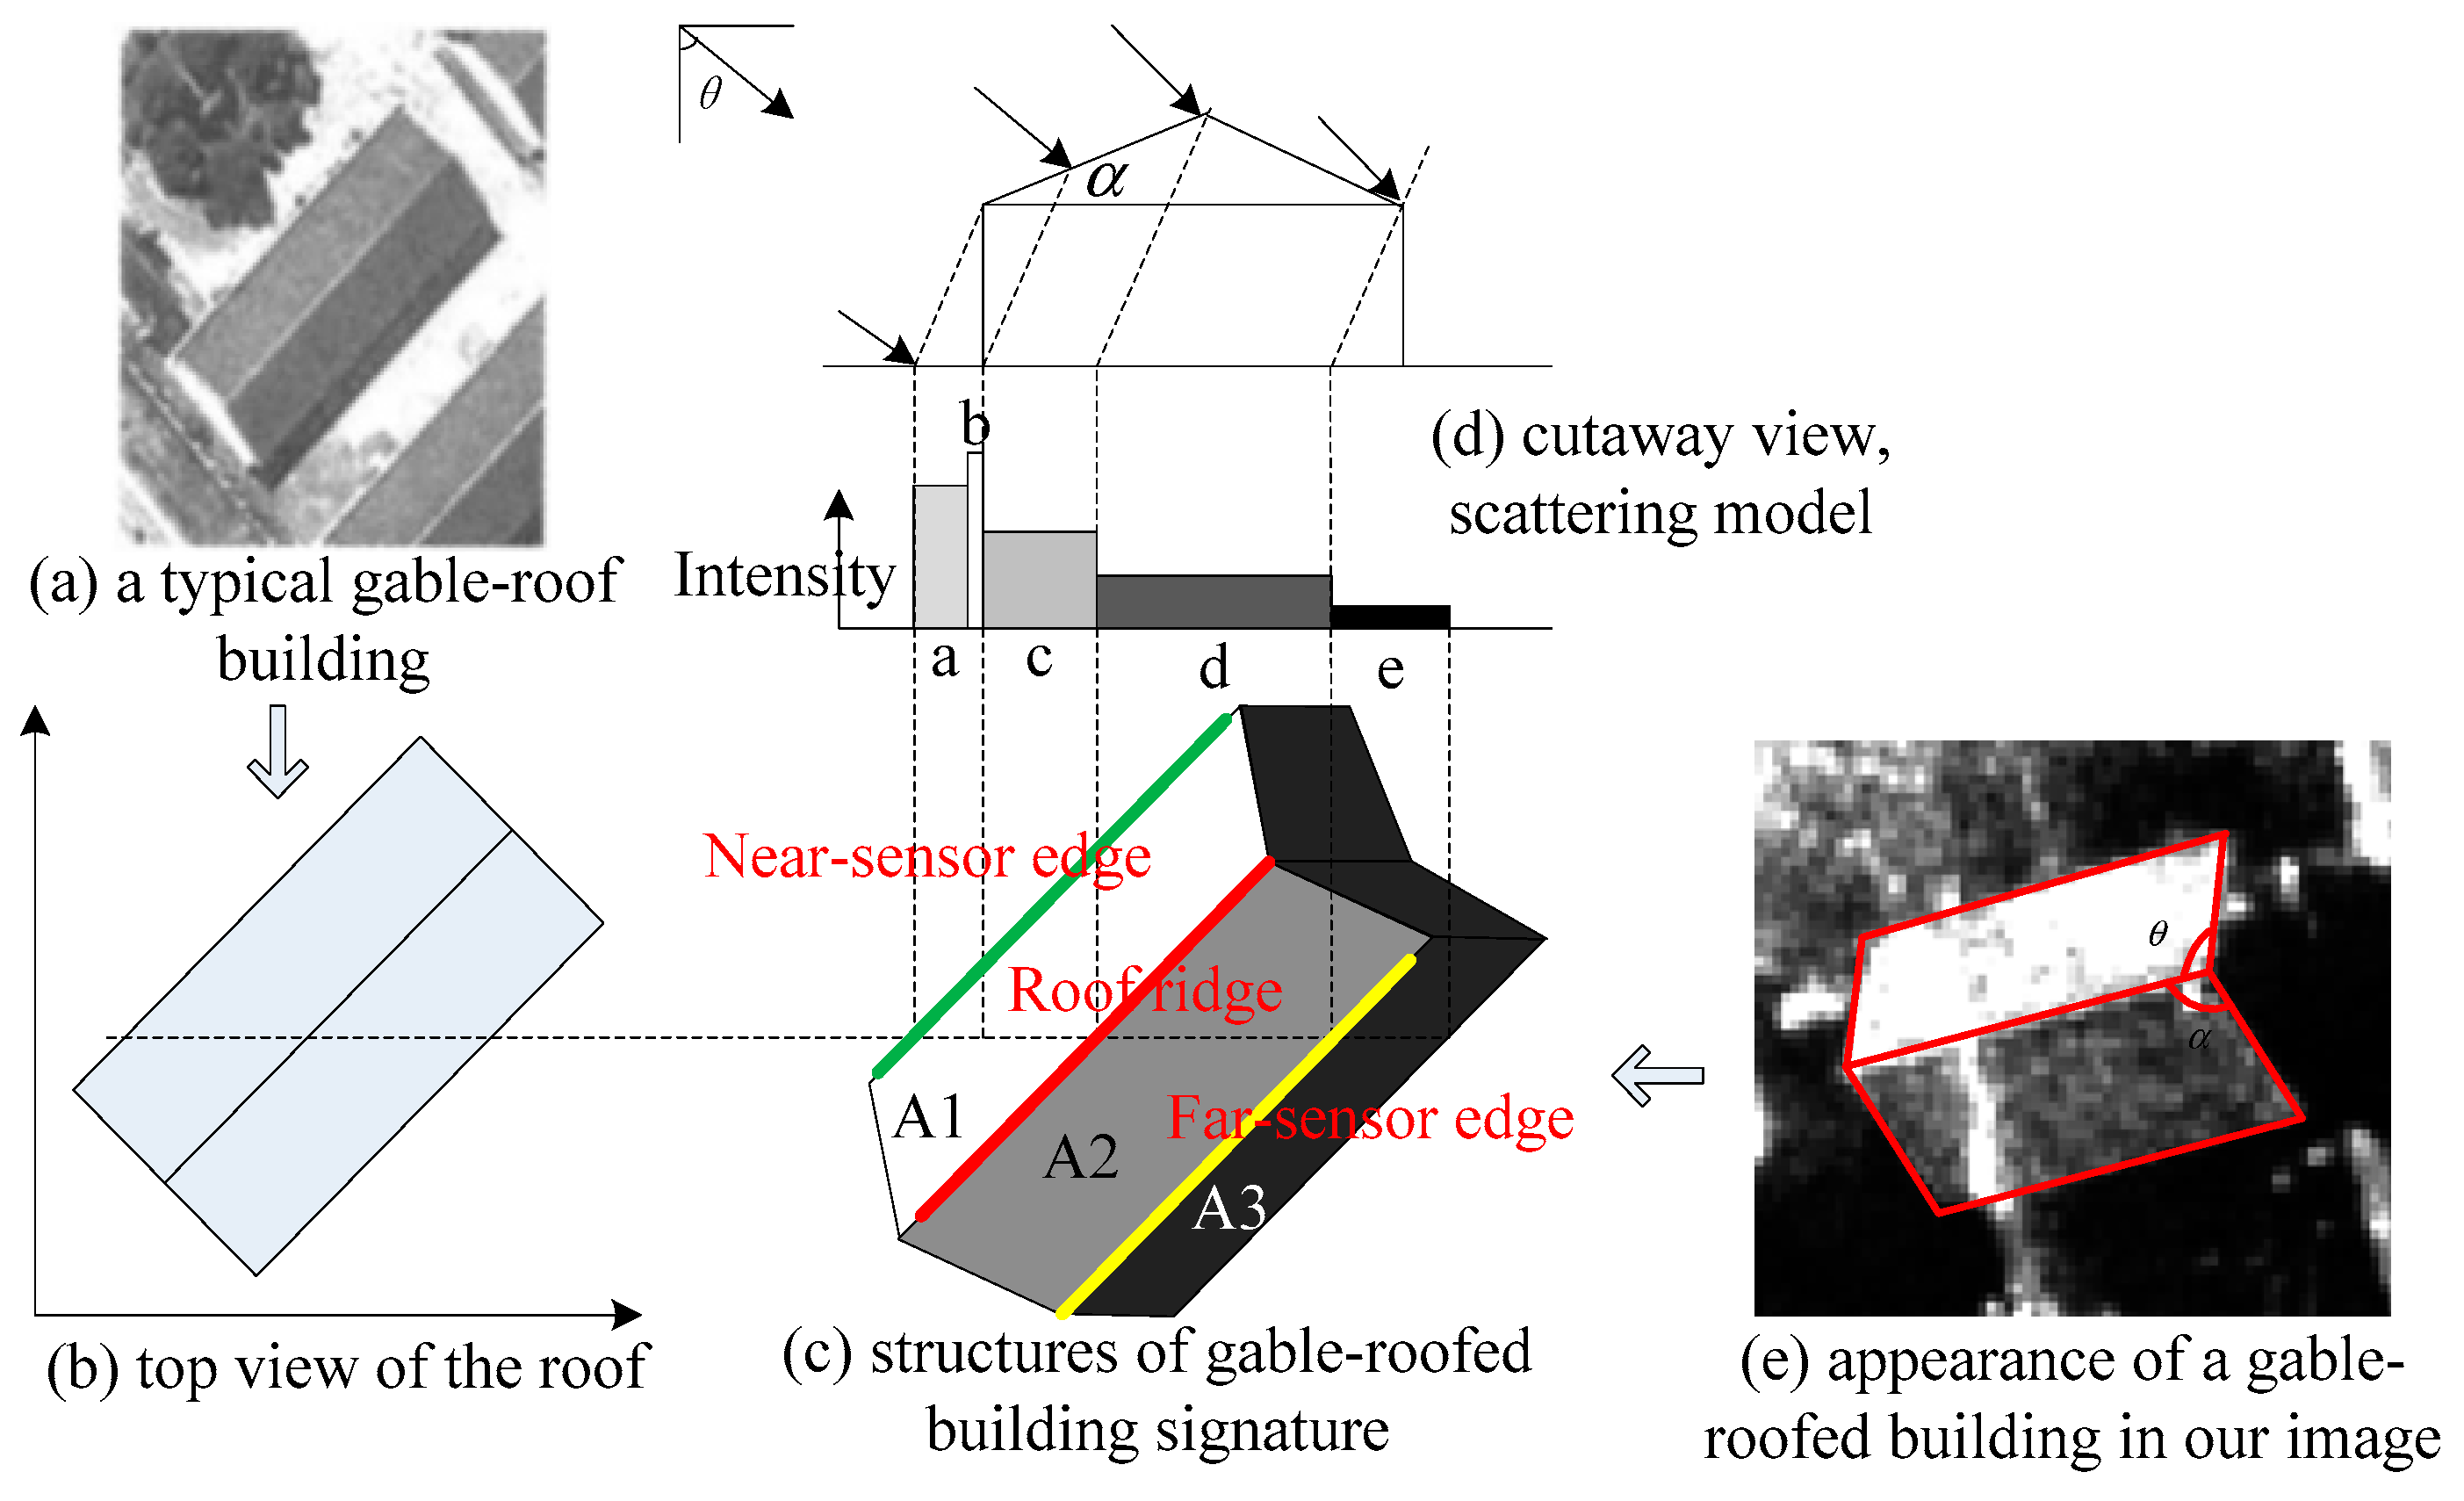
2. Gable-Roof Building Signature Analysis
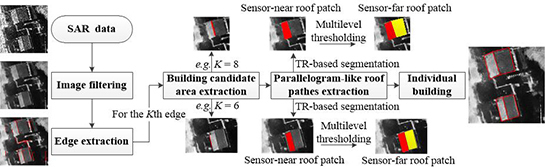
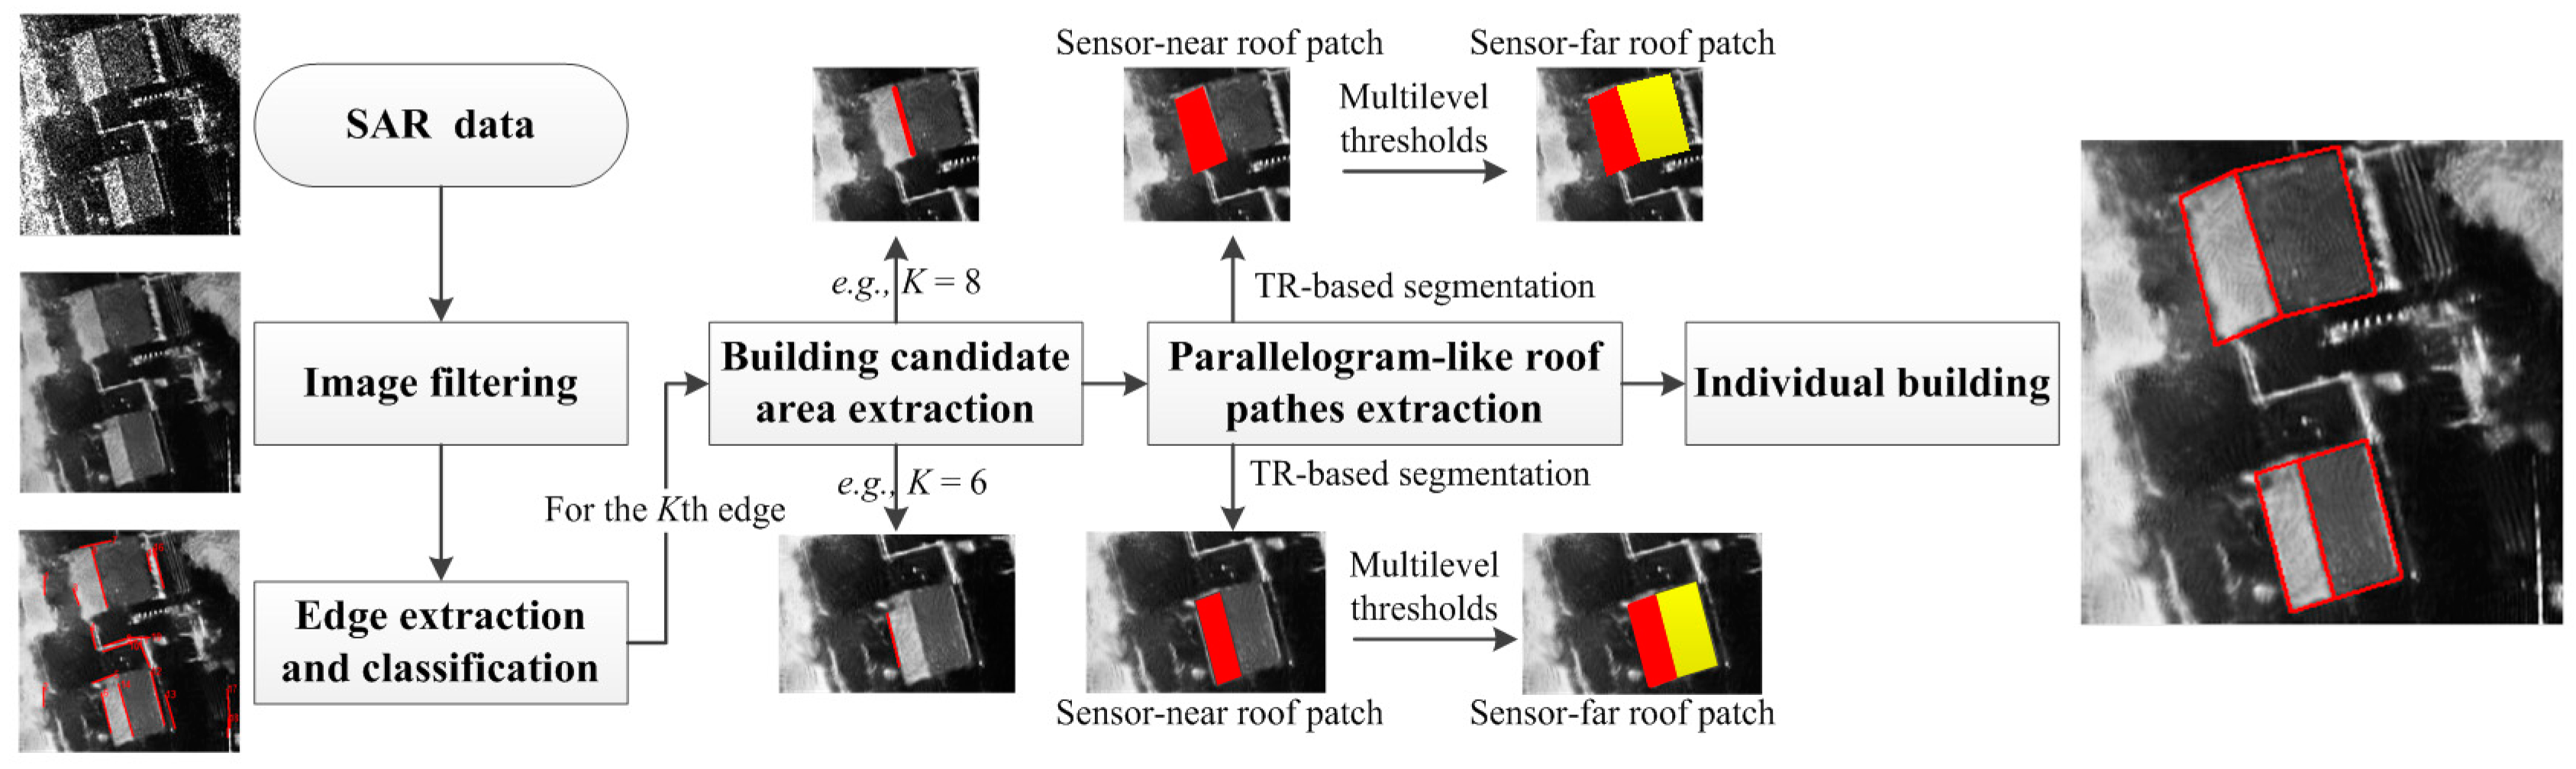
3. Method
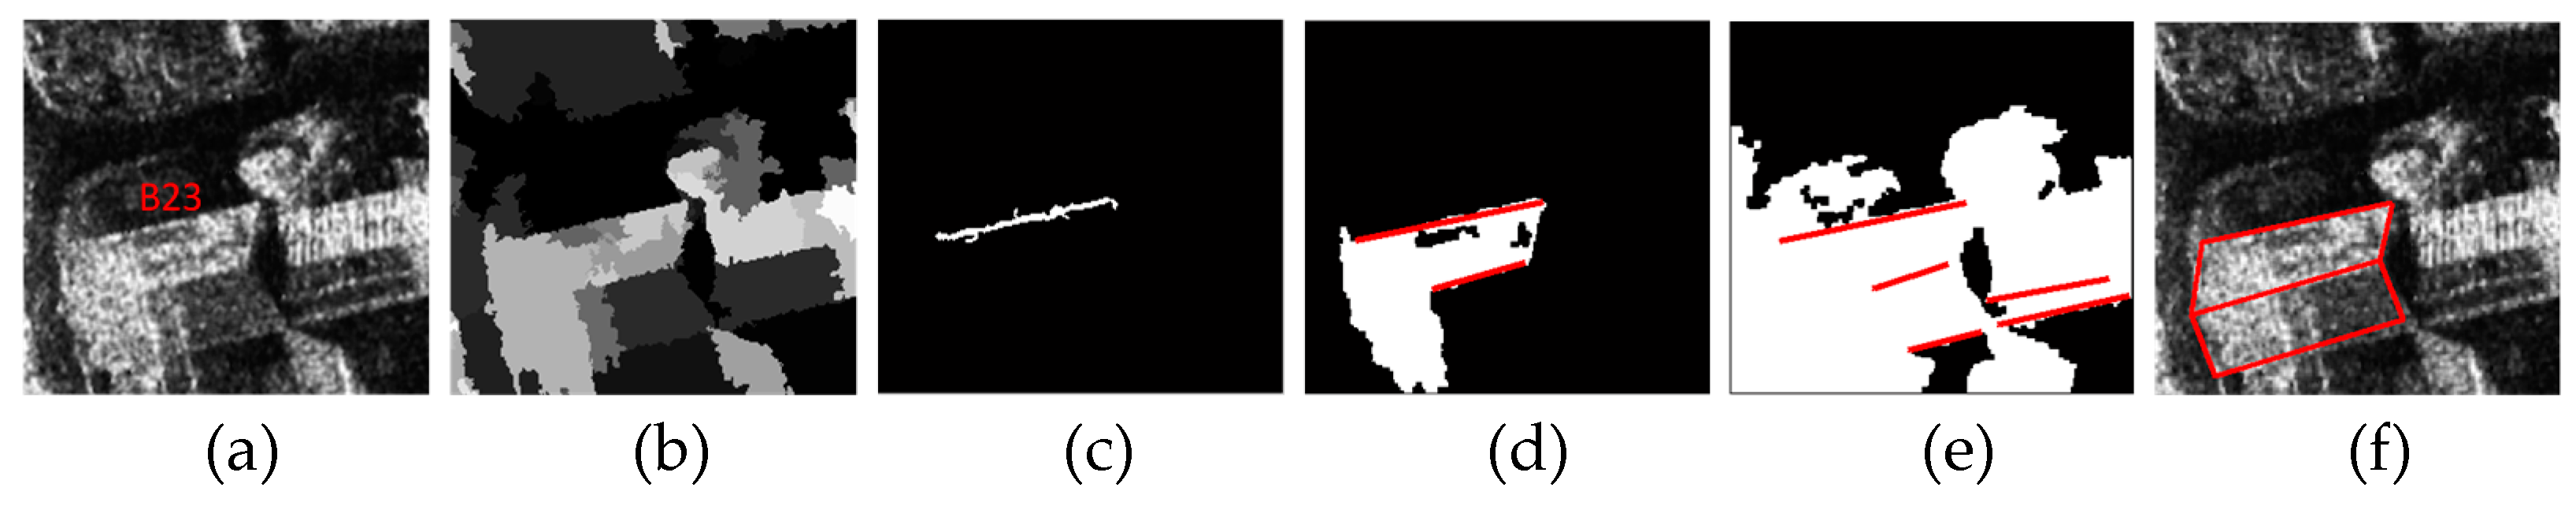
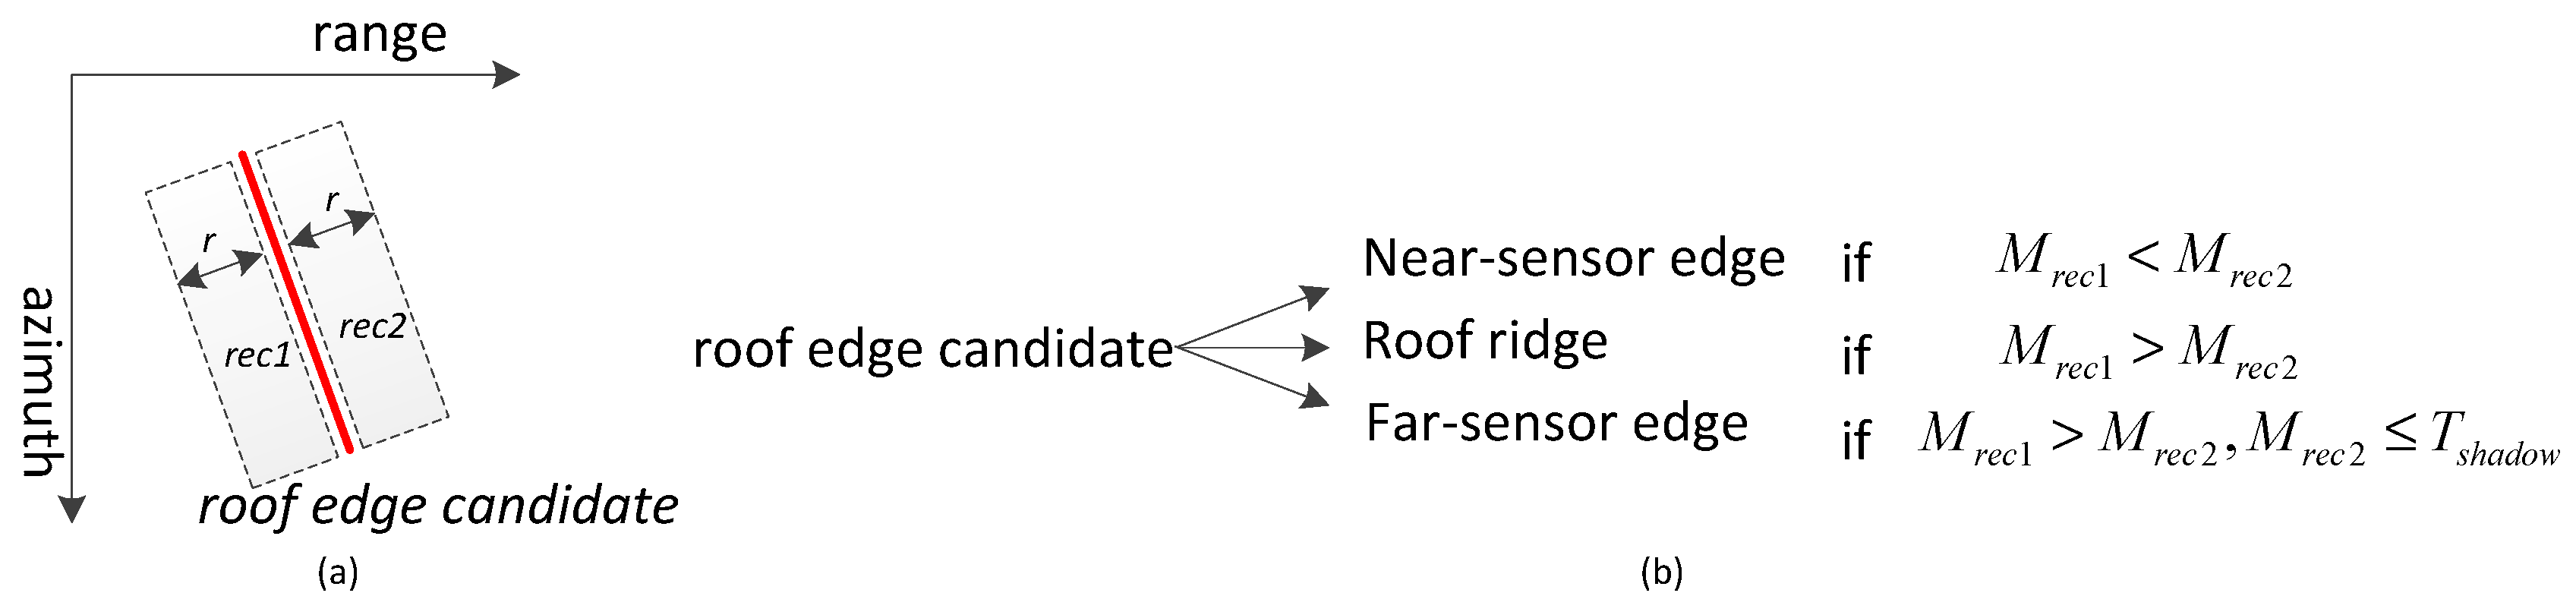
3.1. Edge Extraction and Classification
3.2. Building Candidate Area Extraction
3.3. Parallelogram-Like Roof Patch Extraction
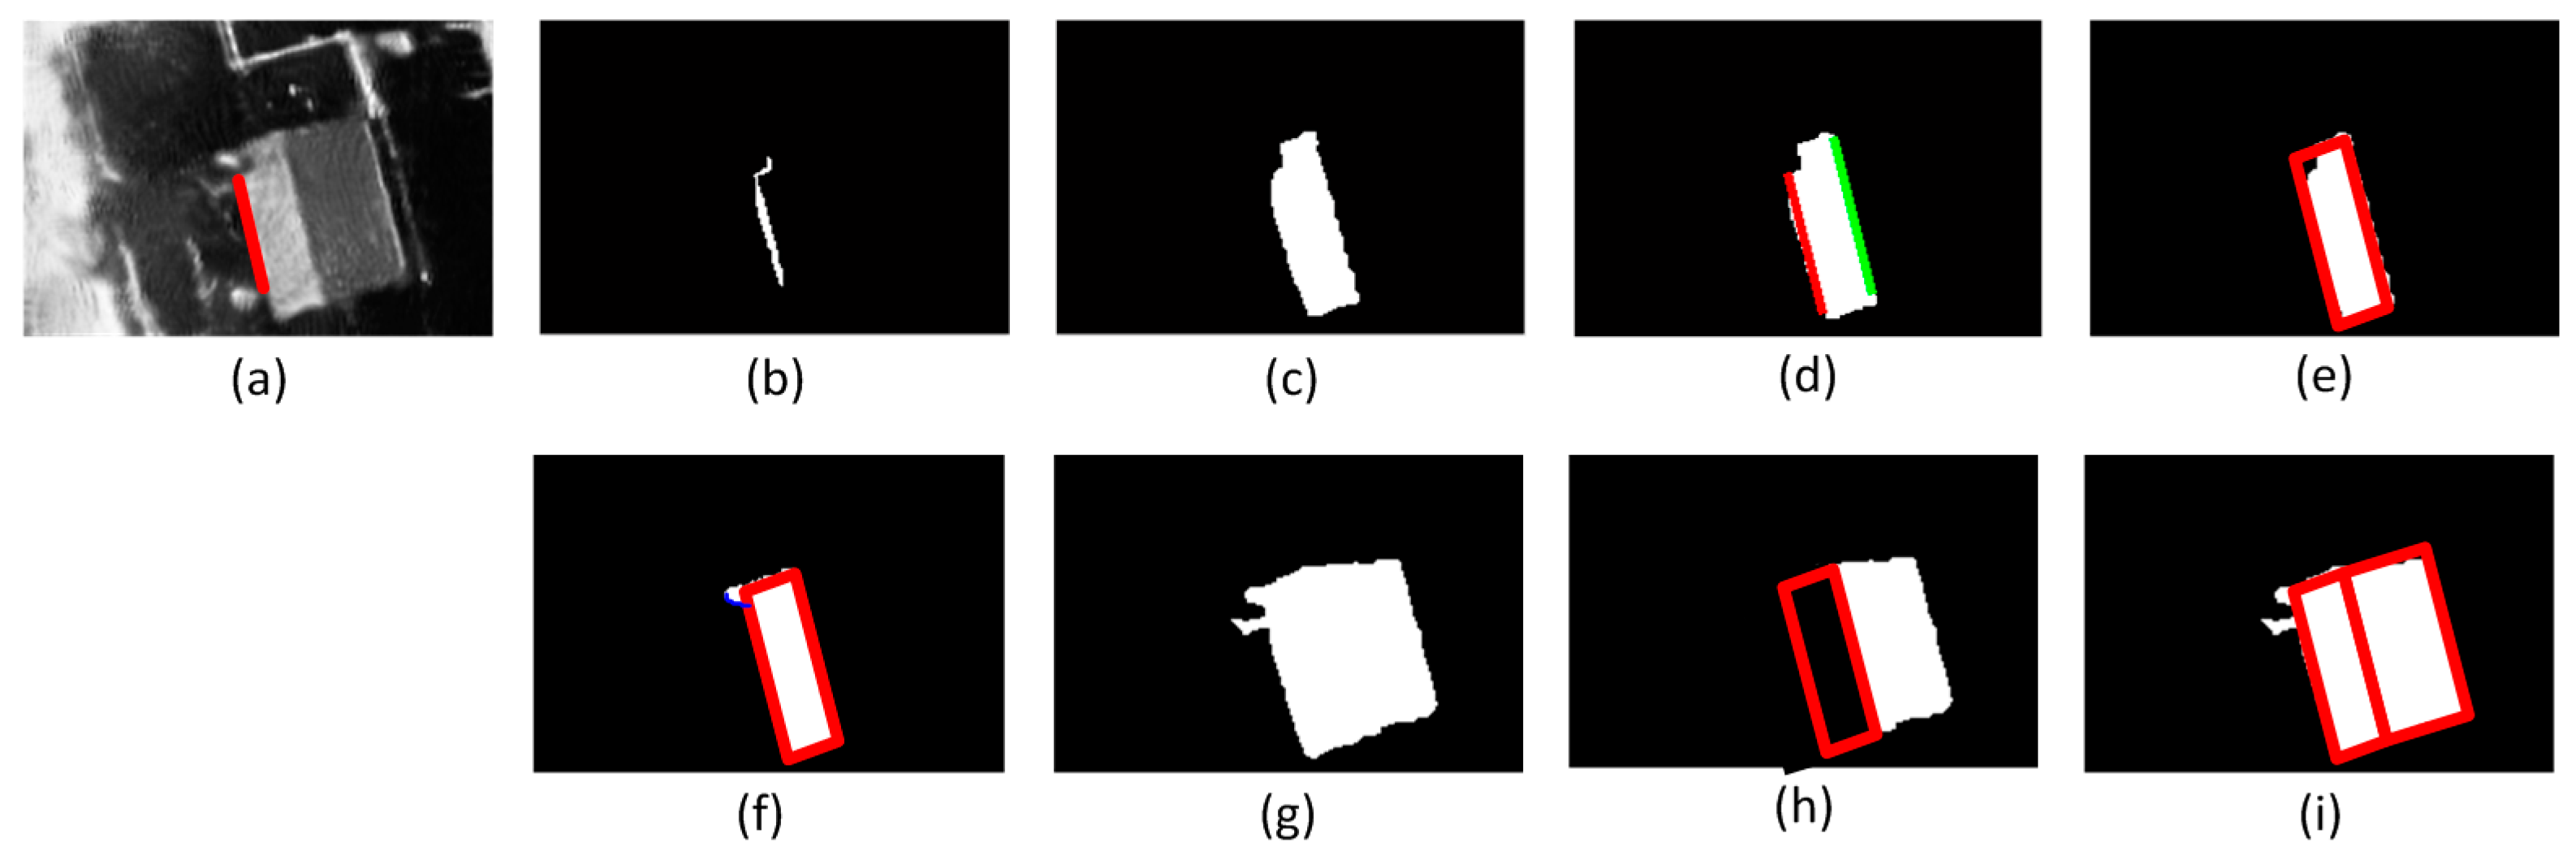
3.3.1. Feature Primitive Extraction and Optimizing
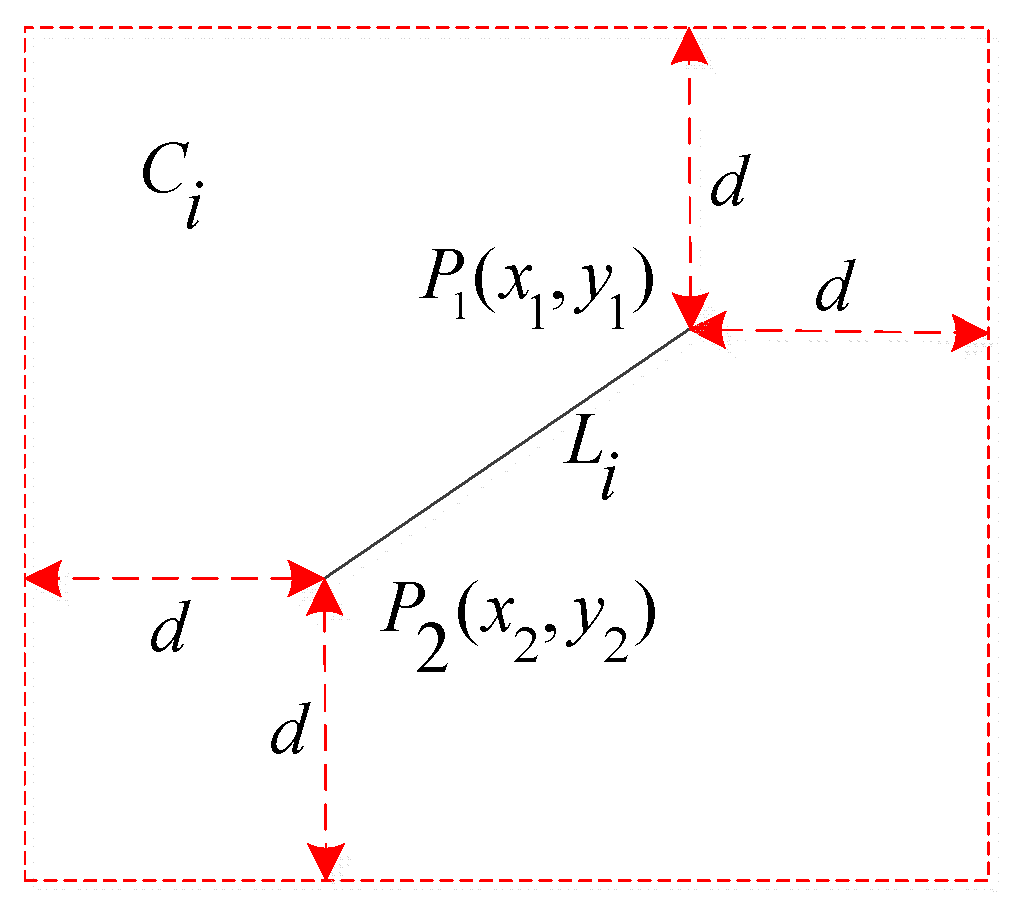
- Shape-constrained feature optimizing. For each pair of parallel edges, is reduced to the region between the two parallel lines, and a parallelogram P is matched by extending the edges. The edge length is set to the midline length of . The cost function can be written aswhere function is an area computing function. The parallelogram P with the minimum is reserved. The corresponding example image is shown in Figure 7e.
- Homogeneity-constrained feature optimizing. The fitted parallelogram P is fused with the mean shift segmentation in this step. First, the segmentation patches that overlap with P are extracted as , and the parallelogram matching function is then computed again to obtain the final P. This processing step is not strictly necessary for the correct operation of the proposed technique but increases the accuracy of roof patch extraction. The corresponding example image is shown in Figure 7f.
3.3.2. Multilevel Thresholds
3.4. Individual Building Identification
4. Materials and Experimental Results
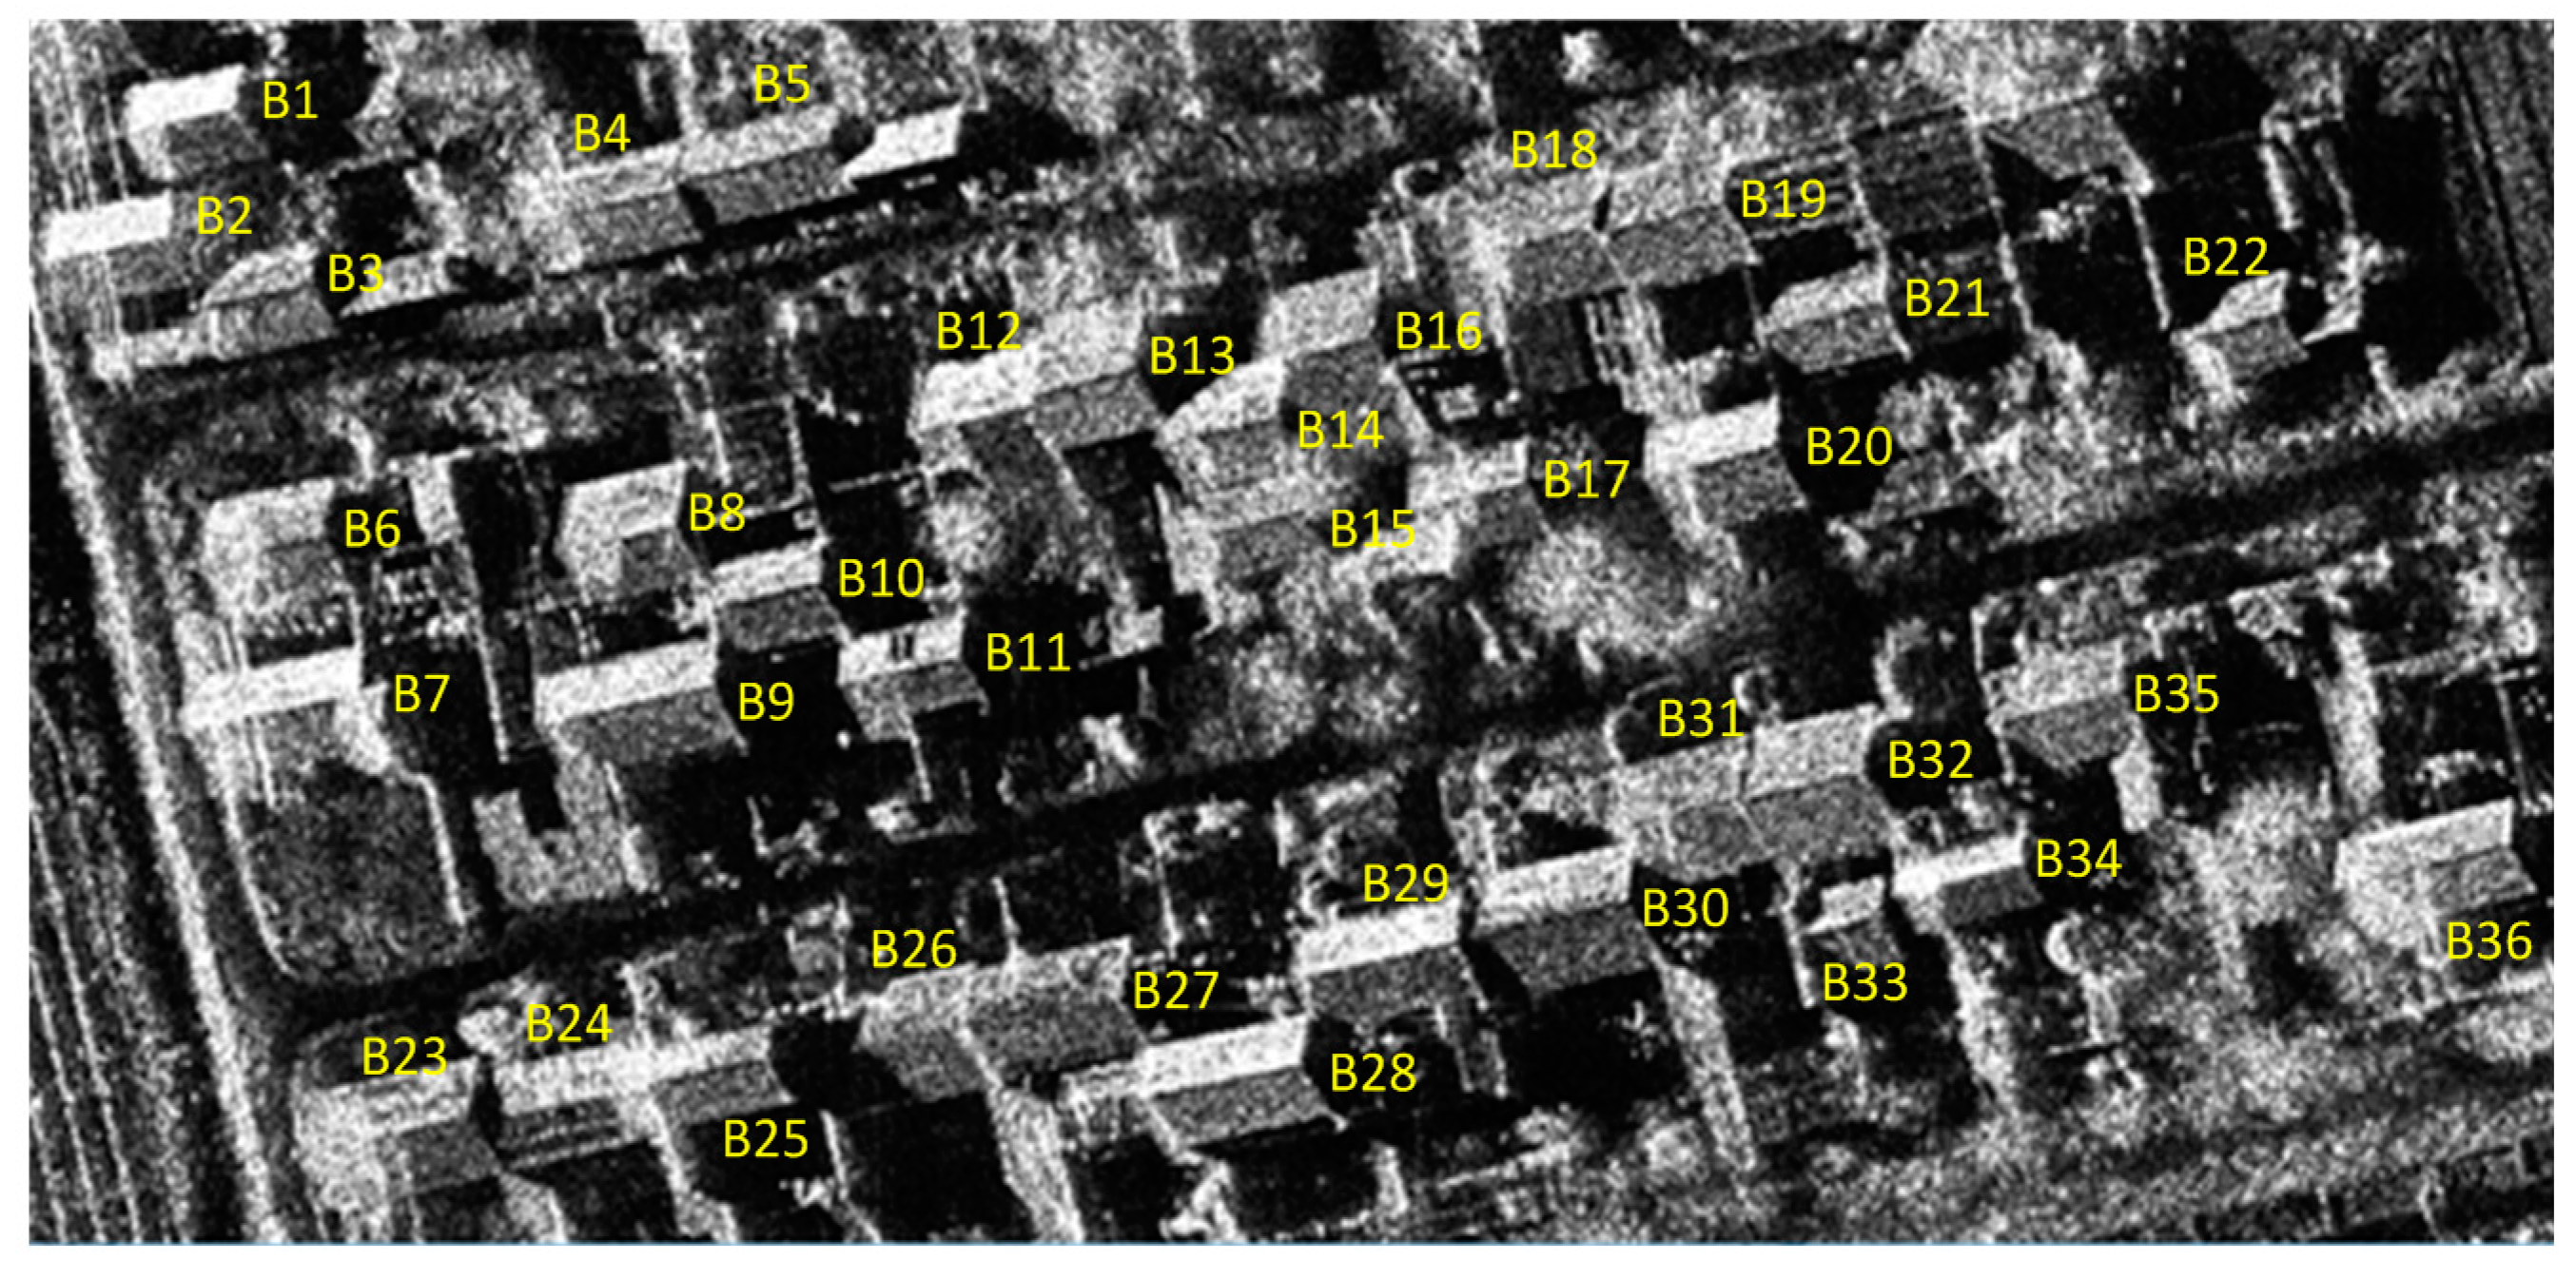
4.1. Test on TerraSAR-X Staring Spotlight SAR Scene
4.2. Test on Chinese Airborne SAR Scene
5. Discussion
6. Conclusion
Acknowledgments
Author Contributions
Conflicts of Interest
References
- Gong, L.; Wang, C.; Wu, F.; Zhang, J.; Zhang, H.; Li, Q. Earthquake-induced building damage detection with post-event sub-meter VHR TerraSAR-X staring spotlight imagery. Remote Sens. 2016, 8, 887. [Google Scholar] [CrossRef]
- Brett, P.T.B.; Guida, R. Earthquake damage detection in urban areas using curvilinear features. IEEE Trans. Geosci. Remote Sens. 2013, 51, 4877–4884. [Google Scholar] [CrossRef] [Green Version]
- Brunner, D.; Lemoine, G.; Bruzzone, L. Earthquake damage assessment of buildings using VHR optical and SAR imagery. IEEE Trans. Geosci. Remote Sens. 2010, 48, 2403–2420. [Google Scholar] [CrossRef]
- Henderson, F.M.; Xia, Z.G. SAR applications in human settlement detection, population estimation and urban land use pattern analysis: A status report. IEEE Trans. Geosci. Remote Sens. 2002, 35, 79–85. [Google Scholar] [CrossRef]
- Simonetto, E.; Oriot, H.; Garello, R. Rectangular building extraction from stereoscopic airborne radar images. IEEE Trans. Geosci. Remote Sens. 2005, 43, 2386–2395. [Google Scholar] [CrossRef]
- Amitrano, D.; Belfiore, V.; Cecinati, F.; Di Martino, G.; Iodice, A.; Mathieu, P.P.; Medagli, S.; Poreh, D.; Riccio, D.; Ruello, G. Urban areas enhancement in multitemporal SAR RGB images using adaptive coherence window and texture information. IEEE J. Sel. Topics Appl. Earth Obs. Remote Sens. 2016, 9, 3740–3752. [Google Scholar] [CrossRef]
- Dubois, C.; Thiele, A.; Hinz, S. Building detection and building parameter retrieval in InSAR phase images. ISPRS J. Photogramm. Rem. Sens. 2016, 114, 228–241. [Google Scholar] [CrossRef]
- Xu, F.; Jin, Y.Q. Automatic reconstruction of building objects from multiaspect meter-resolution SAR images. IEEE Trans. Geosci. Remote Sens. 2007, 45, 2336–2353. [Google Scholar] [CrossRef]
- Gui, R.; Xu, X.; Dong, H.; Song, C.; Pu, F. Individual building extraction from TerraSAR-X images based on ontological semantic analysis. Remote Sens. 2016, 8, 708. [Google Scholar] [CrossRef]
- Franceschetti, G.; Iodice, A.; Riccio, D. A canonical problem in electromagnetic backscattering from buildings. IEEE Trans. Geosci. Remote Sens. 2002, 40, 1787–1801. [Google Scholar] [CrossRef]
- Quartulli, M.; Datcu, M. Stochastic geometrical modeling for built-up area understanding from a single SAR intensity image with meter resolution. IEEE Trans. Geosci. Remote Sens. 2004, 42, 1996–2003. [Google Scholar] [CrossRef]
- Ferro, A.; Brunner, D.; Bruzzone, L. Automatic detection and reconstruction of building radar footprints from single VHR SAR images. IEEE Trans. Geosci. Remote Sens. 2013, 51, 935–952. [Google Scholar] [CrossRef]
- Zhang, F.L.; Shao, Y.; Zhang, X.; Balz, T. Building L-shape footprint extraction from high resolution SAR image. In Processings of the IEEE Joint Urban Remote Sensing Event, Munich, Germany, 11–13 April 2011.
- Lu, P.P.; Du, K.N.; Yu, W.D.; Feng, H. New building signature extraction method from single very high-resolution synthetic aperture radar images based on symmetric analysis. J. Appl. Remote Sens. 2015, 9, 095072. [Google Scholar] [CrossRef]
- Fu, X.Y.; You, H.J.; Fu, K. Building segmentation from high-resolution SAR images based on improved Markov random field. Acta Electron. Sin. 2012, 40, 1141–1147. [Google Scholar]
- Cellier, F.; Oriot, H.; Nicolas, J.M. Introduction of the mean shift algorithm in SAR imagery: Application to shadow extraction for building reconstruction. In Proceedings of the Earsel 3D Remote Sensing Workshop, Porto, Portugal, 6–11 June 2005.
- Zhao, L.J.; zhou, X.G.; Kuang, G.Y. Building detection from urban SAR image using building characteristics and contextual information. EURASIP J. Adv. Signal Proc. 2013, 1, 1–16. [Google Scholar] [CrossRef]
- Chen, S.S.; Wang, H.P.; Xu, F.; Jin, Y.Q. Automatic recognition of isolated buildings on single-aspect SAR image using range detector. IEEE Geosci. Remote Sens. Lett. 2015, 12, 219–223. [Google Scholar] [CrossRef]
- Chaabouni-Chouayakh, H.; Datcu, M. Coarse-to-fine approach for urban area interpretation using Terrasar-X data. IEEE Geosci. Remote Sens. Lett. 2010, 7, 78–82. [Google Scholar] [CrossRef]
- Mittermayer, J.; Wollstadt, S.; Prats-Iraola, P.; Scheiber, R. The TerraSAR-X staring spotlight mode concept. IEEE Trans. Geosci. Remote Sens. 2014, 52, 3695–3706. [Google Scholar] [CrossRef]
- Tapete, D.; Cigna, F.; Donoghue, D.N. ‘Looting marks’ in space-borne SAR imagery: Measuring rates of archaeological looting in Apamea (Syria) with TerraSAR-X Staring Spotlight. Remote Sens. Environ. 2016, 178, 42–58. [Google Scholar] [CrossRef]
- Soergel, U.; Thoennessen, U.; Brenner, A.; Stilla, U. High-resolution SAR data: New opportunities and challenges for analysis of urban areas. IEEE Proc. Radar Sonar Naving. 2006, 153, 294–300. [Google Scholar] [CrossRef]
- Brunner, D.; Lemoine, G.; Bruzzone, L.; Greidanus, H. Building height retrieval from VHR SAR imagery based on an iterative simulation and matching technique. IEEE Trans. Geosci. Remote Sens. 2010, 48, 1487–1504. [Google Scholar] [CrossRef]
- Tang, K.; Fu, K.; Sun, X.; Sun, H.; Wang, H.Q. Signature analysis and 3-D reconstruction of rectangular building in very high resolution SAR images. J. Infrared Millim. Waves. 2013, 32, 198–204. [Google Scholar] [CrossRef]
- Deledalle, C.A.; Denis, L.; Tupin, F.; Reigber, A.; Jäger, M. NL-SAR: A unified non-local framework for resolution-preserving (Pol)(In) SAR denoising. IEEE Trans. Geosci. Remote Sens. 2015, 53, 2021–2038. [Google Scholar] [CrossRef]
- Dellinger, F.; Delon, J.; Gousseau, Y.; Michel, J.; Tupin, F. SAR-sift: A sift-like algorithm for SAR images. IEEE Trans. Geosci. Remote Sens. 2015, 53, 453–466. [Google Scholar] [CrossRef] [Green Version]
- Douglas, D.; Peucker, T. Algorithms for the Reduction of the Number of Points Required to Represent a Digitized Line or its Caricature; John Wiley and Sons. Ltd: New York, NY, USA, 2011; pp. 15–18. [Google Scholar]
- Li, Z.; Liu, G.; Zhang, D.; Xu, Y. Robust single-object image segmentation based on salient transition region. Pattern Recogn. 2016, 52, 317–331. [Google Scholar] [CrossRef]
- Li, Z.; Zhang, D.; Xu, Y.; Liu, C. Modified local entropy-based transition region extraction and thresholding. Appl. Soft Comput. 2011, 11, 5630–5638. [Google Scholar] [CrossRef]
- Simonetto, E.; Oriot, H.; Garello, R. Extraction of industrial structures and DEM from airborne SAR images. In Proceedings of Physics in Signal and Image Processing, Marseille, France, 23–24 January 2001.


| Parameter | TerraSAR-X Staring Spotlight SAR | Chinese Airborne SAR |
|---|---|---|
| range resolution(m) | 1.02 | 0.1 |
| azimuth resolution(m) | 0.24 | 0.1 |
| center incidence angle(deg) | 33 | 58 |
| polarization type | HH | HH |
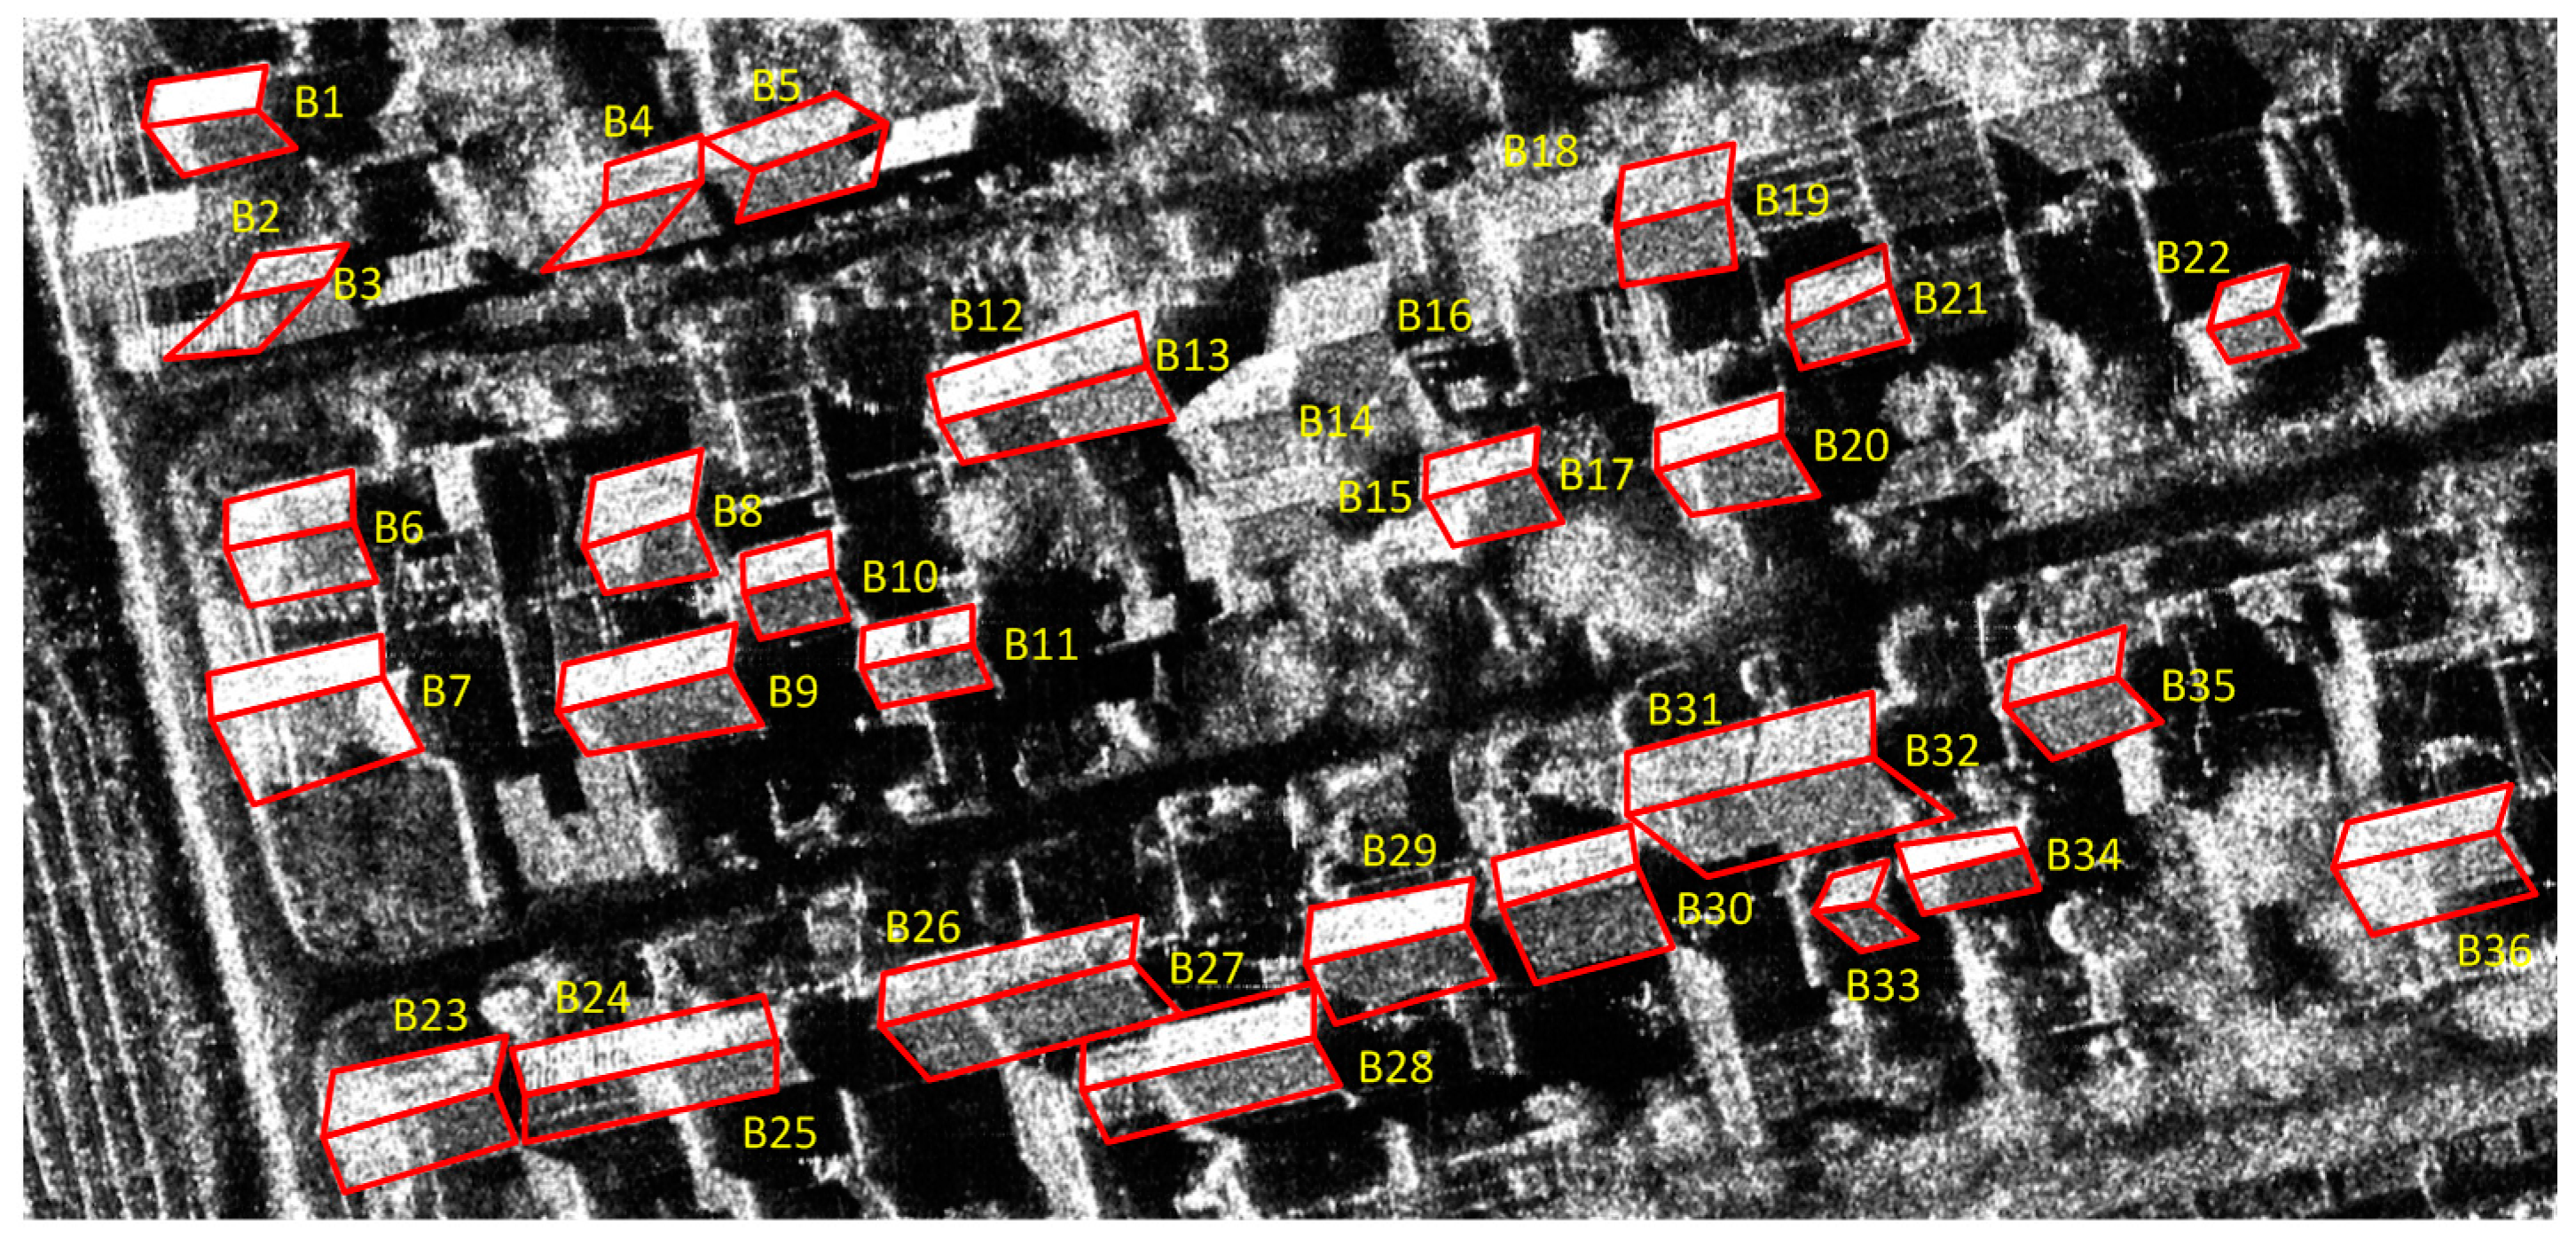
| Total Buildings | Detected Buildings | Partially Detected Buildings | Merged Buildings | False Alarms | Detection Rate |
|---|---|---|---|---|---|
| 36 | 31 | 2 | 4 | 0 | 86% |
© 2017 by the authors. Licensee MDPI, Basel, Switzerland. This article is an open access article distributed under the terms and conditions of the Creative Commons Attribution (CC BY) license ( http://creativecommons.org/licenses/by/4.0/).
Share and Cite
Chen, J.; Wang, C.; Zhang, H.; Wu, F.; Zhang, B.; Lei, W. Automatic Detection of Low-Rise Gable-Roof Building from Single Submeter SAR Images Based on Local Multilevel Segmentation. Remote Sens. 2017, 9, 263. https://doi.org/10.3390/rs9030263
Chen J, Wang C, Zhang H, Wu F, Zhang B, Lei W. Automatic Detection of Low-Rise Gable-Roof Building from Single Submeter SAR Images Based on Local Multilevel Segmentation. Remote Sensing. 2017; 9(3):263. https://doi.org/10.3390/rs9030263
Chicago/Turabian StyleChen, Jinxing, Chao Wang, Hong Zhang, Fan Wu, Bo Zhang, and Wanming Lei. 2017. "Automatic Detection of Low-Rise Gable-Roof Building from Single Submeter SAR Images Based on Local Multilevel Segmentation" Remote Sensing 9, no. 3: 263. https://doi.org/10.3390/rs9030263