1. Introduction
Reflectance is one of the most important properties of glaciers, controlling their surface energy and reflecting the distribution of snow and ice on their surfaces. Typically, solar radiation provides about 75 percent or more of the melt energy for glaciers in summer [
1]. Decreasing reflectance is a vital reason for glacier ablation, and, as a feedback, melting can further decrease reflectance and help accelerate deglaciation [
2,
3]. Seasonal or monthly glacier reflectance variation is an indicator that reflects the timing of precipitation events, which is vital information for water equivalent researches [
1]. Glacier reflectance–elevation relationships can reveal the spatial distribution of the snow cover, and assist to study the glacier mass balance and energy budget. Glacier reflectance/albedo has been obtained using both ground-based measurements and remote-sensing technologies [
4,
5,
6,
7,
8,
9,
10]. The advantages and shortcomings of these two data acquisition methods have been compared [
11]. MODIS and Landsat are two favored remote-sensing datasets used to derive glacier albedo or reflectance. MODIS has the 16-day combined 500 m/1000 m/5600 m resolution albedo products MCD43A, MCD43B, and MCD43C, inverted with multi-data, multi-angular, cloud-free and atmospherically corrected images [
12]. Because of its spatial resolution and covering capacity, the product is usually used to analyze albedo or reflectance variations over a large area. Landsat has provided multispectral data with the 30 m resolution and a 16-day repeat cycle since the 1970s. It can only measure the near-nadir reflectance, and so cannot be used to derive absolute glacier albedo directly. However, this is not a problem when analyzing the monthly or seasonal elevation-related variation trend of reflectance on glaciers. Another major problem when using the dataset is cloud cover, which often leads to discontinuous usable images for a given location. Fortunately, the situation is much improved since the launch of Landsat 8. Compared with Landsat 7, approximately 60% more Landsat 8 scenes are acquired per day, with near-global seasonal coverage [
13,
14].
Factors that can alter the glacier albedo/reflectance such as snowfall, glacier melting, penitents (snow formations found at high altitudes [
15]), surface dust, snow algae, and impurities in ice have been analyzed in depth [
2,
16,
17,
18,
19,
20]. Elevation could be a major factor of reflectance over clean glaciers, because temperature drops with the increasing altitude and melting decreases. Therefore, when analyzing the reflectance patterns for glaciers, the altitude range should be considered. Studying the reflectance–elevation relationship is thus an interesting topic. However, few studies [
16,
20,
21] have addressed the observed temporal variations of glacier reflectance–elevation relationships. These studies usually focus on a particular glacier with a small altitude range, and the temporal series are also discontinuous. The pattern of reflectance–elevation relationship is hard to reveal. This is probably because of the limitations of the data source since the field observation sites are scattered, resolution of the MODIS dataset is inadequate to generate smooth reflectance–elevation signatures, and the temporal series of Landsat data is usually fragmentary. As mentioned above, research on monthly or at least seasonal reflectance–elevation relationships over glacial areas is now realizable thanks to the free Landsat 8 dataset [
22], and we present an example of such research here. Monthly broadband near-NADIR reflectance per 100 m was obtained for twelve glaciers in western China based on 372 scenes of Landsat 8 images acquired from April 2013 to December 2015. Variations of monthly reflectance–elevation relationships and reflectance gradients are analyzed and discussed.
2. Datasets and Methods
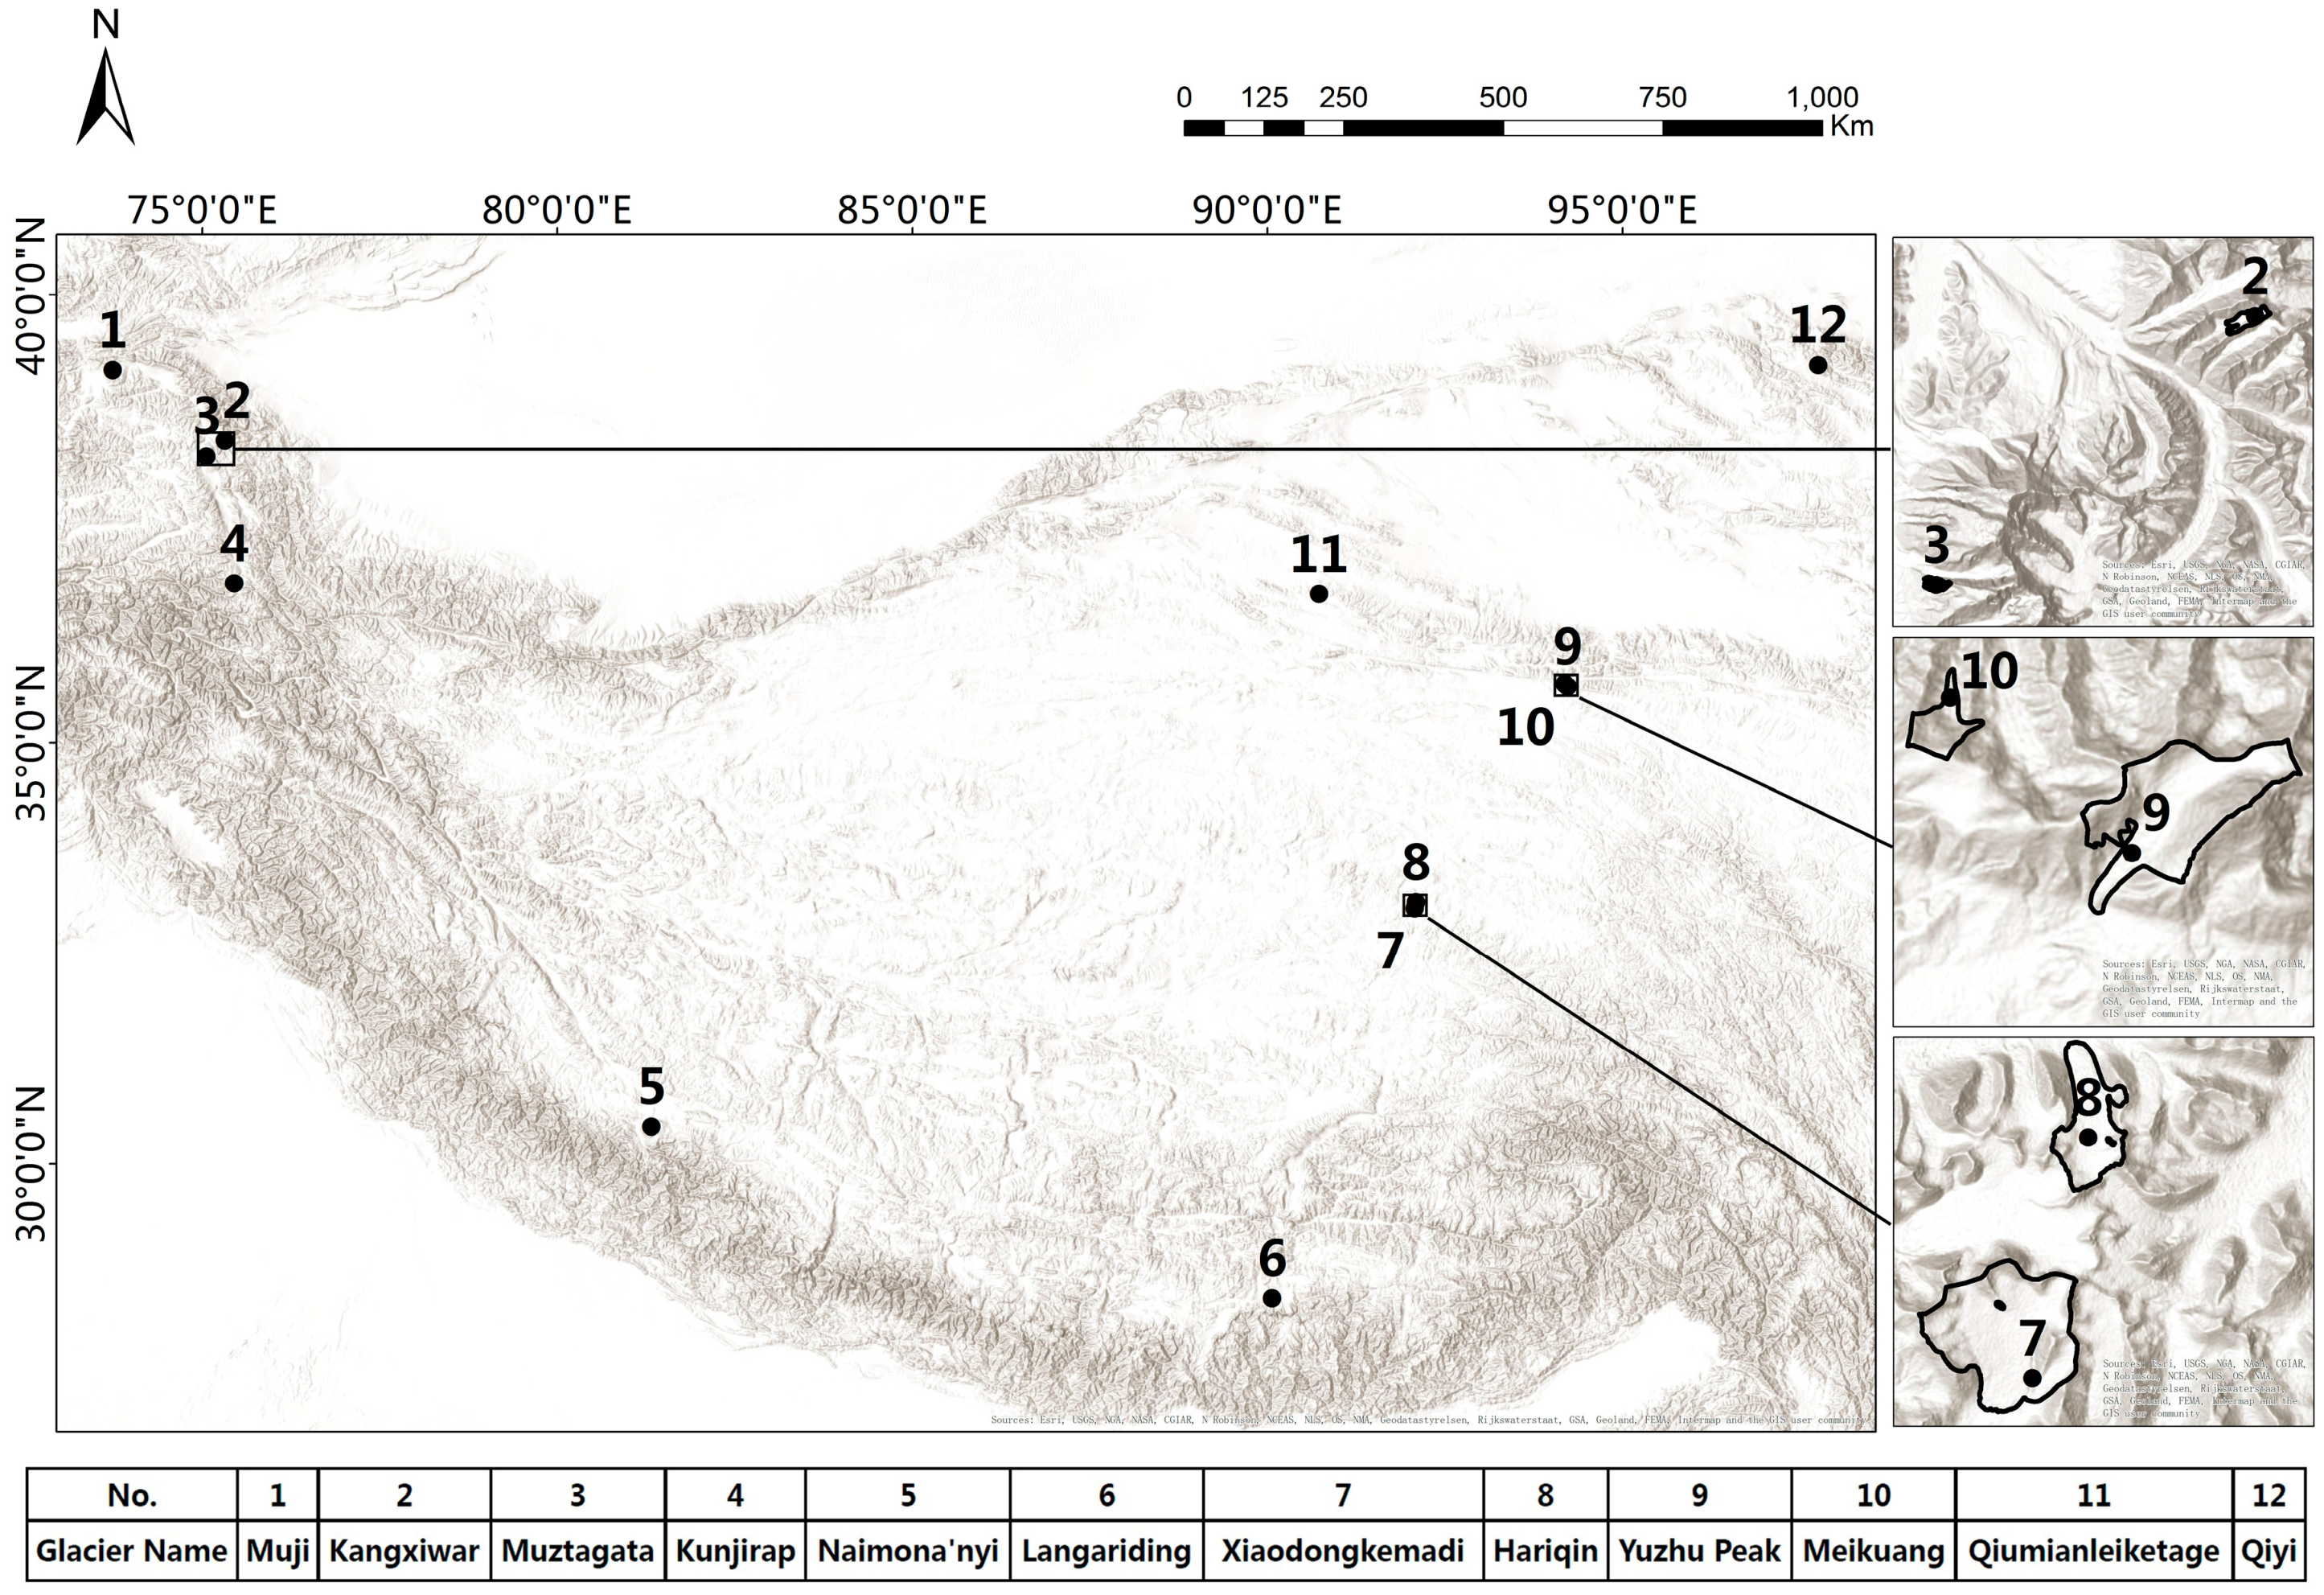
The study area is located in western China. Twelve glaciers in the Qilian, Himalaya, Danggula, Pamir and Karakorum mountains were chosen considering the available data, glacier elevation, climate, and geographical distribution. The chosen glaciers span 3100-m elevation range and basically cover all the typical regions in western China. Note that some regions have more cloud cover which limits the data acquisition, and therefore the selection may have a tendency to choose glaciers in areas with good year-round weather conditions. Information on these glaciers is shown in
Table 1, and their locations are labeled in
Figure 1. Most of them are summer accumulation type glaciers which are mainly influenced by the summer monsoon, and receive most annual precipitation in summer [
23]. Their latitudes range from 28°N to 40°N and are mainly in the temperate zone and mid- latitudes. Summer accumulation type glaciers are especially vulnerable to global warming [
24], so analysis of these glaciers is of particular interest. The altitudes of the selected glaciers extend from 4200 to 7300 m, with (12) Qiyi the lowest, ranging from 4200 m to 5200 m, and (5) Naimona’nyi the highest, ranging from 5500 to 7300 m. We can observe from
Table 1 that two pairs of glaciers ((8) Hariqin and (3) Muztagata; and (10) Meikuang and (1) Muji) have similar altitude extents, but are from different mountains. Three pairs of glaciers ((2) Kangxiwar and (3) Muztagata; (8) Hariqin and (7) Xiaodongkemadi; and (9) Yuzhu Peak and (10) Meikuang) are adjacent to each other, providing good comparability in the analysis. As a benefit from this comparability, we constitute two glacier groups considering their locations and altitudes for further comparison. Group (A) comprises: (1) Muji; (9) Yuzhu Peak; and (10) Meikuang. (1) Muji and (10) Meikuang have identical elevation extents, and (9) Yuzhu Peak and (10) Meikuang are contiguous. Group (B) comprises: (2) Kangxiwar; (3) Muztagata; (8) Hariqin; and (7) Xiaodongkemadi. (3) Muztagata and (8) Hariqin have the same elevation extent and are, respectively, adjacent to (2) Kangxiwar and (7) Xiaodongkemadi. We think the analysis of these two groups of glaciers can help us understand the dominant factors of glacier reflectance, because the environmental factors such as temperature and precipitation mainly vary with altitudes and locations.
To obtain the reflectance gradients of these twelve glaciers, we collected all the available Landsat 8 data until the start of this work for the corresponding regions. The vector data of selected glaciers are from the published dataset of the second glacier inventory of China in December 2014 [
26]. A total of 372 Landsat 8 images were collected from April 2013 to December 2015. All the images were acquired around local 10:30 a.m. (equivalently 12:30 p.m., China standard time) as a compromise between terrain shadow at low solar elevations and development of cloud cover closer towards noon. Landsat 8 operates in the visible, near-infrared, short wave infrared, and thermal infrared spectrums, and provides imagery with resolution of 15/30/100 m (panchromatic/multispectral/thermal) of Earth’s land surface and polar regions [
14]. It regularly acquires 725 scenes per day (Landsat 7 acquires 438 scenes per day). This increases the probability of capturing cloud-free scenes for the global landmass [
22]. For all twelve glaciers, almost every month has image acquisition, which provides the possibility for inversion of monthly or seasonal reflectance gradients. A digital elevation model (DEM) is also required. Therefore, we have collected the Advanced Spaceborne Thermal Emission and Reflection Radiometer Global Digital Elevation Model (ASTER GDEM) V002 data [
27]. The spatial resolution of this DEM product is about 30 m and the altitude precision is 20 m. The product was published in October 2011 and is a good match for the Landsat 8 data in the spatial resolution. The GDEM product was validated by organizations such as USGS, NASA, and NGA using other DEM products and benchmarks in 2011, and the average elevation error is around 12 m [
27]. Considering that we only use the DEM to analyze the variation trend of glacier reflectance for every 100 m, the accuracy is enough for the study.
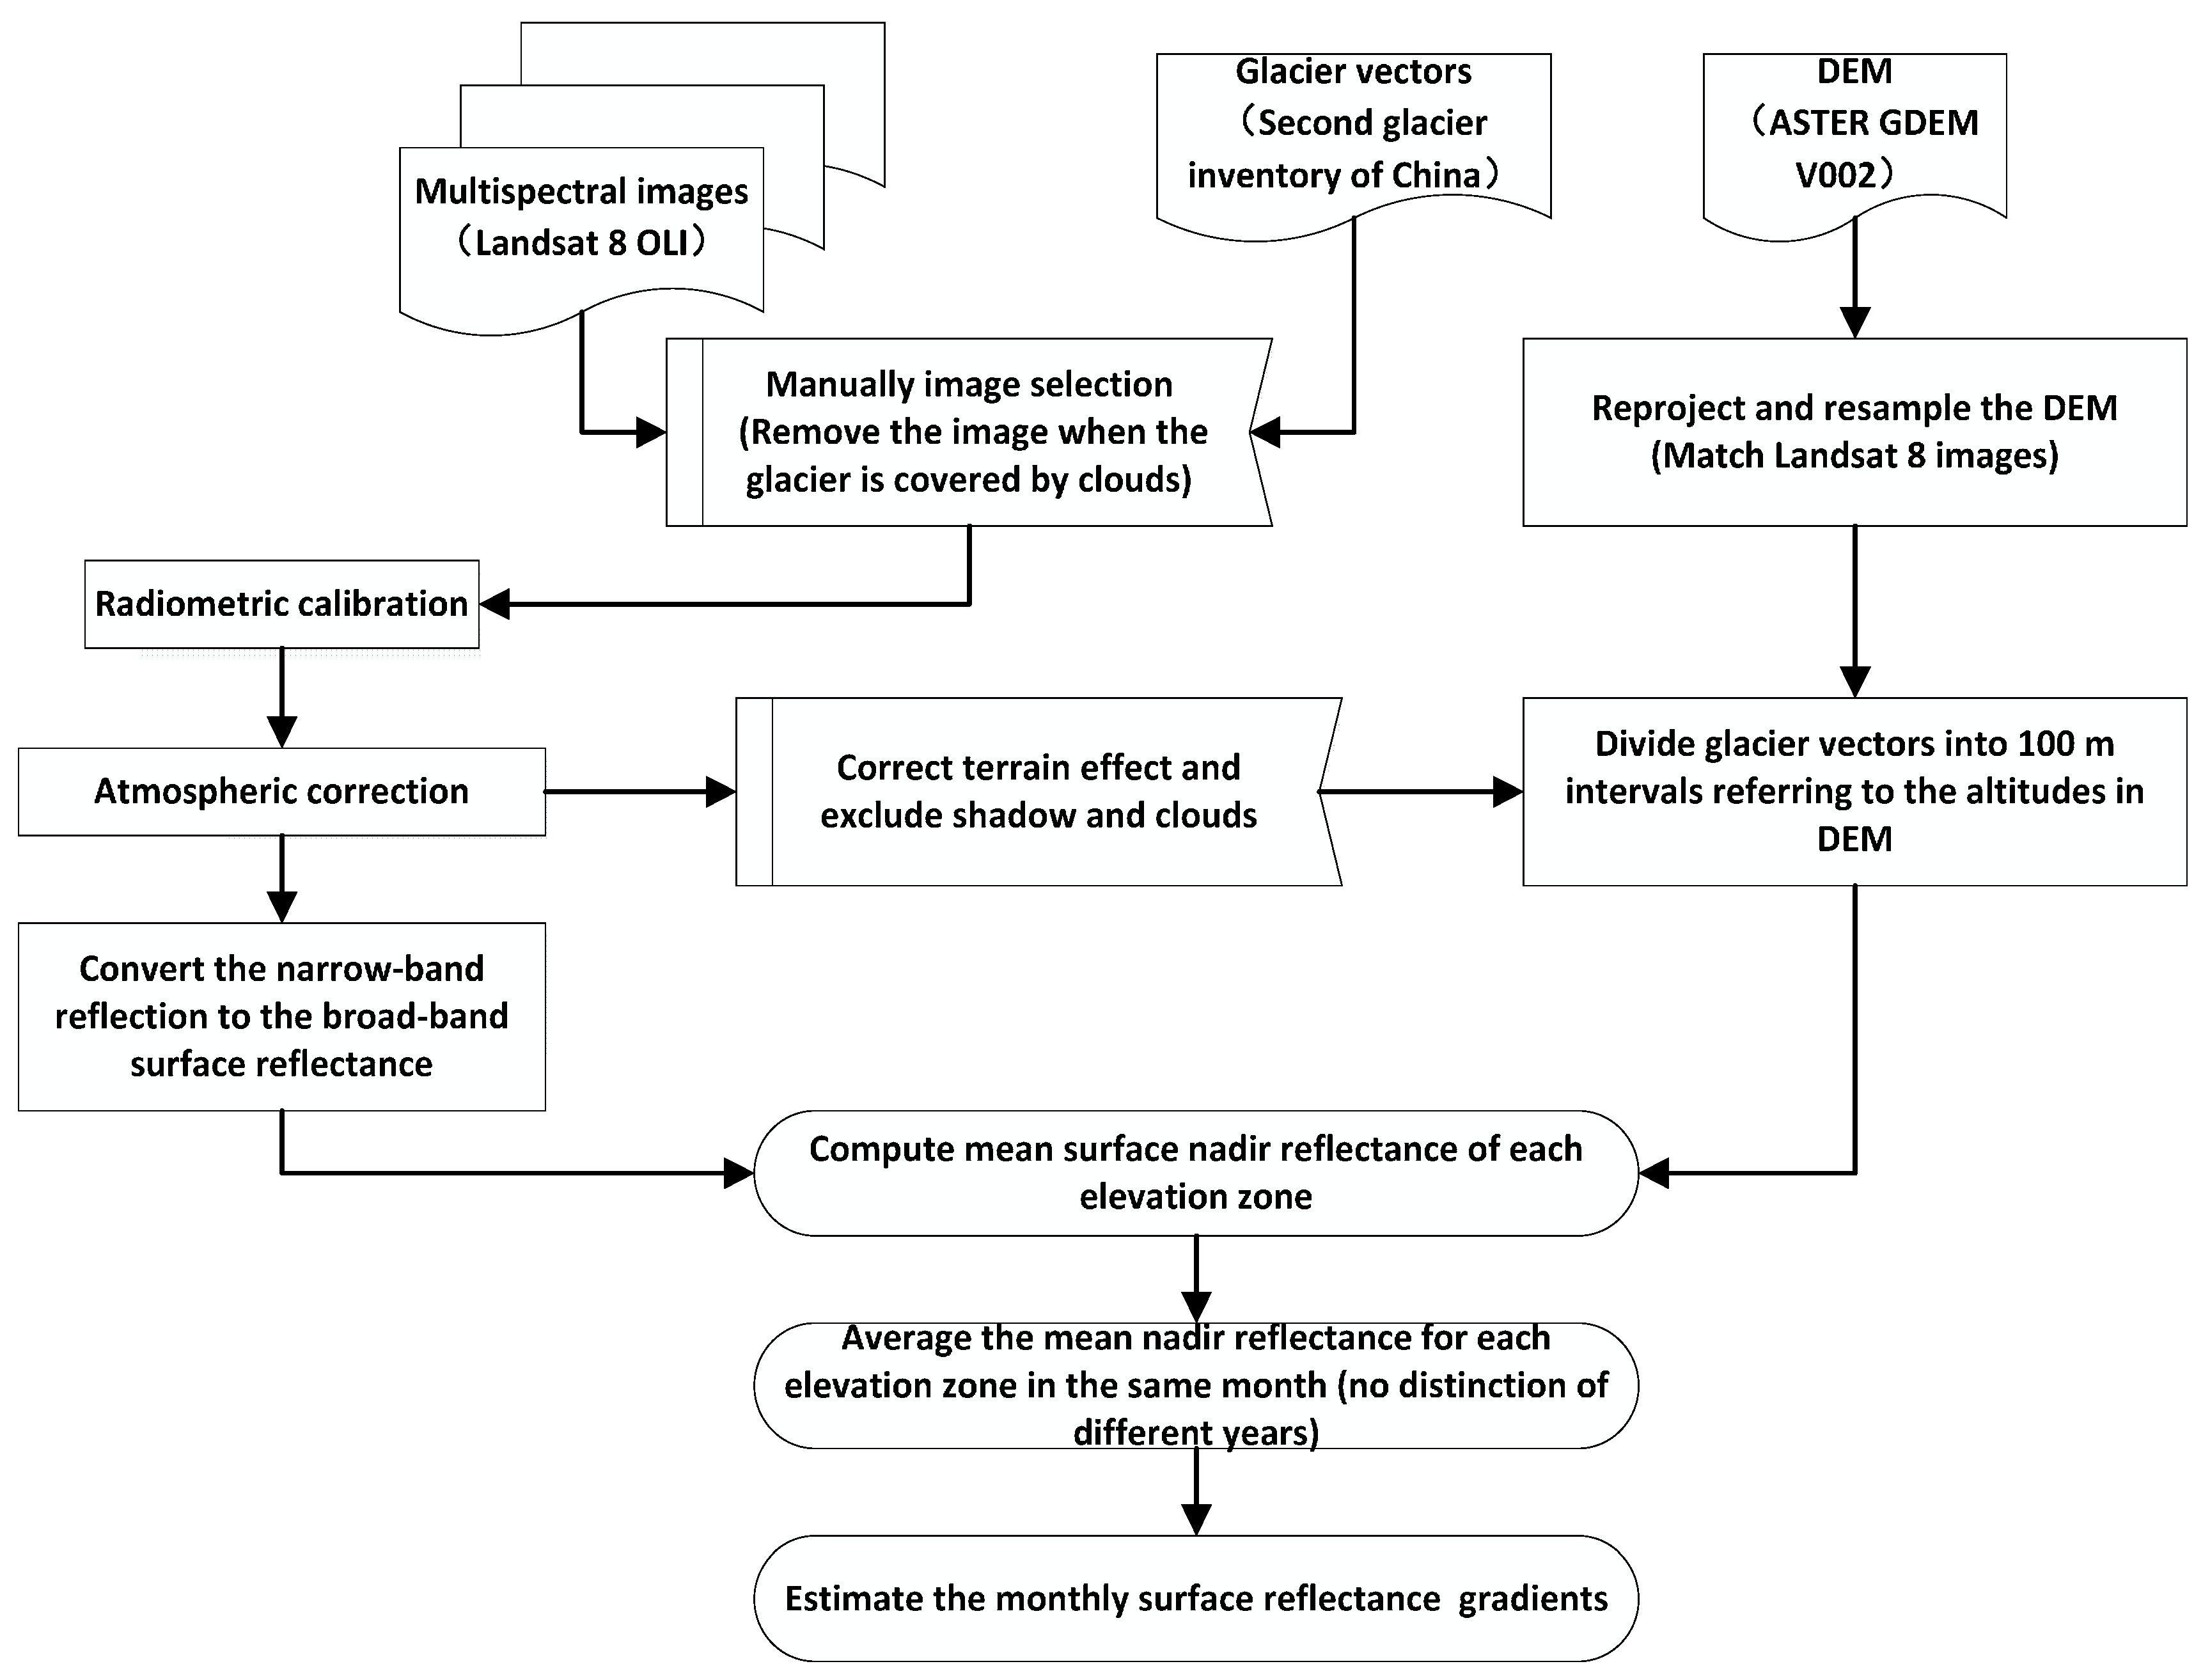
Figure 2 presents a flowchart of the extraction of monthly broadband near-nadir reflectance–elevation relationship using time series Landsat 8 OLI data, glacier vectors, and ASTER GDEM V002 data of the twelve selected glaciers. The SRTM DEM has not been used due to its earlier acquisition date. Before processing, all the Landsat 8 images obtained are manually checked to ensure adequate data quality, which means the glaciers should not be covered by clouds. The GDEM products are reprojected into the UTM projection (the projection zone of each DEM image is decided by the longitude extent) and resampled using the nearest neighbor interpolating method and 25-pixel triangulation warping [
28] to match the Landsat 8 imagery. The calibration method used to obtain reflectance from DN values in units of Wm
−2·sr
−1·μm
−1 is provided by USGS [
29]. The Quick Atmospheric Correction (QUAC) [
30] is applied to implement the atmospheric correction. The QUAC determines atmospheric correction parameters directly from the observed pixel spectra in the scene, with no requirement for ancillary information. It is thus more suitable for batch processing, though it performs a more approximate atmospheric correction than the Fast Line-of-sight Atmospheric Analysis of Hypercubes (FLAASH) [
31] and other physics-based methods. Its deviation is generally within 10% of the ground truth reflectance spectra [
32]. Finally, we adopt the method proposed in [
33] to convert narrow-band reflections to the broadband reflectance. The band indexes are modified to fit the spectral bands of Landsat 8.
where
is the shortwave reflectance and
is the spectral reflectance in band
i of OLI.
To obtain the reflectance–elevation signatures, glacier vectors are divided into 100 m intervals referring to the altitudes in the GDEM product. Reflectance within each vector partition is averaged to reveal the relationship between reflectance and elevations for each glacier. The Topographic/C-correction tool [
34] is adopted to implement the terrain effect which considers the solar elevation angle, solar azimuth angle, and local DEM. Glaciers on slopes inclined away from the sun will result in shadows and affect the reflectance estimation. Therefore, glacier areas in shadows are excluded for each image in the post-processing. Moreover, cloud areas over the glaciers are also excluded before the reflectance averaging. As a result of these two steps, the reflectance of a few elevation zones or months is missing for several glaciers. To fill these gaps, reflectance in the same month but from different years is averaged to obtain the monthly reflectance–elevation relationships. Finally, monthly reflectance gradients for each glacier are estimated with the linear fitting method.
3. Results
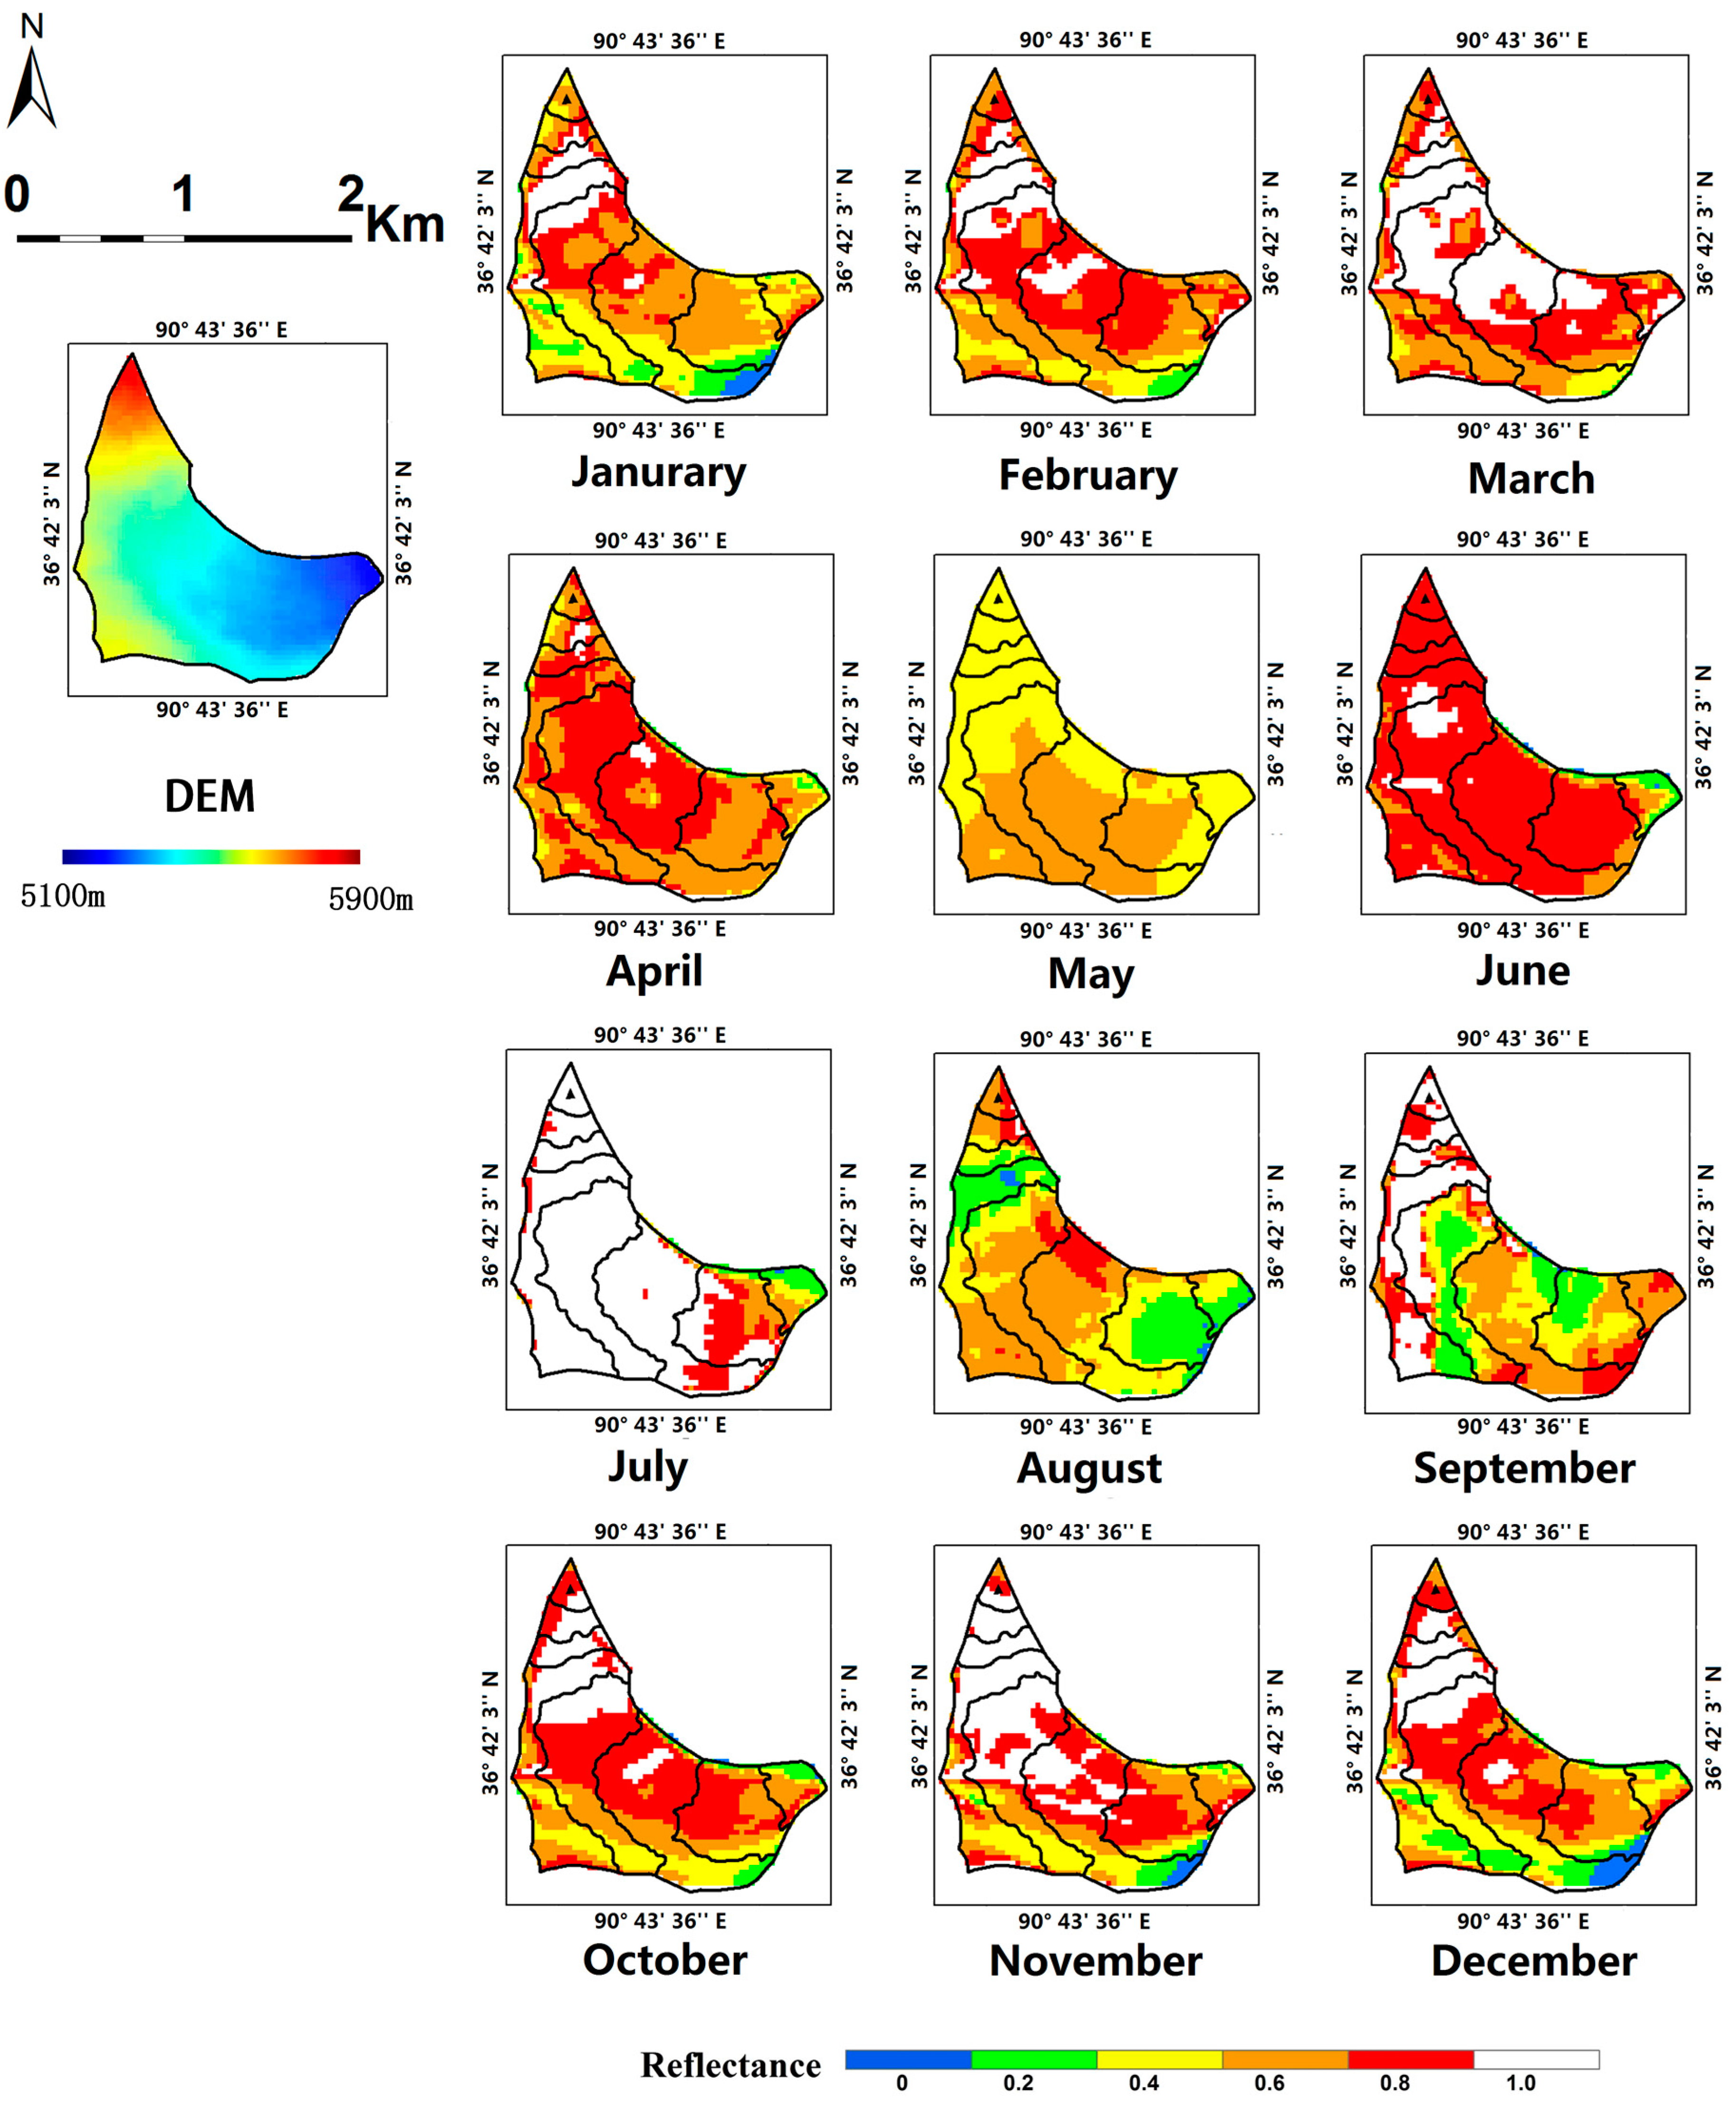
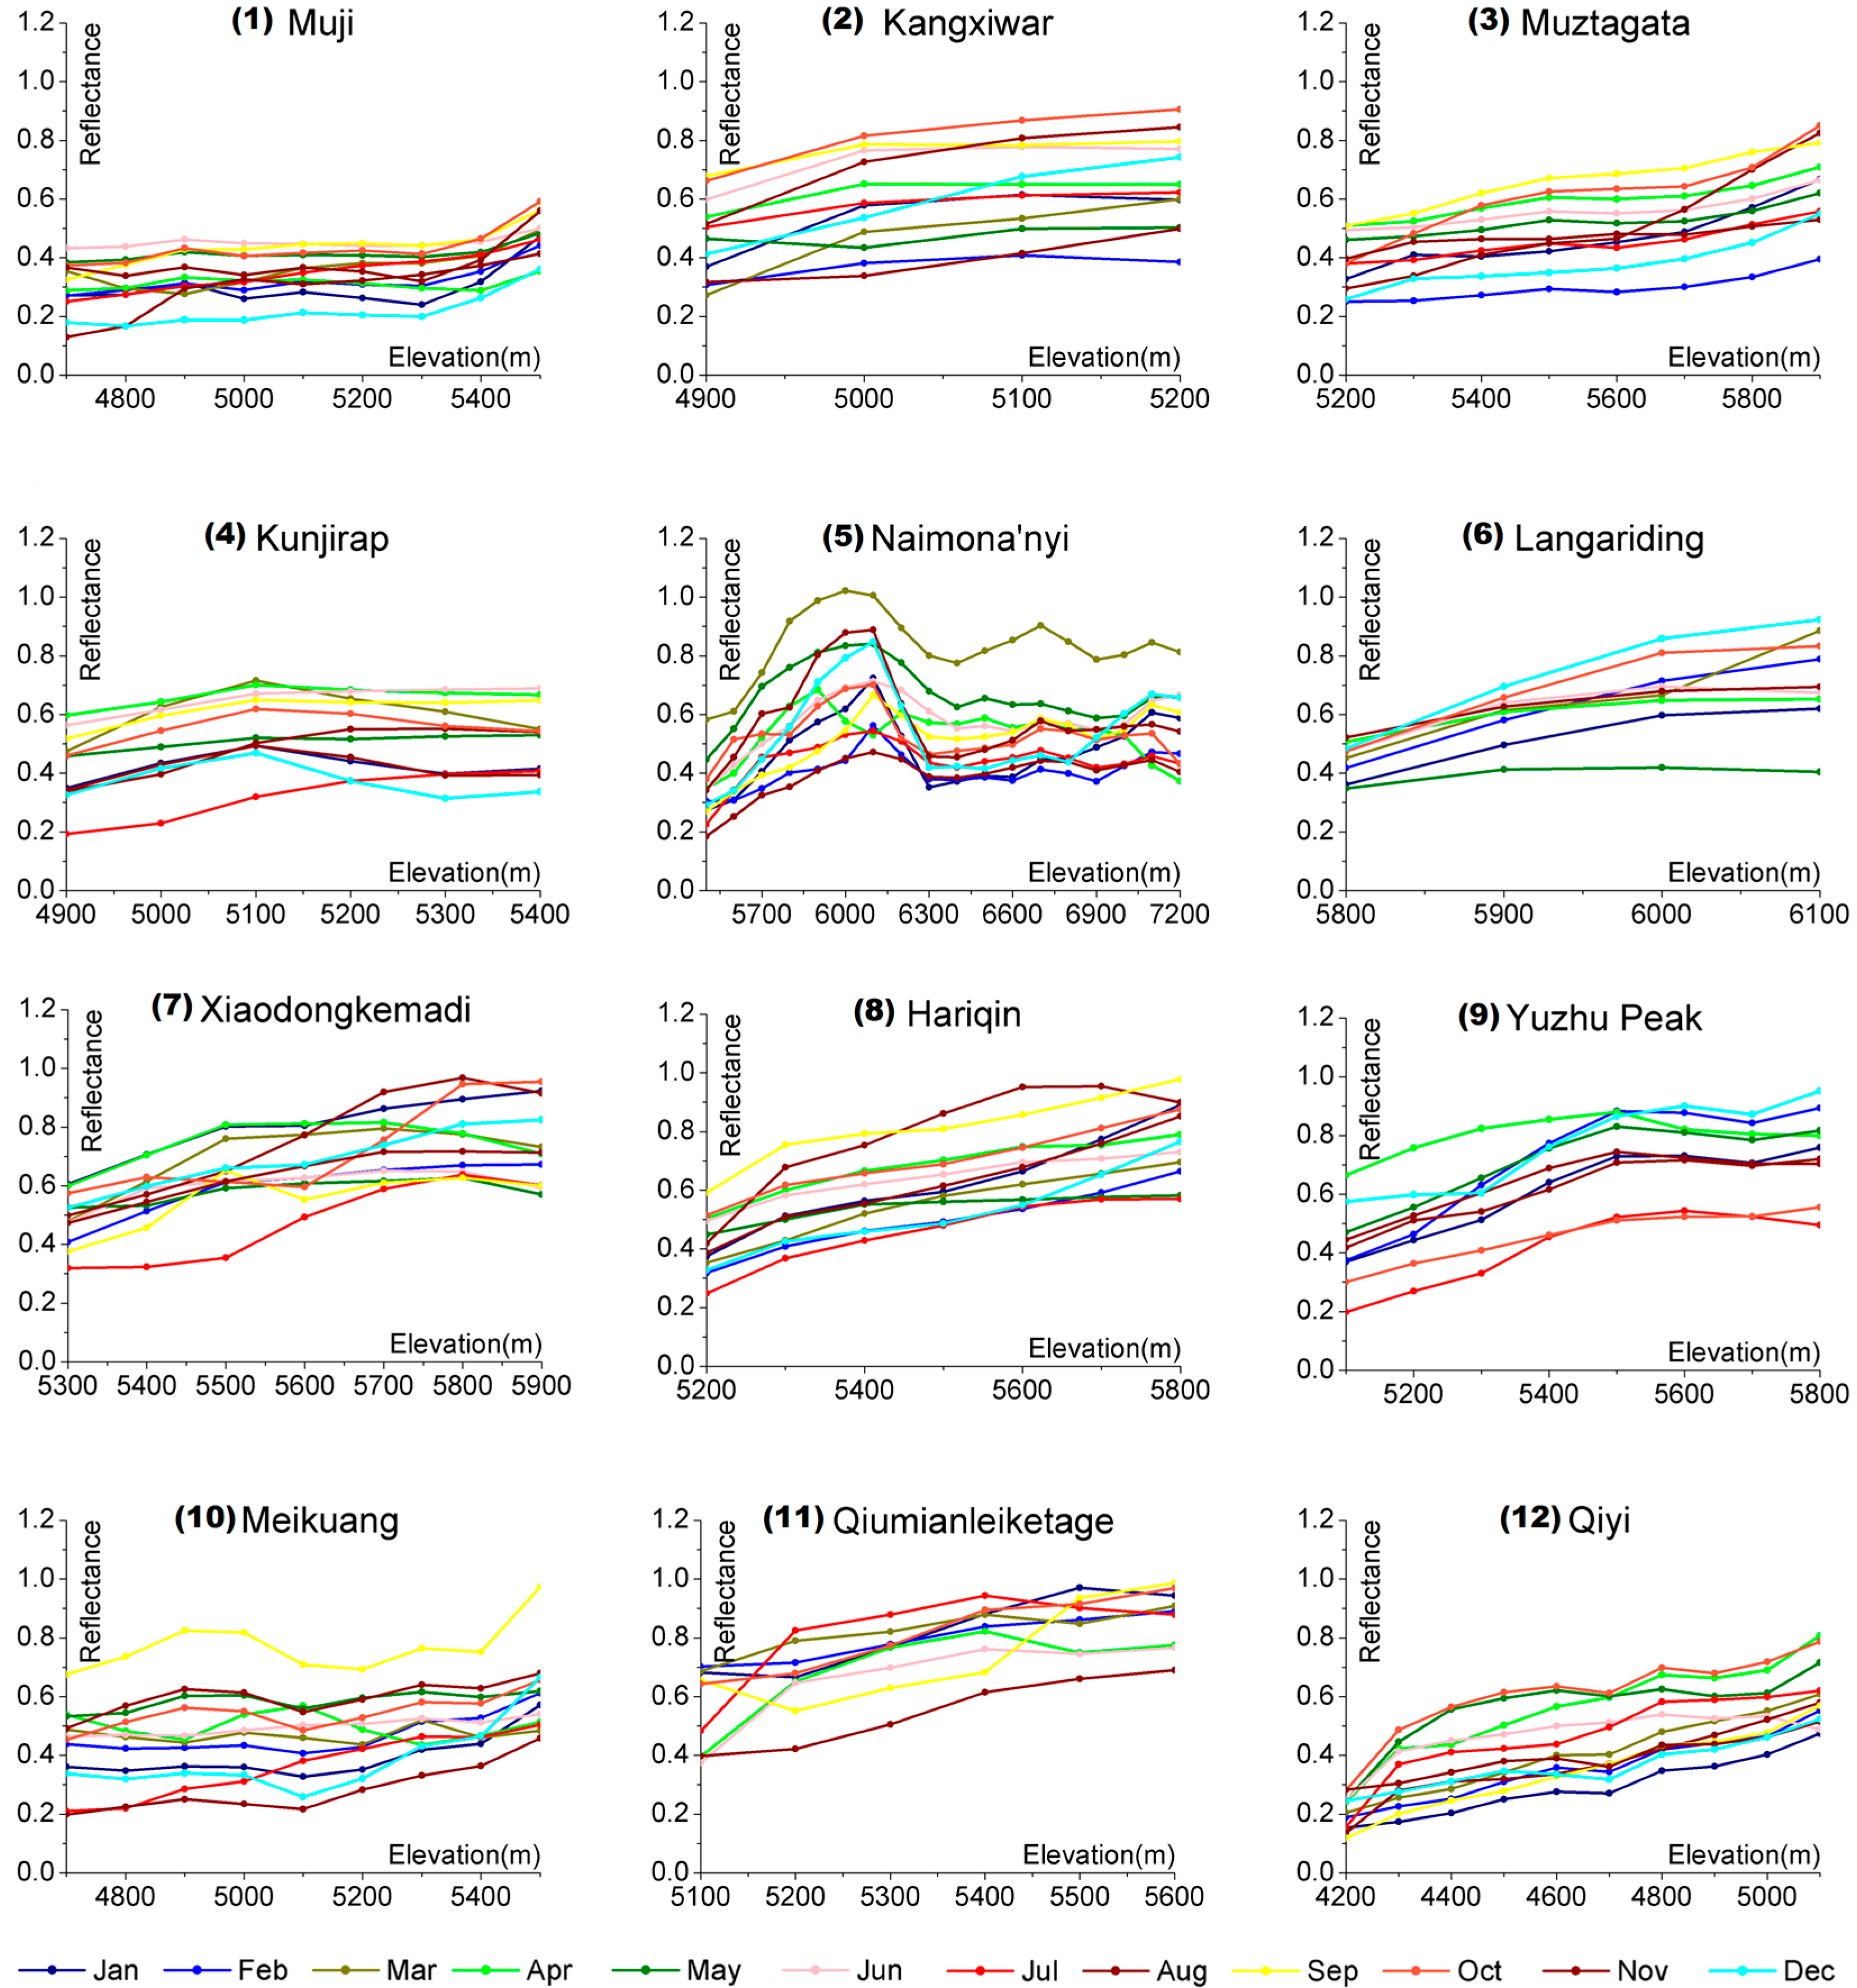
Examples of the extracted monthly reflectance for four glaciers are shown in
Appendix A. The uncertainty is about ±0.02 [
33,
35].
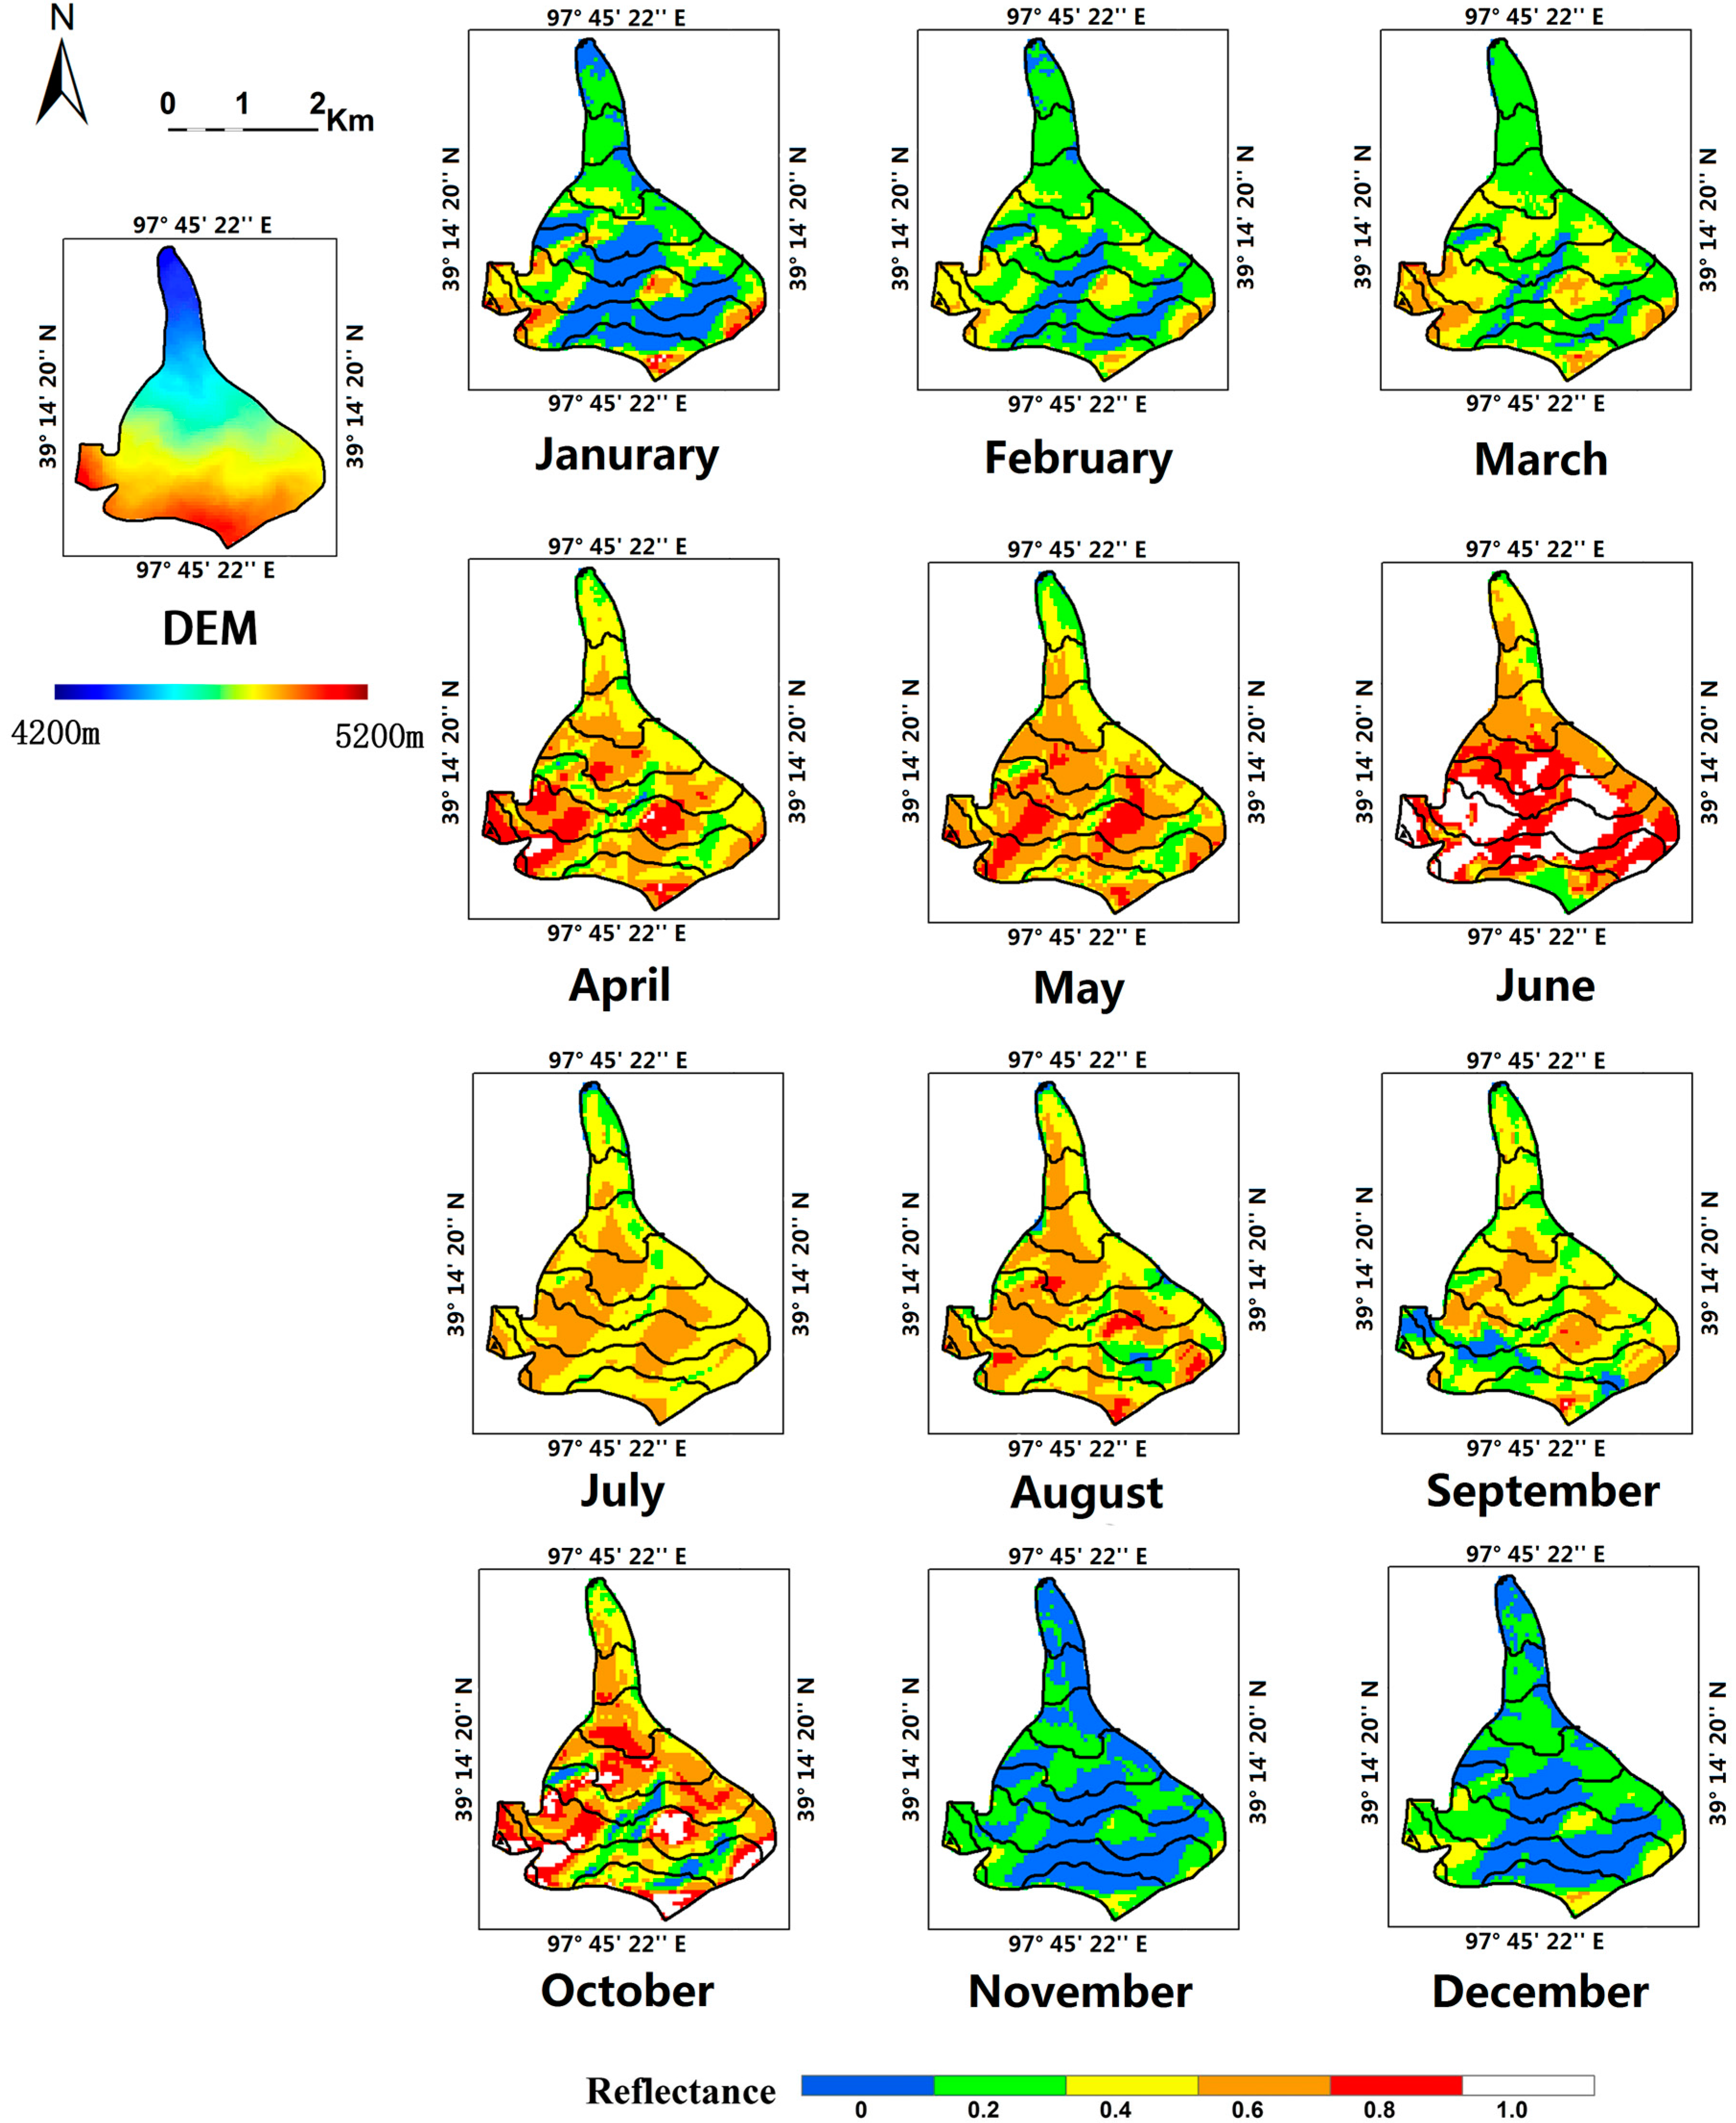
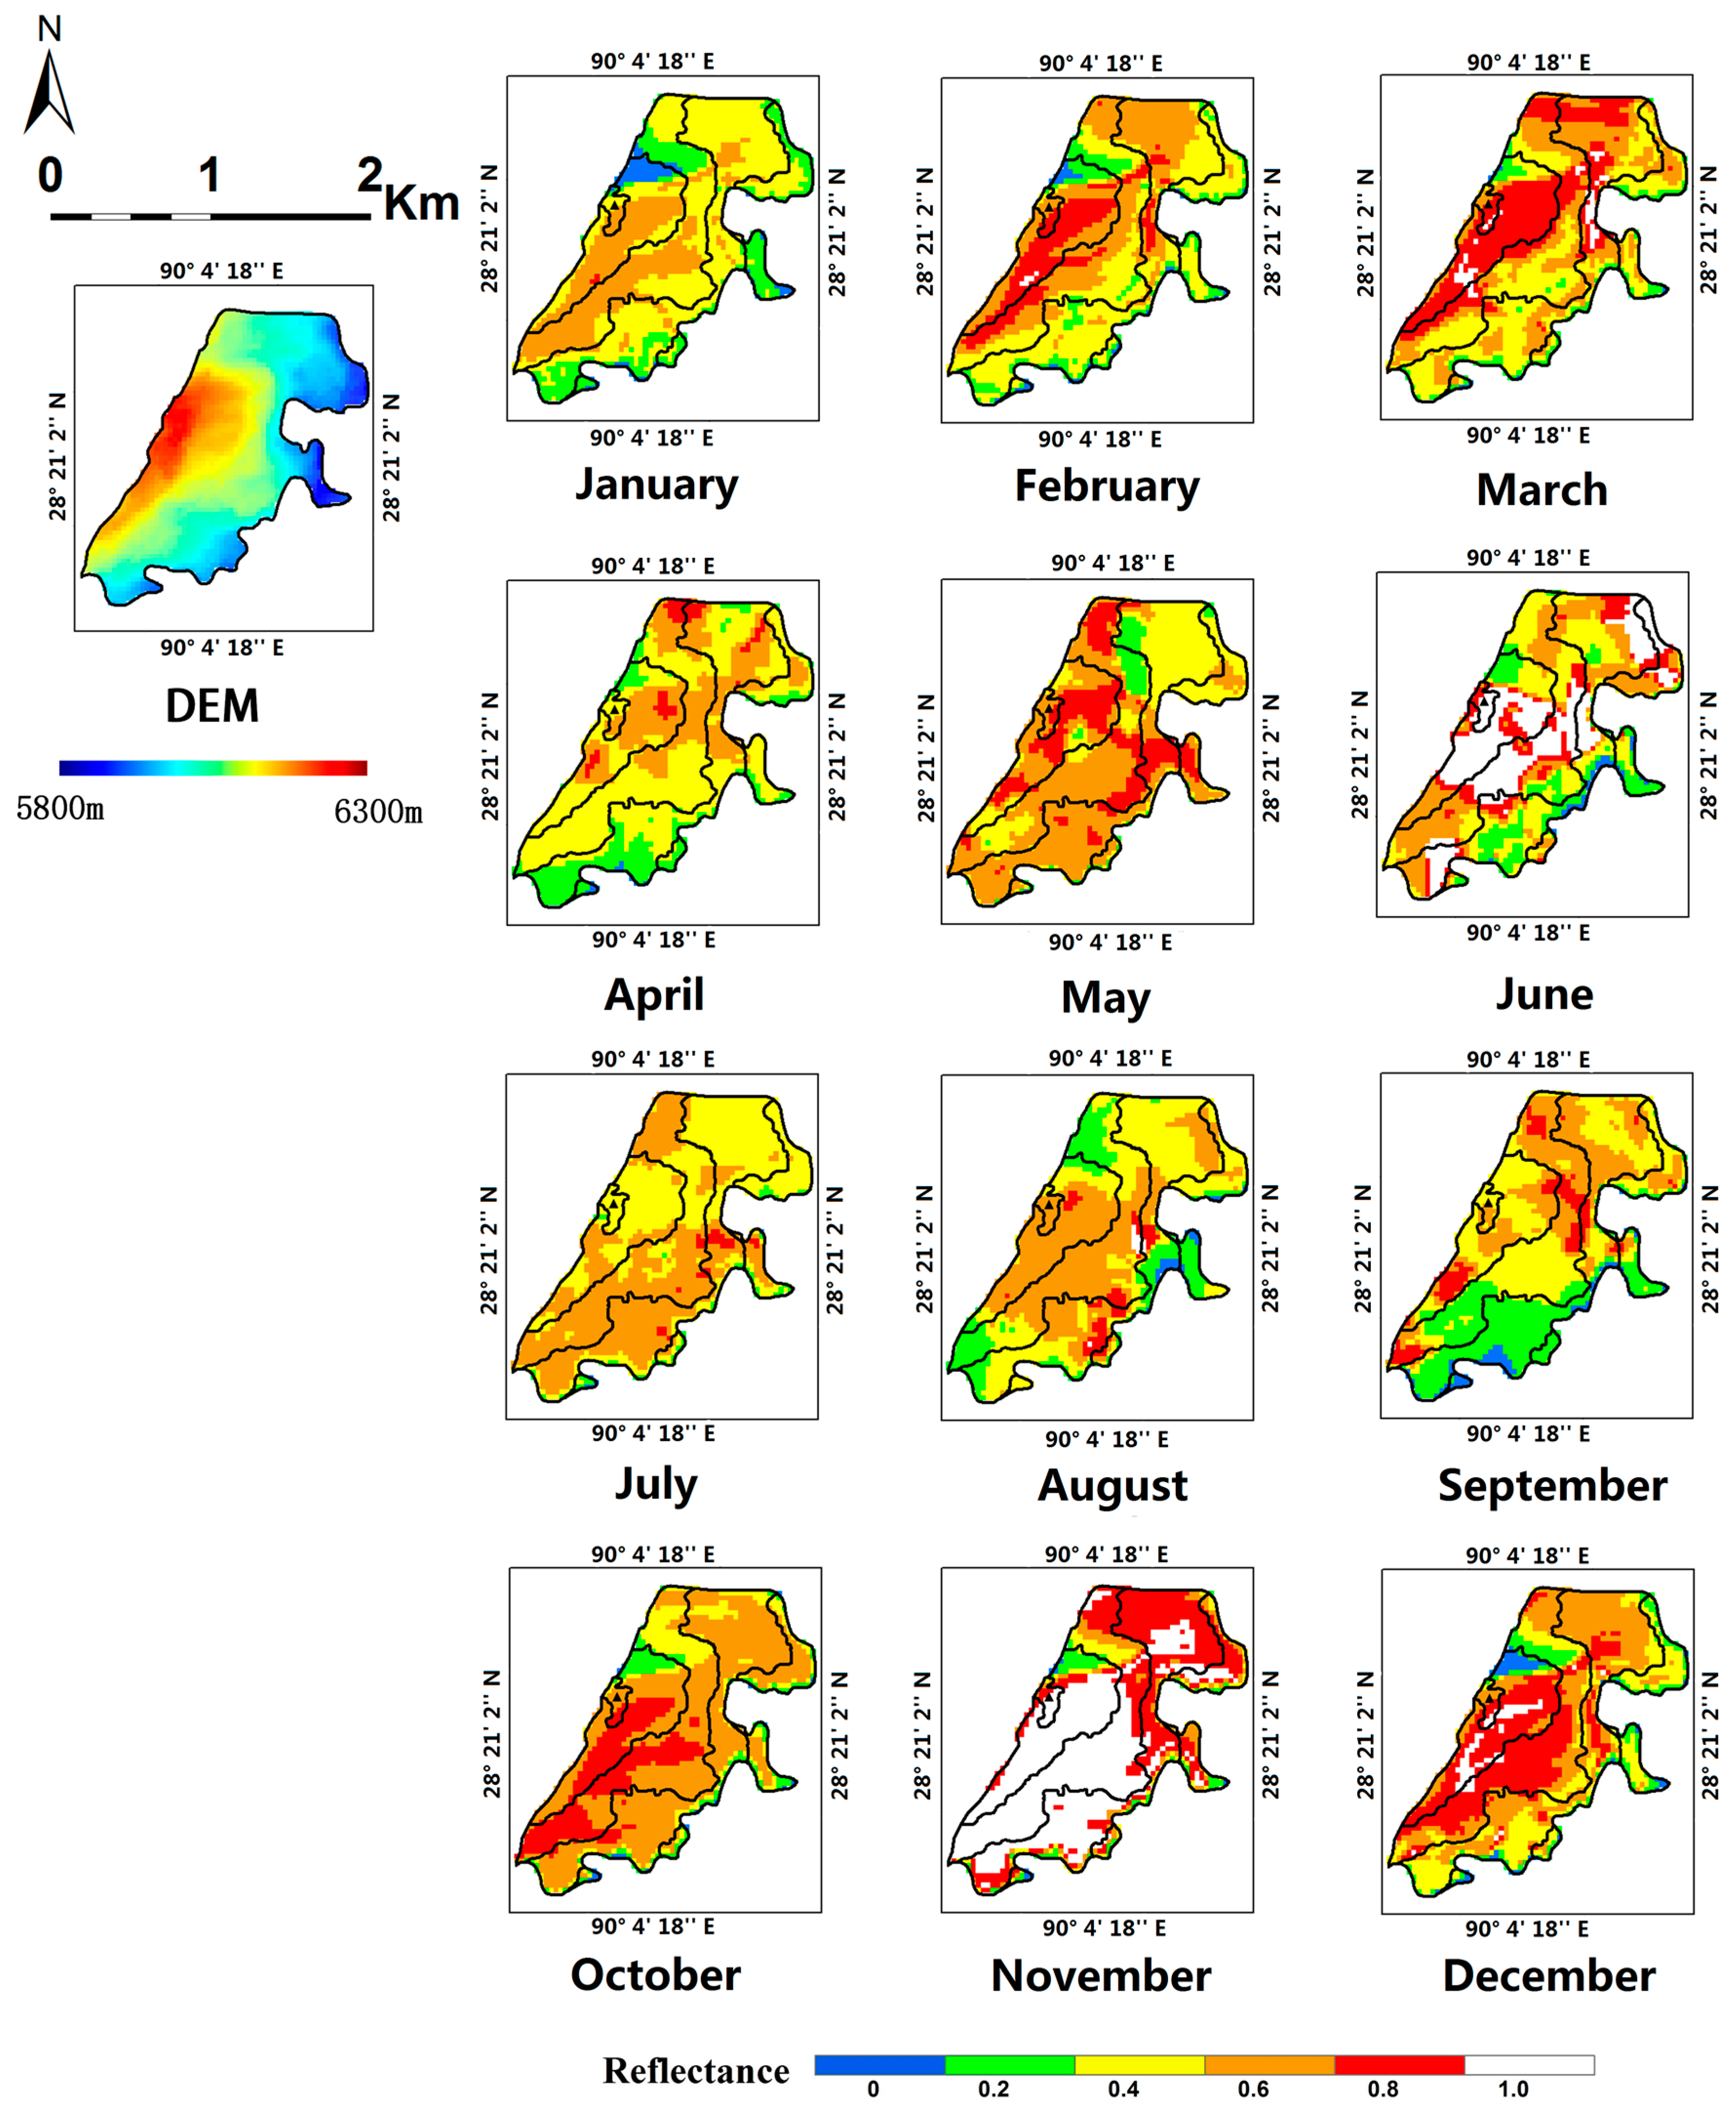
Figure A1 and
Figure A2 show two summer accumulation type glaciers, (10) Meikuang and (12) Qiyi. For the variation of reflectance, we can see that the precipitation season is from April to October. However, in summer, because the influence of melting, the reflectance drops.
Figure A3 shows the reflectance for (6) Langariding, which is a typical glacier that is affected by the Indian monsoon. Different from the former type, its reflectance is high in the cooler half-year.
Figure A4 shows the results for (11) Qiumianleketage. This glacier shows relatively high reflectance all the year-round, which is a very interesting one to study. In addition, we can observe that the reflectance can vary significantly over a single glacier.
Figure 3 shows the monthly reflectance–elevation signatures for the twelve selected glaciers, with blue lines denoting winter, green lines denoting spring, red lines denoting summer, and yellow lines denoting autumn. The altitude extent used to generate the reflectance is shown in the last column of
Table 1. By comparing with the original altitude extent we can see that several altitude zonesare missing in the preprocessing because of shadow, clouds, and insufficient pixels. Because mountaintops contain fewer pixels and thus are easy to be totally removed during the processing, the missing zones mainly locate in such areas. It is shown that the glacier reflectance generally increases with increasing elevation, except for the uppermost height zones of a few glaciers where the glacier flattens out and delays the downwards drainage of meltwater [
4]. The detailed relationships vary between different glaciers, seasons, and altitudes. Most of the glaciers exhibit high reflectance in spring and autumn, and low reflectance in winter. This signifies spring and autumn precipitation, and dry season in winter. The climate around glaciers (1) Muji and (4) Kunjirap is especially dry, indicated by their year-round overall low reflectance. In summer, variation of reflectance gradients present an increasing trend, especially in August for (3) Muztagata, which could be the result of the concurrent precipitation and melting in a very typical westerly region that receives rain and heat over the same period.
By observing the reflectance–elevation relationship for each glacier, several strong features can be found. (5) Naimona’nyi shows high reflectance in March, perhaps because it is in the typical Indian monsoon region with precipitation in early spring. (6) Langariding presents relatively high reflectance in winter, probably because it locates at the lowest latitude, and experiences the longest melting period. (10) Meikuang exhibits very high reflectance in September when the melt season ends in the North and precipitation remains in the central region that affected by the mixed and complex influence of westerly and Indian monsoon. Furthermore, we can observe that in both Group (A) and Group (B) selected in
Section 2, glaciers with the same elevation extent show more consistent seasonal reflectance patterns than glaciers with similar locations. Therefore the reflectance–elevation relationship may dominate the seasonal reflectance variations of glaciers.
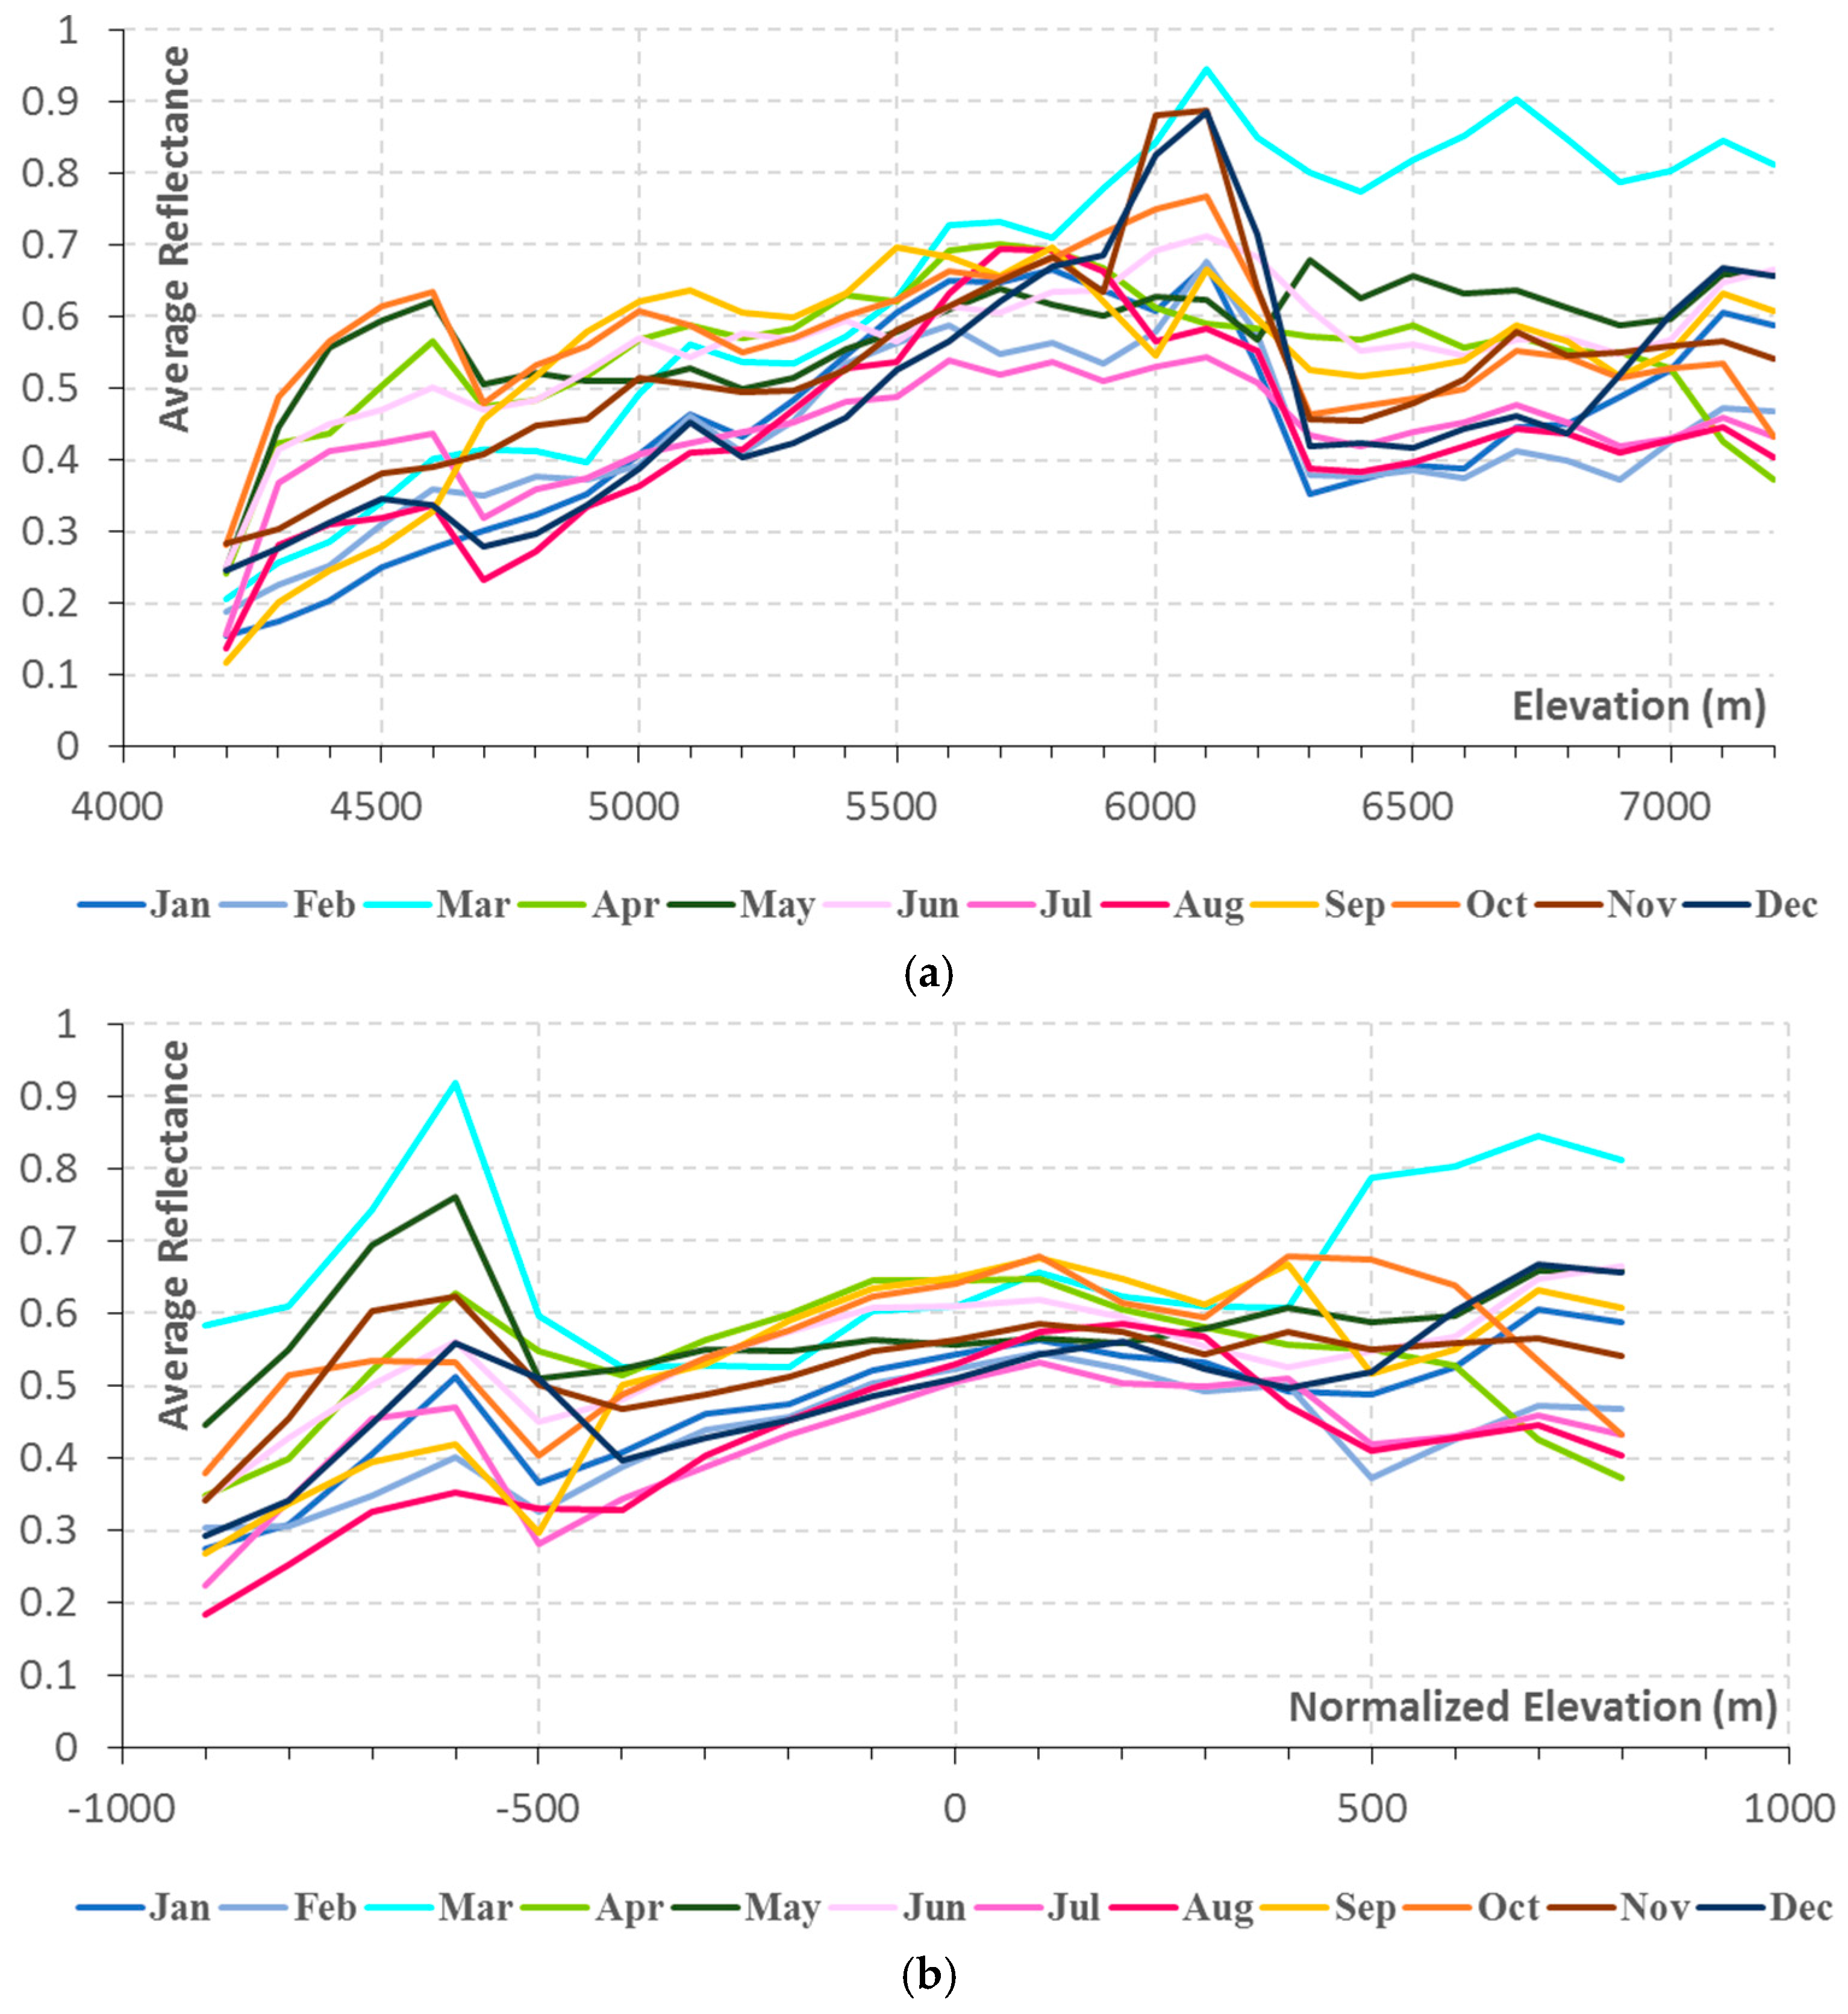
Figure 4a shows the reflectance–elevation relationship in each month for the average of twelve selected glaciers. We see a linear growing trend of the reflectance with increasing elevation, especially in the elevation range 4700–6100 m. It should be noted that after all the processing steps, only one glacier has data when the altitude is below 4700 m ((12) Qiyi) or above 6200 m ((5) Naimona’nyi), which explains the saltation of the curve at 4700 and 6200 m. We also find that the reflectance above 6400 m is basically horizontal, which shows a stable region on the glacier where snow rarely melts. Moreover, when the altitude is over 6100 m, the reflectance declines a little because of the existence of bare rocks [
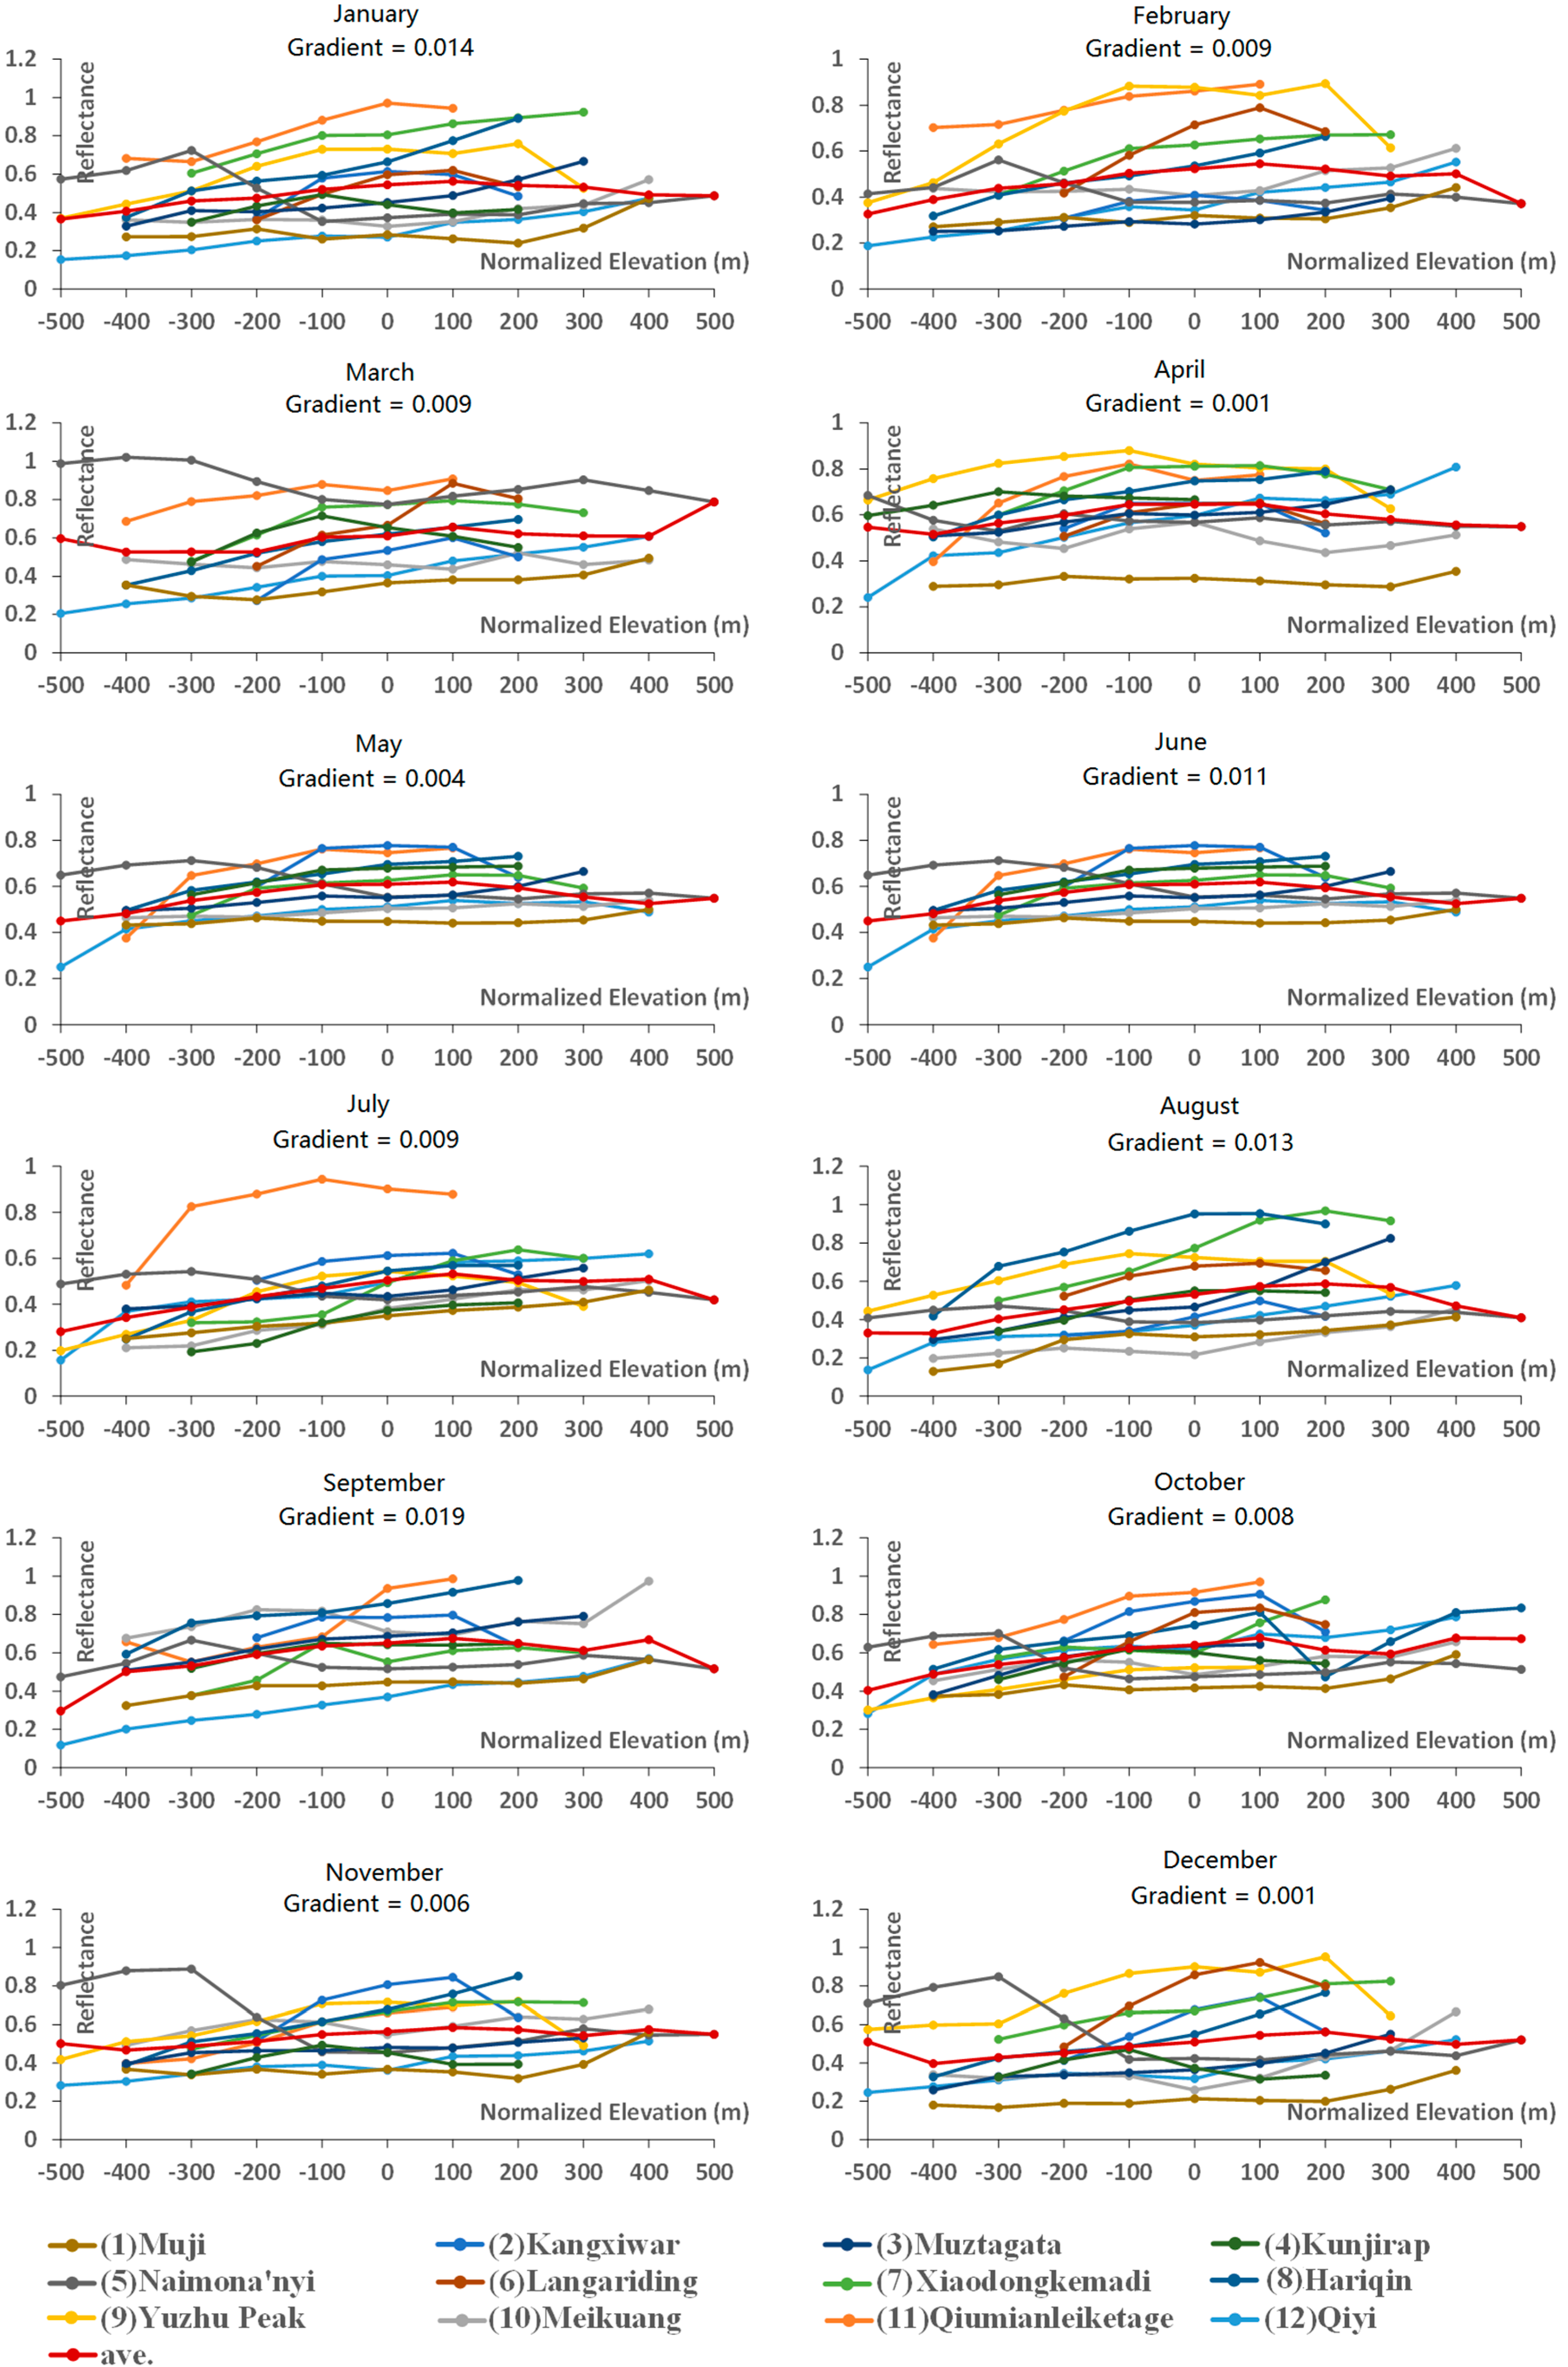
36]. To eliminate the climate effect, we also present the monthly reflectance–elevation relationships using a normalized elevation in
Figure 4b. Its values are obtained by denoting the reflectance variability as a ±difference to the midpoint elevation for each glacier. The mid-point elevation often serves as a proxy for the balanced budget equilibrium line altitude (ELA) [
37], and thus this figure is mainly in the respect of glacier mass balance. It is shown that for most of the months, there is an obvious increasing trend of the reflectance from the lowest elevation to around +100 m. In August, the trend can hold onto +200 m because of the most severe melting in a year.
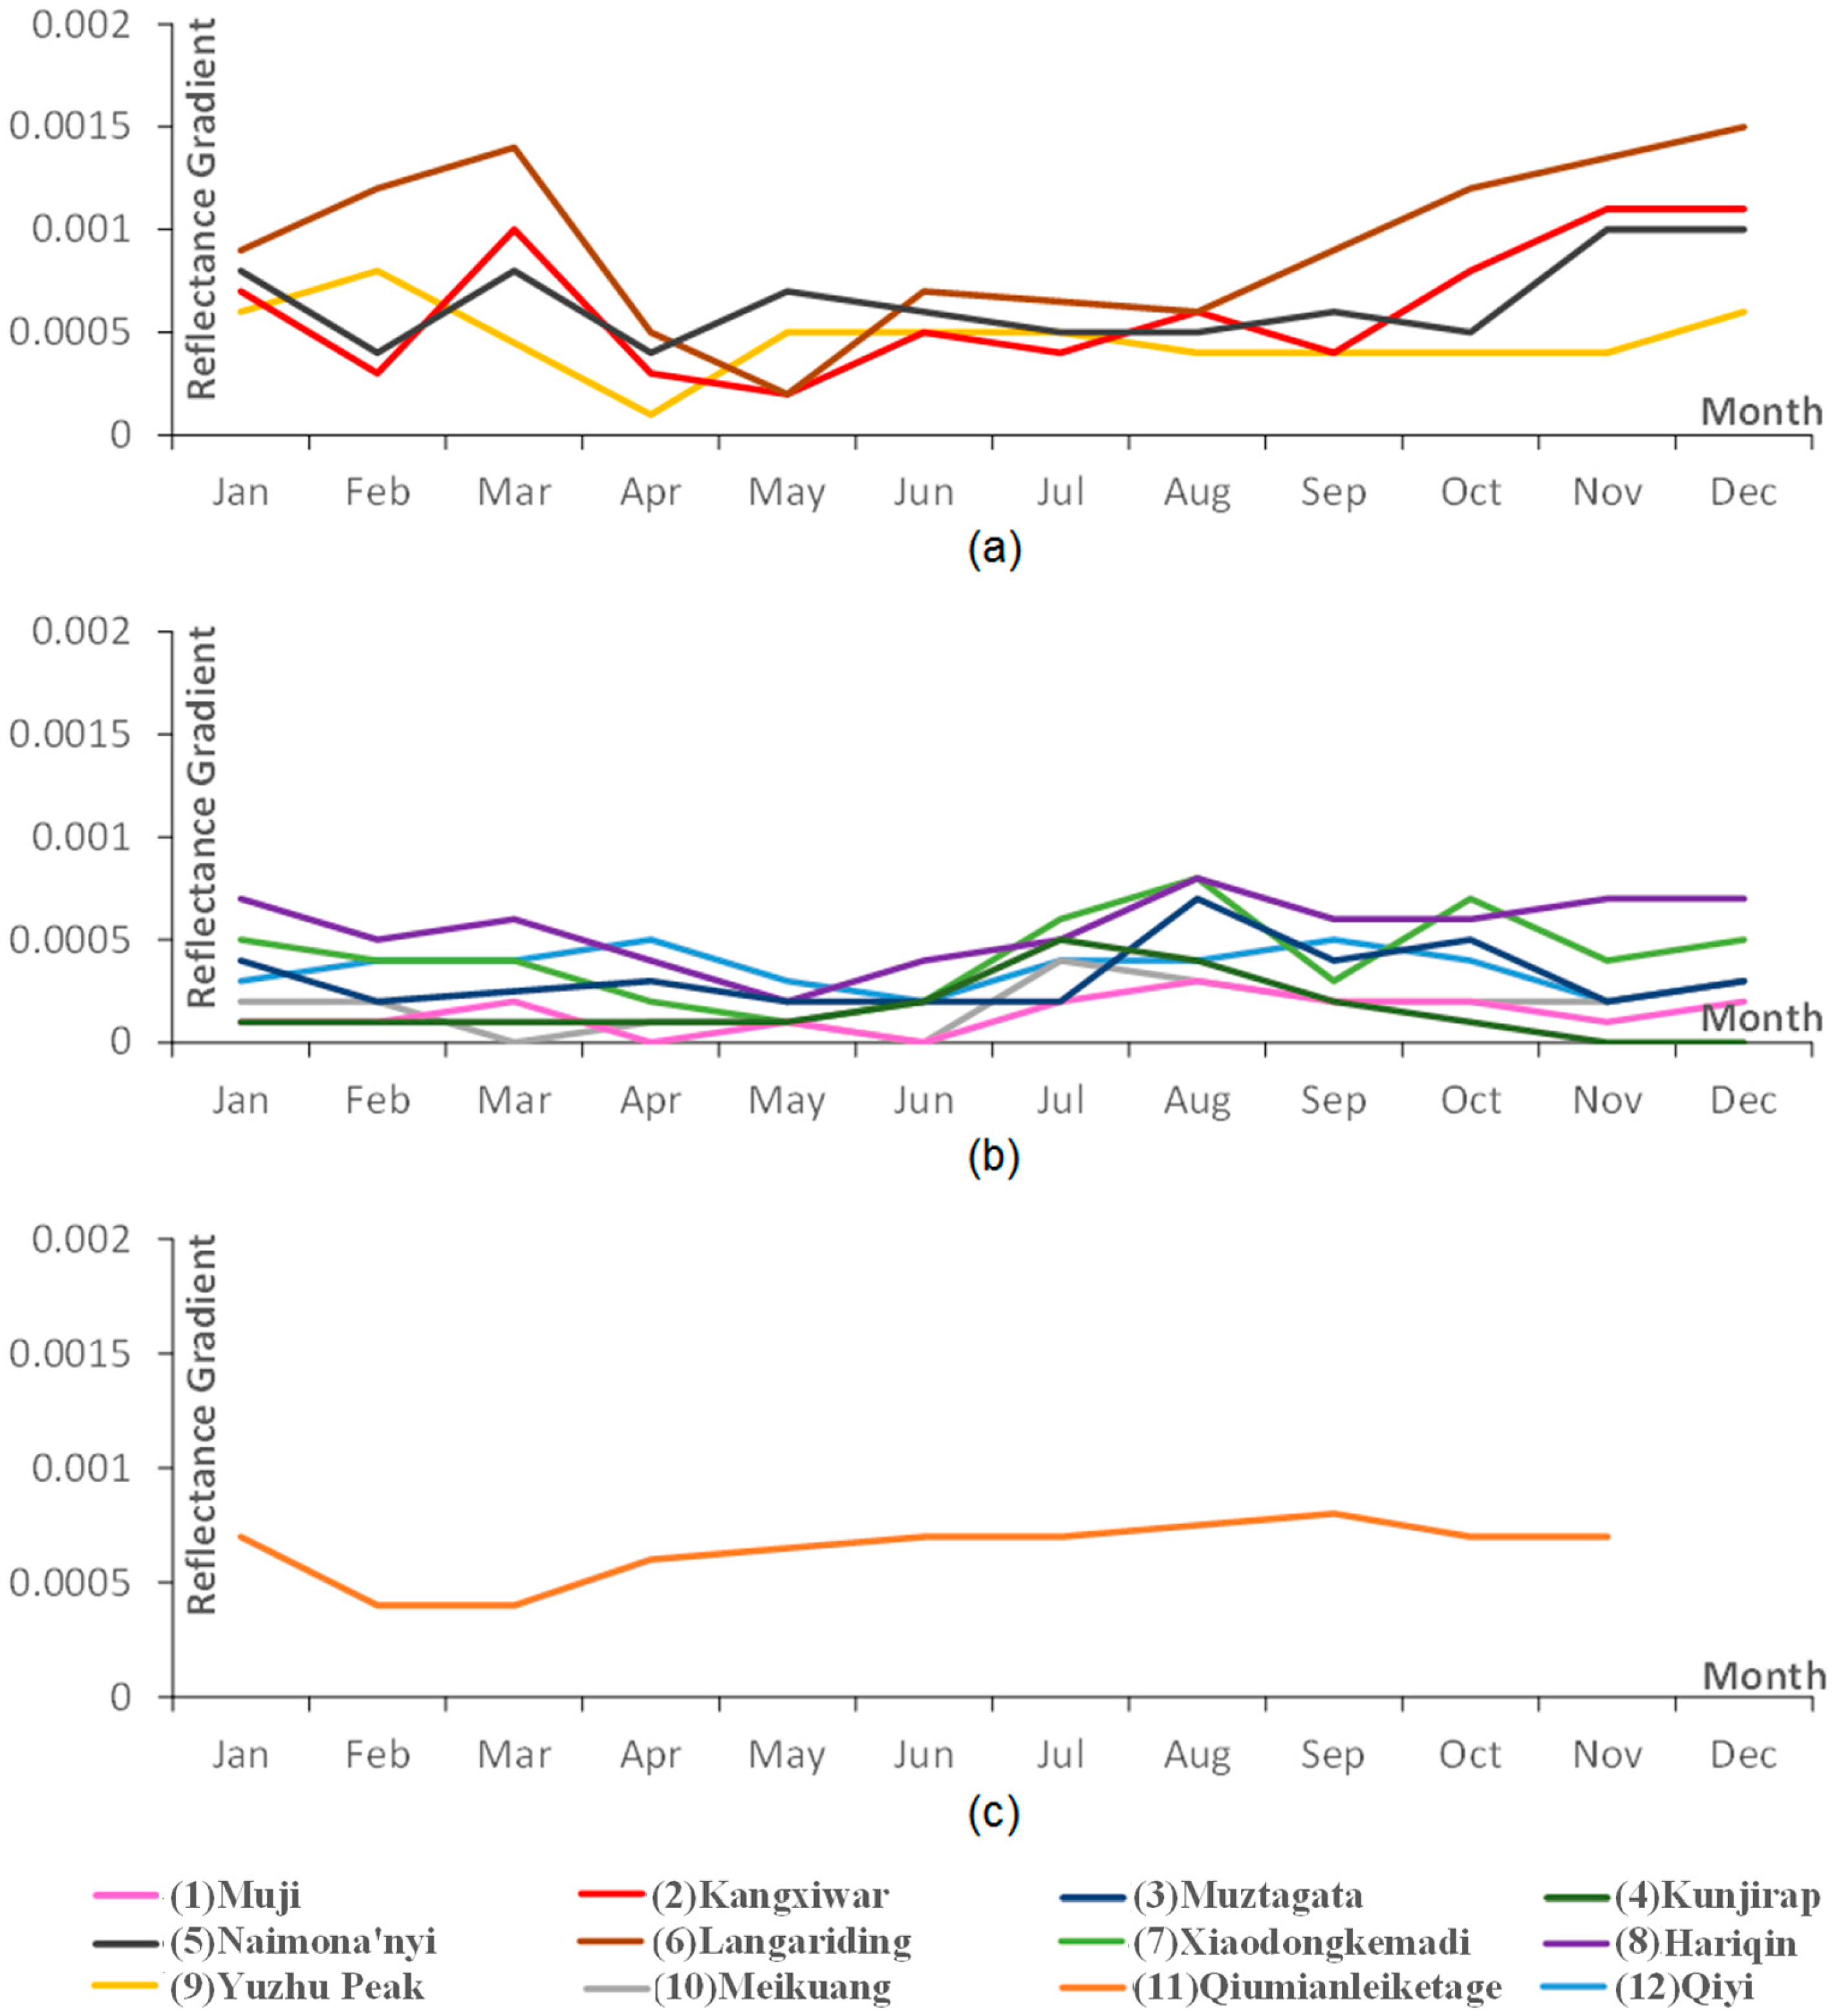
Table 2 shows the reflectance gradients with the blue-white-red shading denoting the low-high value. The seasonal patterns of the reflectance gradient for each glacier are shown in
Figure 5. It is shown that (1) Muji, (3) Muztagata, (4) Kunjirap, (12) Qiyi and (10) Meikuang have low reflectance gradients. As mentioned above, they are glaciers in dry climate, which are in the northwest part of the Qinghai–Tibetan Plateau and are less affected by the Indian monsoon. (6) Langariding has the highest reflectance gradients, especially in winter and early spring. This glacier receives much annual precipitation [
38], and its temperature is relatively high considering its geographic location, melting in the lower parts of this glacier takes also place in winter. We can see a similar but weaker trend for (5) Naimona’nyi. We can infer from this that the overall level of glacier reflectance gradient may relate with its climate. Furthermore, from the season in which the reflectance gradient peaked, the twelve glaciers can be categorized into three classes. The first class, whose reflectance gradient peaks appear in spring and winter, includes (2) Kangxiwar, (5) Namona’nyi, (6) Langariding, and (9) Yuzhu Peak. The second class, whose reflectance gradient peaks appear in summer, includes (1) Muji, (3) Muztagata, (4) Kunjirap, (8) Hariqin, (7) Xiaodongkemadi, (10) Meikuang, and (12) Qiyi. Analyzed from the locations of these glaciers and
Figure 3, we can see that the peaks of this class are mainly caused by the melting in the lower parts in summer. These peaks are not as high as those of the first type, which means that the peaks in the first type may relate with other mechanisms. There is also an atypical type which only includes (11) Qiumianleketage, whose reflectance gradient do not change much throughout the year. However, different types of glaciers seem to appear in various locations and altitudes. The surprising part is that the adjacent glaciers (9) Yuzhu and (10) Meikuang in Group (A) belong to different classes. The same situation also occurs for (2) Kangxiwa and (3) Muztagata in Group (B). However, glacier pairs with the same elevation extent in both Groups (A) and (B) are in the second class. More studies are required to understand these phenomena.
4. Discussion
As far as we know, due to the limitation of the traditional earth observation systems, this is the first work that uses remote-sensing data to analyze monthly reflectance–elevation patterns. Conventional analysis usually considers variations of average albedo/reflectance of a glacier such as in [
36,
39,
40], which is severely limited because as shown in
Figure 3, the reflectance can vary significantly over a single glacier. Moreover, the reflectance is also highly related with the glacier altitude, and therefore when analyzing different glaciers, their altitude ranges should be considered. Studies in [
16,
20,
21] take elevation into consideration. However, they only focus on a single glacier with a small altitude range, and the temporal series are also discontinuous to reveal seasonal patterns. In contrast, we present the monthly reflectance variations for twelve glaciers spanning 3100 m elevation extent which enables us to have a more comprehensive analysis.
It is interesting to see that there are peaks with reflectance around 0.9 in March, November, and December at 6100 m in
Figure 4a, whereas only a March peak of 0.9 at −600 m is shown in
Figure 4b. This is because some of these glaciers are in very high altitudes, which can be a special condition caused by the world’s highest plateau—Tibetan Plateau. For example, when using the normalized elevation, 6100 m is only −300 m for (5) Naimona’nyi. During the averaging, the high reflectance can be easily buried with low reflectance in the same normalized elevation zone of other glaciers. The peak at −600 m is caused by the high reflectance of (5) Naimona’nyi in March. Because this elevation only exists for Naimona’nyi, the peak is kept. In
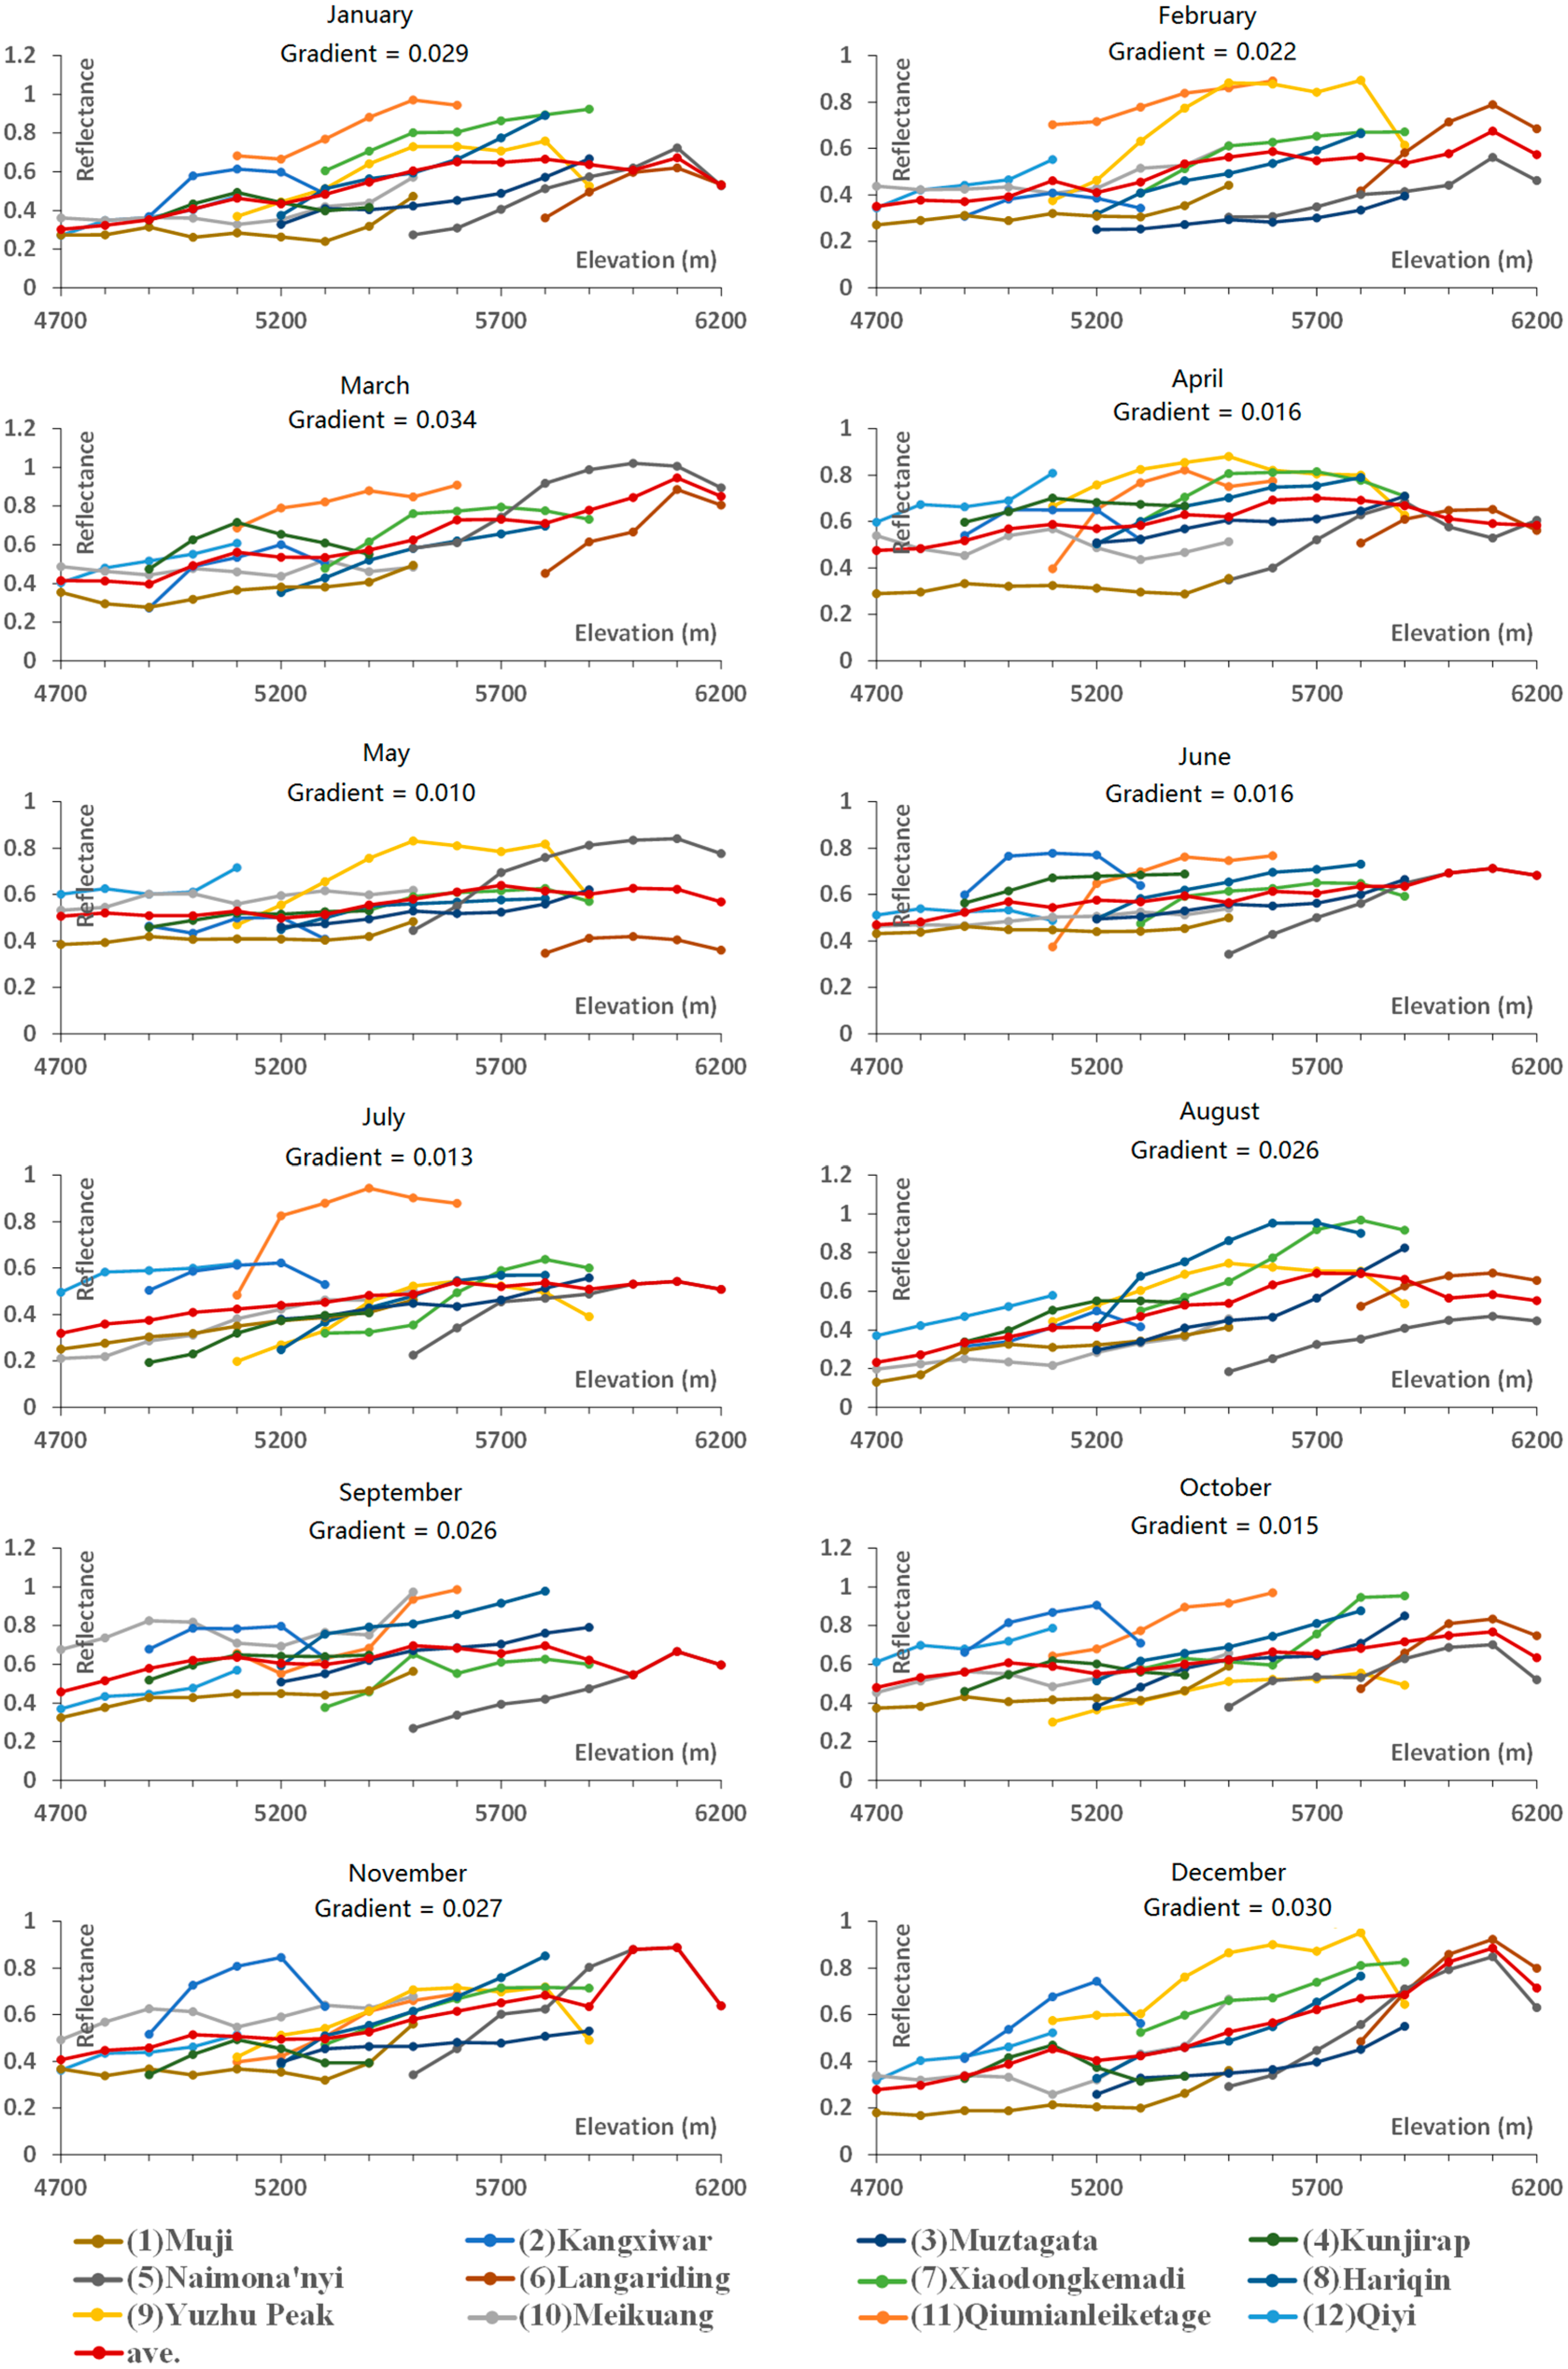
Figure 6 and
Figure 7, we present the monthly reflectance–elevation relationship within 4700–6200 m (elevation zones that contain at least two chosen glaciers) using the absolute elevation, and the one obtained with the normalized elevation within ±500 m (the other elevation zones are only included for Naimona’nyi). The gradients of averaged reflectance–elevation relationships are also displayed for each month. By comparing these two figures, we can observe that glaciers with higher average elevation generally have higher reflectance which indicates that reflectance is somehow dependent on the absolute elevation, which is probably related with the special condition that the terrain in the South is higher than that in the North in western China. By considering the absolute altitude when comparing reflectance of different glaciers, it is interesting to see that in February, although the average reflectance of (5) Naimona’nyi and (12) Qiyi are similar, the relative reflectance of (12) Qiyi is higher compared to glaciers with the same altitude range, which for (5) Naimona’yi is lower. (9) Yuzhu peak commonly has higher relative reflectance than (10) Meikuang, except in November, although they are adjacent to each other. Reflectance–elevation curves are relatively separated in January whereas concentrated in June in
Figure 6 and
Figure 7, which shows that the significance of climate difference varies with months. In
Figure 6, the overall reflectance gradient peaks in March, while
Figure 7 shows relative high reflectance gradients from June to September which corresponds to the melt season. This shows that the reflectance gradient in
Figure 6 relate with the climate variation around different glaciers. In
Figure 7, we can see that the abruption point of the melting region for (5) Naimona’yi is extremely low (around −300 m), which indicates that using the midpoint elevation to approximate the ELA maybe not suitable for glaciers with such a high altitude. Those analyses demonstrate that with the extracted reflectance of each 100 m altitude zone in each month, more interesting information can be observed and we can have a better understanding of the spatial and temporal variations of glacier reflectance.
To examine the linear trend of glacier reflectance–elevation relationships, we calculate the
R2 of the linear fitting when
p < 0.05 for each glacier and each month. The cases of
R2 < 0.5 only account for 13% of the total amount and correspond to very low gradients. Except for these situations, the overall goodness of fit is very high. Moreover, the R
2 for the linear fitting of the average reflectance–elevation curves shown in
Figure 4a are also high (>0.65 in eleven months and 0.42 in May), which proves the linear trend of the general reflectance–elevation relationship for glaciers. Using median instead of average could be more robust to further reduce the impact of outliers, which we will attempt in future work. The averaging of pixels within the same elevation zone enhances the robustness of the estimation. It should be noted that even with the acquisition ability of Landsat 8, the time series of a glacier in one year is mostly fragmentary. Every year will have several months missing because of cloud cover. Although a few measures have been taken, we have not found a better way to completely solve this problem. In addition, we think presenting a fragmentary time series for only one particular year may be not representative. Therefore, in each month, we use the average reflectance of three years (when at least two images are acquired during 2013–2015). This may include bias because of the likely high variability of snow cover from year to year, but if the snowfall did happen in one year, it could happen in another year. We will not know for sure in which year the weather is more representative, and we believe that the climate will not change significantly in three years. Therefore, we think this is so far the closest study to acquire the monthly pattern of glacier reflectance–elevation relationships.
5. Conclusions
We have obtained the monthly variations of reflectance and reflectance gradients for twelve glaciers in western China based on 372 Landsat 8 images collected from April 2013 to December 2015. From our results, we draw the following conclusions. Reflectance generally shows a raising trend with increasing elevation (when the altitude is less than 6100 m). The overall goodness of fit of the linear fitting is very high, which proves the linear trend of the reflectance–elevation relationship, though the detailed relationships vary between different glaciers, seasons and altitudes. Glaciers with the same elevation extent show seasonal reflectance patterns of higher consistency than glaciers with similar location, which means the reflectance–elevation relationship dominates the seasonal variations of glacier reflectance. Therefore, when comparing different glaciers, their absolute altitude ranges should be considered. Glaciers in north and dry climate such as (1) Muji, (3) Muztagata, (4) Kunjirap, (10) Meikuang, and (12) Qiyi show low reflectance gradients. Glaciers in south and wet climate such as (5) Naimona’nyi and (6) Langariding show high reflectance gradients, especially in winter and spring. This indicates that the overall level of glacier reflectance gradient may relate with its climate. The twelve glaciers can be categorized into three classes according to the seasons in which the signature of reflectance gradients peaked: (i) reflectance gradient peaks in spring and winter; (ii) reflectance gradient peaks in summer; and (iii) reflectance gradients show no significant change throughout the year. However, different types of glaciers seem to appear at various locations and altitudes. Further effort is needed to understand these classes.


