Article

Validation and Analysis of Long-Term AATSR Land Surface Temperature Product in the Heihe River Basin, China

1
State Key Laboratory of Remote Sensing Science, Institute of Remote Sensing and Digital Earth, Chinese Academy of Sciences, Beijing 100101, China
2
Department of Geography and Planning, Queen’s University, Kingston, ON K7L 3N6, Canada
3
Key Laboratory of Agric-Informatics, Ministry of Agriculture/Institute of Agricultural Resources and Regional Planning, Chinese Academy of Agricultural Sciences, Beijing 100081, China
4
Joint Center for Global Change Studies (JCGCS), Beijing 100875, China
5
Institute of Urban Meteorology, China Meteorological Administration, Beijing 100089, China
*
Authors to whom correspondence should be addressed.
Remote Sens. 2017, 9(2), 152; https://doi.org/10.3390/rs9020152
Submission received: 13 December 2016 / Revised: 6 February 2017 / Accepted: 9 February 2017 / Published: 13 February 2017
(This article belongs to the Special Issue Earth Observations for Precision Farming in China (EO4PFiC))

Abstract

:
The Advanced Along-Track Scanning Radiometer (AATSR) land surface temperature (LST) product has a long-term time series of data from 20 May 2002 to 8 April 2012 and is a crucial dataset for global change studies. Accuracy and uncertainty assessment of satellite derived LST is important for its use in studying land–surface–atmosphere interactions. However, the validation of AATSR-derived LST products is scarce in China, especially in arid and semi-arid areas. In this study, we evaluated the accuracy of the AATSR LST product using ground-based measurements from 2007 to 2011 in the Heihe River Basin (HRB), China. The AATSR-derived LST results over Yingke site are closer to ground measurements than those over A’rou site for both daytime and nighttime temperatures. For nighttime, the averaged bias, STD, RMSE and R2 over both sites are 0.67 K, 3.03 K, 3.13 K and 0.93 K, respectively. Based on the accuracy assessment, we analyzed the AATSR-derived annual LST variations both in the HRB region and the two validation sites for the period of 2003 to 2011. The results at the A’rou site show an obvious increasing trend for daytime from 2003 to 2011. For the whole HRB region, the warming trend is clearly shown in the downstream of HRB.

Graphical Abstract

1. Introduction

Land surface temperature (LST) is an indispensable parameter in the studies of physical processes of land surface energy and water balance at regional and global scales [1,2,3,4] and also in the terrestrial thermal behavior determination [5] of the past decades. Compared with traditional in situ temperature measurements, satellite remote sensing-based data allow large scales acquisition of LST. Since the late 1980s, many thermal infrared LST retrieval methods have been published based on polar-orbit satellites/sensors (Terra/Aqua-MODIS (Moderate Resolution Imaging Spectroradiometer), ATSR (Along Track Scanning Radiometer)/AATSR (Advanced Along-Track Scanning Radiometer), ASTER (Advanced Spaceborne Thermal Emission and Reflection Radiometer), FY-3 (FengYun Meteorological satellites) etc.) and geostationary satellites (MSG (Meteosat Second Generation), MTSAT (Multi-Functional Transport Satellite, Japanese geostationary weather satellite), GOES (Geostationary Operational Environmental Satellite Series), FY-2 (Fengyun Geostationary Satellite series), etc.) [6,7,8,9,10,11,12,13].
Since the launch of the European Space Agency (ESA)’s Envisat Satellite in March 2002, AATSR LST and its predecessors ATSR-1 and ATSR-2 products, due to its near-nadir, split-window algorithm, free availability and accurate radiance measurements, have been widely used in global climate change, land cover, water management and land–atmosphere feedbacks and atmospheric analysis [14,15,16,17]. AATSR and ATSRs LST validations have been implemented globally since the 1990s [18,19,20,21,22,23,24]. Currently, there are two methods commonly used for the AATSR-derived and other satellite derived LST validation: one is the temperature based method (T-based) and the other is radiance based method (R-based) [3,23]. The first method directly compares the satellite-derived LST with in situ measurements. The second method uses the atmospheric transfer equation to compute the at-sensor LST based on the land surface emissivity (LSE) spectra of the in situ area and the atmospheric profiles. Both methods have their advantages: the first one is easy to conduct, but needs the in situ areas to be homogeneous and flat; the second one does not need in situ LST measurements, but requires the accurate LSE spectra and atmospheric profiles which are often hard to obtain.
Long-term temporal series of LST product is an important environmental monitoring and detection dataset for global climate change studies. The ESA’s series (A) ATSR instruments give meaningful opportunities to obtain the long-term global LST record. Still, the satellite observation data and the retrieval method always have some drawbacks impeding the thorough application. Hence, the accuracy and precision of the AATSR-derived LST product should be validated and characterized globally to avoid the minus side of the AATSR-derived LST product. Extensive work has been made to deeply validate the AATSR-derived LST product [19,20,21,22,23,24]. Coll et al. [19] used the T-based method in the AATSR-derived LST validation and showed an average underestimate of 0.9 K in comparison with homogeneous and flat in situ measurements. Following that, Coll et al. [20] used 23 concurrent AATSR and ground measurements and proved that the split-window method is more accurate than the dual-angle method, with standard deviations of 0.5 K and 1 K, respectively. Noyes et al. [21] assessed long-term data from 2003 to 2006 and showed the seasonal uncertainty in the AATSR-derived LST data. In their researches, overestimation during the summer months and underestimation during the winter months due to the water vapor content uncertainties in the atmospheric correction were concluded. Sòria and Sobrino [22] evaluated AATSR-derived LST over heterogeneous areas and concluded that in order to obtain accurate LST at 1 km resolution over heterogeneous area, spatial averaging is required. Then, Coll et al. [23] also indicated the urgent need for modifications on the operational AATSR LST algorithm due to the coarse ancillary data; otherwise, the AATSR-derived LST errors of 2 to 5 K could be obtained. When the land cover classification was selected much more specifically for the in situ situations, the R-based validation method resulted in root mean square error (RMSE) of 0.5 K and 1.1 K for the fully vegetated area and bare soil, respectively. Kogler et al. [14] analyzed nearly 20 years (A) ATSR series LST data and concluded that the long-term trends are more likely to be related to the cloud contamination rather than the actual LST trends.
However, the thorough validation of the product is still limited in China. Due to the land surface complexity and few validation applications in China, especially in arid and semi-arid regions, the LST retrieval methods, i.e., split-window methods do not work well [25], which makes the assessment effort on LST products urgent and necessary. Ghent [26] used widely distributed Atmospheric Radiation Measurement (ARM) sites including a Chinese site to validate the updated product globally. However, lack of long-term ground-based measurements impedes the validation process, as well as the compatibility between in situ data and satellite derived data.
This research has two main objectives: (1) to compare the updated AATSR LST product generated by ESA’s GlobTemperature project and University of Leicester with in situ measurements at two sites (A’rou and Yingke) in China from 2007 to 2011; and (2) to analyze the temporal and spatial trends of AATSR-derived LST in Heihe River Basin (HRB) in northwest China from 2003 to 2011. To fulfill the objectives, the in situ measurements from the specific HRB experiments-Watershed Allied Telemetry Experimental Research (WATER) conducted under Chinese National Natural Science Foundation (NSFC) have been collected. Section 2 briefly introduces the study area, the LST data and the methods. Section 3 describes the corresponding results. A discussion and a conclusion are provided in Section 4 and Section 5, respectively.

2. Materials and Methods
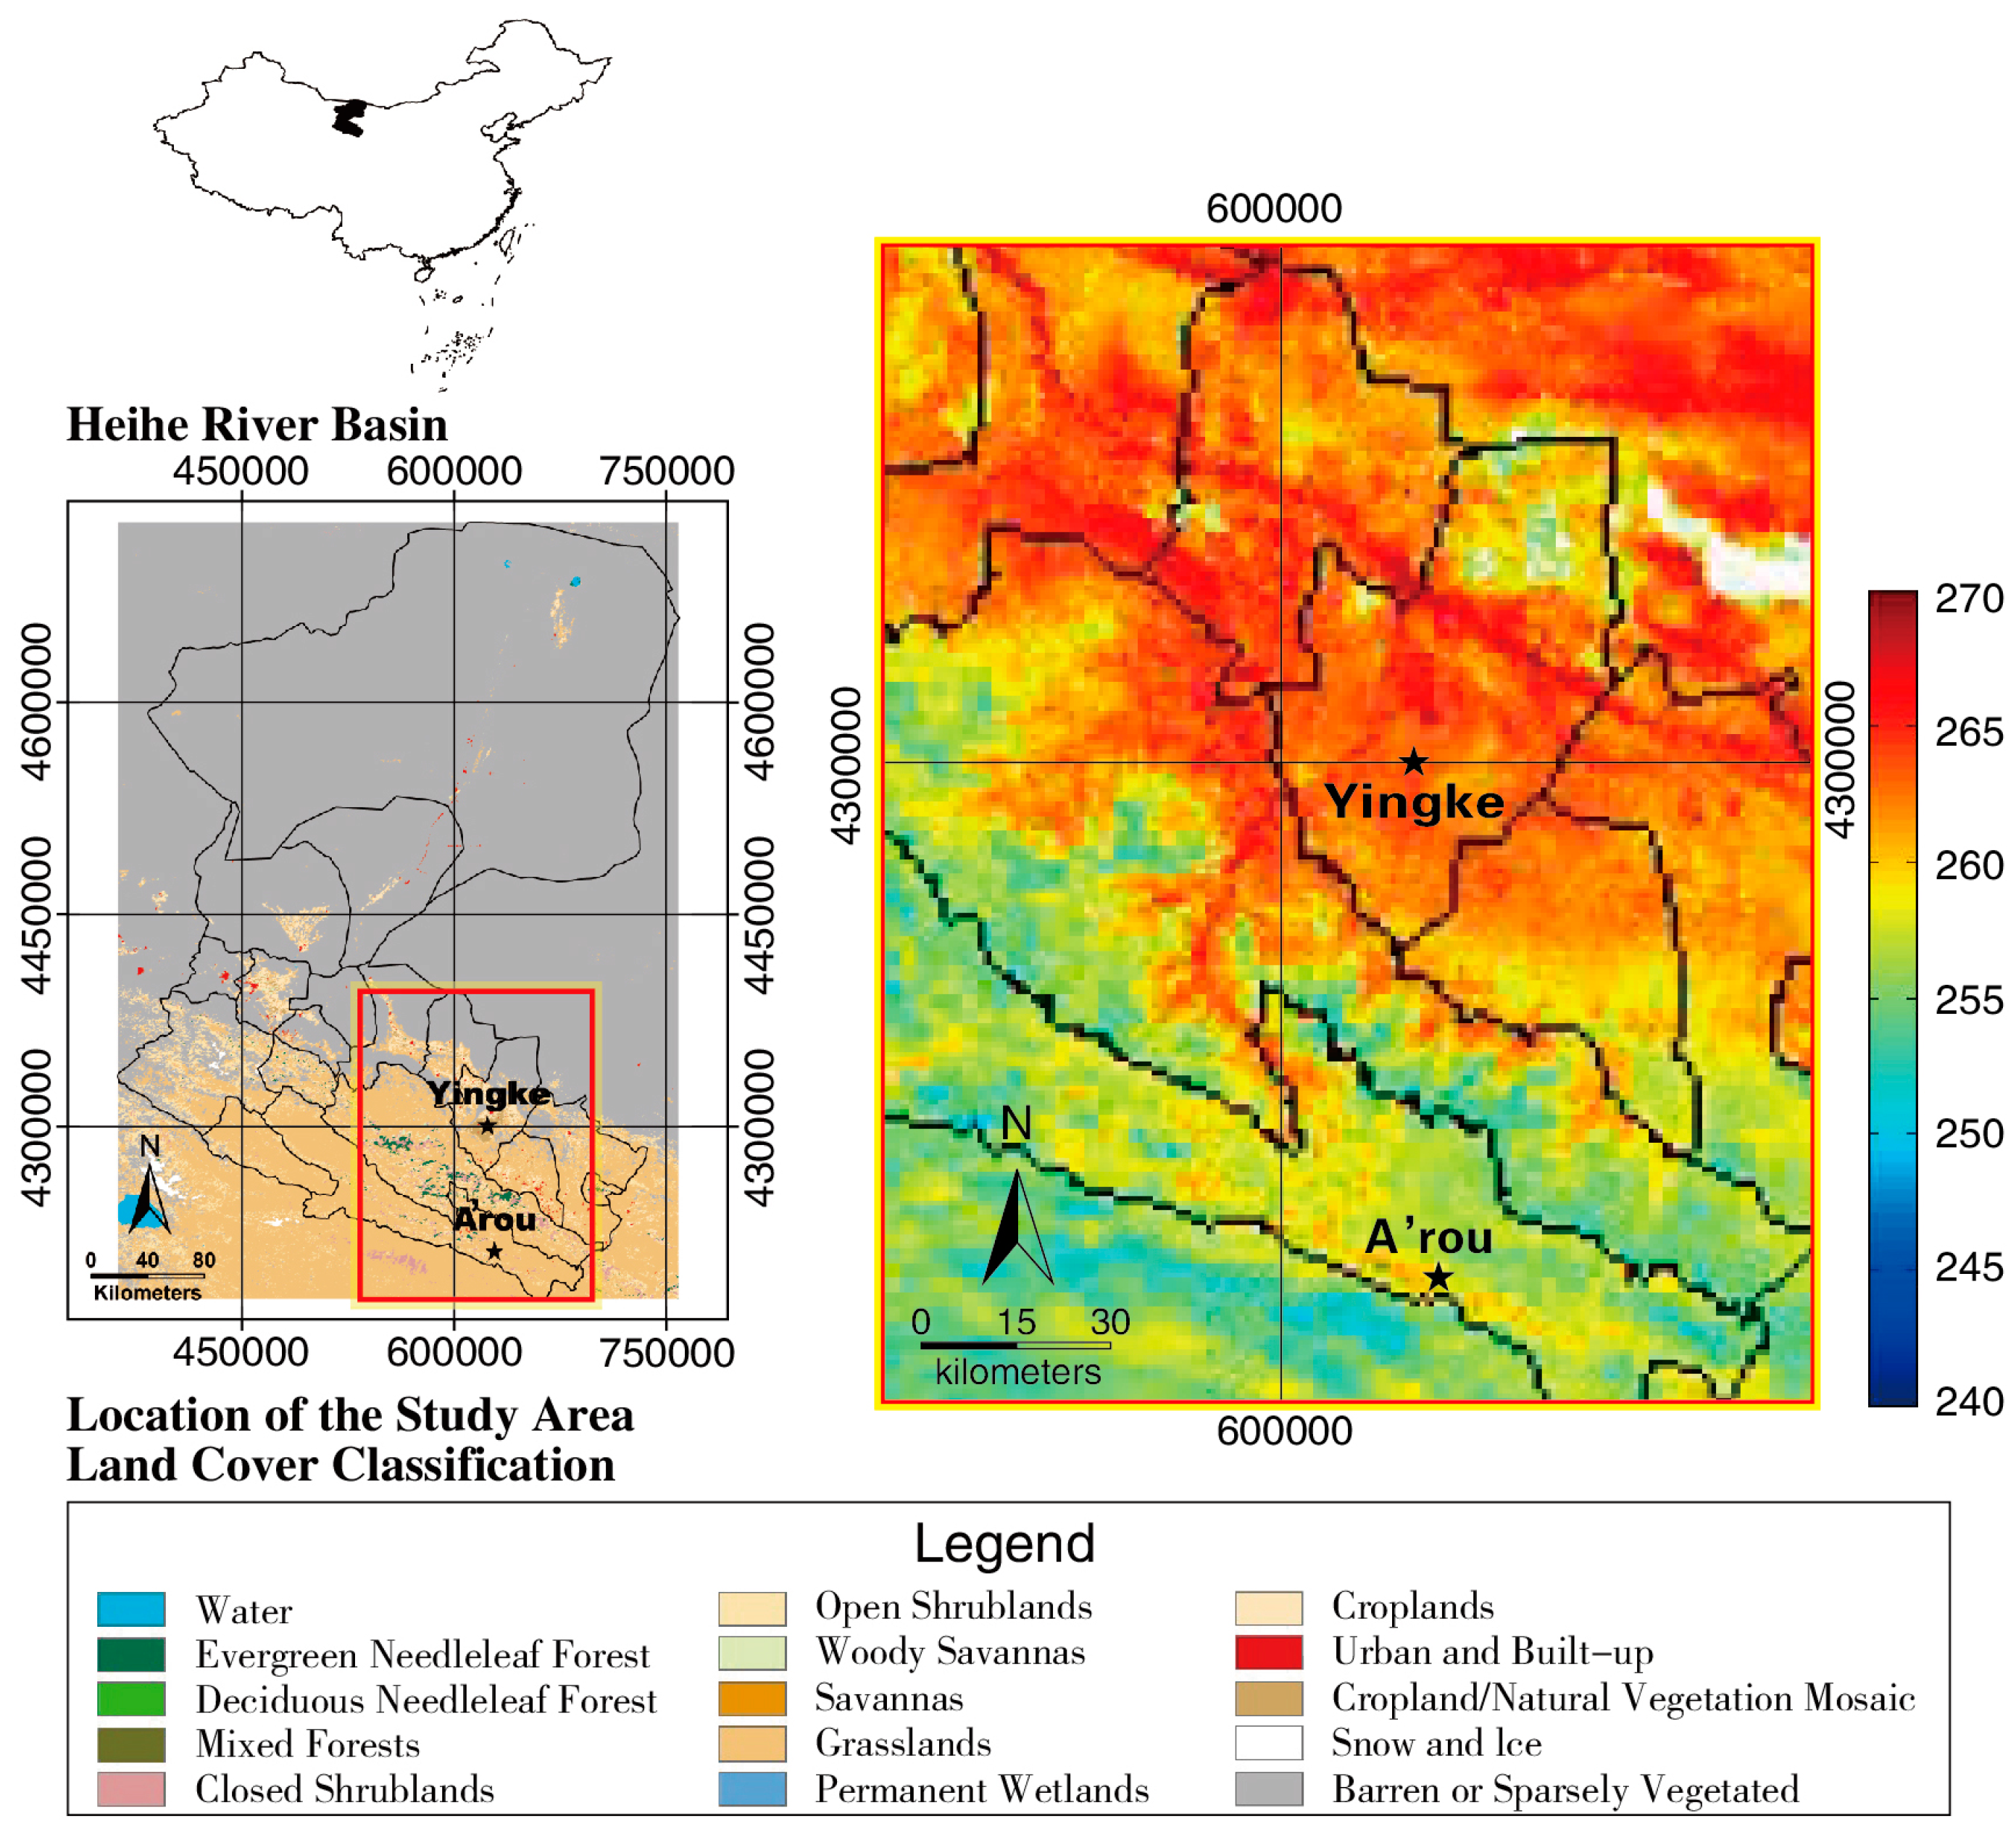
2.1. Study Area

The study area is located in the semiarid HRB of northwest China between the coordinates 97°24′~102°10′E, 37°41′~42°42′N. The simultaneous satellite and ground-based remote sensing WATER experiments were conducted in summer 2008, and the ground based measurements were acquired from 2007 to 2011. The semiarid basin is mainly controlled by the distribution of water resources from south to north, distributed with diverse land cover types from the upstream, midstream to downstream including glacier (the southern Qilian Mountains), frozen soil, alpine meadow, forest, irrigated crops, riparian ecosystem, desert and Gobi. The basin is influenced by Asian monsoon, and most rainfall occurs from May to September in the rainy season, and the rainfall decreases from south to north. Figure 1 shows the geography and land cover encompassing the HRB with the two validation sites as well [27].
As indicated by Wan et al. [25], the major requirements of an ideal LST validation site should be large enough to cover at least dozens of satellite pixels and homogeneous. There are ten sites in WATER campaign in HRB [27]. In order to guarantee the consistency between in situ observations with remote sensing data, homogeneous in situ sites should be chosen. In this study, relatively homogeneous ground measurements from two of the ten sites were chosen: A’rou and Yingke.
A’rou, is located in the source of Heihe River, a relatively homogeneous area with a height of 3032.8 m. The land cover type is Alpine meadow. A’rou is an important station on the northeast edge of the Tibetan Plateau with a lot of hydrological and ecological in situ observations, which could both benefit the future studies of HRB and Tibetan Plateau as well. It should be noted that the seasonally frozen soil is widely distributed in A’rou, which may hinder the wide application of satellite derived LST product due to the uncertainty of the algorithm in the freeze/thaw condition. The aims of the validation have also focused on the LST uncertainty effect under freeze/thaw status [27]. Yingke site is located at 38°51′N, 100°25′E with an elevation of 1519 m. The dominant land cover at Yingke site is homogeneous cropland which turns to bare soil in winter months [27]. The geographical encompass and site characteristics are shown in Figure 1 and Table 1. The land cover map in Figure 1 is acquired from the yearly MODIS Land Cover Type product (MCD12Q1) in 2009 with a spatial resolution of 500 m.

2.2. AATSR LST Product

AATSR onboard the Envisat satellite is the third sensor following ATSR-1 and ATSR-2 designed to obtain the high levels of Sea Surface Temperature (SST) and LST for global climate change studies. AATSR measures seven channels of reflected and emitted radiation at 0.55 μm, 0.66 μm, 0.87 μm, 1.6 μm, 3.7 μm, 11 μm and 12 μm with both a nadir view resolution of 1 × 1 km2 and a forward view resolution of 1.5 × 2 km2. The AATSR swath width is 512 km and able to provide a global LST coverage about every three days [22,26]. AATSR-derived LST products have been widely used in climate change, land–atmosphere feedbacks, modeling studies, land cover changes and many other applications [17].
Only the cloud-free two channel brightness temperatures of 11 μm (T11) and 12 μm (T12) with nadir view dataset were used for the AATSR LST product retrievals to avoid the angular effects on temperature and emissivity [18,25]. The basic split-window algorithm was used for the LST retrieval with the following mathematics:
T = a 0 + b 0 T 11 + c 0 T 12
where a 0 , b 0 and c 0 are regression coefficients determined by simulated data, which are dependent on the land surface conditions, including the land cover types (27 biomes), vegetation fraction, season, time of day (daytime or nighttime), as well as atmospheric conditions and satellite viewing zenith angle [18]. The RMSE of LST is less than 1 K in ideal conditions [22,23].
The AATSR LST data acquisition period is from 20 May 2002 to 8 April 2012, which is available from the AATSR GlobTemperature Level-2 LST product [26] provided by ESA DUE GlobTemperature Project [28]. The sensor is in a sun-synchronous orbit and the overpass time is 10 a.m. local solar time. The spatial resolution of AATSR LST product is 0.01° in NetCDF (Network Common Data Form) format in this study. The AATSR LST product is estimated using the nadir view observations, and the viewing angle at nadir is less than 23.5° [19,29]. The GlobTemperature Level-2 AATSR LST products include a primary LST dataset and an additional auxiliary dataset. The primary LST dataset is comprised by Julian Date, pixel center latitude and longitude, time difference from a reference time, LST, LST uncertainty, quality control flags, satellite zenith viewing angle and satellite azimuth angle. The auxiliary dataset includes channel description, emissivity, brightness temperature, land cover classification, fractional vegetation cover, water vapor content, normalized difference vegetation index, solar zenith angle, solar azimuth angle, land–water mask, etc. To obtain accurate at-sensor observation time, the dataset also includes the “dtime”, i.e., the difference between acquisition time and product time stamp.

2.3. In Situ Measurements

To validate AATSR-derived LST product, the 10-min interval in situ quality controlled four-component radiation measurements at A’rou and Yingke were acquired from the automatic meteorological observations on the specific HRB experiments WATER [27,30,31] in the watershed from 2007 to 2011. The information on two validation sites is listed in Table 1. A’rou is chosen as a fully equipped homogeneous superstation among the HRB comprehensive hydrometeorological observation network. To be noted that there are more rainfall/cloudy days at A’rou than that at Yingke. The rainy weather in A’rou may affect the final validation results. Yingke site is located in large areas around the oasis which is much more homogeneous and suitable for LST validation.
The in-situ LST was derived from the in-situ upwelling (Rlu, W·m−2) and downwelling (Rld, w W·m−2) longwave radiation fluxes from the traditional equation:
T = ( R l u ( 1 ε ) R l d ε σ ) 1 / 4
where ε is the broadband surface emissivity; and σ is the Stefan–Boltzman constant (5.67 × 10⁻⁸ W·m−2·K−4). In this study, the broadband surface emissivity at each site was obtained using a broadband emissivity method from Cheng et al. [31] as the following equation:
ε = 0.095 + 0.329 ε 29 + 0.572 ε 31
where ε 29 and ε 31 are the MODIS emissivities for channels 29 and 31, for the spectral domain of 8.400–8.700 μm and 10.780–11.280 μm, respectively.
The broadband surface emissivity accuracy and stability will not heavily affect the ground-based LST calculation since the right side of the equation has a fourth root which makes the emissivity (0.8–0.99) magnitude affect less.
The in situ measurements comparison was conducted with cloud free AATSR-derived LST data with the quality control flags. Due to the different acquisition time of in situ data, the period of the validation process is from August 2007 to November 2011 at A’rou and November 2007 to November 2011 at Yingke, respectively.

2.4. Methods

This research includes two parts: First, we compared the AATSR-derived LST with in situ measurements over two sites in HRB for 2007–2011. This evaluation is intended to show the accuracy of the AATSR-derived LST and determine the feasibility of using it in studies involving temperature data. Second, based on the evaluation, we analyzed the time series LST of the validation sites and the whole HRB for the period of 2003–2011 and gave a preliminary conclusion for the LST dynamics.

2.4.1. Assessment of AATSR-Derived LST with in Situ Measurements over A’rou and Yingke for 2007–2011

The reliability of the long-term accuracy of AATSR-derived LST data was first evaluated. The corresponding in situ measurements both collocation in space and concurrent in time with the AATSR-derived LST data were chosen. The in situ data were collected every 10 min. The in-situ measurements which have nearest collection time matching with AATSR data were selected and used in the comparison. Nearly all the cloud-free satellite data from 2007 to 2011 available for the in-situ sites were used. It should be noted that the AATSR-derived LST has a spatial resolution of 0.01° at nadir, while the in situ LST measurements were calculated from the four-component radiations at the local scale. The validation results, to some extent, might be affected by the different observation scales. The assessment processes are shown as follows:
First, the simple linear regression model was composed between AATSR-derived LST and in situ measurements. The linear relationship between them is shown in the scatterplot. In this regression model, the coefficient of determination, i.e., R-squared, which shows how well the data are explained by the best-fit line, is also presented as the standard regression output. This model composition was done at each site for both daytime and nighttime observations, respectively. In addition, the histograms of the differences between the satellite-derived LST and in situ measurements were also shown.
Next, three more error measures were calculated considering all the validation points for the two validation sites of A’rou and Yingke: bias (AATSR-derived LST minus in situ LST), STD (standard deviation) and RMSE (root-mean-square error). The annual and seasonal statistics between AATSR-derived LST and in situ LST were both computed.

2.4.2. Long-Term Variations of AATSR-Derived LST for 2003–2011

For the two validation sites, the annual cloud-free AATSR-derived LST variations at A’rou and Yingke site were first analyzed for 2003–2011. Then, the daytime, nighttime and overall time averaged cloud-free AATSR-derived LSTs were computed. In addition, the linear regression was also conducted to show the LST variation trend for nine years. The linear trend is often considered by climatologists rather than a polynomial trend, especially for long-term trend analysis.
For the whole HRB region, the cloud-free statistical analysis includes three parts: First, the nine-year averaged daytime, nighttime and the difference between daytime and nighttime LSTs were shown. Second, the AATSR-derived annually maximum, minimum and averaged LSTs for each pixel of the HRB were calculated for both daytime and nighttime from 2003 to 2011. Third, the corresponding variation trends of the maximum, minimum and averaged LSTs were presented to express the LST changes over this nine years period. In this paper, the trend is presented by the slope calculated from the simple linear regression model between the maximum (minimum and averaged) LST with the period.

3. Results

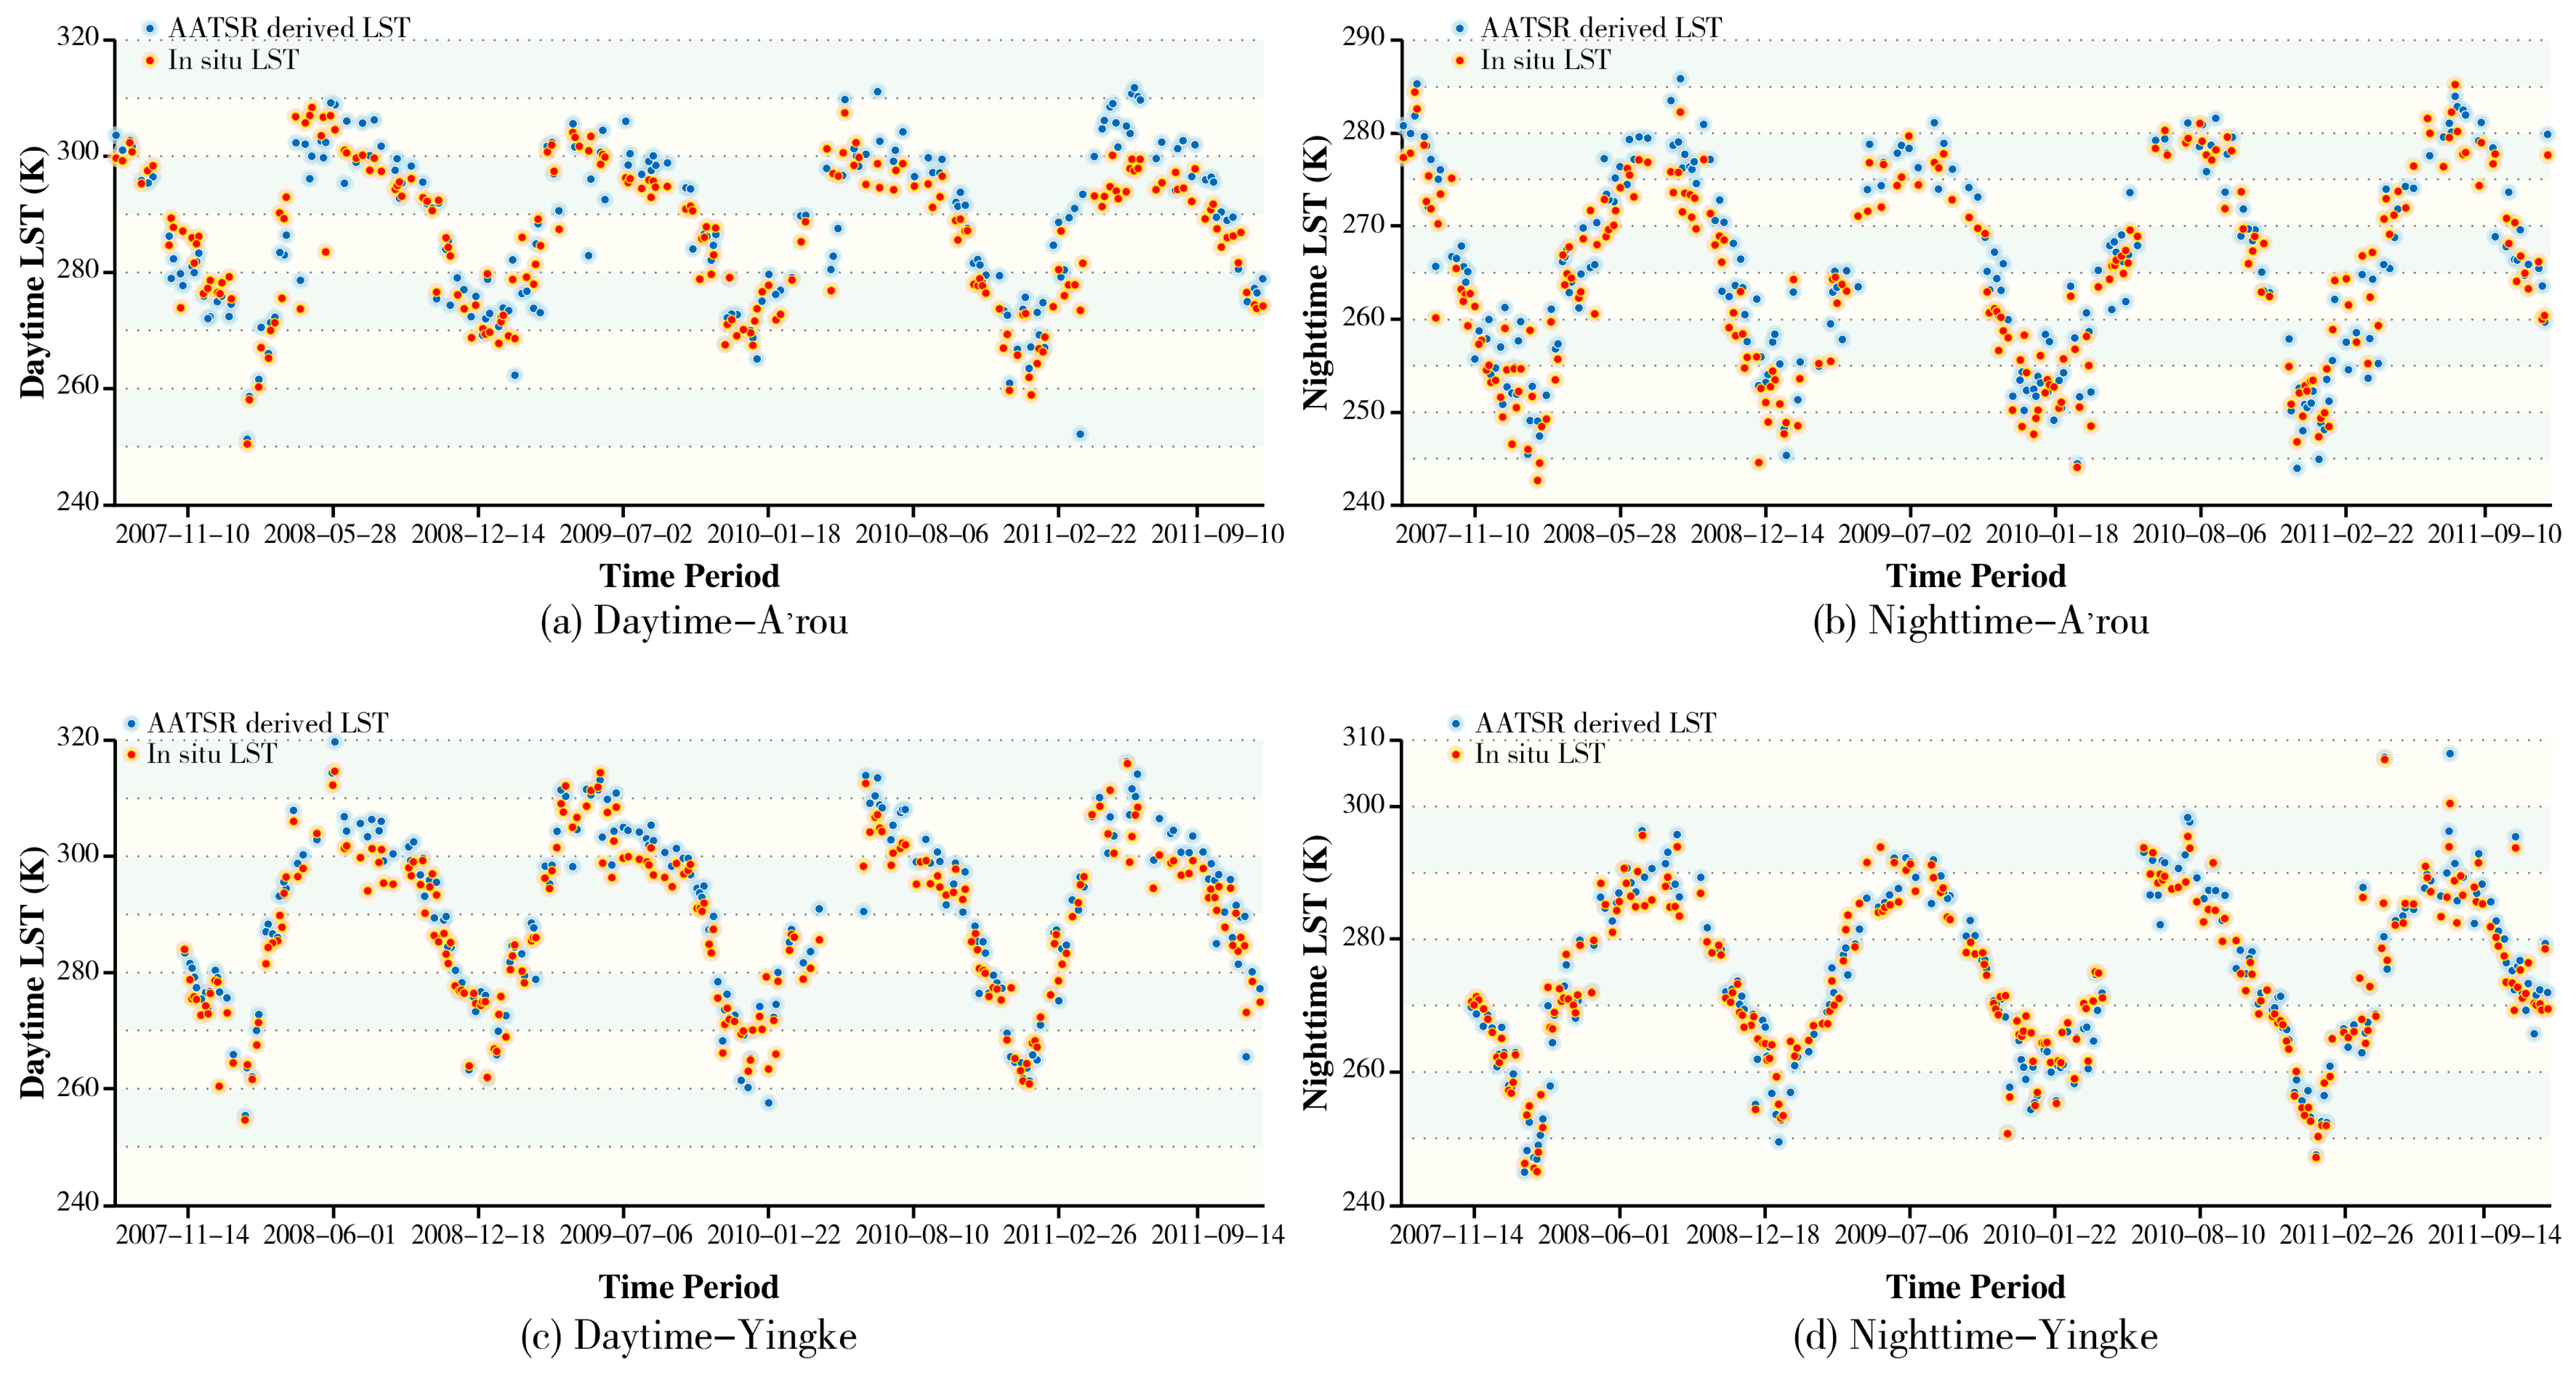
3.1. Assessment of AATSR-Derived LST with In Situ Measurements over A’ron and Yingke for 2007–2011

3.1.1. Annual Analysis

The daytime and nighttime cloud-free validation results between AATSR-derived LST and in situ LST over A’rou and Yingke site for 2007–2011 were analyzed and summarized in Table 2. The scatterplots of the comparisons between the averaged AATSR-derived and ground based LSTs are given in Figure 2, as well as the difference histograms. The annual phase comparisons are shown in Figure 3.
The overall number of cloud-free satellite and in situ concurrent observations for 2007–2011 are 461 at A’rou and 477 at Yingke, respectively. The numbers of cloud-free nighttime observations (244, 250) are greater than that of daytime observations (217, 227) due to the stable weather conditions at night. GlobTemperature Project quality control information was used for the cloud mask in this research. The detail results at each site are discussed as follows.
During the daytime, the bias, STD, RMSE and R2 over A’rou site are 1.57 K, 5.60 K, 5.80 K and 0.82 K for 2007–2011, respectively. At Yingke site, the corresponding statistics are 1.77 K, 3.12 K, 3.58 K and 0.96 K, respectively. During the nighttime, the AATSR-derived LST performs better: at A’rou site, 1.19 K, 3.32 K, 3.52 K and 0.90 K; and, at Yingke site, 0.15 K, 2.74 K, 2.74 K and 0.96 K. The daytime results at A’rou site are not good for at least two potential reasons: first, the A’rou site is located in the Qilian Mountains, and the mountain topography and windy weather condition will affect the satellite LST retrieval; second, the A’rou site has a freeze/thaw condition, especially in the daytime winter/spring when the freeze/thaw transition status happens frequently. When this transition happens, the LSE of mixed ice, water and soil are more difficult to be determined.
For daytime, the averaged bias, STD, RMSE and R2 over both sites is 1.67 K, 4.36 K, 4.69 K and 0.89 K for 2007–2011, respectively. For nighttime, the averaged bias, STD, RMSE and R2 over both sites is 0.67 K, 3.03 K, 3.13 K and 0.93 K for 2007–2011, respectively. The nighttime atmospheric water vapor is less than that in daytime. In addition, when at night the surface will not be heated by direct solar radiation resulted in the minimized thermal contrast between sunlit spots and shadows [32]. Accordingly, AATSR-derived nighttime LST performs better than the daytime LST for both validation sites in Table 2 and Figure 2. For the nighttime comparisons, the AATSR-derived LST at Yingke site with relatively more homogeneous cropland surface performs better than that at A’rou site.
For most sensors, clearly degradation has been shown during the satellite lifetime. In this study, the annual comparisons between AATSR-derived LST and in situ LST for 2008–2011 were also conducted, and the corresponding statistics are shown in Table 2. The results for the year 2007 were not included due to the deficiency of in situ measurements.
The annual results from 2008 to 2011 also show that the nighttime results are well above daytime results. Some sensor degradation is shown in daytime results with a bias from 0.22 K (2008) to 5.61 K (2011), STD from 4.93 K (2008) to 6.32 K (2011), RMSE from 4.89 K (2008) to 8.41 K (2011) and R-squared from 0.89 (2008) to 0.83 (2011) for daytime results over A’rou site, respectively. These results could also be confirmed in Figure 3a for the clearly warmer daytime during summer in 2011. The degradation trend is not clear at Yingke site, in spite of some decrease of R-squared in the daytime results from 0.98 in 2008 to 0.94 in 2011. For the nighttime measurements in Yingke site (Figure 3d), the AATSR-derived LST meets perfectly with ground based measurements within the whole study period.

3.1.2. Seasonal Analysis

The seasonal validations are shown in Table 3. The results suggest that in summer the AATSR-derived LST leads to the largest bias over both validation sites. There are two possible reasons for this. First, the number of co-located data pairs in summer is fewer than those in other seasons, except for the daytime comparison in Yingke site. The small sample size is more vulnerable for abnormal values. Second, in summer, the cloudy sky is much more common than in other seasons. The cloud contamination would also cause more bias in the retrieval results even though researchers have tried the best to mask clouds.
For the daytime comparisons at A’rou site, the error statistics in winter and autumn are smaller than those in spring and summer. In addition to the mentioned cloudiness problem, the LST has shown more dynamic changes in spring and summer than in winter and autumn due to the not equally distributed solar radiation. When the winter and autumn comparisons are analyzed, the autumn LST data give better matching with in situ measurements. As mentioned before, in winter some of the soils over the two sites are in the freeze/thaw transition conditions, especially over A’rou site.
For the nighttime bias comparisons at Yingke site, which are the best results in the seasonal comparison, the AATSR-derived LSTs were overestimated in summer (1.60 K) and autumn (1.17 K) and underestimated in winter (−1.06 K) and spring (−0.65 K). These results could strengthen the seasonal variation cycle conclusion made by Noyes et al. [21].
In conclusion, the AATSR-derived LST results over homogeneous Yingke site are closer to ground measurements than those over A’rou site both for daytime and nighttime. The discrepancies over the two sites are higher for daytime than nighttime. The cloud mask uncertainties, land surface emissivity instabilities associated with land cover types, freeze/thaw transition conditions and acquisition times are the major reasons for the differences in validation results.

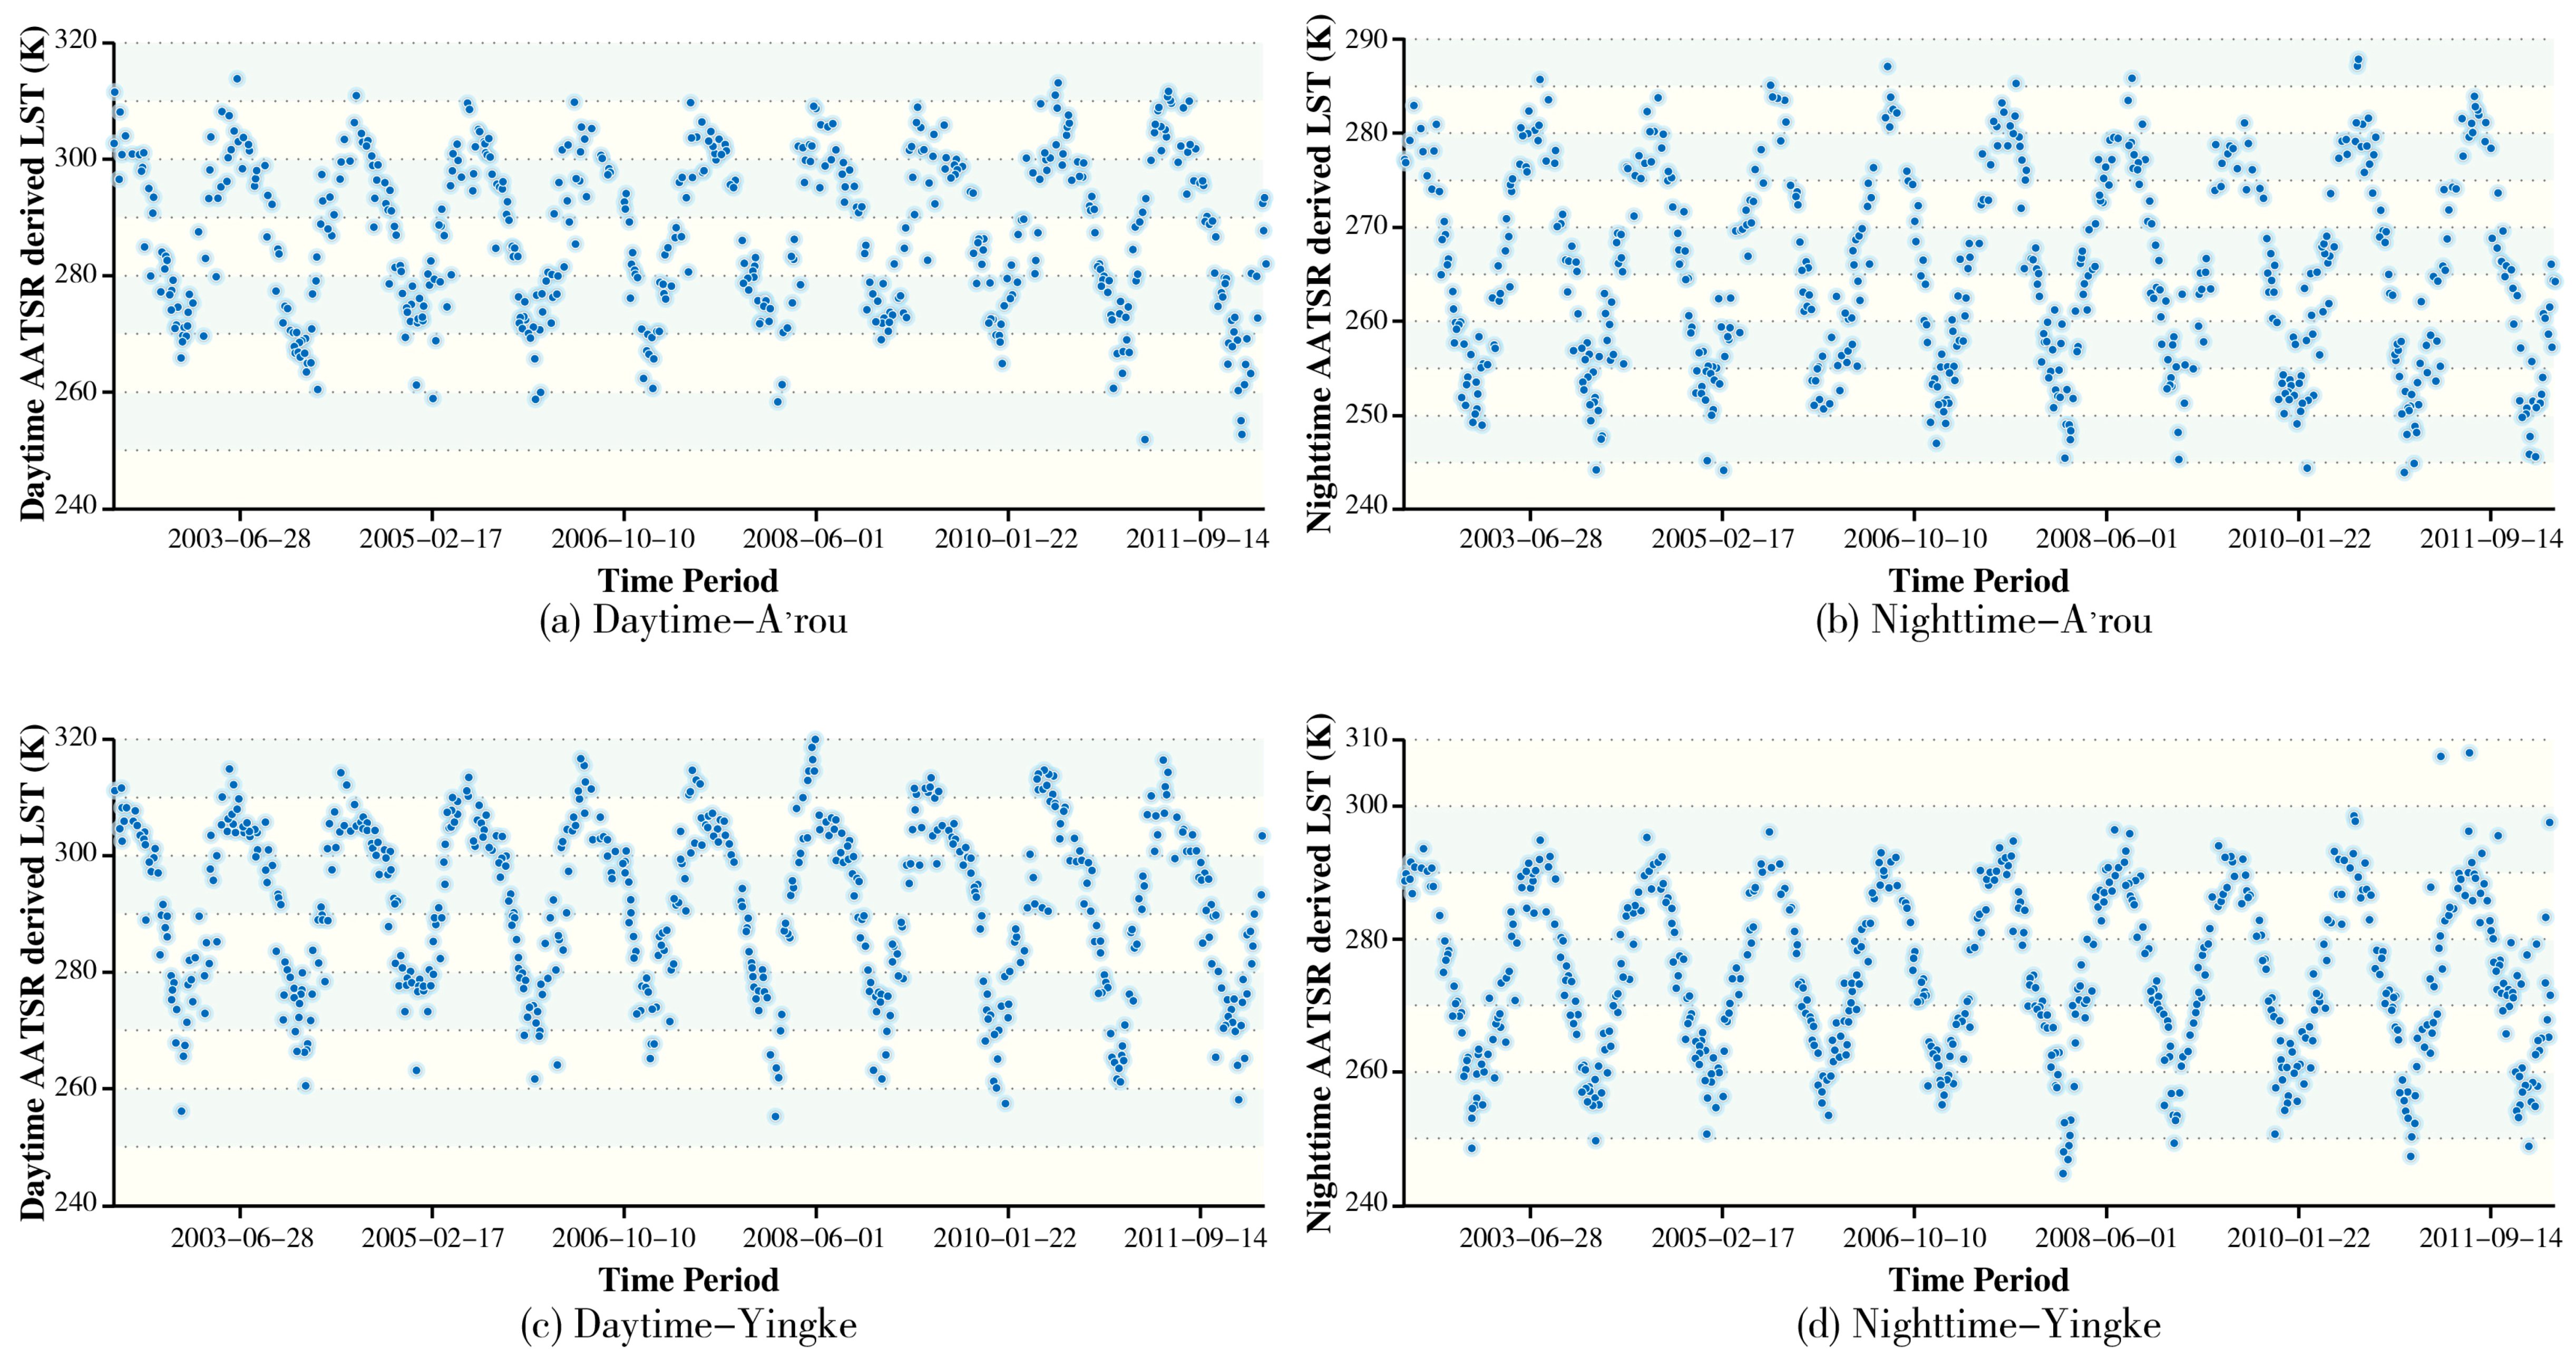
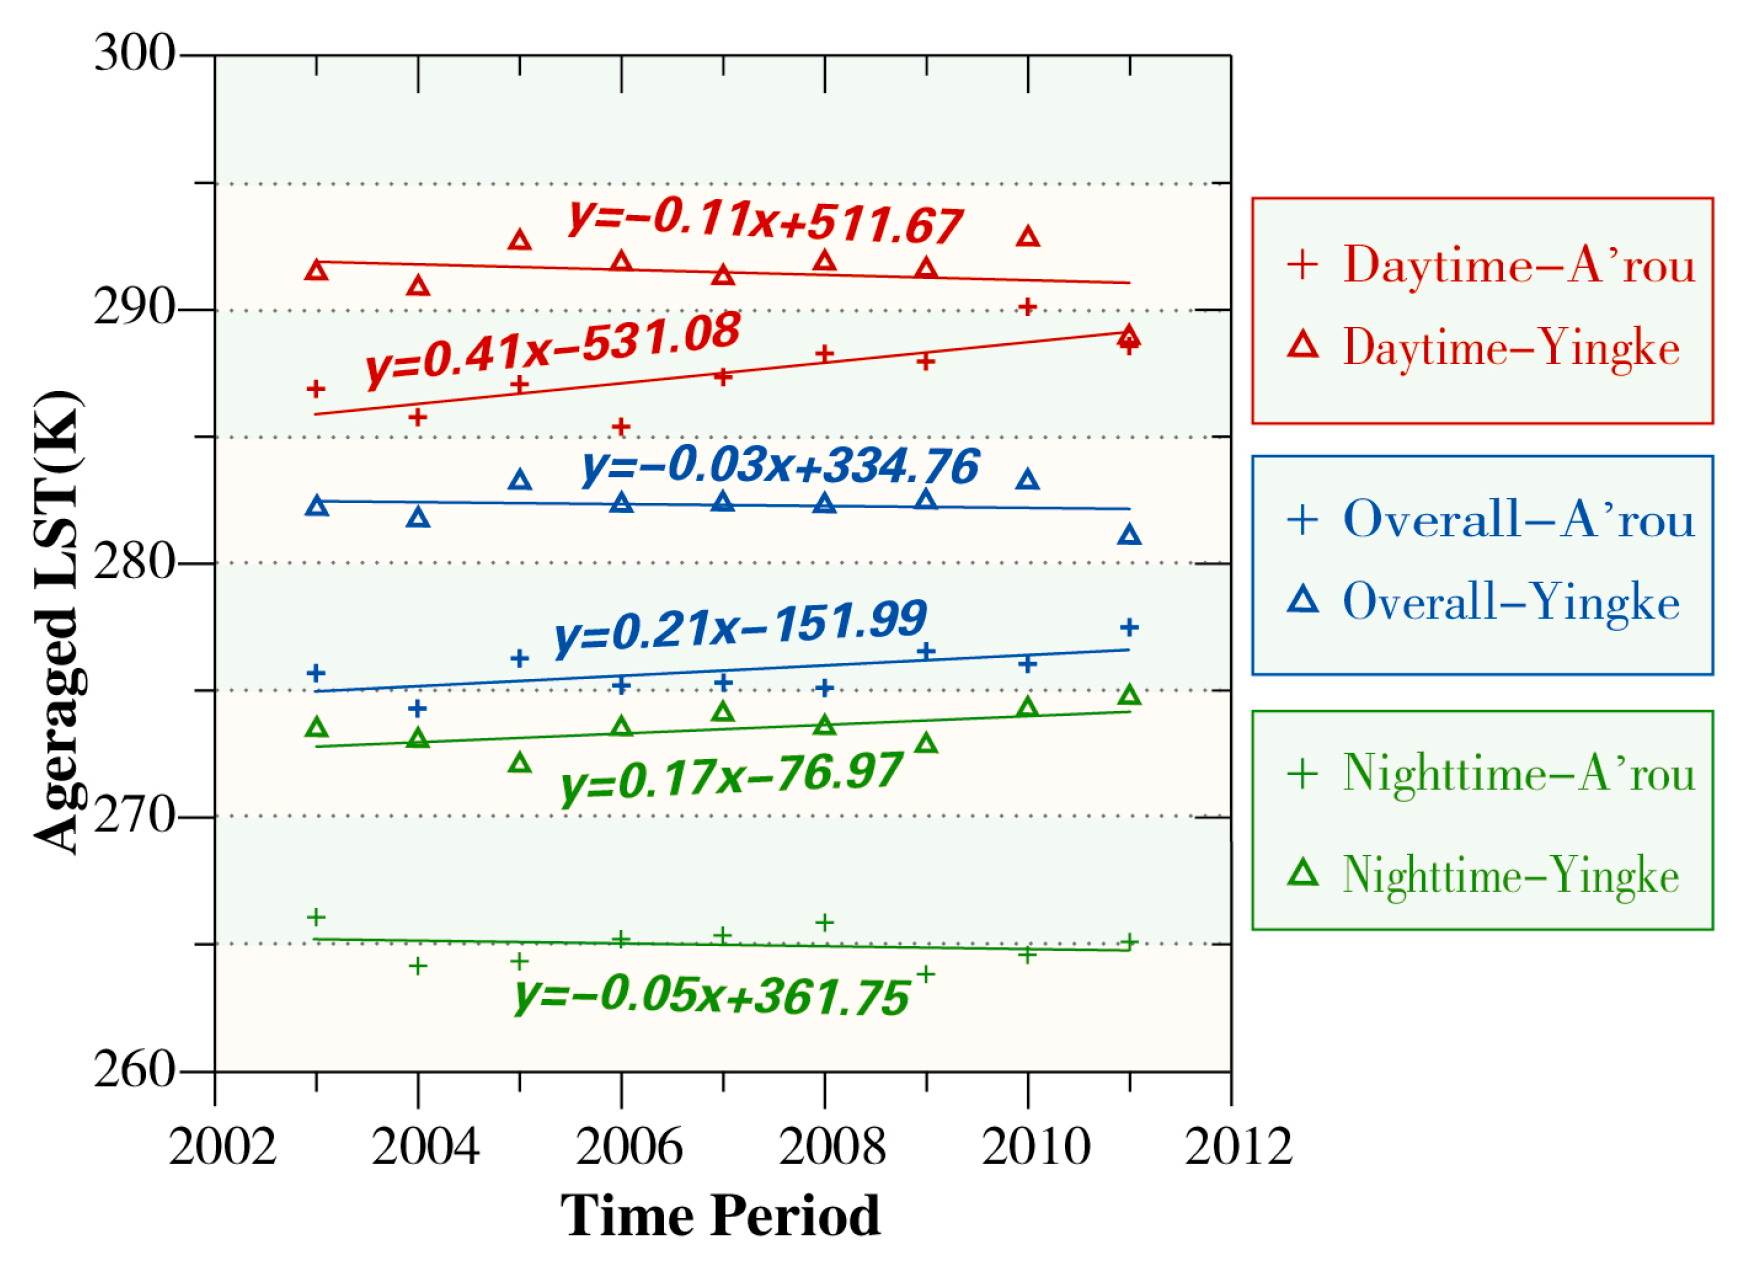
3.2. Long-Term Variations of AATSR-Derived LST for 2003–2011

3.2.1. Two Sites Analysis

The long-term time series of AATSR-derived LST at each site providing annual and seasonal variations are shown in Figure 4. The low values in each figure might be cloud contaminated pixels not screened by the quality flags. As shown in the figures, due to the different elevations, AATSR-derived LST at Yingke site is higher than that at A’rou site, especially at nighttime. For the daytime results at Yingke site, the highest temperature is around 1 June 2008, both in and Figure 3c and Figure 4c during the nine years AATSR-derived LST data.
The annual averaged cloud-free AATSR-derived LSTs were then computed for A’rou and Yingke over 2003–2011 for daytime, nighttime and overall time, respectively (shown in Figure 5). Table 4 shows the number of available cloud-free AATSR data for each site used in Figure 5. For daytime, the linear regression model at A’rou shows a warming trend with a slope of 0.41 K/year for the AATSR-derived LST over the nine years, while at Yingke the model shows a cooling trend with a slope of −0.11 K/year. For nighttime, at A’rou and Yingke the linear regression slopes are −0.05 K/year (cooling) and 0.17 K/year (warming), respectively. Although the temporal variations of AATSR-derived nighttime averaged LST in A’rou show a little decrease, the temporal variations of AATSR-derived daytime (overall) averaged LST at A’rou site show an increase of nearly 4 K (2 K) in cloud-free conditions. Meanwhile, the warming trend at Yingke is not obvious due to the low value for daytime of 2011.

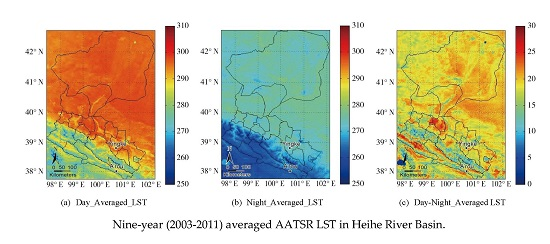
3.2.2. HRB Region Analysis

Figure 6 shows the HRB nine-year (2003–2011) AATSR-derived LST average. The nine-year averaged LST shows clearly the mountain (grassland, blue color on Figure 6a, upstream HRB), the lake (blue color on Figure 6c) and the flat area (barren, red color, downstream HRB). In addition, the Heihe River contour and the around cropland could be easily obtained in the middle reaches. Figure 6c shows clearly the averaged LST difference of water with the barren area.
Figure 7 shows the trend of the maximum, minimum and averaged AATSR-derived LST dynamics for 2003–2011. The averaged daytime (Figure 7c) and nighttime (Figure 7f) LST trends are generally mild except for a warmer trend around the upstream (yellow color on the southeast of the image) of HRB for daytime averaged LST. It should be pointed out that, in the downstream (north) of the HRB region, there are some lakes which were dried up before 2004. After 2004, the government makes the HRB water diversion to these areas. The efforts have significant effects on the lake environment which are shown clearly in Figure 7c,f: the daytime averaged LST trend is cooling (the blue color on the north of Figure 7c), while the nighttime averaged LST trend is remarkable warming (the red color on the north of Figure 7f).
The most standout result is implied in Figure 7b from the trend of the daytime minimum LST which shows a large number of LST decrease in the midstream of HRB region, while the downstream of HRB region shows an intensively increasing trend during the nine years. The increasing trend is clearly shown in the downstream of HRB by the nine-year statistics.
Table 5 shows the region-averaged values of annual AATSR-derived LST departure from the nine-year averaged LST in the HRB. The anomaly of averaged values is tagged red in 2005 and 2010 when the region-averaged anomaly is larger than that of other years. These results should also be obtained in Figure 7. However, for the whole HRB region, the LST trend could hardly be concluded for 2003–2011 because of some unexpected anomalies which might be due to the moderate La Niña (cool) events during 2010–2011 [33]. In addition, the results are limited by satellite observation uncertainties, if the climate anomalies occur near the beginning or the end of the observations, the trend estimates may be biased [34,35].

4. Discussion

4.1. Satellite Derived LST Validation

The AATSR-derived LST product has a wide variety of future applications, especially with its ancestor ATSR-2 and its successor SLSTR (Sea and Land Surface Temperature Radiometer) onboard Sentinel-3 satellite. Combing these sensors derived LST products together, twenty years globally data could be obtained and could give a substantial LST data for studies of climate change, land–atmosphere feedbacks, land cover change, crop management, and other applications [17].
A worse performance of A’rou was found in this paper. The potential possibility might be the high elevation (over 3000 m), freeze/thaw problems and the cloud and rainy weather condition in the mountain area.
Another issue affecting the validation results is the scaling mismatch problems caused by the different representativeness between the ground-based and satellite-based LSTs. Many efforts have been made to address this issue in the last decades [19,25,36]. Most of the previous studies of LST validation have focused on the homogeneous and flat areas in order to avoid the thermal heterogeneity. In fact, the ideal validation area is not easy to find. Thus, the satellite-based LST product validation is often restricted by the limited sites, especially in China. However, in order to better use satellite-based LST products in different applications, the assessments of the satellite-based LSTs for all kinds of land surface types are necessary.

4.2. Temperature Trend in HRB

Some previous efforts have made on the analysis of HRB temperature warming trend from satellite based LST and ground based measurements to simulated models. Jin et al. [35] used 11 years (2000–2010) of MODIS monthly observation data to show a slight warming trend over the Tibetan Plateau, in which HRB is located. Luo et al. [37] used a Mann–Kendall trend test to analyze the dynamics of atmospheric temperature in HRB and concluded that annual mean temperature increased significantly in the entire HRB during 1980–2009. They also concluded that the downstream HRB contribute largely to the whole HRB warming trend. Li and Wang [38] found that on the annual scale, time series of averaged atmospheric temperature at all the selected stations from HRB presented remarkable increasing trends.
In this work, the nine years AATSR-derived LST at the A’rou site showed an increase from 2003 to 2011. The increasing trend at Yingke site is also apparent, although a little decrease occurs for 2011. For the whole HRB region, the increasing trend was not obvious for 2003–2011. The warming trend is clearly shown in the downstream of HRB. This confirmed the conclusion made by Luo et al. [37] as the downstream make the largest contribution to the warming trend in HRB. The warming trend results in this work provide another independent evidence for the temperature change studies over HRB region.
The long-term variation analysis at A’rou and Yingke sites also demonstrated the need for the further cloud pixel detection processes in the LST product. As mentioned by Kogler et al. [14], the cloud contamination might affect the long-term LST warming/cooling analysis. In addition, the trend analysis might also be impacted by multi-sensors calibration biases, as well as the degradation of the sensors themselves. Therefore, improved and strict cloud-detection algorithms and multi-sensor calibration from long-term LST data are quite necessary for the LST dataset utilizations.

5. Conclusions

The updated long-term AATSR-derived LST products were compared with ground based LST measurements from 2007 to 2011 at the two validation sites in HRB, China. The comparison was conducted with simultaneous in situ temperature measurements at areas with the homogeneous land use but with different elevations. Besides the cloud effect and other data accuracy problems in the LST retrievals, i.e., the time and viewing angle differences and observation footprint differences, the results from the two validation sites indicate that the AATSR-derived LST products yield a reasonable accuracy, especially at nighttime. For nighttime, the averaged bias, STD, RMSE and R2 over both sites are 0.67 K, 3.03 K, 3.13 K and 0.93 K, respectively. In addition, the Yingke site with an elevation of 1519 m performs better than the A’rou site at 3032.8 m. The corresponding nighttime results from Yingke site are 0.15 K, 2.74 K, 2.74 K and 0.96 K.
Next, the time series of AATSR-derived LST over HRB and two individual sites were analyzed for 2003–2011. The long term series of the sites showed some cloudy possibility in A’rou and Yingke sites which is very useful for the further cloud pixel detection processes. Moreover, the nine years AATSR-derived LST from the A’rou site for daytime showed an obvious increase from 2003 to 2011. Due to the low value for daytime of 2011, the LST trend is not obvious. For the whole HRB region, the warming trend is clearly shown in the downstream of HRB.
The future inter comparison between different satellites derived LST should be done to validate the AATSR-derived LST and make an inter-calibration results avoiding the different scale representatives between satellite derived LST and in situ measurements. Further researches extending or updating the satellite observed LST to the past (e.g., the 1980s) will make a better understanding of the local temperature change trend, as well as the global/regional warming.

Acknowledgments

This research was supported by the NSFC (National Natural Science Foundation of China) grant No. 41571366 and 41101326, the State Key Laboratory of Remote Sensing Science grant, and Canada National Science and Engineering Research Council (NSERC) Discovery Grant. The AATSR GlobTemperature Level-2/Level-3 v1.0 LST data were made available through the GlobTemperature Data Portal and were generated through the ESA DUE GlobTemperature Project with the support of NCEO. The costs to publish this paper in open access are covered by NSFC grant No. 41571366. Xiaoying Ouyang is financially supported by China Scholarship Council for her stay in Queen’s University, Canada. The authors would like to thank four anonymous reviewers for their constructive comments and suggestions which have greatly helped improving the quality of the paper.

Author Contributions

Xiaoying Ouyang conducted for the study and the write up of the manuscript with contributions for the methodology design. Dongmei Chen provided supervision and helped in the writing and revision of the manuscript. The other co-authors provided suggestions and helps on data collection, manuscript construction and results analysis throughout the process.

Conflicts of Interest

The authors declare no conflict of interest.

References

  1. Brunsell, N.A.; Gillies, R.R. Length scale analysis of surface energy fluxes derived from remote sensing. J. Hydrometeorol. 2003, 4, 1212–1219. [Google Scholar] [CrossRef]
  2. Kustas, W.; Anderson, M. Advances in thermal infrared remote sensing for land surface modeling. Agric. For. Meteorol. 2009, 149, 2071–2081. [Google Scholar] [CrossRef]
  3. Li, Z.-L.; Tang, B.-H.; Wu, H.; Ren, H.; Yan, G.; Wan, Z.; Trigo, I.F.; Sobrino, J.A. Satellite-derived land surface temperature: Current status and perspectives. Remote Sens. Environ. 2013, 131, 14–37. [Google Scholar] [CrossRef]
  4. Cheng, J.; Liang, S.; Verhoef, W.; Shi, S.; Liu, Q. Estimating the Hemispherical Broadband Longwave Emissivity of Global Vegetated Surfaces using a Radiative Transfer Model. IEEE Trans. Geosci. Remote Sens. 2016, 54, 905–917. [Google Scholar] [CrossRef]
  5. Allen, M.R.; Mutlow, C.T.; Blumberg, G.M.C.; Christy, J.R.; McNider, R.T.; Llewellyn-Jones, D.T. Global change detection. Nature 1994, 370, 24–25. [Google Scholar] [CrossRef]
  6. Becker, F.; Li, Z.-L. Temperature-independent spectral indices in thermal infrared bands. Remote Sens. Environ. 1990, 32, 17–33. [Google Scholar] [CrossRef]
  7. Coll, C.; Caselles, V.; Sobrino, J.A.; Valor, E. On the atmospheric dependence of the split-window equation for land surface temperature. Int. J. Remote Sens. 1994, 15, 105–122. [Google Scholar] [CrossRef]
  8. Prata, A.J. Land surface temperatures derived from the advanced very high resolution radiometer and the along-track scanning radiometer 2. Experimental results and validation of AVHRR algorithms. J. Geophys. Res. 1994, 99, 13025–13058. [Google Scholar] [CrossRef]
  9. Wan, Z.; Dozier, J. A generalized split-window algorithm for retrieving land-surface temperature from space. IEEE Trans. Geosci. Remote Sens. 1996, 34, 892–905. [Google Scholar]
  10. Qin, Z.H.; Karnieli, A. A mono-window algorithm for retrieving land surface temperature from Landsat TM data and its application to the Israel–Egypt border region. Int. J. Remote Sens. 2001, 22, 3719–3746. [Google Scholar] [CrossRef]
  11. Tang, B.-H.; Bi, Y.; Li, Z.-L.; Xia, J. Generalized Split-Window algorithm for estimate of land surface temperature from Chinese geostationary FengYun meteorological satellite (FY-2C) data. Sensors 2008, 8, 933–951. [Google Scholar] [CrossRef] [PubMed]
  12. Atitar, M.; Sobrino, J.A. A split-window algorithm for estimating LST from Meteosat 9 data: Test and comparison with in situ data and MODIS LSTs. IEEE Geosci. Remote Sens. Lett. 2009, 6, 122–126. [Google Scholar] [CrossRef]
  13. Zhou, J.; Li, M.; Liu, S.; Jia, Z.; Ma, Y. Validation and Performance Evaluations of Methods for Estimating Land Surface Temperatures from ASTER Data in the Middle Reach of the Heihe River Basin, Northwest China. Remote Sens. 2015, 7, 7126–7156. [Google Scholar] [CrossRef]
  14. Kogler, C.; Pinnock, S.; Arino, O.; Casadio, S.; Corlett, G.; Prata, F.; Bras, T. Note on the quality of the (A)ATSR land surface temperature record from 1991 to 2009. Int. J. Remote Sens. 2011, 33, 4178–4192. [Google Scholar] [CrossRef]
  15. Galve, J.M.; Coll, C.; Prata, F. Monthly Land Surface Temperature Maps over European Zone Using Advanced along Track Scanning Radiometer Data for 2007. Available online: http://lst.nilu.no/Portals/73/Docs/Pubs/Galve_1317.pdf (accessed on 26 December 2016).
  16. Ghent, D.; Kaduk, J.; Remedios, J.; Ardö, J.; Balzter, H. Assimilation of land surface temperature into the land surface model JULES with an ensemble Kalman filter. J. Geophys. Res. 2010, 115, D19112. [Google Scholar] [CrossRef]
  17. ESA Land Surface Temperature Portal. Available online: http://lst.nilu.no/language/en-US/Home.aspx (accessed on 9 February 2016).
  18. Prata, A.J. Land Surface Temperature Measurement from Space: AATSR Algorithm Theoretical Basis Document; CSIRO Atmospheric Research: Aspendale, Australia, 2002. [Google Scholar]
  19. Coll, C.; Caselles, V.; Galve, J.M.; Valor, E.; Niclos, R.; Sanchez, J.M.; Rivas, R. Ground measurements for the validation of land surface temperatures derived from AATSR and MODIS data. Remote Sens. Environ. 2005, 97, 288–300. [Google Scholar] [CrossRef]
  20. Coll, C.; Caselles, V.; Galve, J.M.; Valor, E.; Niclo’s, R.; Sa’nchez, J.M. Evaluation of split-window and dual-angle correction methods for land surface temperature retrieval from Envisat/Advanced Along Track Scanning Radiometer (AATSR) data. J. Geophys. Res. 2006, 111, D12105. [Google Scholar] [CrossRef]
  21. Noyes, E.; Corlett, G.; Remedios, J.; Kong, X.; Llewellyn-Jones, D. An accuracy assessment of AATSR LST data using empirical and theoretical methods. In Proceedings of the Envisat Symposium, Montreux, Switzerland, 23–27 April 2007.
  22. Sòria, G.; Sobrino, J.A. ENVISAT/AATSR derived land surface temperature over a heterogeneous region. Remote Sens. Environ. 2007, 111, 409–422. [Google Scholar] [CrossRef]
  23. Coll, C.; Caselles, V.; Galve, J.M.; Mira, M.; Bisquert, M.; Vicente, G.-S. Long-term accuracy assessment of land surface temperatures derived from the Advanced Along-Track Scanning Radiometer. Remote Sens. Environ. 2012, 116, 211–225. [Google Scholar] [CrossRef]
  24. Schneider, P.; Ghent, D.; Corlett, G.; Prata, F.; Remedios, J. AATSR Validation: LST Validation Protocol; University of Leicester: Leicester, UK, 2012. [Google Scholar]
  25. Wan, Z.; Zhang, Y.; Zhang, Q.; Li, Z.-L. Validation of the land-surface temperature products retrieved from Terra Moderate Resolution Imaging Spectroradiometer data. Remote Sens. Environ. 2002, 83, 163–180. [Google Scholar] [CrossRef]
  26. Ghent, D. Land Surface Temperature Validation and Algorithm Verification; Report to European Space Agency; European Space Agency: Paris, France, 2012. [Google Scholar]
  27. Li, X.; Li, X.; Li, Z.; M, M.; Wang, J.; Qiao, X.; Liu, Q.; Che, T.; Chen, E.; Yan, G.; et al. Watershed allied telemetry experimental research. J. Geophys. Res. 2009, 114, D22103. [Google Scholar] [CrossRef]
  28. ESA DUE GlobTemperature Project. Available online: http://www.globtemperature.info/ (accessed on 16 August 2015).
  29. Llewellyn-Jones, D.; Edwards, M.; Mutlow, C.; Birks, A.; Barton, I.; Tait, H. AATSR: Global-change and surface-temperature measurements from ENVISAT. ESA Bull. 2001, 105, 10–21. [Google Scholar]
  30. Hu, Z.; Ma, M.; Jin, R.; Wang, W.; Huang, G.; Zhang, Z.; Tan, J. WATER: Dataset of Automatic Meteorological Observations at the A’rou Freeze/Thaw Observation Station; Cold and Arid Regions Environmental and Engineering Research Institute, Chinese Academy of Sciences: Beijing, China, 2008. [Google Scholar]
  31. Cheng, J.; Liang, S.; Yao, Y.; Zhang, X. Estimating the Optimal Broadband Emissivity Spectral Range for Calculating Surface Longwave Net Radiation. IEEE Geosci. Remote Sens. Lett. 2013, 10, 401–405. [Google Scholar] [CrossRef]
  32. Sobrino, J.A.; Jiménez-Muñoz, J.C.; Sòria, G.; Ruescas, A.B.; Danne, O.; Brockmann, C.; Ghent, D.; Remedios, J.; North, P.; Merchant, C.; et al. Synergistic use of MERIS and AATSR as a proxy for estimating Land Surface Temperature from Sentinel-3 data. Remote Sens. Environ. 2016, 179, 149–161. [Google Scholar] [CrossRef]
  33. El Niño and La Niña Years and Intensities Based on Oceanic Niño Index (ONI). Available online: http://ggweather.com/enso/oni.htm (accessed on 25 November 2016).
  34. Vinnikov, K.Y.; Robock, A.; Grody, N.C.; Basist, A. Analysis of diurnal and seasonal cycles and trends in climatic records with arbitrary observation times. Geophys. Res. Lett. 2004, 31, L06205. [Google Scholar] [CrossRef]
  35. Jin, M.; Mullens, T.J. Land-biosphere-atmosphere interactions over the Tibetan plateau from MODIS observations. Environ. Res. Lett. 2012, 7, 014003. [Google Scholar] [CrossRef]
  36. Zhan, W.; Chen, Y.; Zhou, J.; Wang, J.; Liu, W.; Voogt, J.; Zhu, X.; Quan, J.; Li, J. Disaggregation of remotely sensed land surface temperature: Literature survey, taxonomy, issues, and caveats. Remote Sens. Environ. 2013, 131, 119–139. [Google Scholar] [CrossRef]
  37. Luo, K.; Tao, F.; Miowo, J.P.; Xiao, D. Attribution of hydrological change in Heihe River Basin to climate and land use change in the past three decades. Sci. Rep. 2016, 6, 33704. [Google Scholar] [CrossRef] [PubMed]
  38. Li, Z.; Wang, X. Shift trend analysis of meteorological time series in the upper and middle reaches of Heihe River Basin. Geogr. Res. 2011, 9, 2059–2066. (In Chinese) [Google Scholar]
Figure 1. Geographical/Land cover map encompassing the HRB and the two in situ sites position (for details see [27]). The right image is the AATSR LST image on 23 December 2008.
Remotesensing 09 00152 g001
Figure 2. Comparisons between AATSR-derived LST and in situ LST at A’rou and Yingke site for 2007–2011: (a) daytime comparison at A’rou site; (b) daytime comparison at Yingke site; (c) nighttime comparison at A’rou site; (d) nighttime comparison at Yingke site; (e) daytime LST differences for each site; (f) nighttime LST differences for each site.
Remotesensing 09 00152 g002
Figure 3. Annual phase comparison results between AATSR-derived LST and in situ LST at A’rou and Yingke site for 2007–2011: (a) daytime comparison at A’rou site; (b) nighttime comparison at A’rou site; (c) daytime comparison at Yingke site; (d) nighttime comparison at Yingke site.
Remotesensing 09 00152 g003
Figure 4. Annual phase of AATSR-derived LST at A’rou and Yingke site during daytime and nighttime for 2003–2011: (a) daytime LST series at A’rou site; (b) nighttime LST series at A’rou site; (c) daytime LST series at Yingke site; (d) nighttime LST series at Yingke site.
Remotesensing 09 00152 g004
Figure 5. Temporal variations of AATSR-derived annual averaged LST at A’rou and Yingke site for 2003–2011.
Remotesensing 09 00152 g005
Figure 6. Nine-year (2003–2011) averaged AATSR LST: (a) daytime averaged LST; (b) nighttime averaged LST; and (c) the averaged difference between daytime and nighttime LST.
Remotesensing 09 00152 g006
Figure 7. Trend of AATSR-derived annual maximum (minimum, averaged) daytime (nighttime) LST in HRB region for 2003–2011: (a) trend of daytime maximum LST; (b) trend of daytime minimum LST; (c) trend of daytime averaged LST; (d) trend of nighttime maximum LST; (e) trend of nighttime minimum LST; (f) trend of nighttime averaged LST.
Remotesensing 09 00152 g007
Table 1. Characteristics of the two validation sites and the acquisition period of in situ data.
SiteLatitudeLongitudeElevation (m)Land CoverTime PeriodSamples
A’rou38°03′N100°27′E3032.8Alpine meadowAugust 2007~November 2011461
Yingke38°51′N100°25′E1519Cropland (Maize)November 2007~November 2011477
Table 2. Bias, standard deviation (STD), root mean square error (RMSE), and correlation coefficient R-squared of the AATSR-derived LST vs. in situ LST over A’rou and Yingke site for 2007–2011.
YearA’rou Yingke
DaytimeNighttime DaytimeNighttime
NBias (K)STD (K)RMSE (K)R2NBias (K)STD (K)RMSE (K)R2 NBias (K)STD (K)RMSE (K)R2NBias (K)STD (K)RMSE (K)R2
2008510.224.934.890.89672.713.084.090.91 552.252.333.220.98640.412.542.550.97
2009520.154.694.640.86461.263.303.500.89 611.332.793.070.9758−0.803.333.390.93
2010432.084.665.060.86530.502.592.620.94 481.783.694.060.94550.261.682.740.95
2011495.616.328.410.83480.653.273.300.92 511.443.273.540.96610.731.542.330.97
2007–20112171.575.605.800.822441.193.323.520.90 2271.773.123.580.962500.152.742.740.96
Table 3. Bias, standard deviation (STD), root mean square error (RMSE), and correlation coefficient R-squared of the AATSR-derived LST vs. in situ LST over A’rou and Yingke site for different seasons of 2007–2011. Only the winter includes the year of 2007.
SeasonA’rou Yingke
DaytimeNighttime DaytimeNighttime
NBias (K)STD (K)RMSE (K)R2NBias (K)STD (K)RMSE (K)R2 NBias (K)STD (K)RMSE (K)R2NBias (K)STD (K)RMSE (K)R2
Winter560.864.364.400.63541.633.473.800.48 650.513.413.420.8375−1.062.953.110.79
Spring550.808.309.260.55570.283.213.190.75 420.732.792.850.9357−0.652.312.380.93
Summer424.64.426.340.20421.902.493.110.36 514.202.544.890.76551.602.703.120.60
Autumn521.732.933.420.87541.913.253.750.78 681.722.392.930.93621.171.892.210.93
Table 4. The number of available cloud-free AATSR data for each site used in Figure 5.
YearA’rouYingke
DaytimeNighttimeOverallDaytimeNighttimeOverall
200348561046064124
200454611156164125
200562561186656122
200650511015863121
200753641176267129
200847671146369132
20095247996158119
201053651185862120
201159531125670126
Table 5. Averaged values of annual AATSR-derived LST departure from the nine-year (2003–2011) average shown as Figure 6 in the HRB.
YearDay_Averaged_LSTNight_Averaged_LSTDay-Night_Averaged LST
2003−0.060.03−1.09
20040.920.170.67
20051.14−0.830.87
2006−0.030.49−0.24
20070.070.830.19
2008−0.200.080.27
20090.10−0.530.55
20101.101.06−0.77
2011−0.68−0.670.27

