The Effects of Forest Area Changes on Extreme Temperature Indexes between the 1900s and 2010s in Heilongjiang Province, China


1
Key Laboratory of Remote Sensing Monitoring of Geographic Environment, Harbin Normal University, Harbin 150025, China
2
Key Laboratory of Land Surface Process and Climate Change in Northwest Institute of Eco-Environment and Resources, Chinese Academy of Sciences, Lanzhou 730000, China
3
Innovation and Opening Laboratory of Regional Eco-Meteorology in Northeast, China Meteorological Administration, Harbin 150030, China
4
Meteorological Academician Workstation of Heilongjiang Province, Harbin 150030, China
5
Heilongjiang Province Institute of Meteorological Sciences, Harbin 150030, China
*
Author to whom correspondence should be addressed.
Remote Sens. 2017, 9(12), 1280; https://doi.org/10.3390/rs9121280
Submission received: 29 October 2017
/
Revised: 5 December 2017
/
Accepted: 6 December 2017
/
Published: 9 December 2017
(This article belongs to the Special Issue Remote Sensing of Forest Growth in a Changing Climate)
Abstract
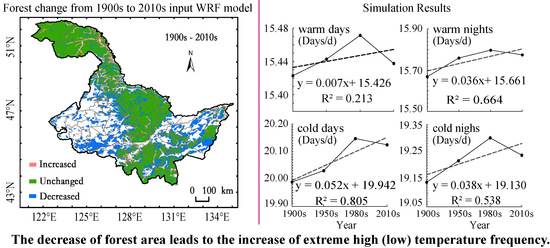
:Land use and land cover changes (LUCC) are thought to be amongst the most important impacts exerted by humans on climate. However, relatively little research has been carried out so far on the effects of LUCC on extreme climate change other than on regional temperatures and precipitation. In this paper, we apply a regional weather research and forecasting (WRF) climate model using LUCC data from Heilongjiang Province, that was collected between the 1900s and 2010s, to explore how changes in forest cover influence extreme temperature indexes. Our selection of extreme high, low, and daily temperature indexes for analysis in this study enables the calculation of a five-year numerical integration trail with changing forest space. Results indicate that the total forested area of Heilongjiang Province decreased by 28% between the 1900s and 2010s. This decrease is most marked in the western, southwestern, and northeastern parts of the province. Our results also reveal a remarkable correlation between change in forested area and extreme high and low temperature indexes. Further analysis enabled us to determine that the key factor explaining increases in extreme high temperature indexes (i.e., calculated using the number of warm days, warm nights, as well as tropical nights, and summer days) is decreasing forest area; data also showed that this factor caused a decrease in extreme low temperature indexes (i.e., calculated using the number of cold days and cold nights, as well as frost days, and ice days) and an increase in the maximum value of daily minimum temperature. Spatial data demonstrated that there is a significant correlation between forest-to-farmland conversion and extreme temperature indexes throughout most of our study period. Spatial data demonstrated that there is a significant correlation between forest-to-farmland conversion and extreme temperature indexes throughout most of our study period. Positive correlations are also present between decreasing forest area, the more frequent occurrence of extreme high temperature events, and a rise in the maximum value of daily minimum temperature. At the same time, we found clear negative correlations between decreasing forest area and less frequent occurrence of extreme low temperature events.
1. Introduction
Humans exert a definitive influence on the climate system [1]. In addition to significant increases in aerosols such as greenhouse gases and sulfates, human activities have also led to marked land use and land cover changes (LUCC). One report by the American National Research Council noted that, in some cases, the effects exerted by LUCC on climate can be larger than those of greenhouse gases [2]. Thus, because of changes in physical parameters such as surface albedo, roughness, and evapotranspiration, LUCC influences the transfer of energy between the land surface and the atmosphere, as well as water and momentum transmission, and the exchange of trace gases (such as CO2) [3,4]. A number of researchers have utilized observational statistics and model simulations to verify these effects [5,6,7,8,9,10,11,12], as more-and-more frequent extreme weather events (e.g., heavy rainfall, heat waves, floods, and droughts) since the 1950s have caused natural disasters because of global warming [13,14,15,16]. Researchers around the world are increasingly focusing attention on the causes and mechanisms of extreme climate events. The bulk of studies carried out so far on the effects of LUCC have considered changes in average climate anomalies; however, research from the perspective of external forcing remains at an early stage. Nevertheless, some studies have discussed human-induced climate warming and concomitant increases in the frequency and strength of extreme events [14,17,18,19,20]. Some studies have also shown that the effects of LUCC and the radiation of CO2 on extreme temperature and precipitation are almost the same [21,22]; thus, Zhao and Pitman [23] argue that the influence of LUCC on maximum temperature is basically equivalent to the effects of CO2. These researchers also noted that, in some parts of Europe, the conversion of deciduous forest to farmland has led to a reduction in the daily surface maximum temperature because of a decrease in stomatal resistance and an increase in latent heat flux. In China, however, although albedo is gradually changing from broad-leaved forest to grassland, the possibility of high surface temperatures is also increasing because of a reduction in latent heat flux, mainly as a result of decreasing leaf area index (LAI), roughness, and root length. As broad-leaved deciduous forest is transformed to mixed farmland and irrigated crops across central and northern China, obvious increases in latent heat flux and wind speed have also been recorded, even though overall temperature remains relatively low [22]. Surprisingly, despite the current research mentioned above, relatively few studies have addressed LUCC rather than CO2 as a dominant forcing factor in the simulation of extreme climatic events.
Heilongjiang Province hosts the largest forested area of the 34 Chinese provinces as well as the highest forest coverage rate. However, increasing population levels over the last century (i.e., from 2.710 million people in 1908 to 38.120 million people in 2015), as well as a rapid increase in the demand for wood and irrational deforestation, have caused a marked decrease in forested land area. Heilongjiang Province has also experienced the largest rate of temperature increase within China because it encompasses both intermediate and high latitudes; observational statistics demonstrate that extreme high temperature events have occurred with increasing regularity in recent years, while the number of extreme low temperature events has decreased [24]. The main aim of this paper is therefore to determine whether or not a reduction in forested area within the province has influenced these extreme changes in climate. Compared to previous work, this study: (1) Based on actual data via backtracking and filling methods, we utilize simulation methods to address changes in the Earth’s surface, incorporating 100-year scale coverage as a driving force, rather than other methods which only control the land cover change; and (2) Examines the influence of forest changes on extreme climatic events, also over a 100-year scale.
2. Study Area
The name Heilongjiang refers to the largest river, the Heilong, that runs through this region (‘Hei’ is the short form). This province is located in northeastern China (121.183°E–135.083°E, 43.433°N–53.550°N), and encompasses the most northerly regions of the country; the northern and eastern border with Russia are the Heilongjiang and Ussuri River. Heilongjiang Province lies to the east of the Inner Mongolia Autonomous Region and to the north of Jilin Province (Figure 1); the total land area of this region is approximately 45.400 × 10⁴ km2, around half of which is forested (20.565 × 10⁴ km2). The forest coverage is about 45.297%, dominated by northern temperate deciduous coniferous forest as well as medium latitude temperate coniferous and broad-leaved mixed forest distributed across the Greater Hinggan, the Lesser Hinggan, and eastern mountains. Heilongjiang Province is characterized by a continental monsoonal climate, comprising four distinct seasons with long, cold winters and short, hot summers. The annual average temperature in this region ranges between −4 °C and 5 °C, one of the lowest provincial-level ranges within China; indeed, the temperature of the southeastern part of this province is normally much higher than that of the northwestern area, with a maximum difference of nearly 10 °C. Overall precipitation is between 400 mm and 650 mm and tends to be higher in the east and lower in the west. Thus, along an east-to-west transect, Heilongjiang Province can be subdivided into humid, semi-humid, and semi-arid regions.
3. Data
3.1. Heilongjiang Province Forest Coverage
We utilized data encompassing four time periods in this study, the 1900s, 1950s, 1980s, and 2010s. Much of our discussion of geographical environment, the history and current forest resource situation, as well as zoning, classification theory and system, are based on The Forest in Heilongjiang Province, an edited volume by Li Jingwen [25]. Survey data-based spatial distribution maps of the forests in Heilongjiang Province in 1896, 1949, and 1986 are included within this volume at a scale of 1:3,000,000. We scanned these maps using the software ArcGIS [26] in order to define an attribute table as well as a vectored spot, line, and geographic database. Vector diagrams of basic data were then acquired via geographic coordinate correction within the system to quantify the distribution of forests within Heilongjiang Province during the 1900s, 1950s, and 1980s (Figure 2).
We extracted forest cover data for 2010 from a LANDSAT-TM remote sensing (RS) image downloaded from the United States Geological Survey Global Visualization Viewer (http://glovis.usgs.gov/). Among them, 39 images cover Heilongjiang province (paths 113–123; rows 23–30). We subjected this 30 m × 30 m image to geometric and radiation correction, as well as coordinate transformation, image enhancement, and band combination using the software ERDAS 8.7 in order to obtain a final standard false color composite image. This image was then interpreted using an artificial interaction visual method to convert it to a land use vector map and used as our main source of forest coverage data (Figure 2). We then verified the position of 400 randomly selected points using global positioning system (GPS) data based on The Investigation and Technical Regulations on Land Use Status for China (1984). The result of this step shows that our classification is about 90% accurate.
3.2. Heilongjiang Province Land Cover Data during the 1900s
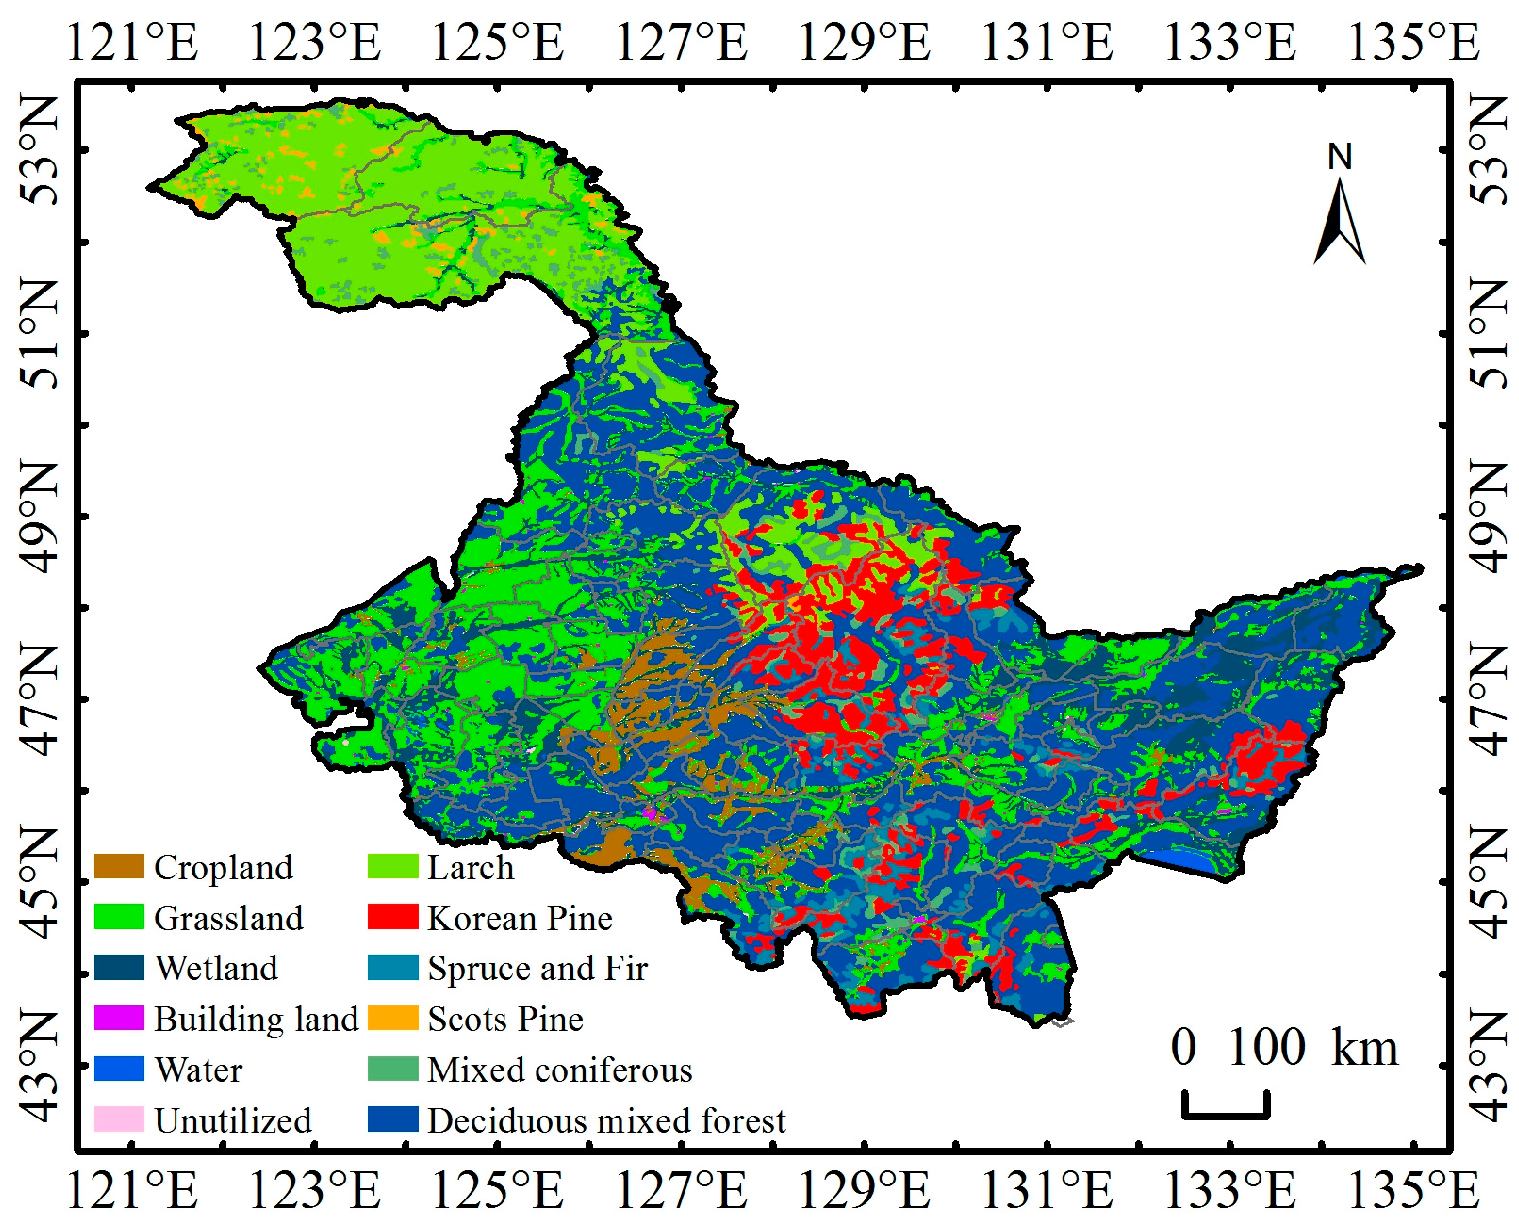
We considered land surface coverage during the 1900s as the base map for this study and also reconstructed land use data for this period. To do this, we extracted information on the area of cultivated land from the report Spatial Distribution Reconstruction of Cultivated Lands in Heilongjiang Province in the Late 1900s [27], and added areas of water surface, wetland, and unutilized via backtracking and filling methods. In particular, The Economic Geography in Northeast China [28] includes a 1959 land use map for this region at a scale of 1:3,000,000; the ten land use types included in this map are primary and secondary forest, dry land, paddy fields, cities and main settlements, salterns, grassland and bare land with stones, sand dunes and sandy beaches, marshlands, and water bodies. We then finalized our land cover data for the 1900s by overlaying the existing categories of water bodies, wetland, grassland, and unutilized land in addition to previously obtained data (i.e., forest and farmland) (Figure 3).
4. Methods
4.1. Experimental Design
The most up-to-date mesoscale weather research and forecasting (WRF) model was developed by the National Centre for Atmospheric Research and partner institutions [29]. Due to recent developments within this field, this model can be utilized for both mesoscale weather forecasting and regional climate simulations [30], and is relatively accurate over long-term integral trails [30,31]. Thus, WRF models have been widely applied in research on terrestrial-atmospheric interactions at the regional scale, including in China [32,33,34,35]. We used an advanced WRF model, ARW-WRF (V3.5), in this study to perform four experiments, one of which was a control test (CTL test) that applied LUCC for the early 1900s. An additional three experiments (NE tests) applied forest coverage data for the 1950s, 1980s, and 2010s, assumed that reductions in coverage were converted to farmland, while holding other land use data consistent with the 1900s. Thus, with the exception of LUCC, the parametric schemes we adopted in each case are exactly the same; the coordinates of the center of the region are 128.080°E and 48.300°N and the grid size is 30 m × 30 m. A total of 102 points were defined along a west-to-east transect, while 74 points were defined north-to-south. We integrated over a time period between 1 January 2006, and 31 December 2010; the lateral data boundary of our FNL (Final Operational Global Analysis) reanalysis was obtained every six hours.
4.2. Extreme Climatic Indicators
The approach adopted in this paper is described in “Expert Team on Climate Changes Detection and Indices”, which is recommended by the World Meteorological Organization (WMO), the Global Climate Research Program (WCRR), the Climate Change and Predictability Program (CLIVAR) and the Joint Technology for Oceanography and Marine Meteorology (JCOMM). Additionally, it is a common standard for climate change research and is widely used by researchers in China and worldwide in the study of extreme weather events [36,37,38].
We utilized 12 representative extreme climatic indexes in this study, calculated based on daily maximum and minimum temperatures. Thus, we applied three extreme temperature indicators: (1) A relative index based on a floating threshold that includes cold days (nights) and warm days (nights); (2) An absolute index based on a fixed threshold value that includes tropical nights, summer days, ice days and frost days; (3) An extreme index based on the maximum and minimum daily temperature for a year. We then applied the percentile threshold method to calculate a relative index. The meteorological elements for a given day measured at a station between 1961 and 2010 were placed in ascending order and the 90th and 10th percentiles were selected as threshold values for an extreme climatic element. Therefore, if the maximum or minimum temperature of a given day was higher than the 90th percentile value, this was defined as either a warm day or warn night event, but if the maximum or minimum temperature of a given day was lower than the 10th percentile value, this was defined as either a cold day or cold night event (Table 1). We then used the software RClimDex to calculate these data on a yearly basis based on the results of our WRF simulations.
4.3. Trend Analysis
In this paper, the trend of extreme climate index was analyzed by linear estimation method. The linear regression equation of variable Y and corresponding time x is established [39] as:
In this expression, a represents tendency rate, and b represents intercept.
5. Results and Analysis
5.1. Spatiotemporal Analysis of Changes in Forest Cover over the Last 100 Years
The results of this study show that the forested area of Heilongjiang Province has declined by 80,890.166 km2, 28.182%, over the last 100 years. This trend is most apparent in the western and southwestern regions of the province as well as on the northeastern plains. Similarly, between the 1900s and 1950s, the forested area of the province declined from 287,024.571 km2 to 221,840.920 km2, a decrease of 65,183.650 km2, or 22.710% (Figure 4a). Throughout this early period, the eastern Sanjiang Plain and the southwestern Songnen Plain were most seriously affected; forests in the southwestern and northeastern parts of the province almost completely disappeared. In contrast, between the 1950s and 1980s, this decreasing trend slowed down to a reduction of 45,718.269 km2, 20.609% (Figure 4b), concentrated within the Greater Hinggan region in the northwest of the province as well as Yichun city and Xunke county in the north. A decrease in forested area was also seen in central and southeastern parts of the province, albeit in a more spatially scattered manner. Data shows an increase in forested area over the next 30-year period, between the 1980s and 2010s, of 206,134.405 km2, or 17.040% (Figure 4c); northern and eastern regions benefitted most during this time, especially Yichun city and Heihe city. Minor forested area increases were also seen within the cities of Shuangyashan, Muling, Shangzhi, Wuchang, Ning’an, and Linkou.
From the 1900s to the 2010s, the forest area of Heilongjiang province was mainly converted to cropland, grassland, wetland and urban built-up land, accounting for 66.721%, 17.851%, 13.000%, and 2.428%, respectively, of the total converted area. In the increased area of cultivated land, the proportion of forest conversion to cropland is the largest, accounting for about 43.6%, which was mainly found in the southwest and east of the province (Figure 4d).
5.2. The Effect of Forested Area Changes on Trends in Extreme Temperature over the Last 100 Years
5.2.1. Extreme High Temperature Indexes
Simulation results show that the extreme high temperature index variably increased across the century between 1900s and 2010s showing an opposite trend with respect to that of forested area within Heilongjiang Province between 1900s and 2010s. The correlation coefficients of the number of warm days, warm nights, tropical nights and summer days versus forested area change were −0.885, −0.990, −1.000, and −0.985, respectively (i.e., given probabilities of 0.050 and 0.010, critical correlation coefficients are 0.811 and 0.917). These results reveal significant, or extremely significant, correlations and suggest that changes in forested area exert a huge influence on annual extreme temperature-related events (i.e., the number of warm nights has the highest correlation index values). The results showed that when the forest area decreased, the number of warm days, warm nights, tropical nights and summer days increased; when the forest area increased, the number of warm days, warm nights, tropical nights, summer days decreased. The change in forested area between 1900s and 2010s is associated with an increasing number of warm days, warm nights, tropical nights, and summer days, characterized by linear trends of 0.073 days(d)/ten years (10 a), 0.357 d/10 a, 0.378 d/10 a, and 0.963 d/10 a, respectively. The number of summer days increased over the largest range.
5.2.2. Extreme Low Temperature Indexes
Results show that changes in extreme low temperature indexes over the study period were different from those of forested area. Thus, correlation coefficients for the number of cold days, cold nights, frost days, and ice days versus forested area changes were −0.885, −0.988, −0.955, and −0.859, respectively (i.e., given probabilities of 0.050 and 0.010, critical correlation coefficients are 0.811 and 0.917). These results reveal significant, or extremely significant, negative correlations and indicate that changes in the number of cold days, cold nights, frost days, and ice days, which become increasingly frequent and are highly correlated with changes in forested area (i.e., the number of cold days exhibits the highest correlation index). Thus, a decrease in forested area leads to an increase in the number of cold days, cold nights, frost days, and ice days, and vice versa (although our data for the number of ice days in 1980s are outliers). Changes in forested area between 1900s and 2010s led to an increase in the number of cold days, cold nights, frost days, and ice days, with linear trends of 0.524 d/10 a, 0.378 d/10 a, 0.377 d/10 a, and 1.711 d/10 a, respectively (of these, the number of ice days had the clearest correlation) (Figure 5).
5.2.3. Daily Extreme Temperature Indexes
Simulated data shows that changes in forested area are positively correlated with trends in the maximum value of daily minimum temperature, but are inconsistent with other indexes. This phenomenon illustrates the fact that forested area changes are associated with the maximum value of daily minimum temperature and are significantly negatively correlated with area (i.e., coefficient of −0.815, probability of 0.050). In other words, when the forested area decreases, the maximum value of daily minimum temperature increases, and vice versa. This means that changes in forested area influence daily temperatures, in particular, changes in the maximum value of daily minimum temperature (increasing trend: 4.593 d/10 a) (Figure 6).
5.3. Forest Area Changes and Spatial Changes in Extreme Temperature Indexes over the Last 100 Years
A high level of agreement is seen between forested area and the spatial changes highlighted by most of the extreme temperature indexes used here, including the number of warm days, tropical nights, summer days, cold days, cold nights, and ice days, as well as maximum value of daily minimum temperature, minimum value of daily maximum temperature, and minimum value of daily minimum temperature (Figure 7). Exceptions to this trend include the fact that no significant correlations were found between the spatial distributions of the number of summer days and frost days, even though significant and extremely significant correlations were observed for other indexes. These results indicate that spatial changes in extreme temperature indexes do correspond with changes in forested area; thus, from a spatial perspective, a reduction in forested area leads to an increase in the number of extreme high and low temperate index days. At the same time, a clear spatial correlation also exists between daily extreme temperature indexes and forested area changes, demonstrating that a reduction in the latter may lead to increases in the maximum value of daily maximum temperature and maximum value of daily minimum temperature, as well as a decrease in the minimum value of daily maximum temperature and minimum value of daily minimum temperature, and vice versa (Table 2).
6. Discussion
(1) We analyzed the characteristics of extreme temperature change in Heilongjiang Province; the data showed a significant change in extreme temperature indexes (Figure 8). Although the number of ice days and maximum value of daily maximum temperature do not exhibit an obvious change, all our other indexes do exhibit significant trends in their variation. The indexes that address high temperature events, such as the numbers of warm days, warm nights, tropical nights, and summer days, all significantly increase with forest cover (p < 0.010), at annual rates of 0.177 d/10 a, 0.355 d/10 a, 1.303 d/10 a, and 2.733 d/10 a, respectively. At the same time, other indexes that address low temperature events, such as the numbers of cold days, cold nights, and frost days all conform to the opposite trend (p < 0.050), at rates of −1.679 d/10 a, −4.257 d/10 a, and −3.673 d/10 a, respectively. An increasing trend was also seen in the minimum value of daily maximum temperature, the maximum value of daily minimum temperature and the minimum value of daily minimum temperature. Overall, the most obvious increasing trend in our data was seen in the number of warm nights; between 1961 and 2010, a minimum of 6.163 d was recorded for a ten-year period, while the maximum was 32.295 d, a gap of 26.132 d. The most significant decreasing trend was seen in the number of cold nights over our study period; the maximum observed was 44.778 d within a ten year period, while the minimum was 4.269 d, a gap of 40.509 d. In other words, our observed data indicates that the number of extreme high temperature events as well as the maximum and minimum value of daily temperatures have increased, while the number of extreme low temperature events have decreased.
Our simulation results for changes in the forested area of Heilongjiang Province over the last 100 years demonstrate that a reduction in this cover is likely responsible for an increase in the number of extreme high and low temperature events; this means that changes in forested area have a positive effect on the number of extreme high temperature events as well as a negative effect on the number of extreme low temperature events. Changes in forested area also increase the maximum value of daily minimum temperature, but have no effect on other daily extreme indexes.
(2) As discussed, previous studies in this area have emphasized the complex, but important, influence of LUCC on climate [10,11]. However, obvious differences are apparent between regions; the results of some studies are similar to the conclusions of this paper with respect to the impact of forest conversion to cropland on extreme temperature events. Zhao and Pitman [23] noted, for example, that areas in Europe that have been transformed from deciduous forest to farmland are also characterized by increases in the maximum value of daily extreme temperature. In 2005, Zhao and Pitman [40] came to this conclusion again. Also, Suh and Lee [22] noted an increased probability of high surface temperatures in central and northern China subsequent to the transformation from deciduous broad-leaved forest to mixed farmland and irrigation crops. Voldoire and Royer [41] noted an increased surface temperature and the frequency of extreme temperature in the Amazon region due to the transformation from forest to other land. We therefore conclude that the conversion of forest to farmland in Heilongjiang Province has led to an increase in extreme high temperature indexes and maximum value of daily extreme temperature, as well as a decrease in extreme low temperature indexes. Our results are therefore in accordance with previous research.
(3) We have studied and analyzed the effects and physical mechanisms of converting forested land to farmland in Heilongjiang Province over the 100 years. The results of this study show that the overall surface albedo caused by this transformation has increased at an annual average of 0.007, even though seasonal surface albedo only decreases during the summer. The biggest range of increase was seen during the winter (0.017), followed by the spring (0.013), and autumn (0.001); overall, a decrease in net surface radiation flux is also revealed by our WRF simulation results, an annual average reduction of 0.906 W/m2. Surface net radiation fluxes in the spring, autumn, and winter all decline overall, most markedly during the spring (2.859 W/m2), followed by the winter (1.823 W/m2), and autumn (0.053 W/m2), while during the summer this flux increases by 1.112 W/m2 (Table 3). We conclude that albedo decreases in the summer while the net radiation flux increases because of the conversion of forests to farmland, while in other seasons albedo decreases in concert with net radiation flux. Thus, the overall basic mechanism revealed by this study is that extreme high temperature indexes increase while extreme low temperature indexes decrease over the course of a given year (Figure 9 and Figure 10). Nevertheless, it remains problematic to explain variations in daily extreme temperature indexes based simply on changes in seasonal physical parameters.
(4) As recorded in the Translation of Historical Data of Northeast Forestry during Manchuria [42], the forest area of Heilongjiang Province in 1917 was 320 thousand km2. Records in the twelfth volume of Heilongjiang Province [43], show that the forest area of Heilongjiang Province in 1948 was 240 thousand km2. The 8th National Forest Inventory (2009) estimated that the forest area of Heilongjiang was 196 thousand km2. In our study, we vectorize the graphs attached to the book entitled The Forest in Heilongjiang Province [25]. The results showed that the forest area of Heilongjiang province was 287 thousand km2 in the 1900s, 222 thousand km2 in the 1950s, and the unsupervised interpretation of LANDSAT-TM remote sensing (RS) images in 2009 showed that the forest area of Heilongjiang province was 206 thousand km2 in 2010. Therefore, the results are basically consistent with the findings of previous studies. In the historical records, the forest area was mainly acquired by measurement, while this study is based on estimation from map interpretation and image interpretation. The two methods have certain errors, so, to some extent, the results are different.
7. Conclusions
The results of this study show that the forested area of Heilongjiang Province has declined overall by 80,890.166 km2, or 28.182%, mainly in the western and southwestern regions as well as on the northeastern plains. This change in forested area has significantly influenced extreme temperature indexes, with changes taking place in opposite directions. An overall decrease in forested area explains concomitant increases in extreme high and low temperature indexes, and vice versa. Thus, between the 1900s and 2010s, correlated with a decrease in forested area, the numbers of warm days, warm nights, tropical nights, summer days, cold days, cold nights, frost days, and ice days, as well as the maximum value of daily minimum temperature increased. The data reveals a significant spatial correlation between forested area change and most extreme temperature indexes, as well as clear spatial agreement. The conversion of forest to farmland causes a reduction in surface albedo as well as an increase in net radiant flux in summer, both of which are likely major components of increases in extreme high temperature indexes. At the same time, surface albedo in other seasons increases as the net radiant flux decreases.
Acknowledgments
This research is funded by the National Natural Science Foundation of China (No. 41771067).
Author Contributions
Lijuan Zhang designed the study and wrote the manuscript. Hongwen Zhang used the WRF model for simulation calculations. Tao Pan analyzed the results of the simulation. The remaining authors contributed to improving the manuscript by providing valuable input.
Conflicts of Interest
The authors have no conflicts of interest to declare.
References
- Intergovernmental Panel on Climate Change (IPCC). Climate Change 2013: The Physical Science Basis: Contribution of Working Group I to the Fifth Assessment Report of the Intergovernmental Panel on Climate Change; Cambridge University Press: Cambridge, UK; New York, NY, USA, 2013. [Google Scholar]
- Pielke, R.A. Land use and climate change. Science 2005, 310, 1625–1626. [Google Scholar] [CrossRef]
- Hua, W.J.; Chen, H.S.; Li, X. Effects of future land use change on the regional climate in China. Sci. China Earth Sci. 2015, 58, 1840–1848. [Google Scholar] [CrossRef]
- Li, J.H.; Chen, H.S.; Hua, W.J. Sensitivity experiments on impacts of large-scale land use change on surface energy balance, hydrological cycle and regional climate over East Asia. Trans. Atmos. Sci. 2013, 36, 184–191. [Google Scholar]
- Kalnay, E.; Cai, M. Impact of urbanization and land-use change on climate. Nature 2003, 423, 528–531. [Google Scholar] [CrossRef]
- Zhang, J.Y.; Dong, W.J.; Wu, L.Y.; Wei, J.F.; Chen, P.Y.; Lee, D.K. Impact of land use changes on surface warming in China. Adv. Atmos. Sci. 2005, 22, 343–348. [Google Scholar]
- Nathalie, N.D.; Boisier, J.P.; Pitman, A.; Bonan, G.B.; Brovkin, V.; Cruz, F.; Delire, C.; Gayler, V.; Van den hurk, B.J.J.M.; Lawrence, P.J.; et al. Determining robust impacts of land use induced land-cover changes on surface climate over North America and Eurasia; Results from the first set of LUCID experiments. J. Clim. 2012, 25, 3261–3281. [Google Scholar]
- Fu, C.B. Potential impacts of human-induced land cover change on East Asia monsoon. Glob. Planet. Chang. 2003, 37, 219–229. [Google Scholar] [CrossRef]
- Takata, K.; Saito, K.; Yasunari, T. Changes in the Asian monsoon climate during 1700–1850 induced by preindustrial cultivation. Proc. Natl. Acad. Sci. USA 2009, 106, 9586–9589. [Google Scholar] [PubMed]
- Pitman, A.J.; Avila, F.B.; Abramowitz, G.; Wang, Y.P.; Phipps, S.J.; Nathalie, N.D. Importance of background climate in determining impact of land-cover change on regional climate. Nat. Clim. Chang. 2011, 1, 472–475. [Google Scholar] [CrossRef]
- Hua, W.J.; Chen, H.S. Recognition of climatic effects of land use/land cover change under global warming. Chin. Sci. Bull. 2013, 58, 3852–3858. [Google Scholar]
- Hua, W.J.; Chen, H.S. Impacts of regional-scale land use/ land cover change on diurnal temperature range. Adv. Clim. Chang. Res. 2013, 4, 166–172. [Google Scholar]
- Goswami, B.N.; Venugopal, V.; Sengupta, D.; Madhusoodanan, M.S.; Xavier, P.K. Increasing trend of extreme Rain Events over India in a Warming Environment. Science 2006, 314, 1442–1444. [Google Scholar] [CrossRef] [PubMed]
- Mitchell, J.F.B.; Lowe, J.; Wood, R.A.; Vellinga, M. Extreme events due to human-induced climate change. Philos. Trans. R. Soc. A 2006, 364, 2117–2133. [Google Scholar] [CrossRef] [PubMed]
- Gastineau, G.; Soden, B.J. Model projected changes of extreme wind events in response to global warming. Geophys. Res. Lett. 2009, 36. [Google Scholar] [CrossRef]
- Rahmstorf, S.; Coumou, D. Increase of extreme events in a warming world. Proc. Natl. Acad. Sci. USA 2011, 44, 17905–17909. [Google Scholar] [CrossRef] [PubMed]
- Seung, K.M.; Zhang, X.B.; Francis, W.Z.; Gabriele, C.H. Human contribution to more-intense precipitation extremes. Nature 2011, 479, 378–381. [Google Scholar]
- Charney, J.G. Dynamics of deserts and drought in the Sahel. Q. J. R. Meteorol. Soc. 1975, 101, 193–202. [Google Scholar] [CrossRef]
- Zeng, N.; Dickinson, R.E.; Zeng, X.B. Climatic impact of amazon deforestation-A mechanistic model study. J. Clim. 1996, 9, 859–883. [Google Scholar] [CrossRef]
- Dickinson, R.E.; Henderson, A. Modeling tropical deforestation: A study of GCM land-surface parameterizations. Q. J. R. Meteorol. Soc. 1988, 114, 439–462. [Google Scholar] [CrossRef]
- Diffenbaugh, N.S. Sensitivity of extreme climate events to CO2-induced biophysical atmosphere-vegetation feedbacks in the western United States. Geophys. Res. Lett. 2005, 32. [Google Scholar] [CrossRef]
- Suh, M.S.; Lee, D.K. Impacts of land use/cover changes on surface climate over east Asia for extreme climate cases using Reg CM2. J. Geophys. Res. 2004, 109. [Google Scholar] [CrossRef]
- Zhao, M.; Pitman, A.J. The impacts of land cover change and increasing carbon dioxide on the extreme and frequency of maximum temperature and convective precipitation. Geophys. Res. Lett. 2002, 29, 1–4. [Google Scholar] [CrossRef]
- Gao, Y.G. Synthetical intensity characteristica of interdecadal extreme air temperature and precipitation events in Heilongjiang Province from 1967 to 2007. Resour. Sci. 2012, 34, 2170–2180. [Google Scholar]
- Li, J.W. The Forest in Heilongjiang Province; Northeast Forestry University Press: Harbin, China, 1993; p. 515. ISBN 9787810083294. [Google Scholar]
- Environmental Systems Research Institute (ESRI). ArcGIS Desktop: Release 10; Environmental Systems Research Institute: Redlands, CA, USA, 2011. [Google Scholar]
- Zhang, L.J.; Jiang, L.Q.; Zhang, X.Z. Spatial explicit reconstruction of cropland for Heilongjiang province of Northeast China in 1900–1910. J. Geogr. Sci. 2015, 25, 292–602. [Google Scholar] [CrossRef]
- Sun, J.Z. Economic Geography of Northeast China; Science Press: Beijing, China, 1959; p. 219. ISBN 7532129845. [Google Scholar]
- Skamarock, W.C.; Klemp, J.B.; Dudhia, J.; Gill, D.O.; Barker, D.M.; Duda, M.G.; Huang, X.Y.; Wang, W.; Powers, J.G. A Description of the Advanced Research WRF Version 3; NCAR Technical Note NCAR/TN-475+STR; National Center for Atmospheric Research: Boulder, CO, USA, 2008. [Google Scholar]
- Leung, L.R.; Kuo, Y.H.; Tribbia, J. Research needs and directions of regional climate modeling using WRF and CCSM. Am. Meteorol. Soc. 2006, 87, 1747–1751. [Google Scholar] [CrossRef]
- Leung, L.R.; Qian, Y. Atmospheric rivers induced heavy precipitation and flooding in the western U.S. simulated by the WRF regional climate model. Geophys. Res. Lett. 2009, 36, 151–157. [Google Scholar]
- Zhang, J.Y.; Wu, L.Y.; Dong, W.J. Land-atmosphere coupling and summer climate variability over East Asia. J. Geophys. Res. 2011, 116, 420–424. [Google Scholar] [CrossRef]
- Zhang, X.Z.; Tang, Q.H.; Zheng, J.Y.; Ge, Q.S. Warming/cooling effects of cropland greenness changes during 1982–2006 in the North China Plain. Environ. Res. Lett. 2013, 8. [Google Scholar] [CrossRef]
- Ge, Q.S.; Zhang, X.Z.; Zheng, J.Y. Simulated effects of vegetation increase/decrease on temperature changes from 1982 to 2000 across the Eastern China. Int. J. Climatol. 2014, 34, 187–196. [Google Scholar] [CrossRef]
- Zhang, X.Z.; Liu, J.Y.; Xiong, Z.; Zhang, H.W. Simulated effects of agricultural development on surface air temperature over Central and Eastern China in the late 20th century. Acta Geogr. Sin. 2015, 70, 1423–1433. [Google Scholar]
- Vincent, L.A.; Peterson, T.C.; Barros, V.C.; Marino, M.B.; Rusticucci, M.; Garrasco, G.; Ramirez, E.; Alves, L.M.; Ambrizzi, T.; Berlato, M.A.; et al. Observed trends in indices of daily temperature extremes in South America 1960–2000. J. Clim. 2005, 18, 5011–5023. [Google Scholar] [CrossRef]
- Zhang, L.W.; Song, C.Y.; Yan, J.P. Spatio-temporal trends of annual extreme temperature in Northern and Southern Qinling mountains. Sci. Geogr. Sin. 2011, 31, 1007–1011. [Google Scholar]
- Wang, Q.; Zhang, M.J.; Wang, S.J. Extreme temperature events in Yangtze River Basin during 1962–2011. Acta Geogr. Sin. 2013, 5, 611–625. [Google Scholar]
- Sheng, Z. Probability Theory and Mathematical Statistics; Higher Education Press: Hangzhou, China, 2012; p. 244. ISBN 978-7-04-023896-9. [Google Scholar]
- Zhao, M.; Pitman, A.J. The relative impact of regional scale land cover change and increasing CO2 over China. Adv. Atmos. Sci. 2005, 22, 58–68. [Google Scholar] [CrossRef]
- Voldoire, A.; Royer, J.F. Tropical deforestation and climate variability. Clim. Dyn. 2004, 22, 857–874. [Google Scholar] [CrossRef]
- Forestry Office of Jilin Forestry Bureau. Translation of Historical Data of Northeast Forestry during Manchuria; Jilin People’s Press: Changchun, China, 1986; p. 377. ISBN 978-7-80106-775-3.
- Ding, F.; Wang, H.Y.; Zhen, W. Heilongjiang Province; Heilongjiang People’s Press: Harbin, China, 1993; p. 499. ISBN 7-207-02546-7. [Google Scholar]
Figure 1.
Maps to show the location of Heilongjiang Province within northeastern China (a) and its administrative subdivisions (b).
Figure 1.
Maps to show the location of Heilongjiang Province within northeastern China (a) and its administrative subdivisions (b).
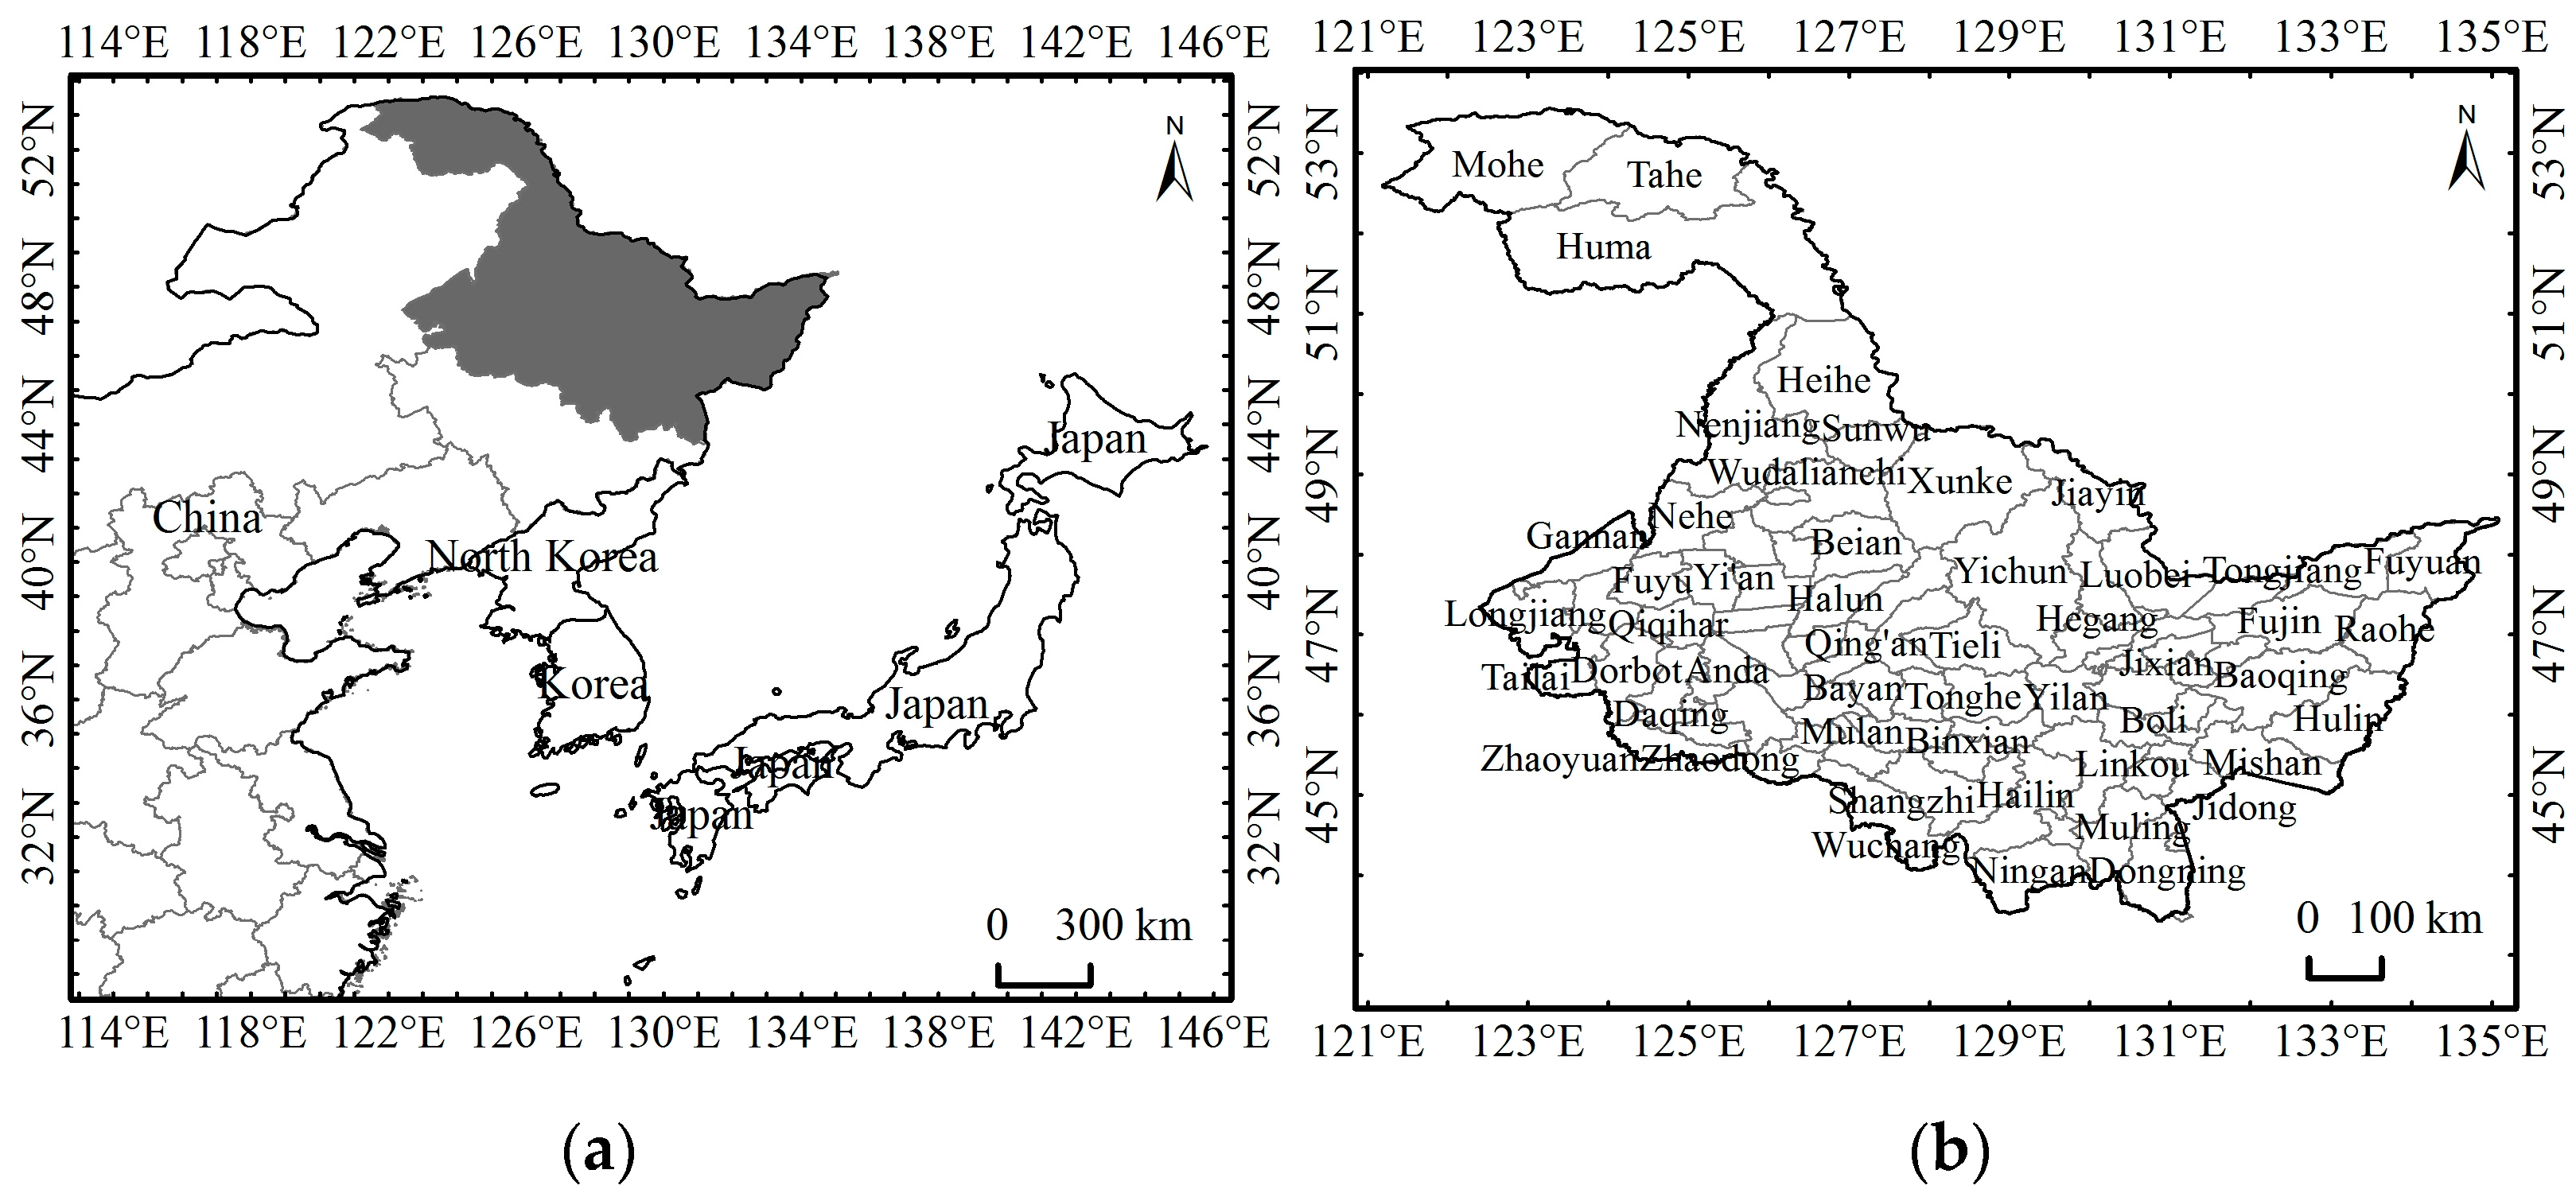
Figure 2.
Maps to show the spatial distribution of forests within Heilongjiang Province between the 1900s and 2010s. (a) 1900s; (b) 1950s; (c) 1980s; (d) 2010s.
Figure 2.
Maps to show the spatial distribution of forests within Heilongjiang Province between the 1900s and 2010s. (a) 1900s; (b) 1950s; (c) 1980s; (d) 2010s.
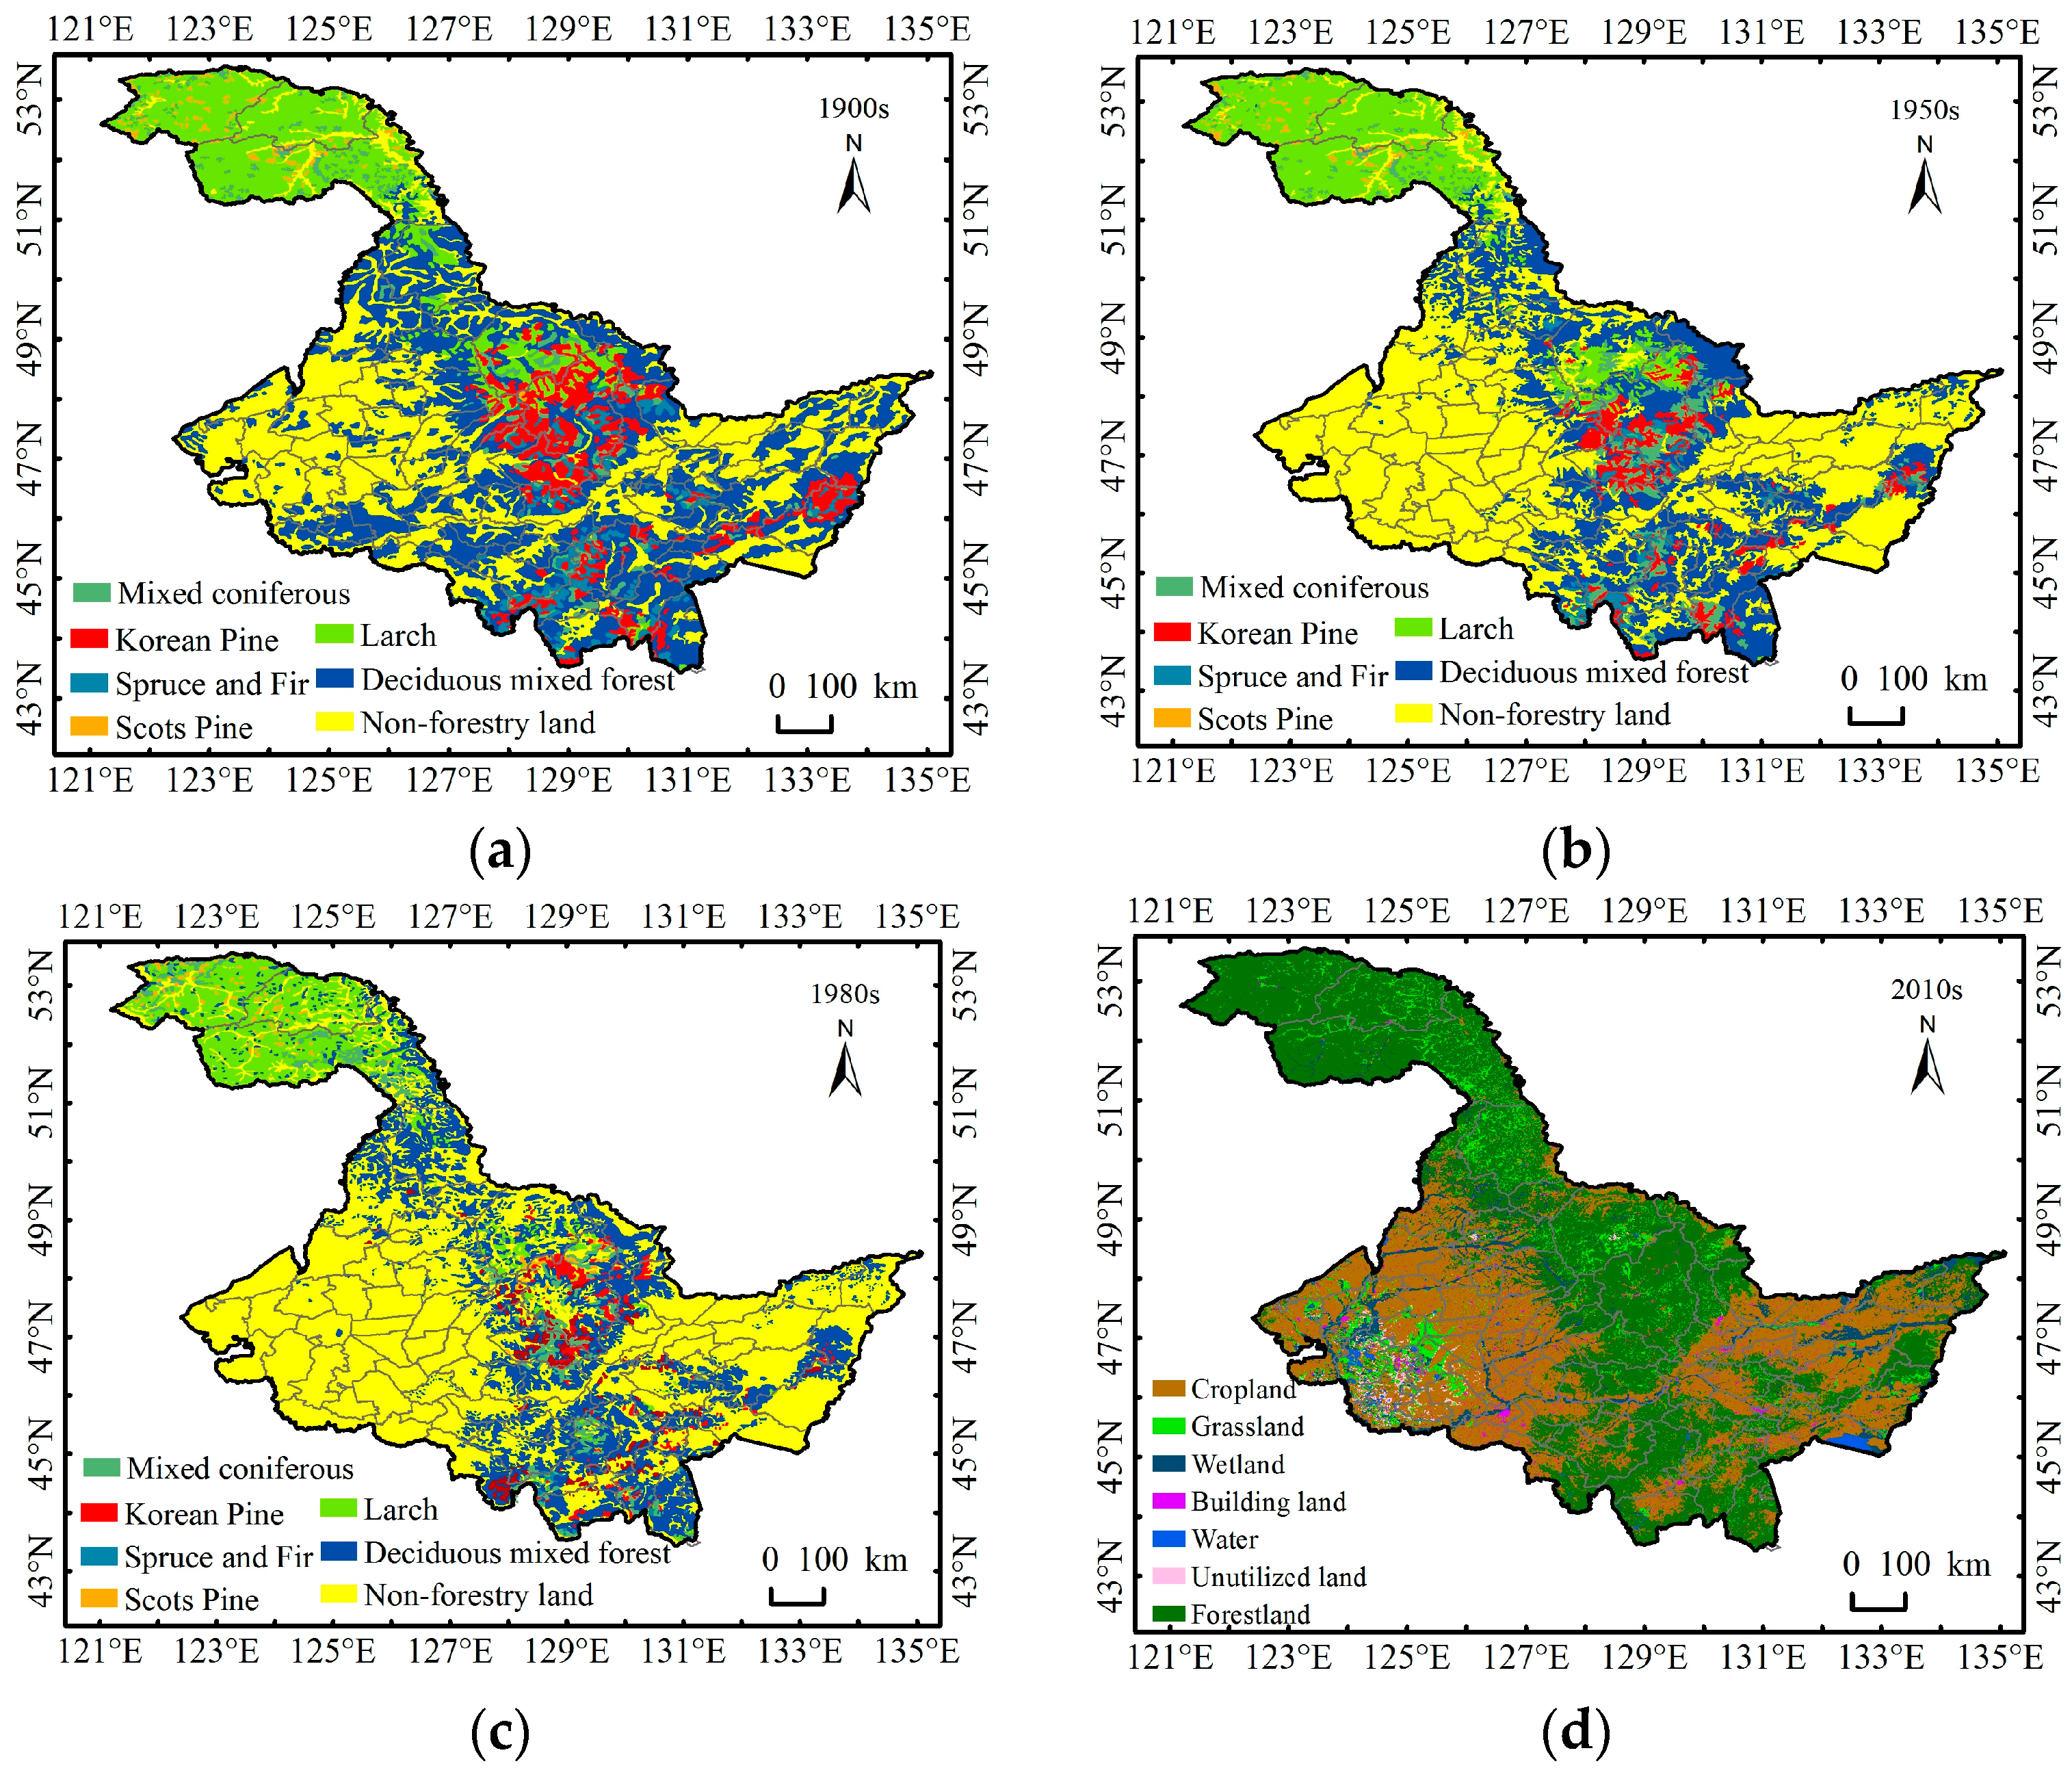
Figure 3.
Map to show the spatial distribution of land use in Heilongjiang Province during the 1900s.
Figure 3.
Map to show the spatial distribution of land use in Heilongjiang Province during the 1900s.

Figure 4.
Maps showing the spatial distribution of forest change in Heilongjiang Province between (a) the 1900s and the 1950s; (b) the 1950s and the 1980s; (c) the 1980s and the 2010s; and (d) the 1900s and the 2010s.
Figure 4.
Maps showing the spatial distribution of forest change in Heilongjiang Province between (a) the 1900s and the 1950s; (b) the 1950s and the 1980s; (c) the 1980s and the 2010s; and (d) the 1900s and the 2010s.
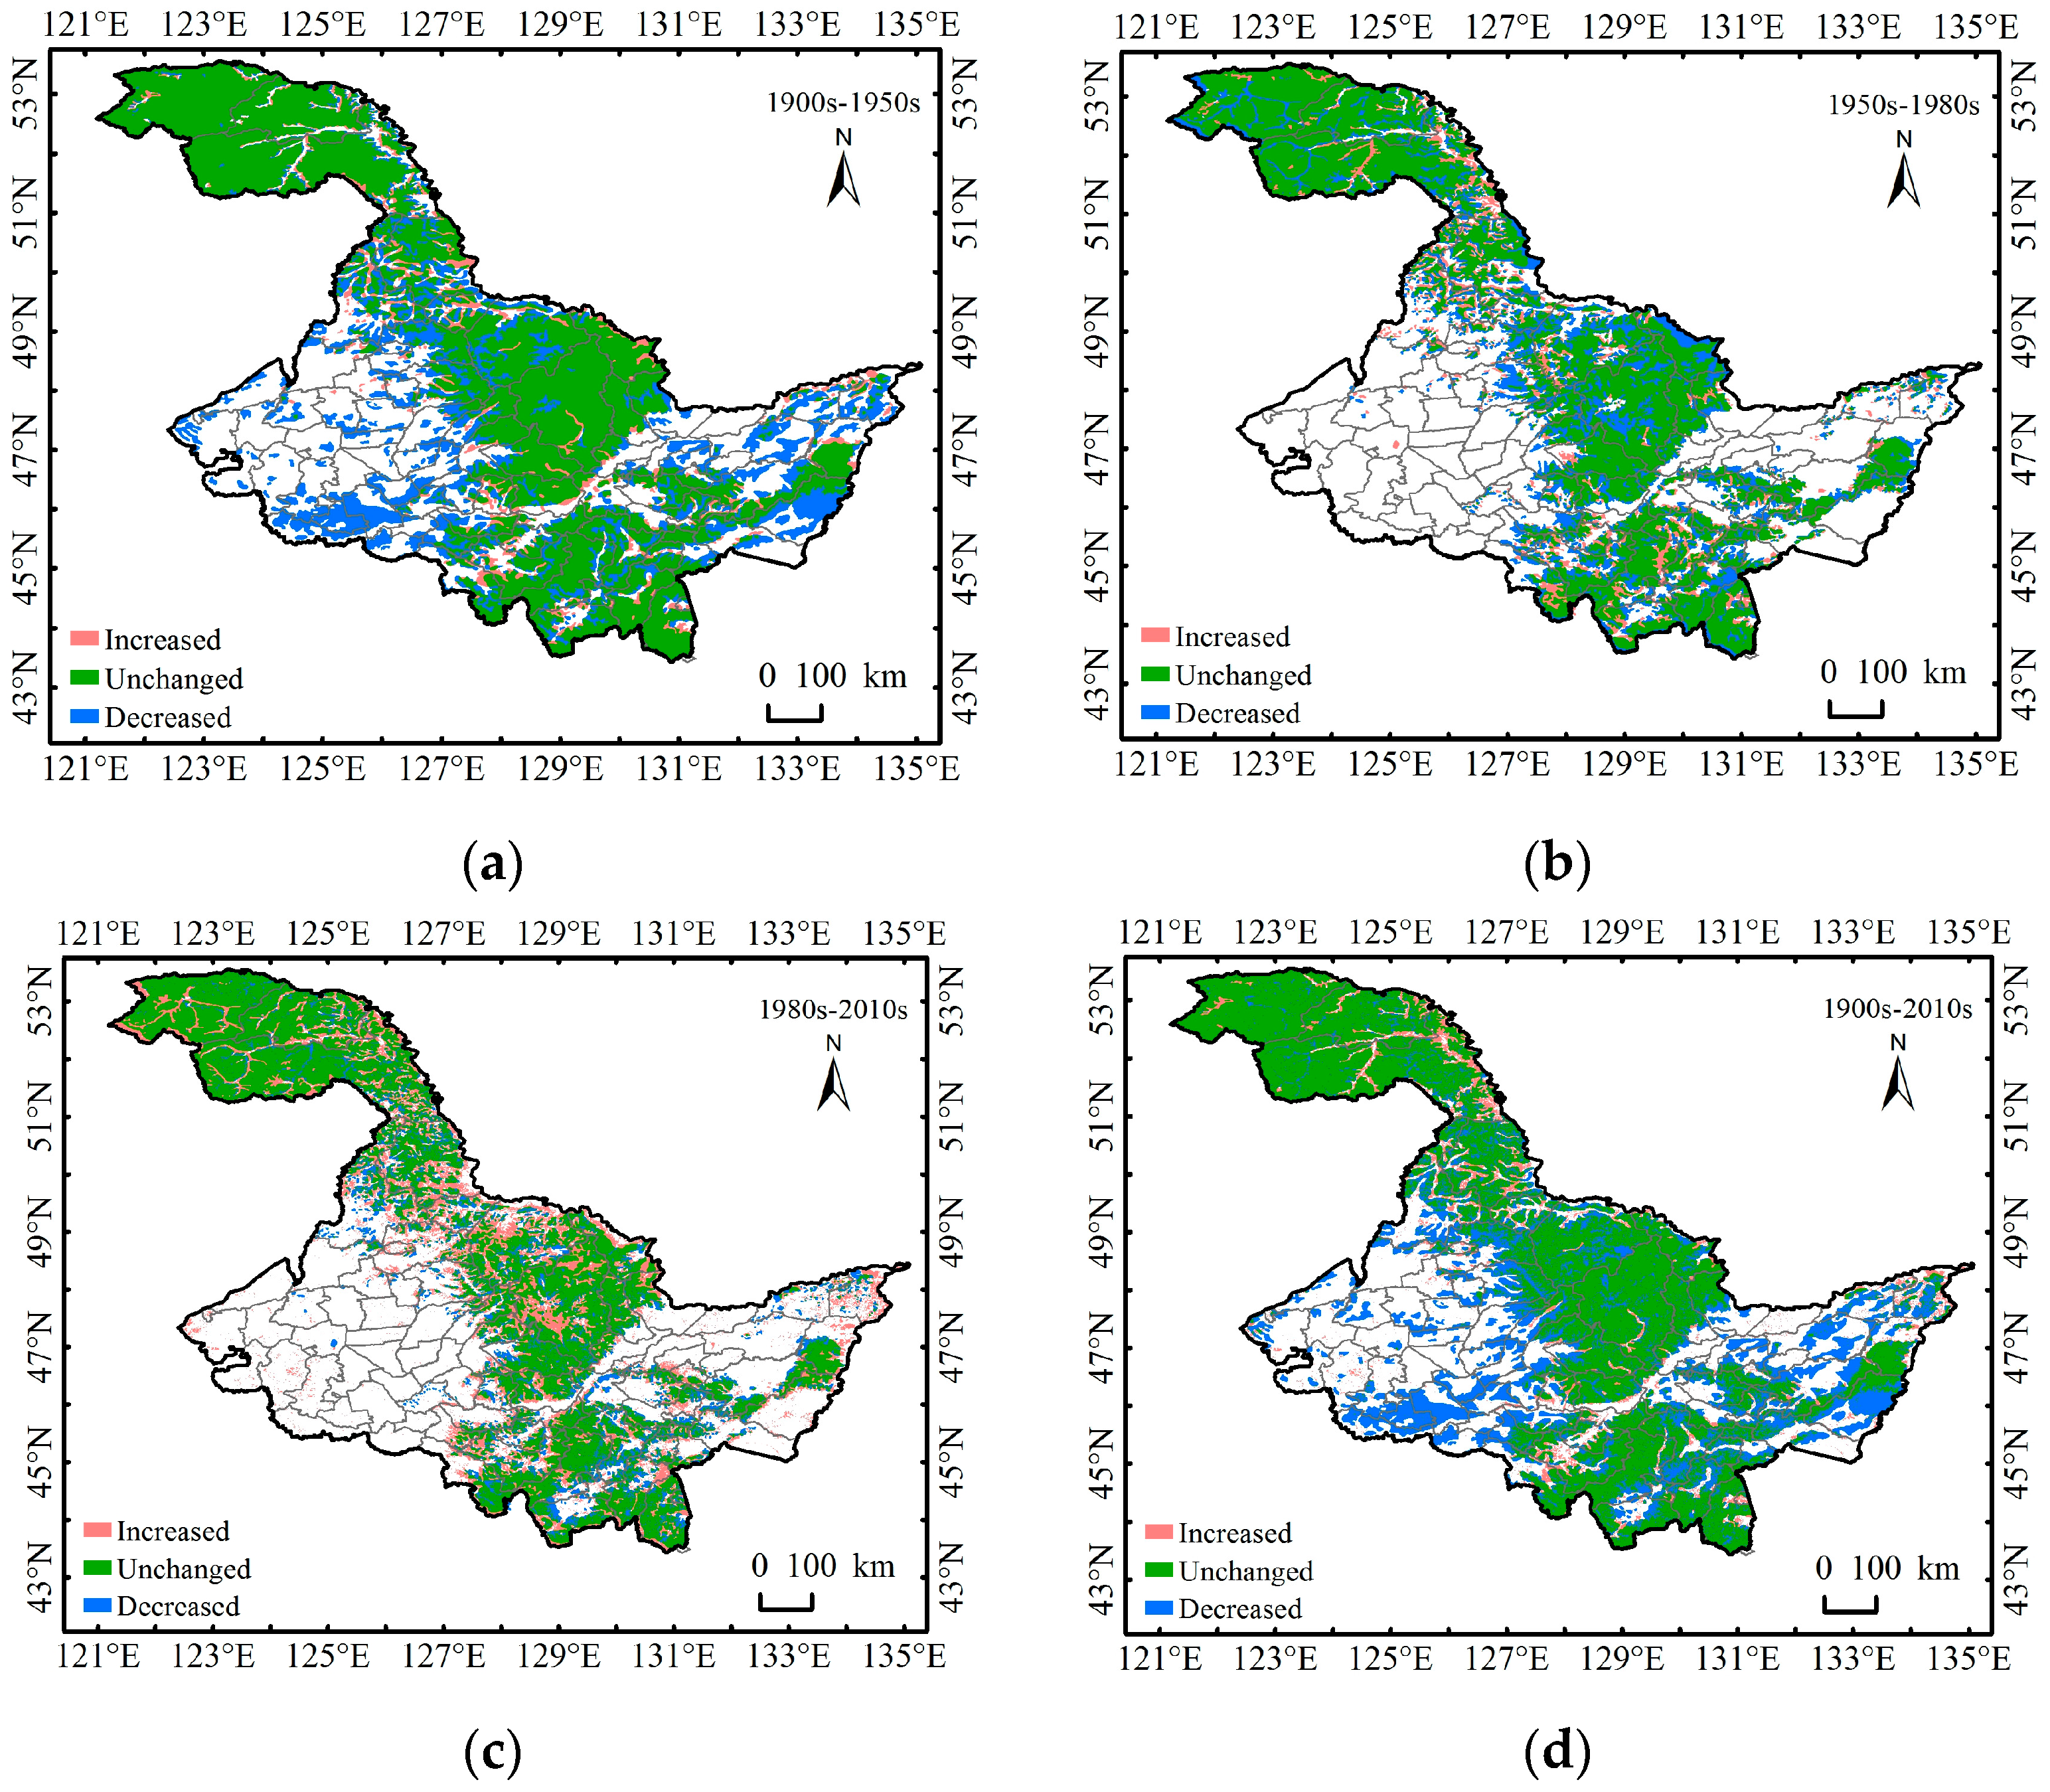
Figure 5.
Trends in absolute indexes of annual extreme temperature events in Heilongjiang Province between the 1900s and 2010s. (a) Cold days; (b) Cold nights; (c) Frost days; (d) Ice days.
Figure 5.
Trends in absolute indexes of annual extreme temperature events in Heilongjiang Province between the 1900s and 2010s. (a) Cold days; (b) Cold nights; (c) Frost days; (d) Ice days.

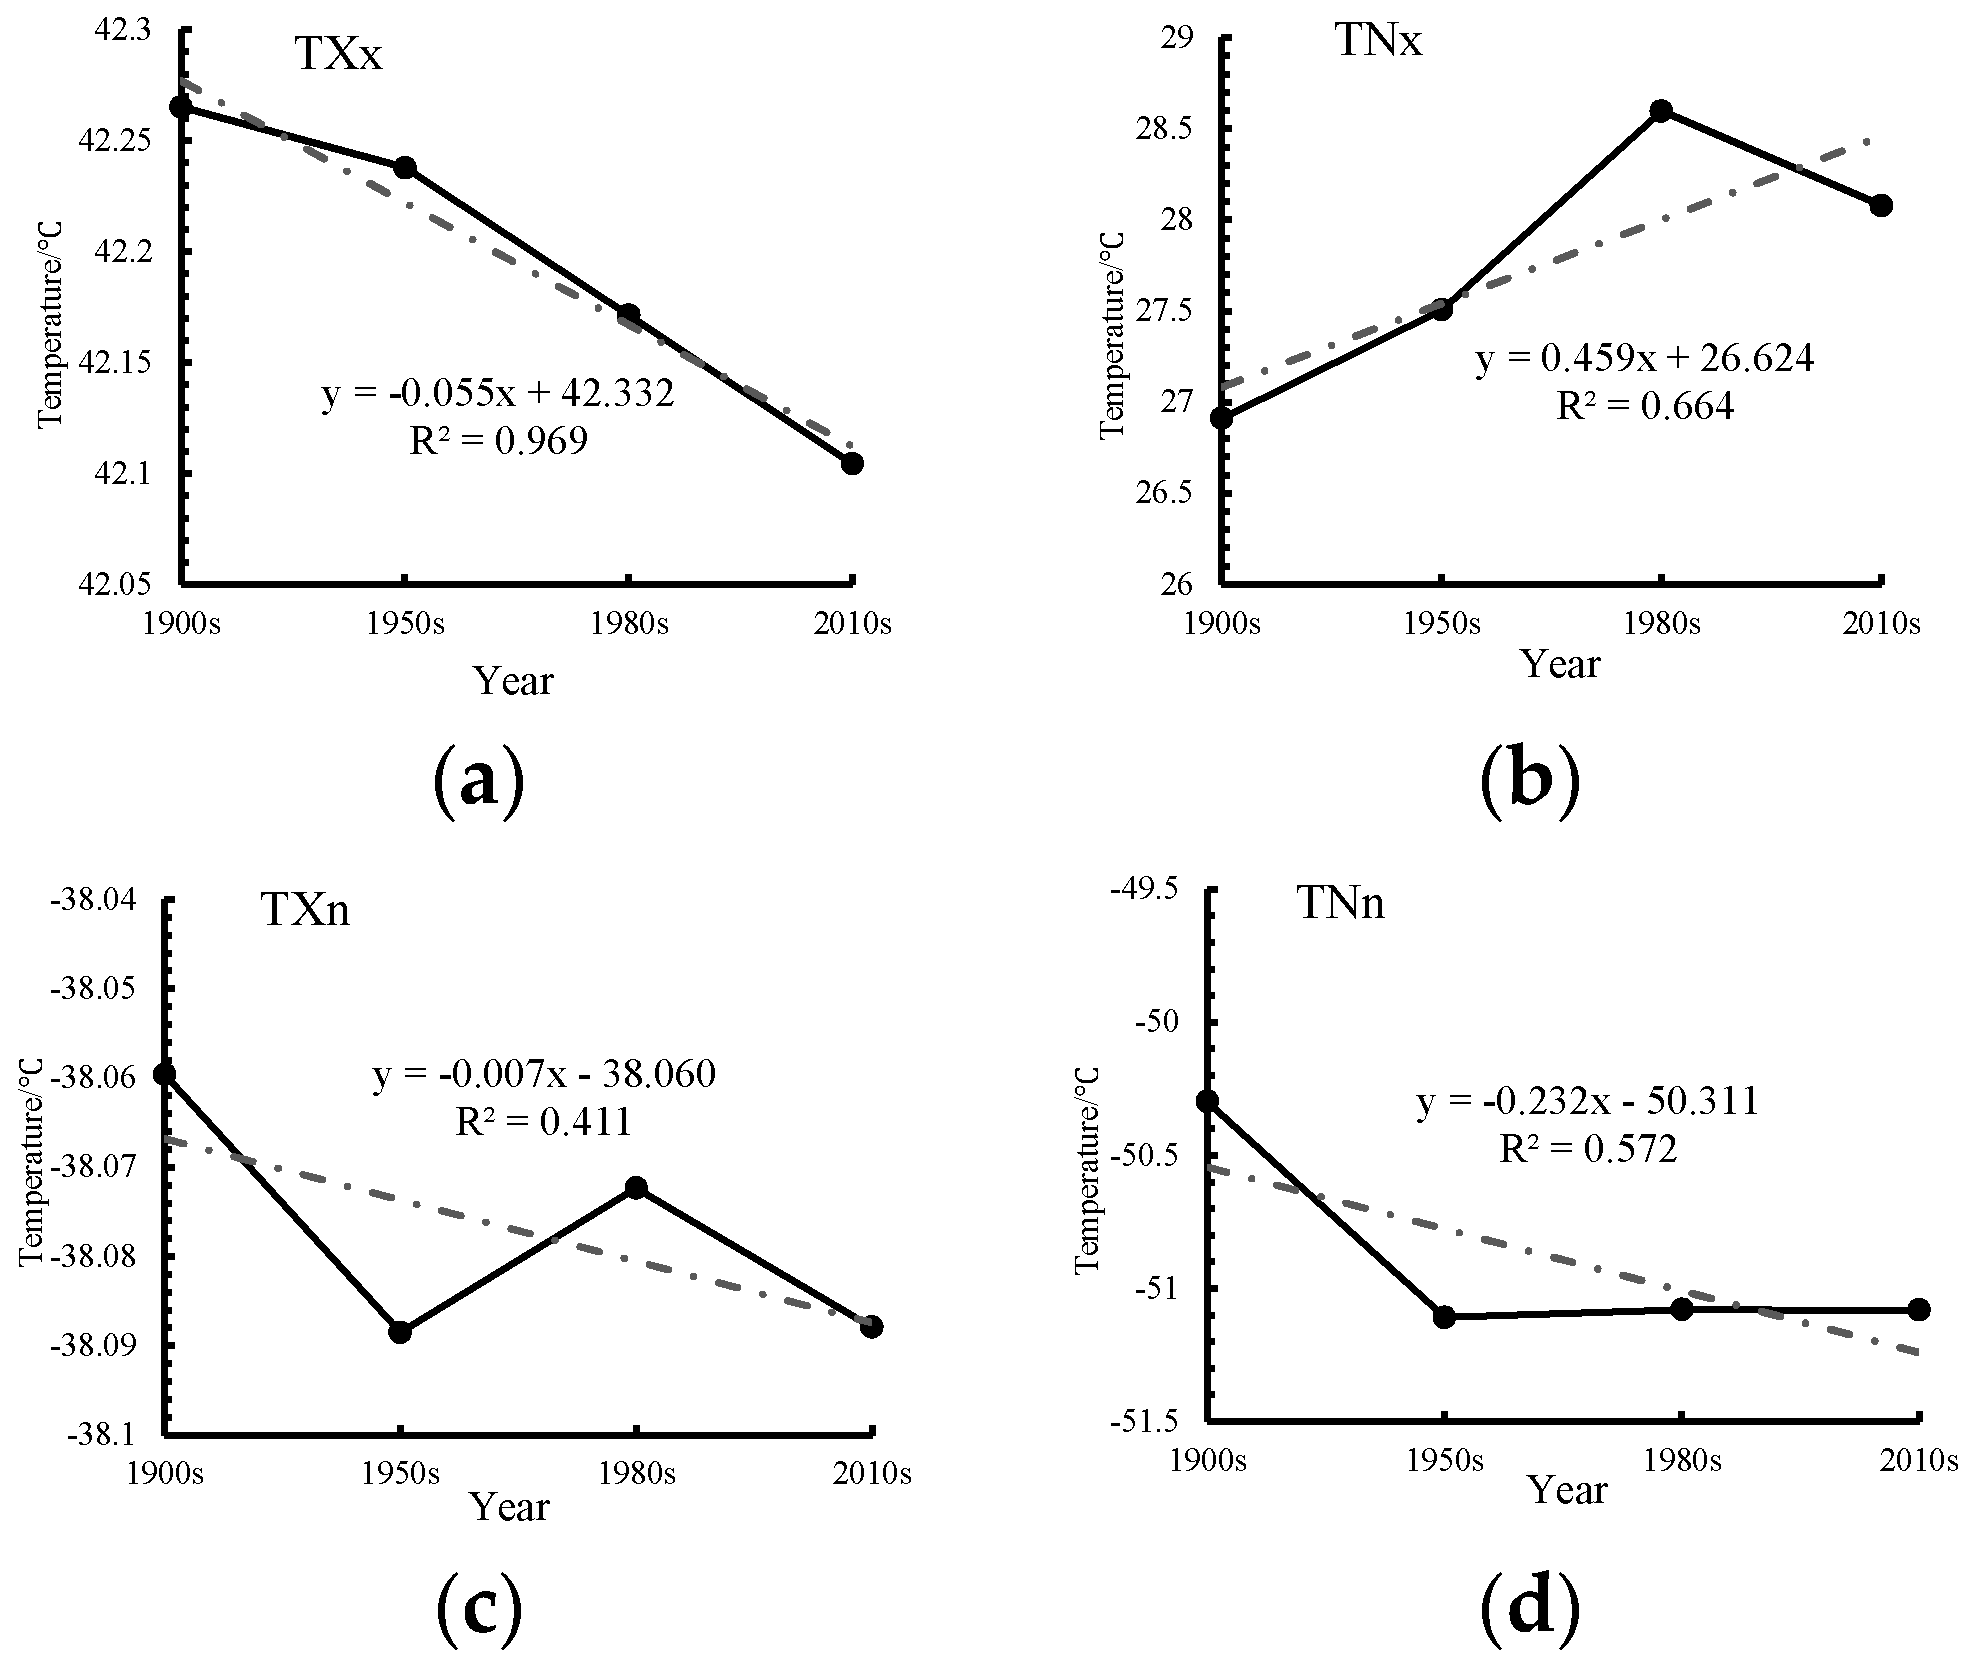
Figure 6.
Inter-annual variations in indexes of annual extreme temperature events in Heilongjiang Province between the 1900s and 2010s. (a) Maximum value of daily maximum temperature; (b) Maximum value of daily minimum temperature; (c) Minimum value of daily maximum temperature; (d) Minimum value of daily minimum temperature.

Figure 7.
Maps showing the spatial distribution of extreme climatic indexes between the 1900s and 2010s in Heilongjiang Province. (a) Warm days; (b) Warm nights; (c) Tropical nights; (d) Summer days; (e) Cold days; (f) Cold nights; (g) Frost days; (h) Ice days; (i) Maximum value of daily minimum temperature; (j) Maximum value of daily maximum temperature; (k) Minimum value of daily maximum temperature; (l) Minimum value of daily minimum temperature.
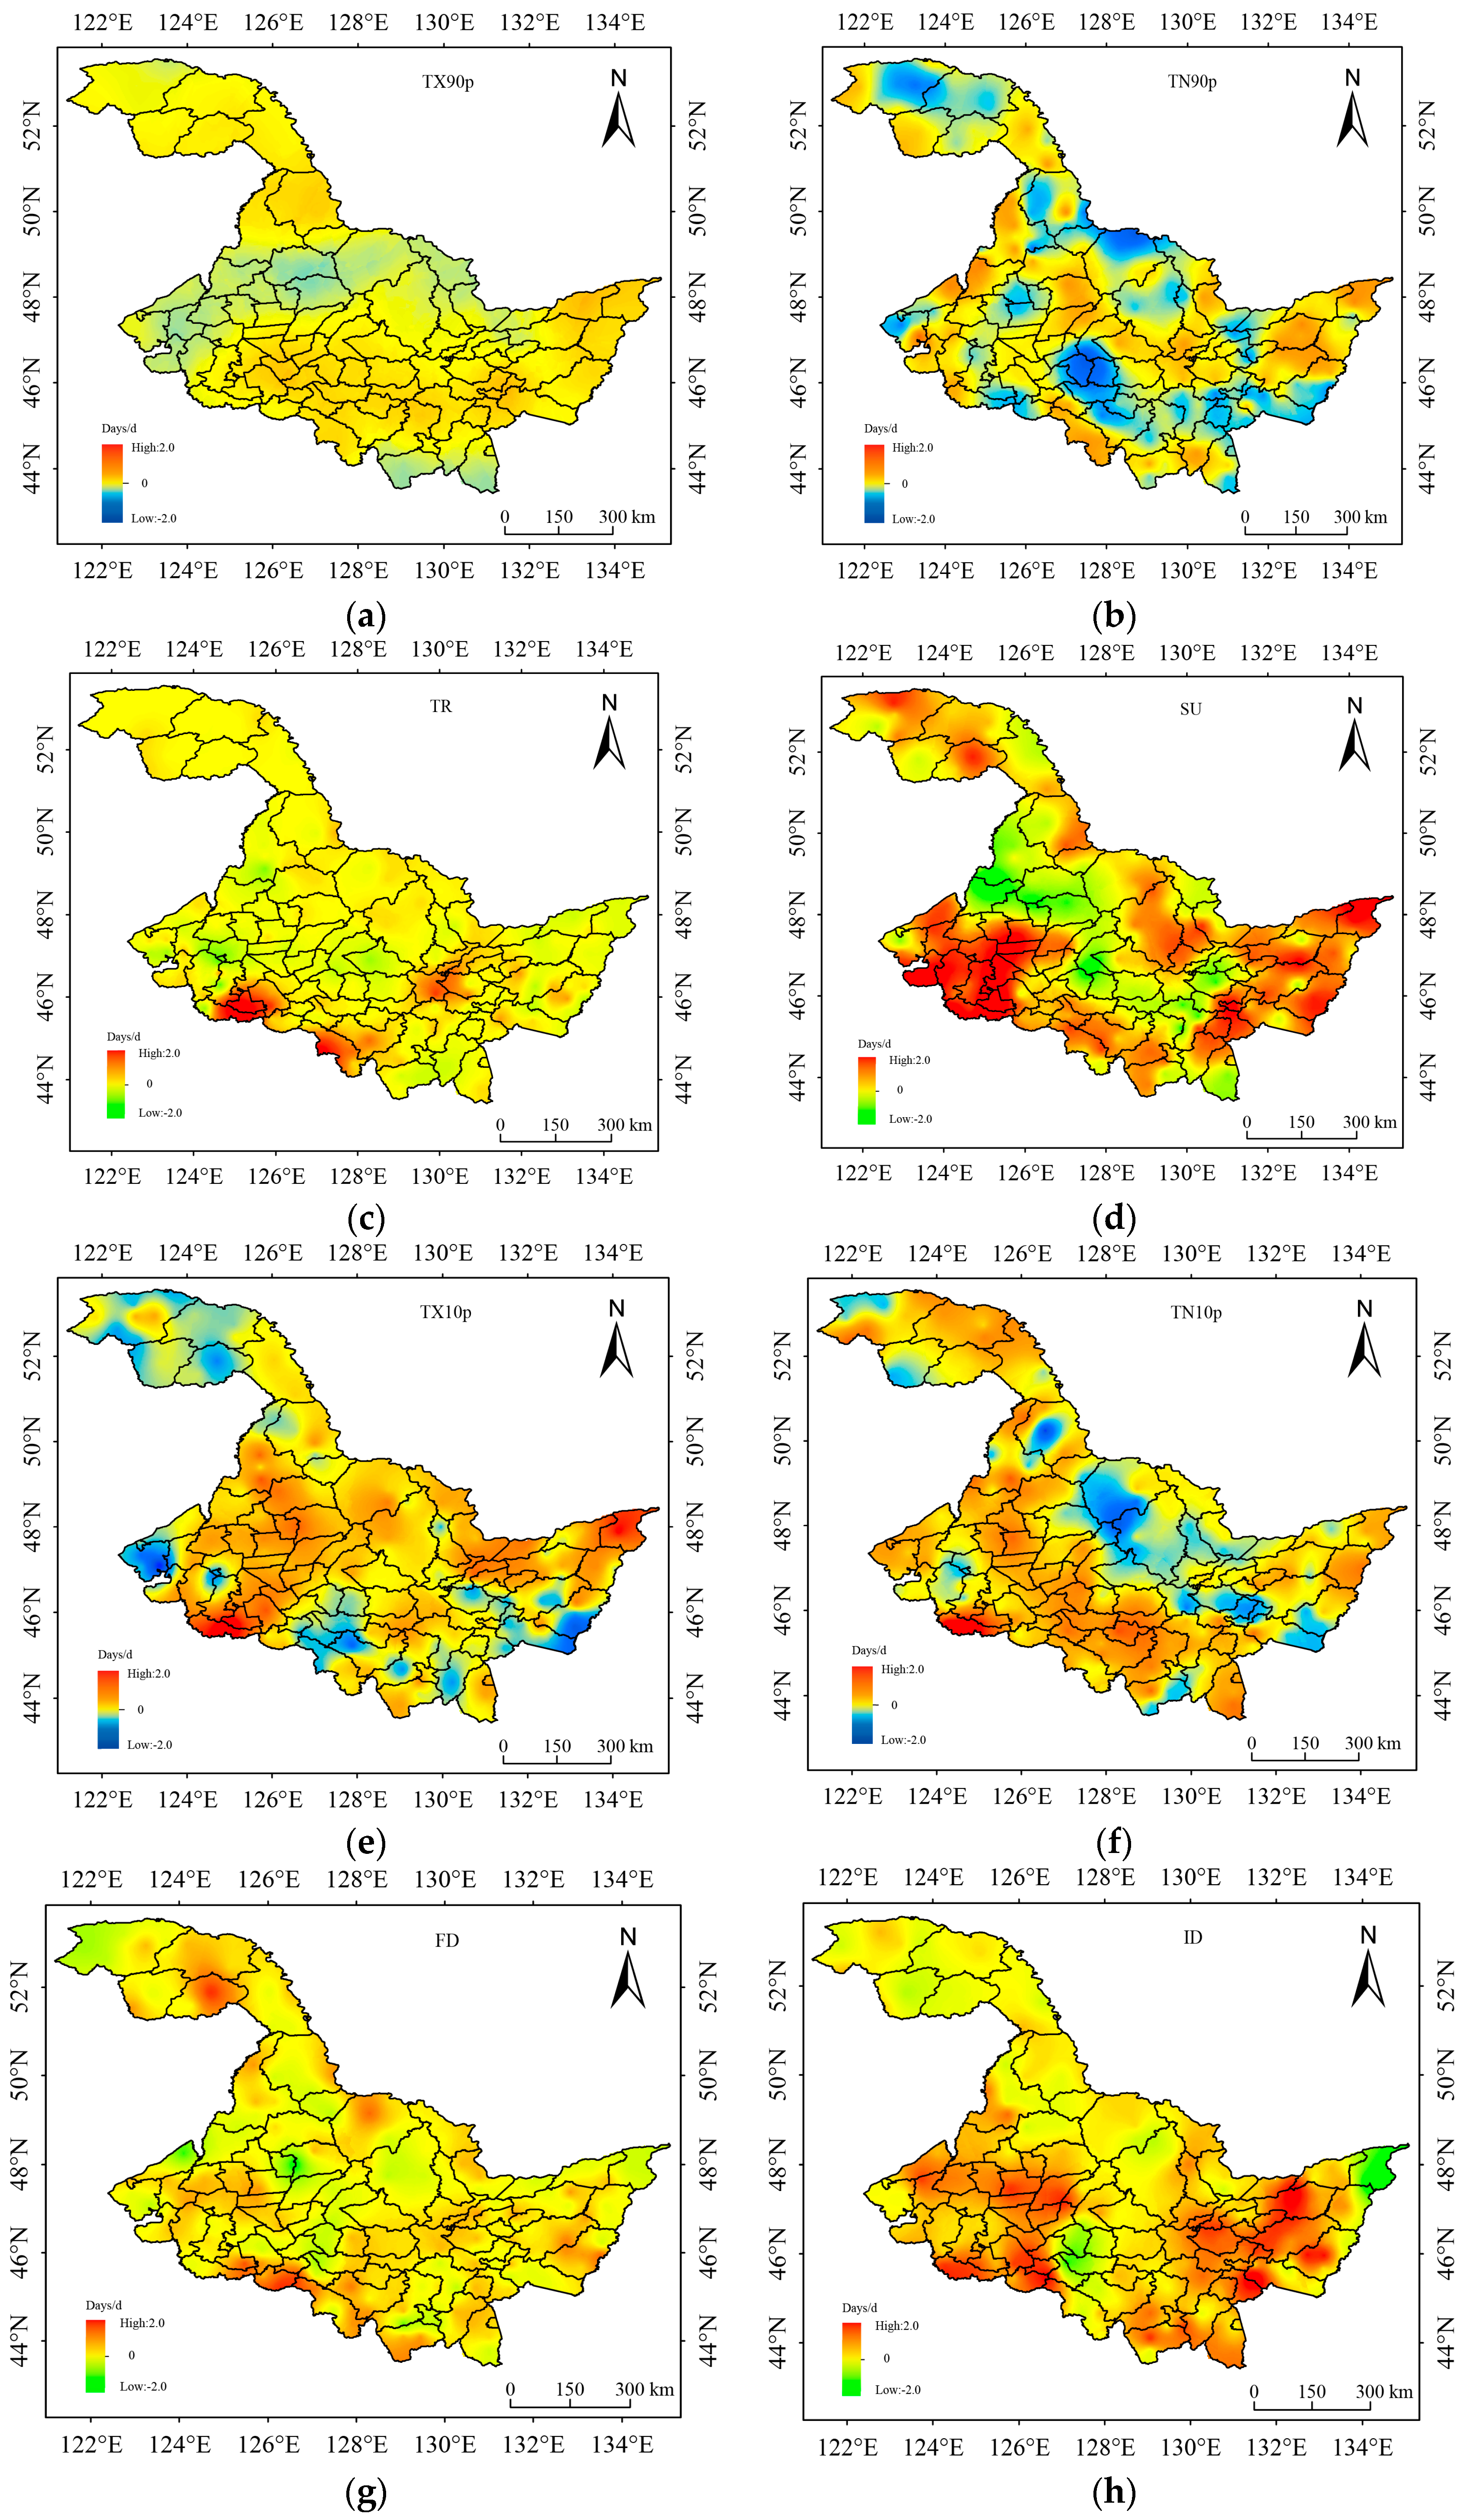
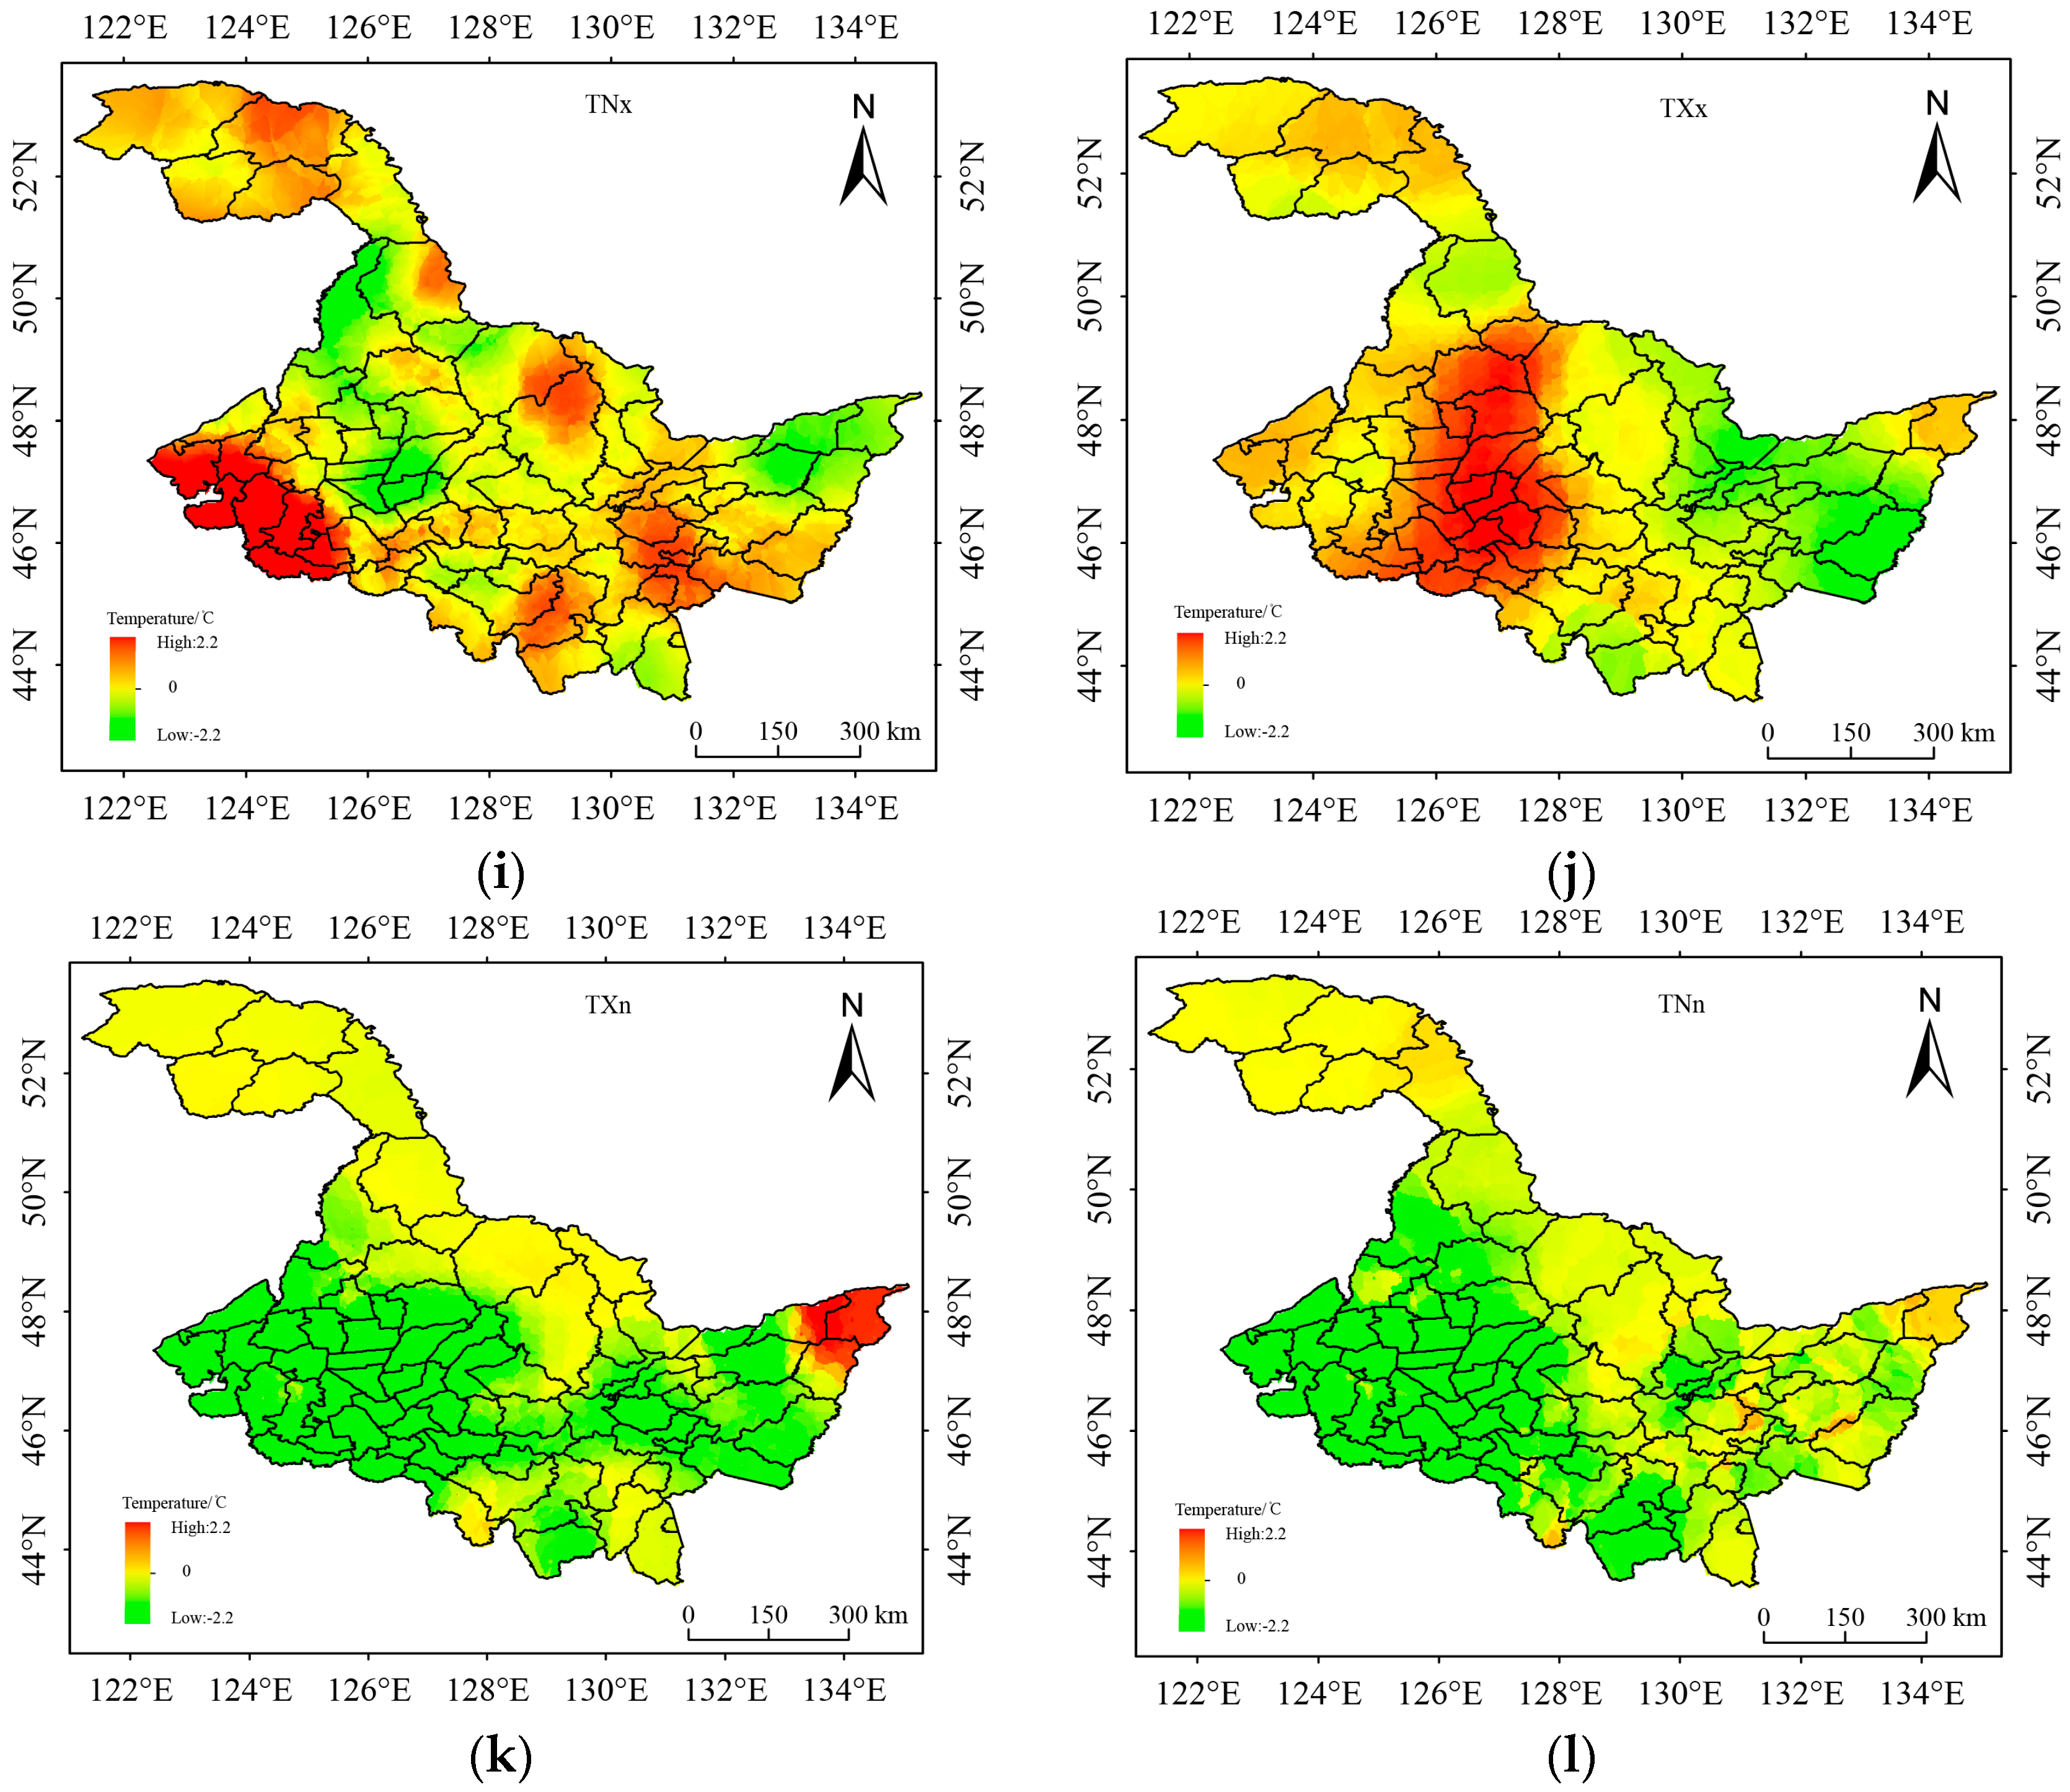
Figure 8.
Changing trends in extreme temperature indexes in Heilongjiang Province between 1961 and 2010. (a) Warm days; (b) Warm nights; (c) Summer days; (d) Tropical nights; (e) Cold days; (f) Cold nights; (g) Ice days; (h) Frost days; (i) Minimum value of daily minimum temperature; (j) Maximum value of daily minimum temperature; (k) Minimum value of daily maximum temperature; (l) Maximum value of daily maximum temperature.
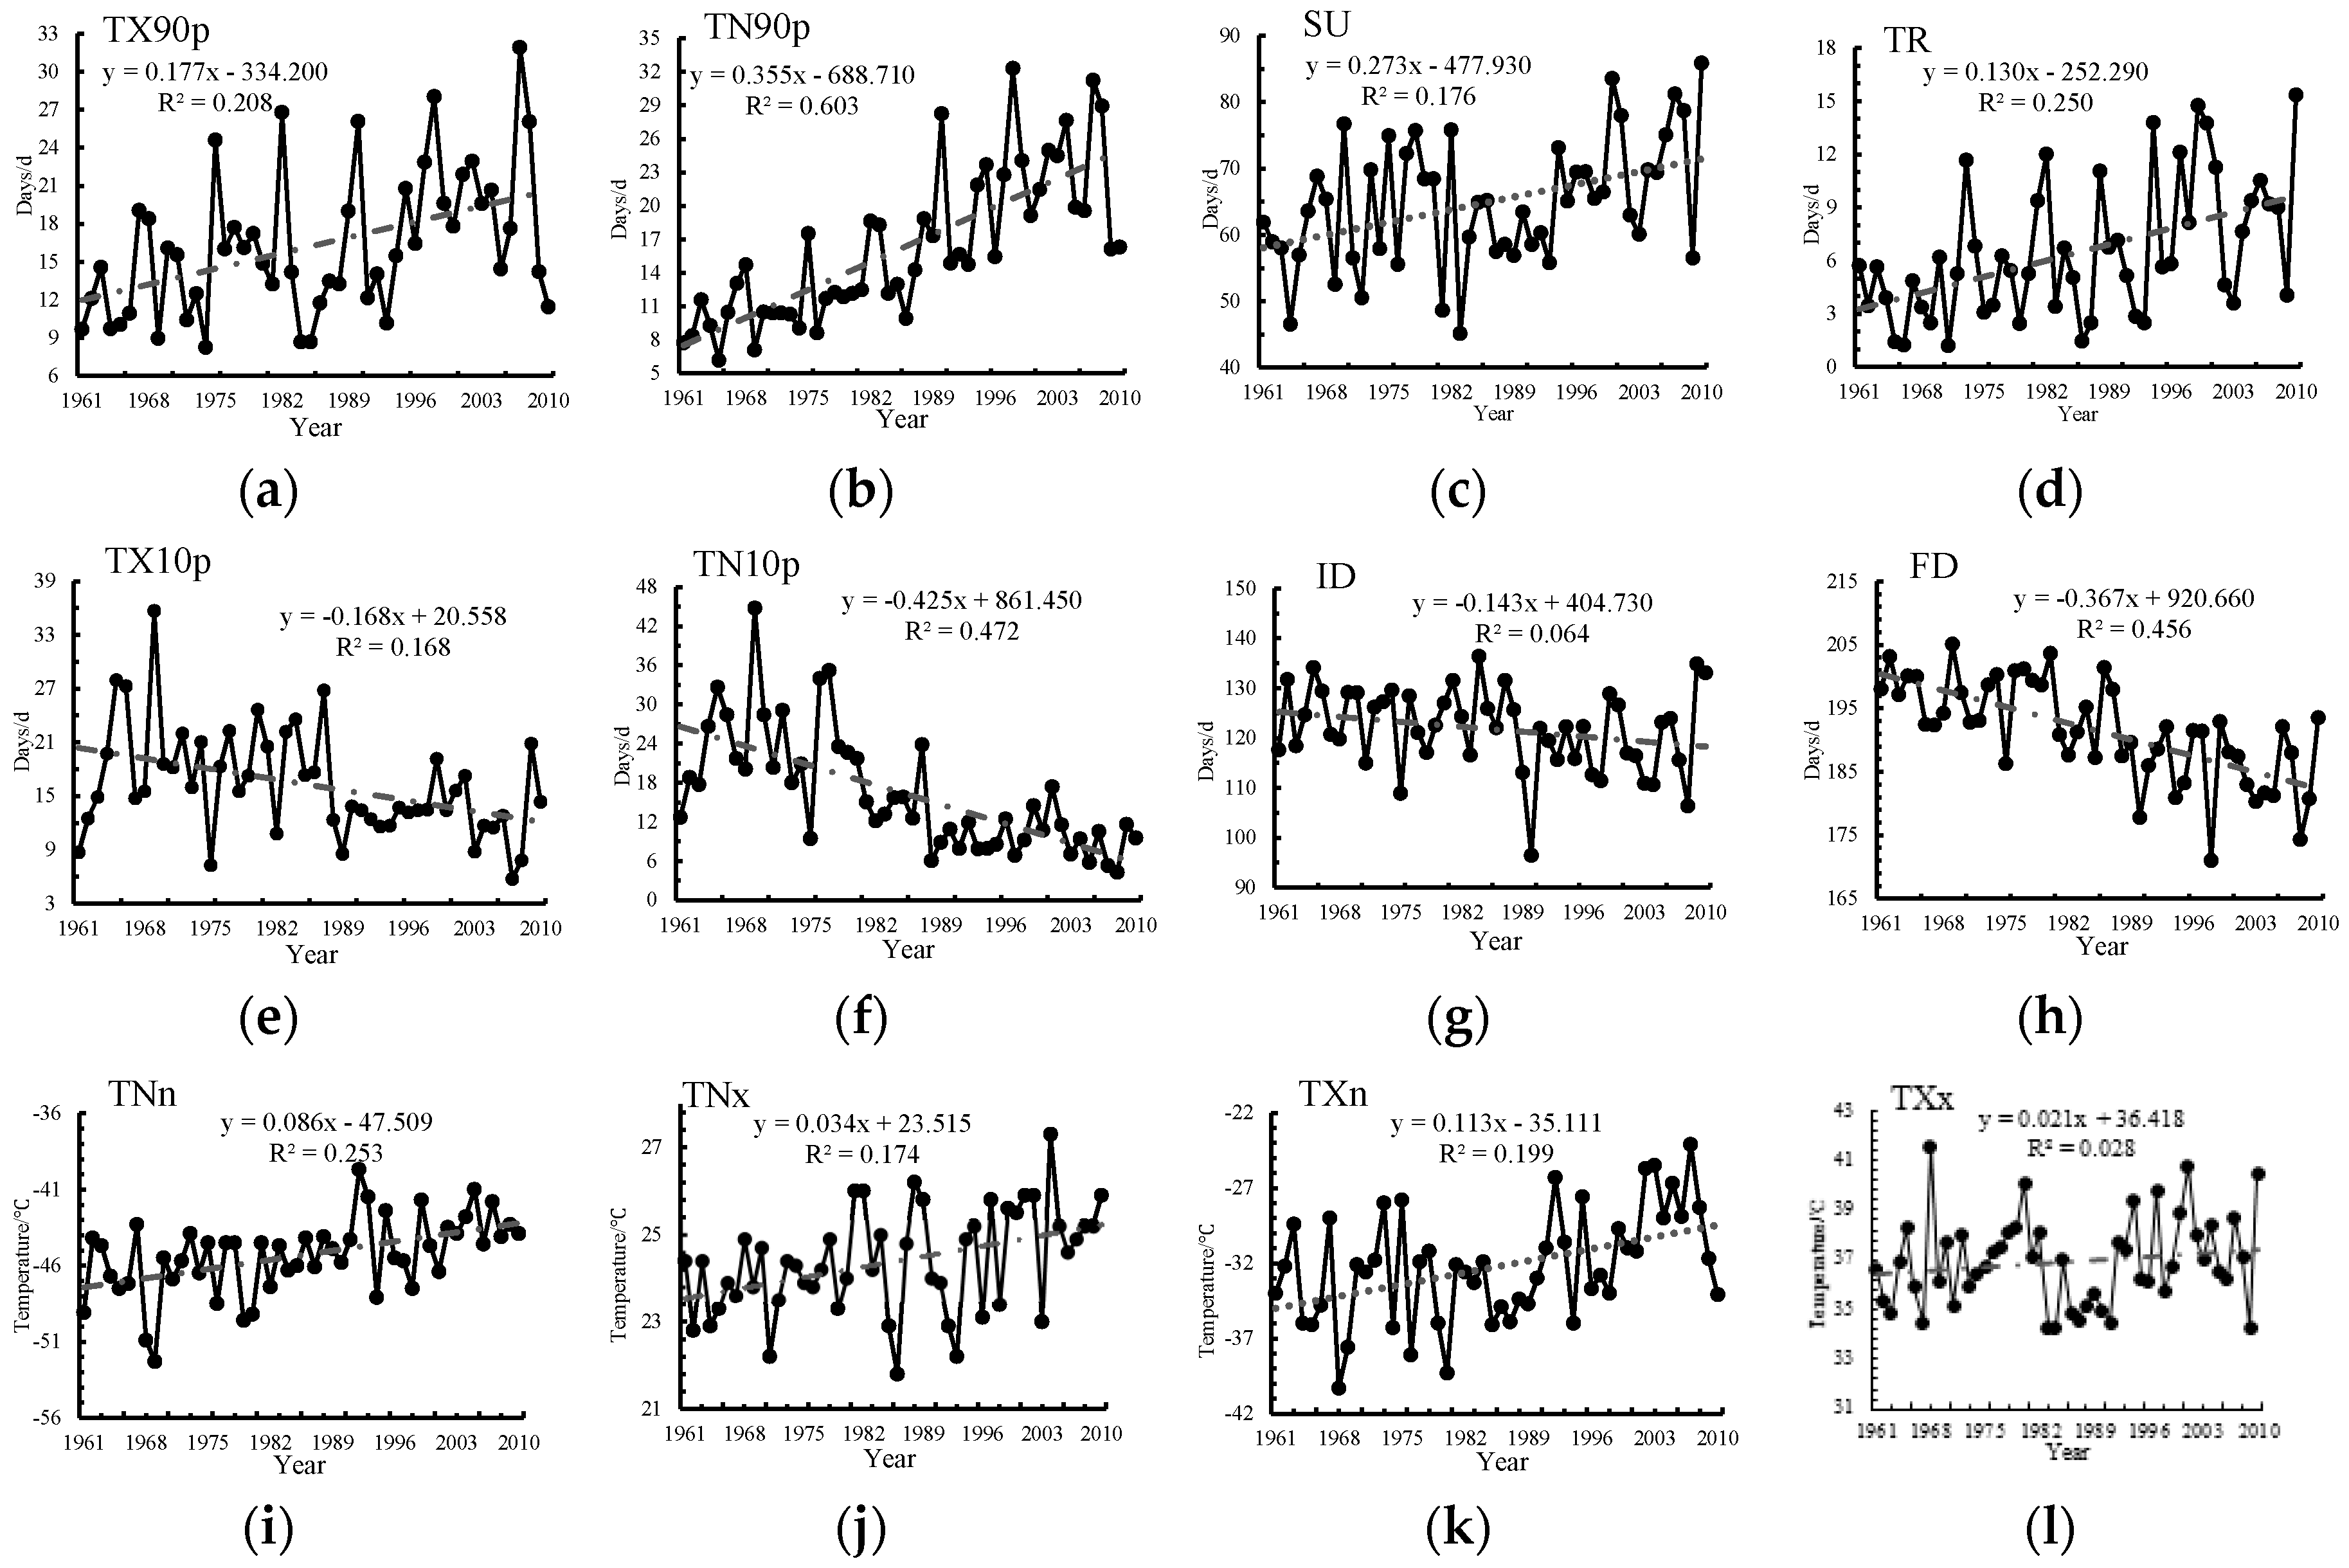
Figure 9.
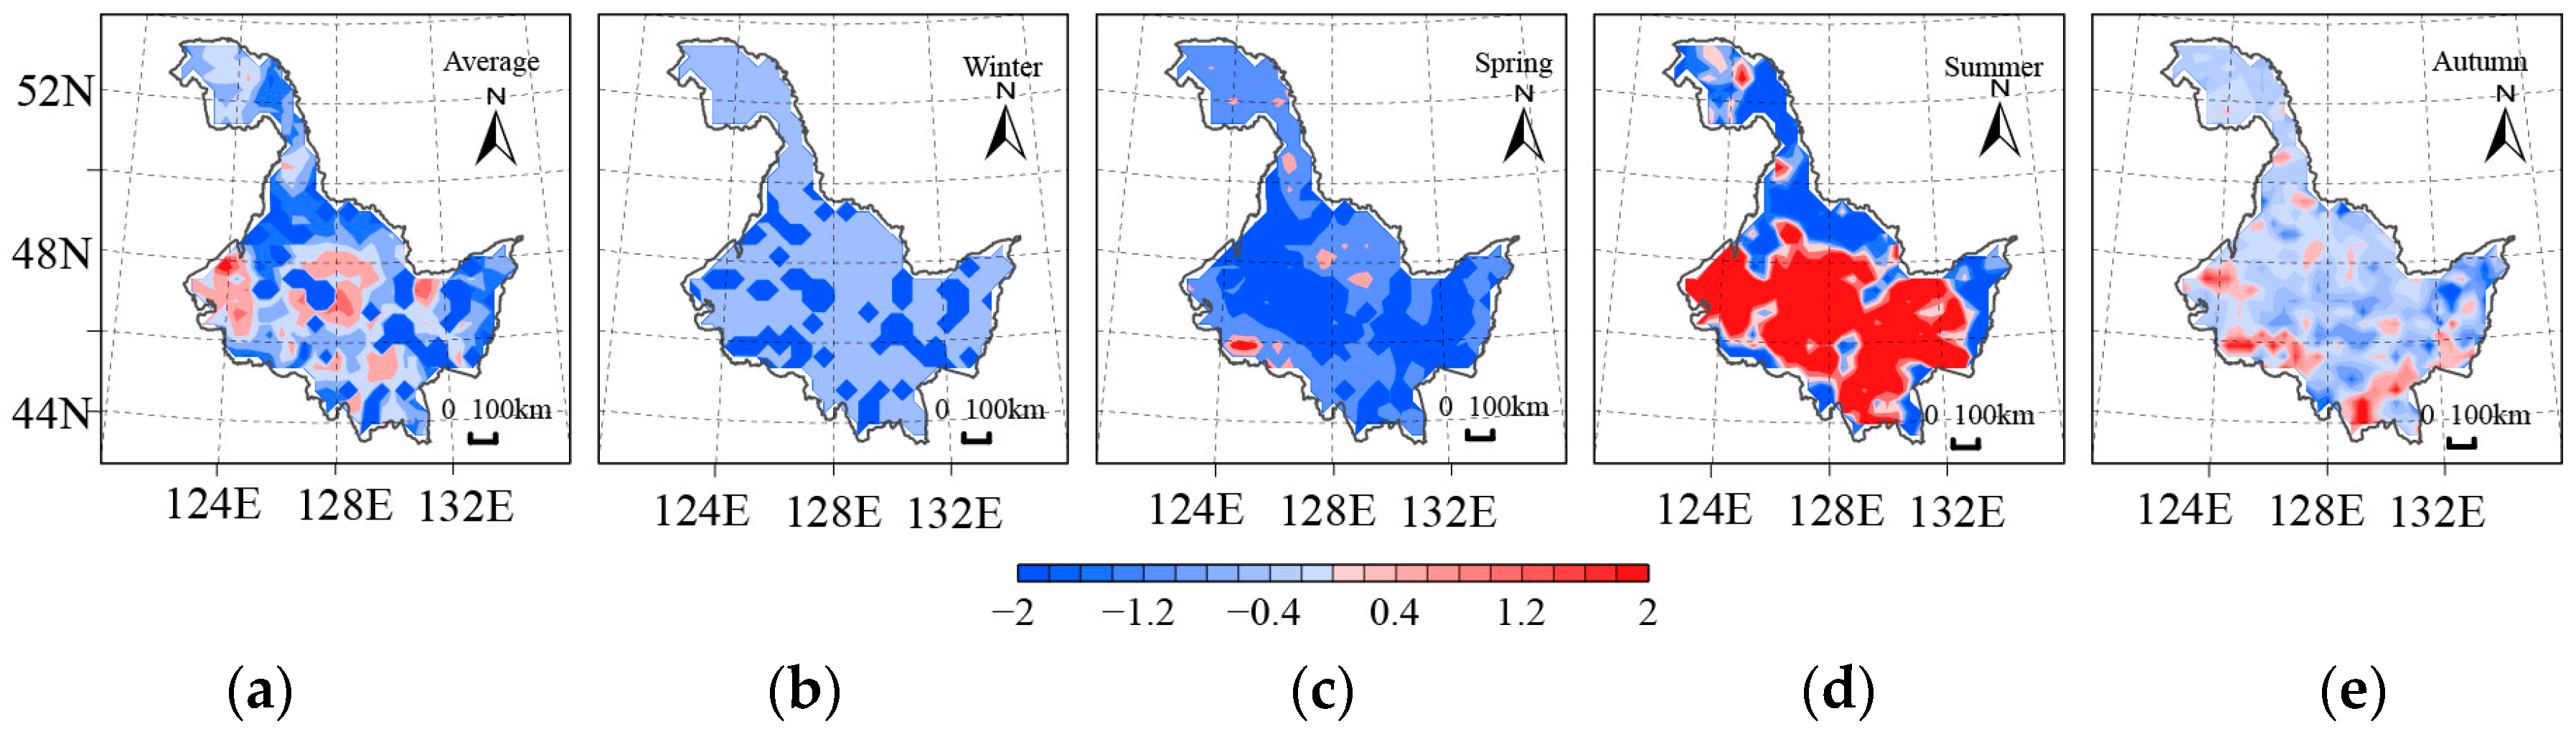
Maps to show the spatial distribution of surface albedo changes caused by the conversion of forests to cropland. (a) Annual average; (b)Winter; (c) Spring; (d) Summer; (e) Autumn.
Figure 9.
Maps to show the spatial distribution of surface albedo changes caused by the conversion of forests to cropland. (a) Annual average; (b)Winter; (c) Spring; (d) Summer; (e) Autumn.
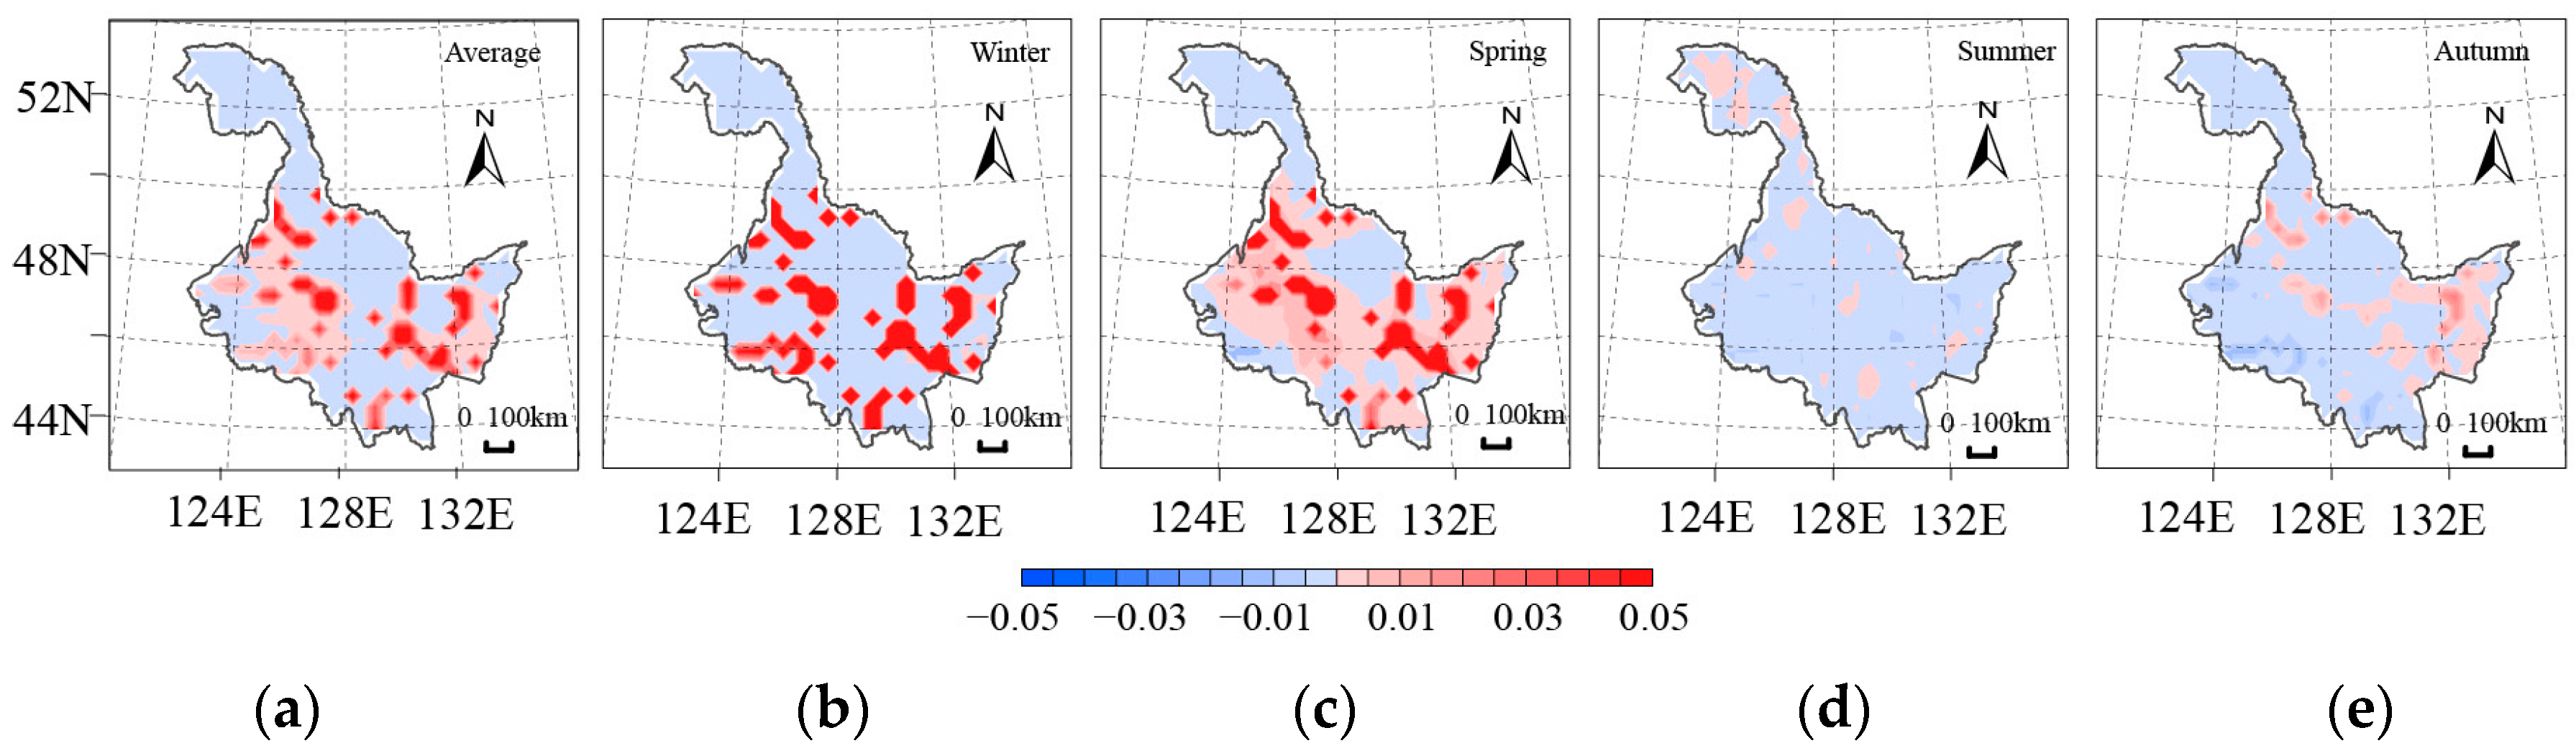
Figure 10.
Maps to show the spatial distribution of surface net flux changes caused by the conversion of forests to cropland. (a) Annual average; (b)Winter; (c) Spring; (d) Summer; (e) Autumn.
Figure 10.
Maps to show the spatial distribution of surface net flux changes caused by the conversion of forests to cropland. (a) Annual average; (b)Winter; (c) Spring; (d) Summer; (e) Autumn.

Table 1.
Extreme temperature indexes.
| Classification | Abbr. | Index | Definition | Unit |
|---|---|---|---|---|
| Relative index | TX90p | warm days | number of days where daily maximum temperature is greater than temperature at the 90% quantile between 1961 and 2010 in a year | d |
| TN90p | warm nights | number of days where daily minimum temperature is greater than temperature at the 90% quantile between 1961 and 2010 in a year | d | |
| TX10p | cold days | number of days where daily maximum temperature is less than the number of days at the 10% quantile between 1961 and 2010 in a year | d | |
| TN10p | cold nights | number of days where daily minimum temperature is less than the number of days at the 10% quantile between 1961 and 2010 in a year | d | |
| Absolute index | SU | summer days | number of days where the daily maximum temperature is greater than 25 °C in a year | d |
| TR | tropical nights | number of days where the daily minimum temperature is greater than 20 °C in a year | d | |
| ID | ice days | number of days with daily maximum temperature less than 0 °C in a year | d | |
| FD | frost days | Number of days with a daily minimum temperature less than 0 °C in a year | d | |
| Maximum and minimum value indexes | TXn | minimum value of daily maximum temperature | minimum value of daily maximum temperature in a year | °C |
| TNn | minimum value of daily minimum temperature | minimum value of daily minimum temperature in a year | °C | |
| TXx | maximum value of daily maximum temperature | maximum value of daily maximum temperature in a year | °C | |
| TNx | maximum value of daily minimum temperature | maximum value of daily minimum temperature in a year | °C |
Table 2.
Spatial correlation coefficients between forested area and extreme temperature indexes.
| Index | R | Index | R |
|---|---|---|---|
| Number of warm days | −0.170 ** | Number of frost days | 0.008 |
| Number of warm nights | −0.110 ** | Number of ice days | −0.150 ** |
| Number of tropical nights | −0.220 ** | Maximum value of daily maximum temperature | −0.080 * |
| Number of summer days | −0.030 | Maximum value of daily minimum temperature | −0.120 ** |
| Number of cold days | −0.190 ** | Minimum value of daily maximum temperature | 0.360 ** |
| Number of cold nights | −0.130 ** | Minimum value of daily minimum temperature | 0.130 ** |
Note: *: p < 0.05; **: p < 0.01.
Table 3.
Mean changes in surface solar radiation and the heat flux budgets of grid cells containing forests converted into cropland (i.e., sensitive simulations minus the control).
Table 3.
Mean changes in surface solar radiation and the heat flux budgets of grid cells containing forests converted into cropland (i.e., sensitive simulations minus the control).
| Surface Albedo | Net Radiation Flux/W m−2 | Latent Heat Flux/W m−2 | Sensible Heat Flux/W m−2 | |
|---|---|---|---|---|
| Annual average | 0.007 | −0.906 | 0.246 | −0.918 |
| Spring | 0.013 | −2.859 | −0.104 | −1.923 |
| Summer | −0.001 | 1.112 | 1.287 | −0.428 |
| Autumn | 0.001 | −0.053 | −0.029 | −0.079 |
| Winter | 0.017 | −1.823 | −0.171 | −1.241 |
© 2017 by the authors. Licensee MDPI, Basel, Switzerland. This article is an open access article distributed under the terms and conditions of the Creative Commons Attribution (CC BY) license (http://creativecommons.org/licenses/by/4.0/).
Share and Cite
MDPI and ACS Style
Zhang, L.; Pan, T.; Zhang, H.; Li, X.; Jiang, L. The Effects of Forest Area Changes on Extreme Temperature Indexes between the 1900s and 2010s in Heilongjiang Province, China. Remote Sens. 2017, 9, 1280. https://doi.org/10.3390/rs9121280
AMA Style
Zhang L, Pan T, Zhang H, Li X, Jiang L. The Effects of Forest Area Changes on Extreme Temperature Indexes between the 1900s and 2010s in Heilongjiang Province, China. Remote Sensing. 2017; 9(12):1280. https://doi.org/10.3390/rs9121280
Chicago/Turabian StyleZhang, Lijuan, Tao Pan, Hongwen Zhang, Xiaxiang Li, and Lanqi Jiang. 2017. "The Effects of Forest Area Changes on Extreme Temperature Indexes between the 1900s and 2010s in Heilongjiang Province, China" Remote Sensing 9, no. 12: 1280. https://doi.org/10.3390/rs9121280
Note that from the first issue of 2016, this journal uses article numbers instead of page numbers. See further details here.