1. Introduction
Vegetation burning is a global-scale process that affects the global distribution and structure of vegetation, major biogeochemical cycles, and the climate system [
1]. The relation of fire with vegetation is contradictory: as an ecological factor, it contributes to maintaining ecosystem dynamics, productivity and biodiversity and, as a land management tool, it is extensively employed in croplands, rangelands, and forests throughout the world. However, wildfires are a socio-natural hazard that annually affect millions of hectares of forests, woodlands, and other vegetation, endangering human populations, and causing substantial economic losses, both in terms of assets destroyed and in the form of prevention and suppression costs [
2]. During the last decades, the Brazilian savanna has been increasingly affected by deforestation due to cropland and pasture expansion, consequently increasing and altering the natural fire regime in the region [
3,
4]. Attempts to characterize these anthropogenic impacts presuppose understanding of spatial and temporal fire patterns [
1]. Despite the high frequency of human induced-fire and significant disturbance caused to the Cerrado biome, fire dynamics are not yet well characterized.
Over the last few decades, the use of remote sensing has allowed unprecedented advances in mapping fire dynamics, especially for locating fire occurrence in time and space and quantifying the total extent of area burned. Several studies relied on the use of remote sensing to map burned areas at a global/regional scale [
5,
6,
7,
8,
9,
10,
11]. However, the variable persistence of burn scars within different vegetation types, and the spectral confusion with other phenomena (e.g., cloud shadowing) are some of the problems that still hamper accurate burned area mapping [
12]. Accordingly, users of burned area maps have stressed the need to improve product accuracy, namely in order to refine current estimates of burned areas, thus providing input to global analysis of ecological impacts of fires to better understand the relations between fire occurrence and biodiversity, and to improve the assessment of atmospheric emissions derived from vegetation fires [
13,
14].
The detection of small burned areas is one of the main limitations in burned area mapping that uses low-resolution sensors, as previously reported [
7,
11,
15,
16,
17]. It is possible to improve the detection of small burned areas using existing fire products. Alonso-Canas [
5], using 300-m MEdium Resolution Imaging Spectrometer (MERIS) global satellite data, developed an algorithm based on the time series of surface reflectance to identify abrupt changes in near-infrared reflectance (NIR), and regional growing techniques using MODIS active fire as spatial seeds, in a two-phase algorithm. The use of this sensor has improved small fire detection due to better spatial resolution, however, the results were not considered competitive in comparison with MODIS burned area products [
17]. Hybrid approaches that combine active fire information with reflectance data have been widely used in burned area mapping to add new evidence for burned area classification [
5,
7,
11]. In such approaches, active fires are used to derive statistics for burn classes [
18,
19], or used as seed points in regional growing techniques. However, active fire detection products often omit burned area patches [
20], leading to underestimation of the area burned. Omission errors from active fire detection products may be due to the spatial and the temporal coverage of satellite overpasses, sensor saturation, or obscuration by clouds and smoke [
7,
11,
21]. The presence of thick clouds and heavy smoke layers is a major drawback in operational applications, preventing hot spot detection due to the spectral signal attenuation in the atmosphere [
21,
22]. This is especially true in the tropics during the dry season [
23,
24], where the probability of cloud-free observations is, on average, less than 30% [
25]. For instance, Schroeder [
21] assessed active fire temporal continuity over Brazil using the Geostationary Operational Environmental Satellite (GOES) hotspot product and indicated that a reduction of 15% in fire counts occurs due to cloud obscuration.
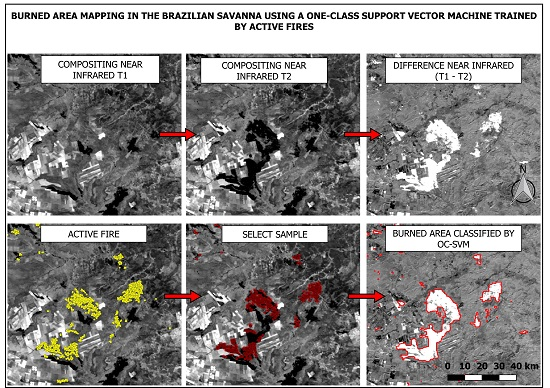
The approach described in this paper only uses active fire data to select burned pixels (positive training samples), avoiding the need to collect unburned (negative) training pixels. Collection of positive training samples can be used in a positive—only classification approach [
26], and is particularly interesting for mapping burned areas since training sample collection is normally a difficult task when considering the unburned area class. However, few studies have applied this technique for burned area mapping. In a comparative study among Maximum Likelihood (ML), Binary Support Vector Machine (SVM) and One-Class Support Vector Machine Description (OC-SVDD) aimed at burned area identification, the authors of [
27] reported that SVM and OC-SVDD produced good results for a broader range of sample sizes than ML. Although the SVM yields better accuracy, the authors mention as an advantage of OC-SVDD that it does not require training samples from unburned areas. However, burned area training data are manually collected, impairing its use in an automated burned area algorithm. Song et al. [
28] proposed mapping burned areas applying a one-class classifier and obtained reasonable results using a kernel sparse representation model to represent burned samples. However, in both studies, training data for the single class of interest was collected manually, which increases the classification cost, making it dependent on human intervention for sample acquisition. Besides eliminating the subjectivity of the human intervention, the fully automatic approach is advantageous for maximizing image data processing efficiency for large area coverage and data volume in a timely and cost-effective way, enabling operational delivery of burned area products.
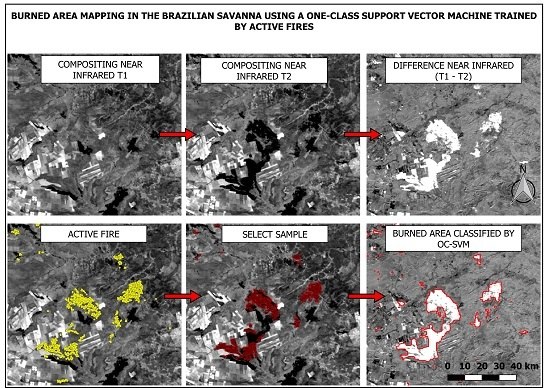
Here, we explore the suitability of the One-Class Support Vector Machine classifier for burned area classification and mapping in the Cerrado region and propose using active fire data to automatically collect burned area training samples, circumventing the need for human intervention and increasing the degree of automation of the entire classification procedure. The procedure was applied to 300-m spatial resolution imagery from the Project for On-Board Autonomy-Vegetation (PROBA-V) and Visible Infrared Imaging Radiometer Suite (VIIRS) active fire data (375 m spatial resolution). This algorithm, hereafter designated AQM-PROBA (from “
Área Queimada”, meaning Burned Area, in Portuguese), is based on VIIRS active fire data which are used to automatically extract burned area training samples from PROBA-V reflectance imagery. Then, those samples are used as input to a one-class support vector machine classifier, which only requires positive (i.e., burned area) training data [
29]. Our goal is to generate a completely automated methodology, capable of producing results with accuracy levels in the range required by users of global fire data products, such as climate and vegetation researchers, as well as land managers and policy-makers [
13]. The accuracy of our results was assessed using reference data derived from Landsat-8 OLI data over the Cerrado region and finally compared with MODIS standard burned area product.
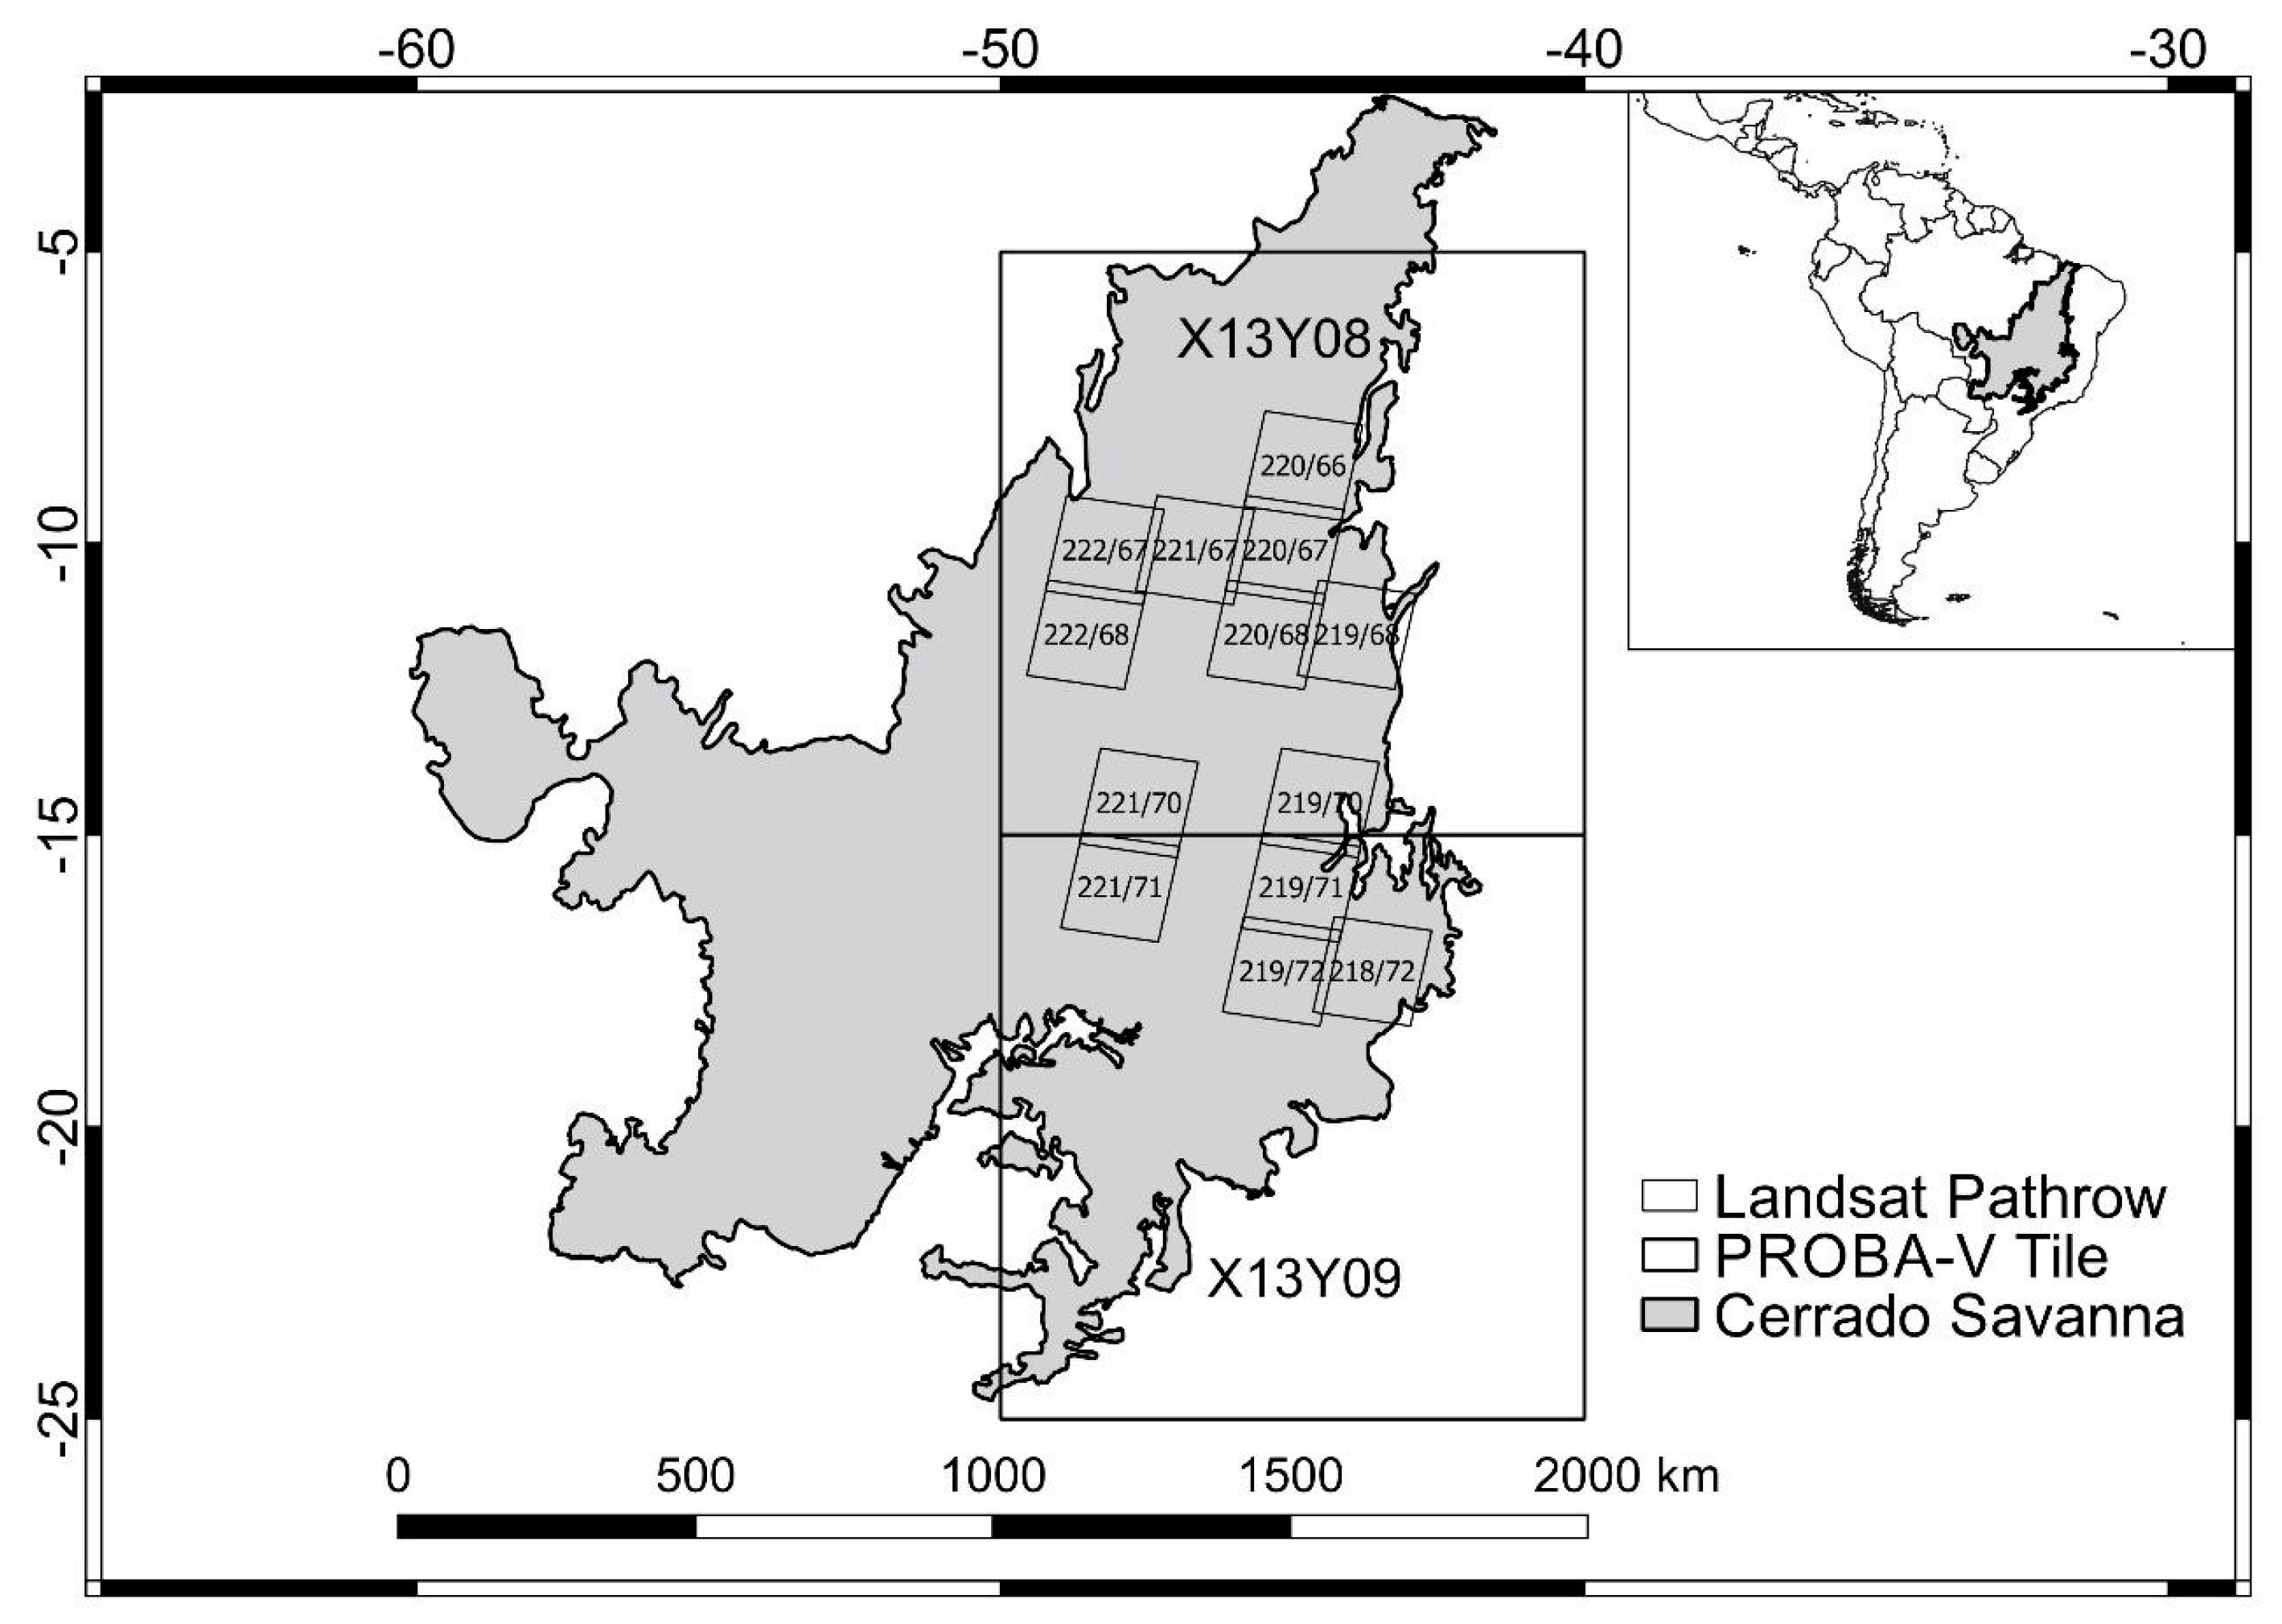
2. Study Area and Data
The Cerrado is the largest continuous savanna area in the world and covers about 2 million km
2, ranging from 2.3°S to 24.7°S and 41.7°W to 60.1°W (
Figure 1). It is one of the most important biodiversity hotspots in the world due to species richness and a high percentage of endemism, containing more than 10,000 cataloged plant species [
30,
31], in which species display morphological and functional dependence from fire [
32,
33,
34]. Several authors have shown that although fire-dependent ecosystems, such as the Cerrado, have evolved in the presence of recurrent natural fires and are dependent on them to maintain their biodiversity, high human pressure through frequent burning may have negative impacts on species diversity [
35,
36]. Fire is commonly used in agricultural land management, affecting water flow and facilitating erosive processes [
37], and promoting deterioration of physical and chemical soil characteristics, reducing its productive potential [
38]. Recently, the human footprint was reported as being high to very high across the Cerrado, where only a few areas remain undisturbed [
39]. Moreover, current climate change scenarios point towards an overall increase in fire frequency and intensity over a large area of the Cerrado [
40].
According to Koppen’s classification [
41], the Cerrado climate is Equatorial savanna with dry winter (Aw), characterized by dry winters and monthly mean temperatures above 18 °C. The biome has a marked dry season from May to September when the region becomes susceptible to fire events with an annual fire occurrence peak in September [
7,
42,
43]. The region is considered a pyrobiome [
33] because it is a fire-dependent ecosystem, where the majority of the species evolved in the presence of fire. According to the authors of [
7,
40], the intra and inter-annual variabilities of fire in the Cerrado are closely related to precipitation variability, but it is worth emphasizing that human activity also plays a prominent role in fire dynamics in this region and cannot be disregarded [
33,
34].
Two datasets were used to develop the algorithm: (1) PROBA-V near-infrared Top of Canopy data (NIR-TOC); and (2) VIIRS active fire data. The datasets span the period 1 August 2015 to 31 October 2015, corresponding to the driest months over the region [
7,
40].
The PROBA-V satellite was launched on 6 May 2013 as a continuity mission to the Vegetation instruments aboard of Satellite Pour l'Observation de la Terre (SPOT) (1998–2014) [
44]. Its orbit is sun-synchronous with an initial overpass time at about 10:45 a.m., with a 2295 km swath and daily near-global (90%) coverage [
45]. PROBA-V cameras have a spatial resolution of 100 to 180 m in the central 500 km of the swath, and 350–660 m along the outer sections of the swath. Final products are available at resolutions of 100 m, 300 m, and 1 km, with level 3 geometric and radiometric corrections. Data consist of reflectance values at the Top of the Atmosphere (product S1-TOA) and Top of Canopy (S1TOC product) in the Blue (0.464 µm), Red (0.665 µm), NIR (0.837 µm), and shortwave infrared (SWIR; 1.603 µm) channels. PROBA-V data are disseminated by European independent research and technology organisation called VITO [
46], in partnership with the European Space Agency (ESA). Solar zenith angles and viewing zenith angles data are also available, as well as information about radiometric quality and cloud/cloud shadow cover. The present study area is coincident with two PROBA-V tiles: X13Y08 and X13Y09 (
Figure 1), covering an area of about 1.22 million km
2 of Cerrado, which represents 60% of the entire biome area.
VIIRS active fire data, at 375 m spatial resolution, are used for collecting burned area spectral data training samples [
47]. Active fires from VIIRS have the highest spatial resolution of currently global products, which makes them particularly suitable to detect small fires [
48,
49]. VIIRS was launched in October 2011 aboard the Suomi National Polar-orbiting Partnership (S-NPP) satellite, a United States mission jointly managed by the National Aeronautics and Space Administration (NASA) and by the National Oceanic and Atmospheric Administration (NOAA) and the data are provided at 12-h intervals.
Accuracy assessment is needed to quantify the degree of agreement between mapped products and ground observations. It allows for rigorous evaluation of the quality of thematic maps derived from remotely sensed data. Ideally, accuracy assessment of maps based on remotely sensed data is performed against ground measurements, taken to represent the true status or quantity of the target under analysis. There are limitations to using this ideal approach in the proposed study, due to the very broad extent of the study area (the whole of Cerrado), the limited accessibility of many regions, and the ephemeral nature of the signal, which starts to fade out a few days after the fire occurrence. Currently, this problem is circumvented by using higher spatial resolution satellite imagery as reference data for evaluating the lower resolution derived maps, being a well-established procedure [
7,
15,
16,
18,
48,
50,
51,
52]. Accordingly, the higher spatial resolution satellite imagery used in this study as reference data for accuracy assessment came from the Landsat-8 (L8) Operational Land Imager (OLI), which has a spatial resolution (30 m), more than 2–3 orders of magnitude higher than that of the evaluated PROBA-V and MODIS instruments. Thirteen paths/rows from OLI sensor, covering an area corresponding to 17% of the Cerrado (
Figure 1), were used to elaborate independent fire reference perimeters. The procedure is based on the International Global Burned Area Satellite Product Validation Protocol [
53], which uses a semi-automatic classification approach. The algorithm uses fixed and multitemporal thresholds applied to the Normalized Burn Ratio Long SWIR (NBRL) spectral index, based on OLI bands 6 and 7 (shortwave infrared around 1.6 and 2.1 µm). Visual photointerpretation is the ultimate benchmark for any classification and segmentation procedure [
54]. Accordingly, the derived scars were then subject to a meticulously, lengthy, and expensive manual and visual quality control, in order to produce the highest quality reference map.
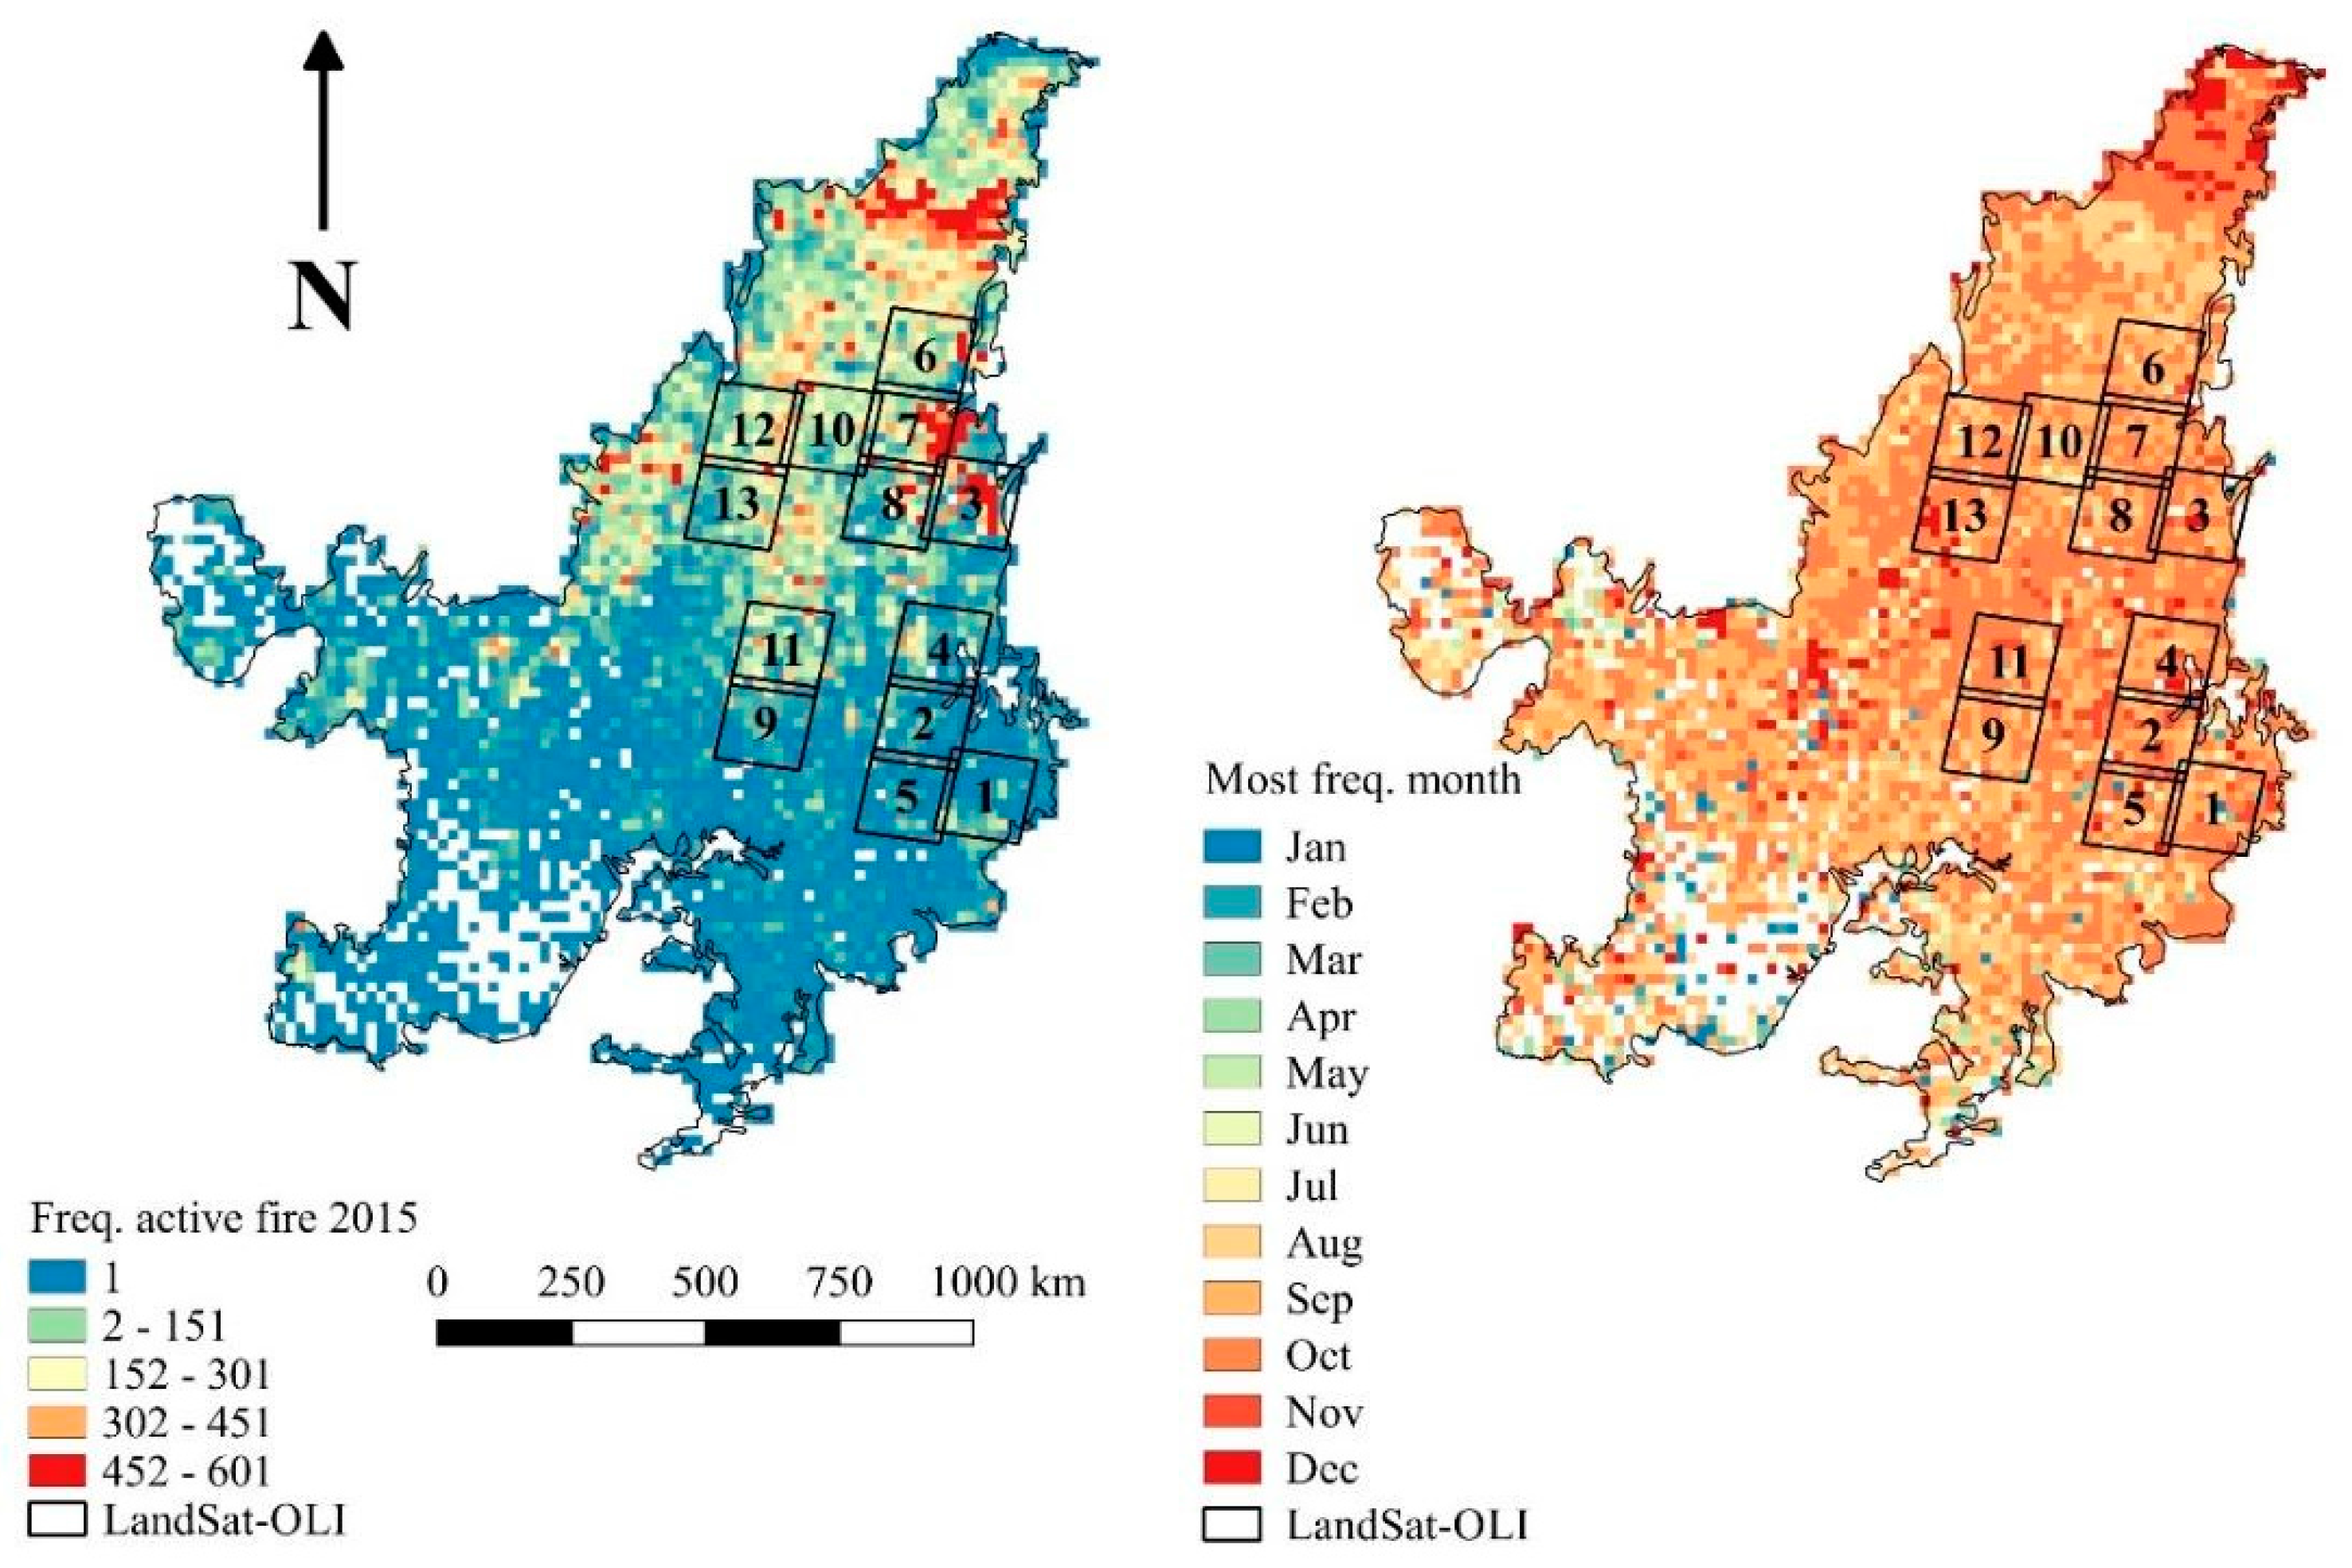
The choice of L8 scenes was guided by the spatial and temporal distribution of active fires derived from the VIIRS in 2015 (
Figure 2). September was the month with the highest frequency of active fires, followed by October, and they are concentrated in the northern part of the Cerrado, corroborating previous studies [
7,
42,
43]. L8 images were then selected according to the period of highest fire activity and lowest cloud cover. We have stratified L8 reference scenes by region according to high, medium, and low fire incidence, to properly assess commission and omission errors.
Table 1 shows the path/row and dates (initial and final date) of the L8 images used in this study.
Finally, we describe our results through a comprehensive assessment of burned area classification using Landsat fire reference perimeters and comparison with the MCD64A1 collection 5 burned area product [
11]. MCD64A1 uses daily reflectance and active fire data from the MODIS sensor aboard the AQUA and TERRA. It presents a nominal resolution of 500 m and is globally available on a monthly basis since August 2000. MODIS tiles h13v09 and h13v10 were used for comparison exercise; the dataset was downloaded from the University of Maryland site.
4. Results
The AQM-PROBA algorithm performance was assessed through a comparison with the MCD64A1 product and the Landsat fire reference perimeters. For the whole study area, 12,848 km
2 of the burned area were mapped using the AQM-PROBA algorithm, and 10,332 km
2 for MCD64A1, against 13,086 km
2 mapped in the reference map. In general, the overall accuracy for AQM-PROBA and MCD64A1 were high (
Table 4), which is expected since the target class is much less frequent than the non-occurrence class.
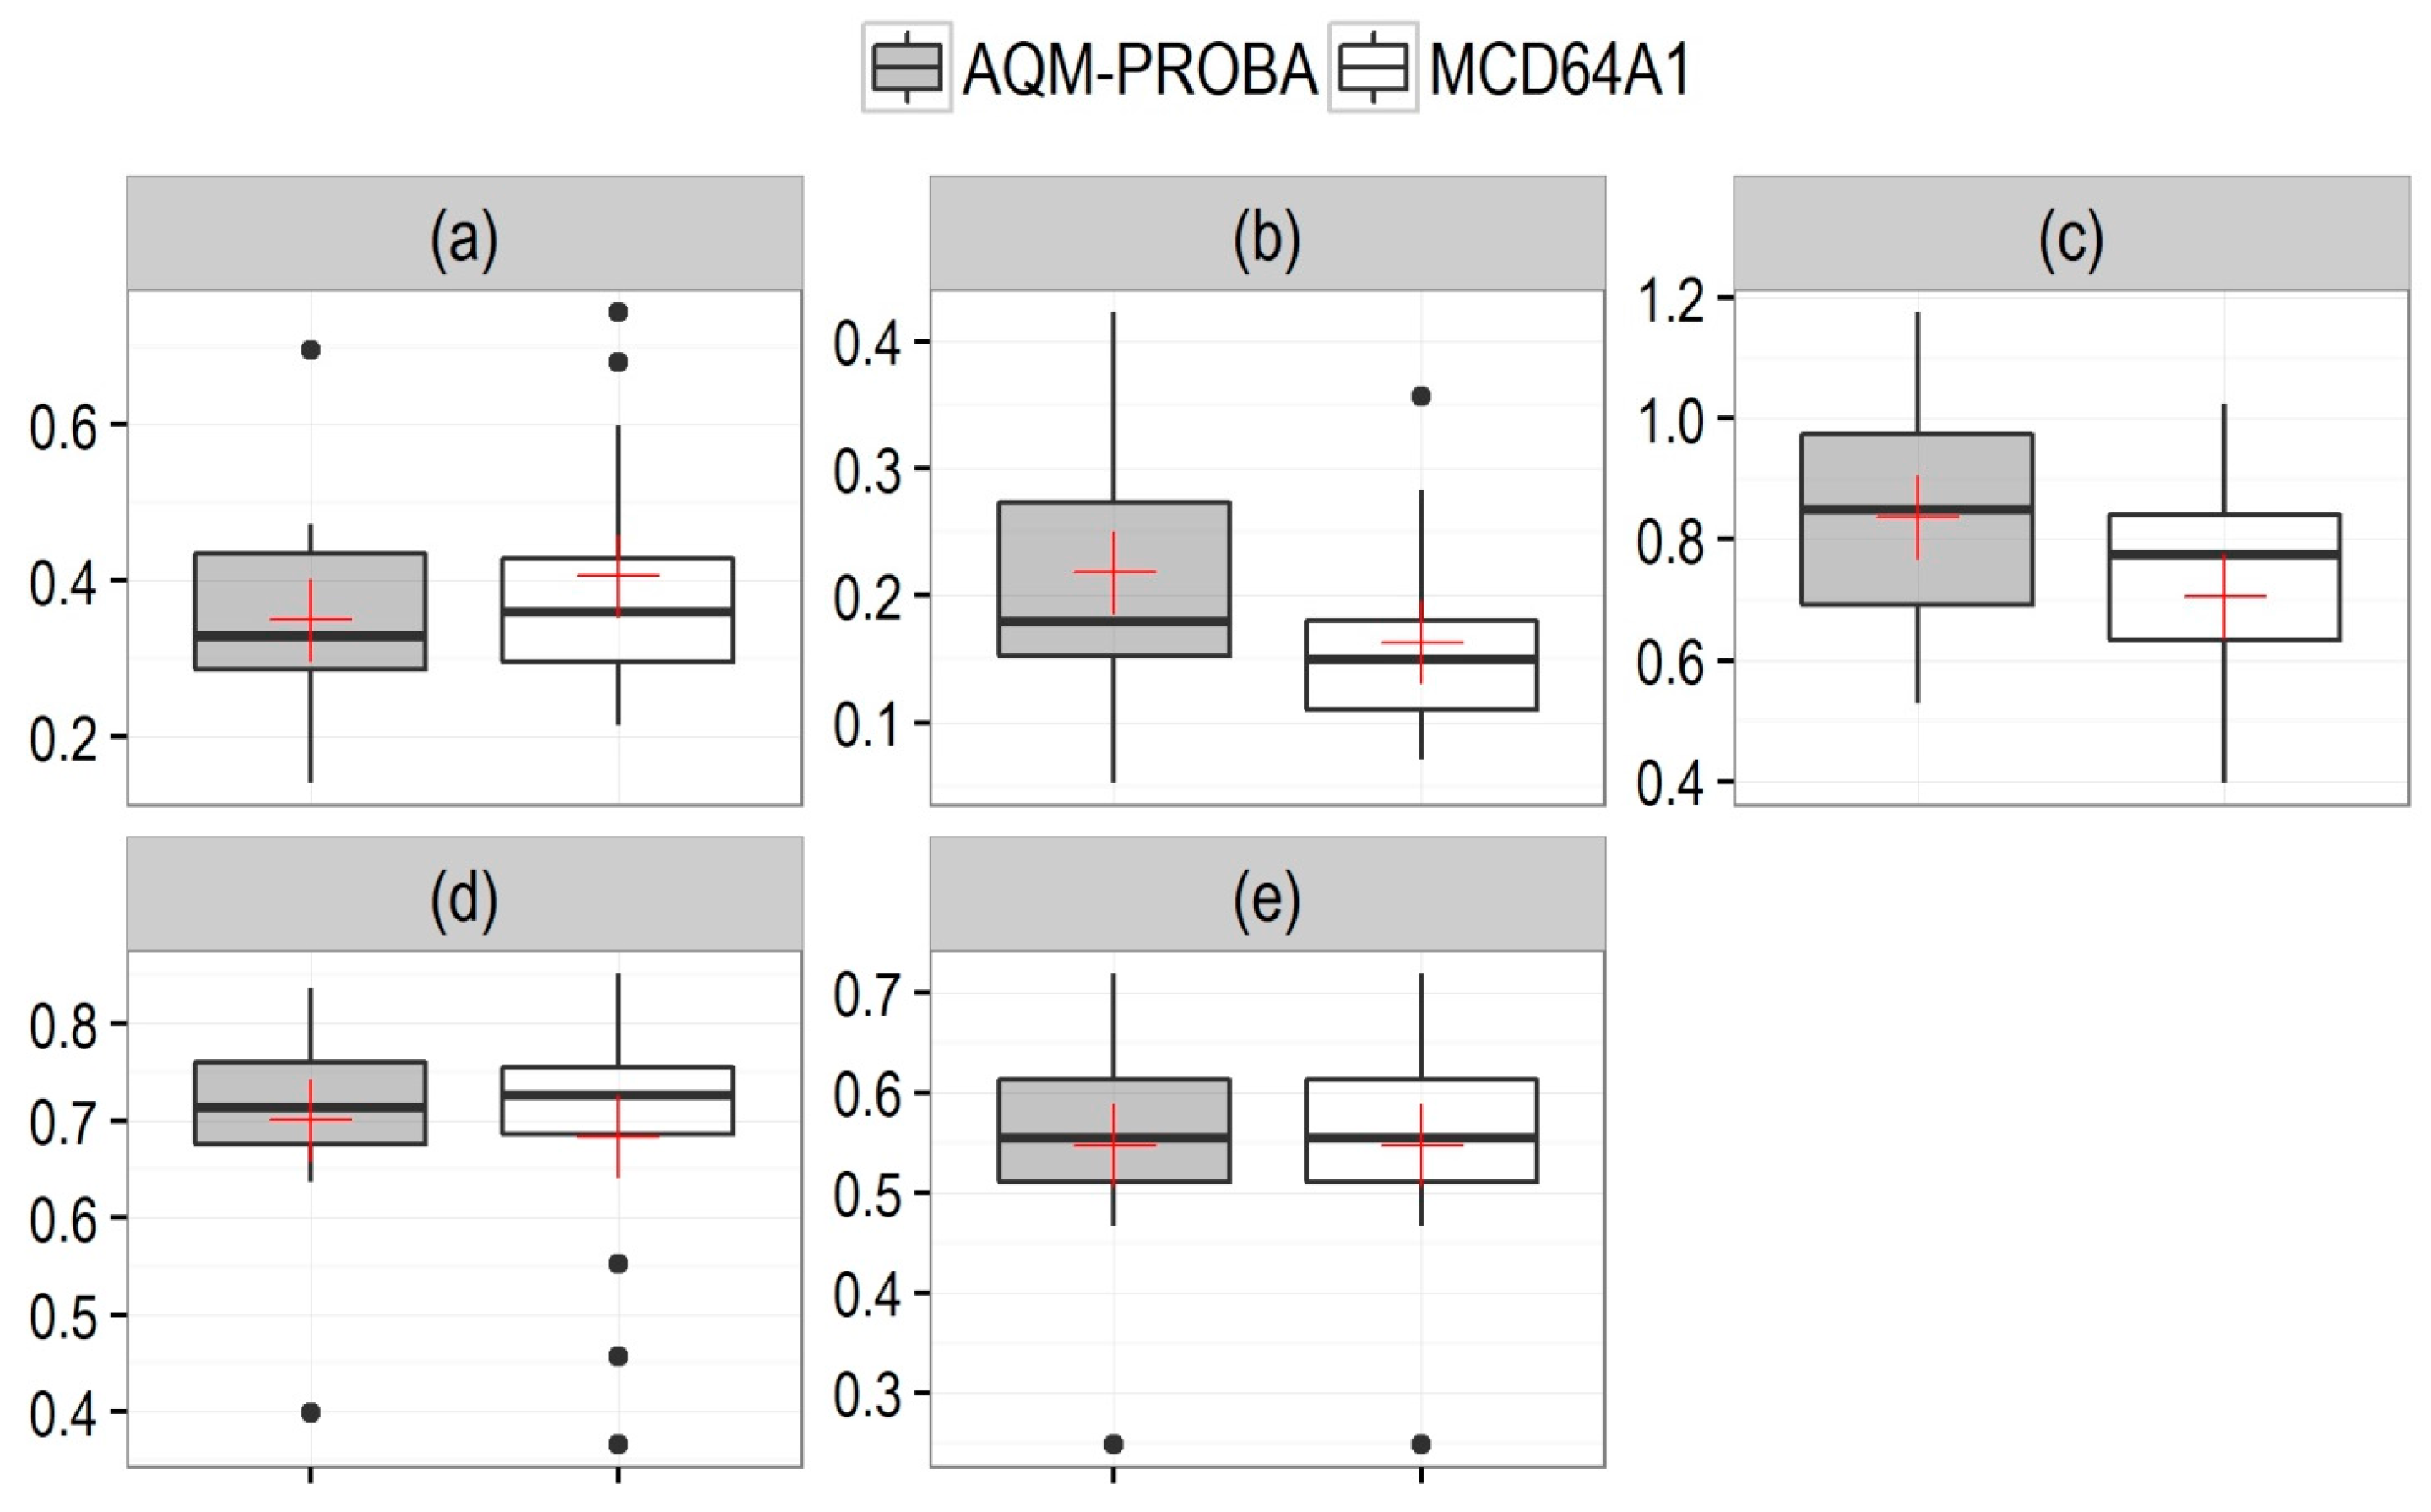
Figure 4 shows boxplots for the accuracy measures of all the L8 scenes, for both BA products. AQM-PROBA yielded higher bias values than MCD64A1 (
Figure 4c), whereas both products showed similar results for DICE and CSI (
Figure 4d,e). AQM-PROBA showed lower mean values of OE (30%) and higher CE (22%) than the MCD64A1 (34% and 15% of OE and CE, respectively).
The verification measures for both products were also assessed individually for each Landsat scene (
Table 4). The highest OE and CE values were recorded for the 221/071 scene, while BIAS values ranged from 0.40 (for MCD64A1 in the scene 221/071) to 1.18 (AQM-PROBA for 219/068). The DICE and CSI coefficients have similar values, with highest values for scenes 219/072, 220/68 and 222/67 (AQM-PROBA) and 219/068, 219/070, 220/067 (AQM-PROBA and MCD64A1).
Rather than presenting just a single value for each verification measure, a confidence interval can be calculated and presented as part of the classification skill. The confidence interval is comprised by the range, which is the lower and upper limit of each metric that can be expected from the classification approach, and by the probability that the verification measures of the classification approach will fall within the range.
Accordingly,
Table 5 indicates the expected range of each metric using a confidence interval of 95%, which means that there is a likelihood of 95% that the confidence interval (lower-upper limits) encompasses the true classification metric on unseen data. The confidence interval results (
Table 5) indicate that if the verification measure were calculated for different reference datasets, the average value of each metric would fall between the lower and upper limits of the interval, with high probability. Thus, the AQM-PROBA yielded better results for the OE, BIAS, DC, CSI verification measures than MCD64A1, which, in turn, has a lower CE.
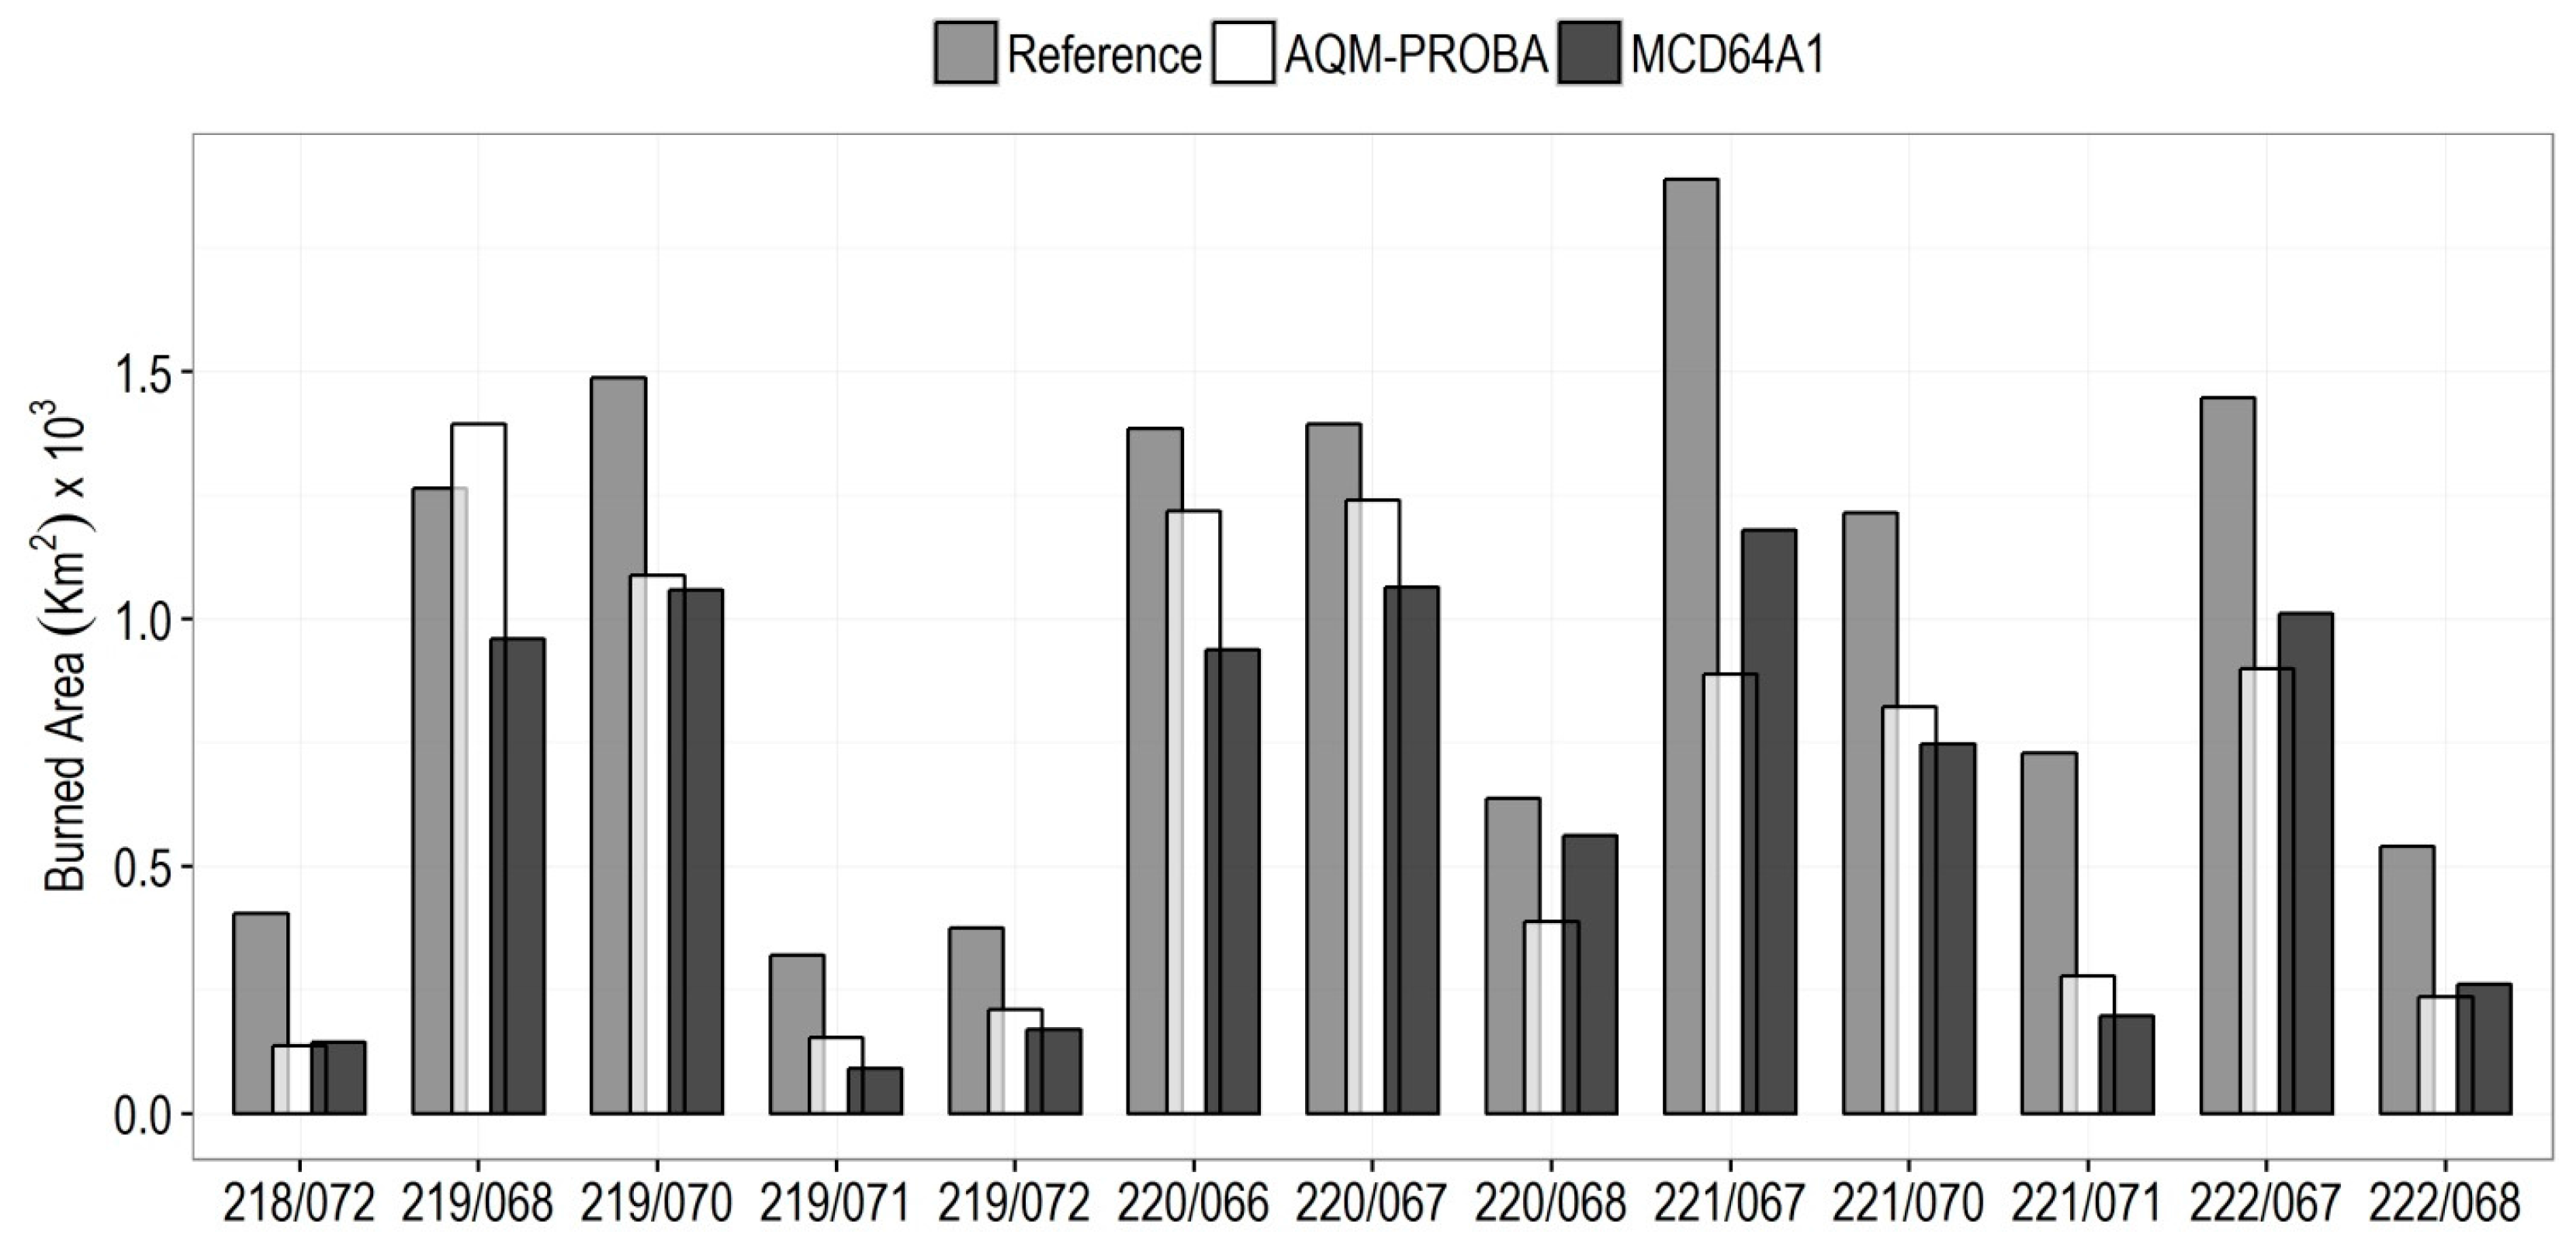
Comparing the total burned area obtained from reference data, AQM-PROBA and MCD64A1 for each Landsat scene it is clear that AQM-PROBA displayed results closer to the reference data than MCD64A1, with the exception of the 220/68, 221/67, 222/67 and 222/68 scenes.
Figure 5 shows different fire patterns among the thirteen analyzed scenes. Three scenes (218/072, 219/071 and 219/072) present less than 400 km
2 of burned area, whereas another three scenes contain approximately 600–750 km
2 of burned area (220/068, 222/068, and 221/071). Finally, the majority (seven scenes, 219/068, 219/070, 220/066, 220/067, 221/067, 221/070 and 222/067) display more than 1200 km
2 of area burned each. While all three BA products show similar spatial behavior, there are significant differences regarding the magnitude of the amount of burned area. On average, the AQM-PROBA and MCD64A1 provide underestimation of BA compared to the reference Landsat. The AQM-PROBA (MCD64A1) product provides greater burned area amount in 8 (5) of the analyzed scenes than MCD64A1 (AQM-PROBA), corroborating the BIAS behavior shown in
Table 4.
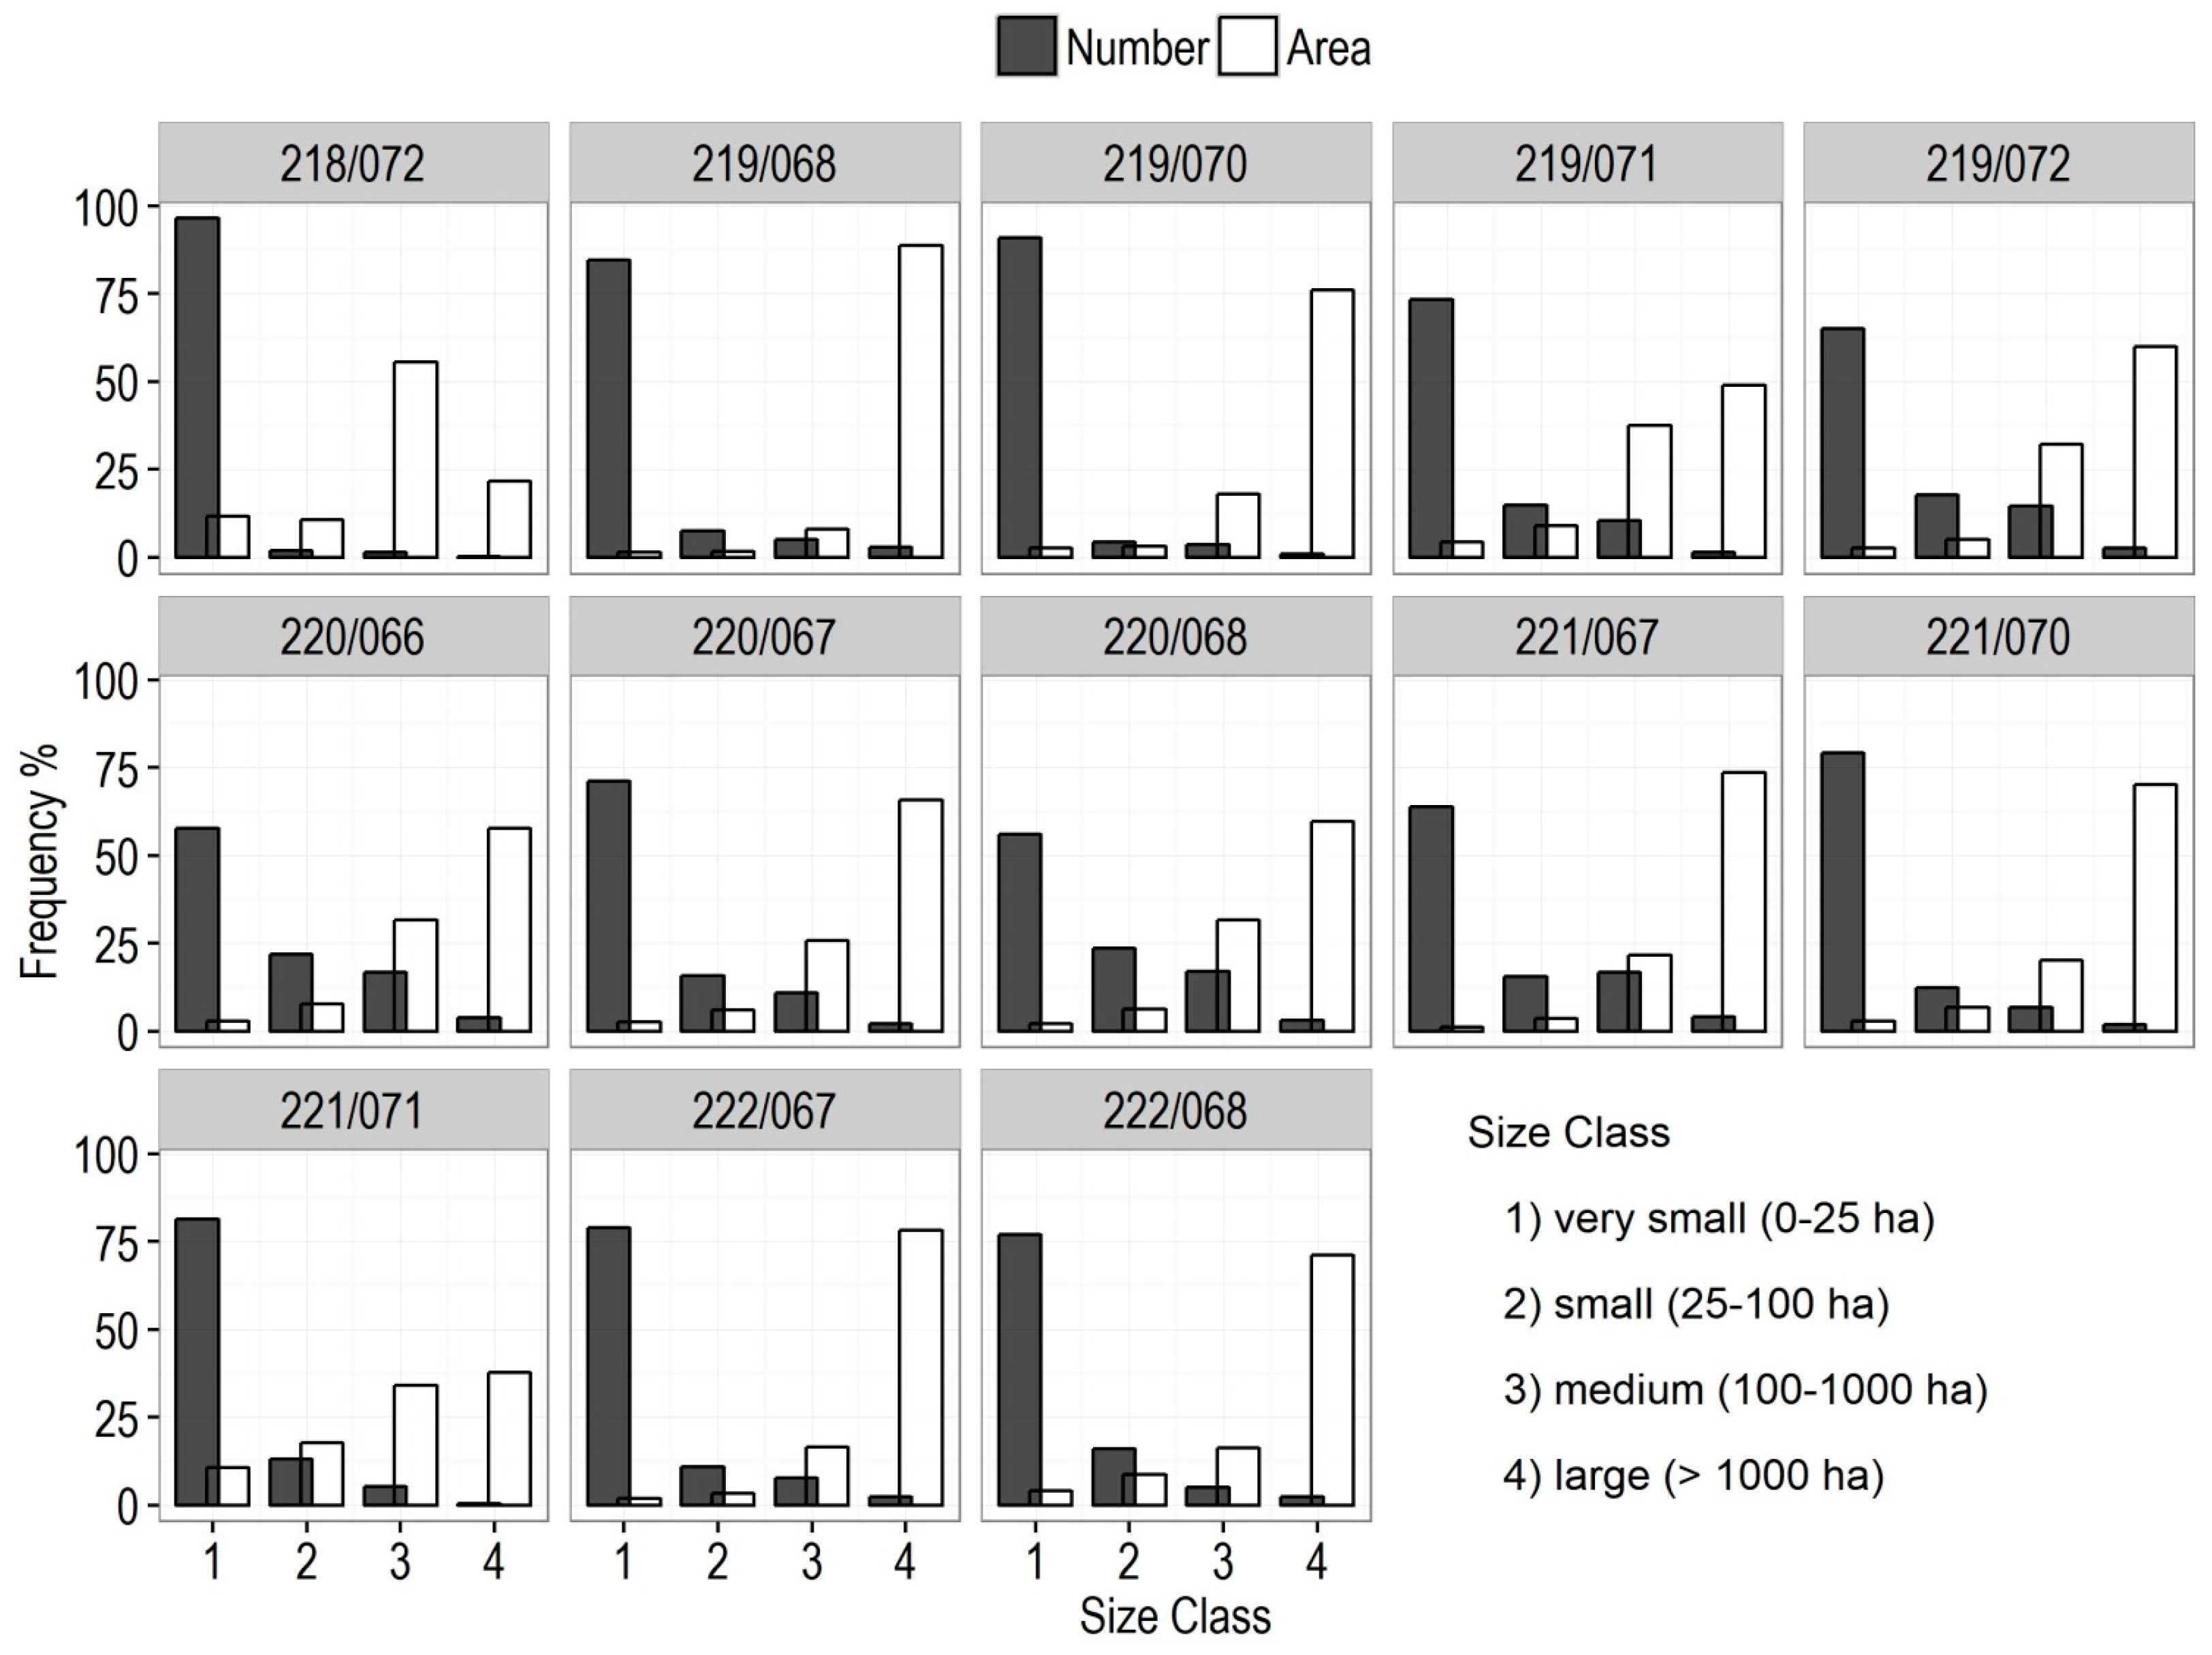
A better insight into the fire pattern of each analyzed scene may be obtained by analyzing the distribution of fire scars size by the corresponding fractions of total number of scars and of total burned area. Accordingly,
Figure 6 shows the reference fire scar size distribution by number of scar categorized into four classes: (1) very small (0–25 ha); (2) small (25–100 ha); (3) medium (100–1000 ha); and (4) large (>1000 ha).
Figure 6 reveals that the region presents a predominance of very small fire scars (class 1), however these scars accounts for less than 5% of the total amount of burned area. Conversely, the highest amount of burned area belongs to large fire scars (class 4, larger than 1000 ha), which in turn, accounts for the lowest number of scars.
The L8 scenes 219/71 and 221/71 showed smaller percent differences in between size classes 100–1000ha and >1000 ha (
Figure 6), in comparison to other scenes. These scenes also displayed high omission error for both products (
Table 4). Nevertheless,
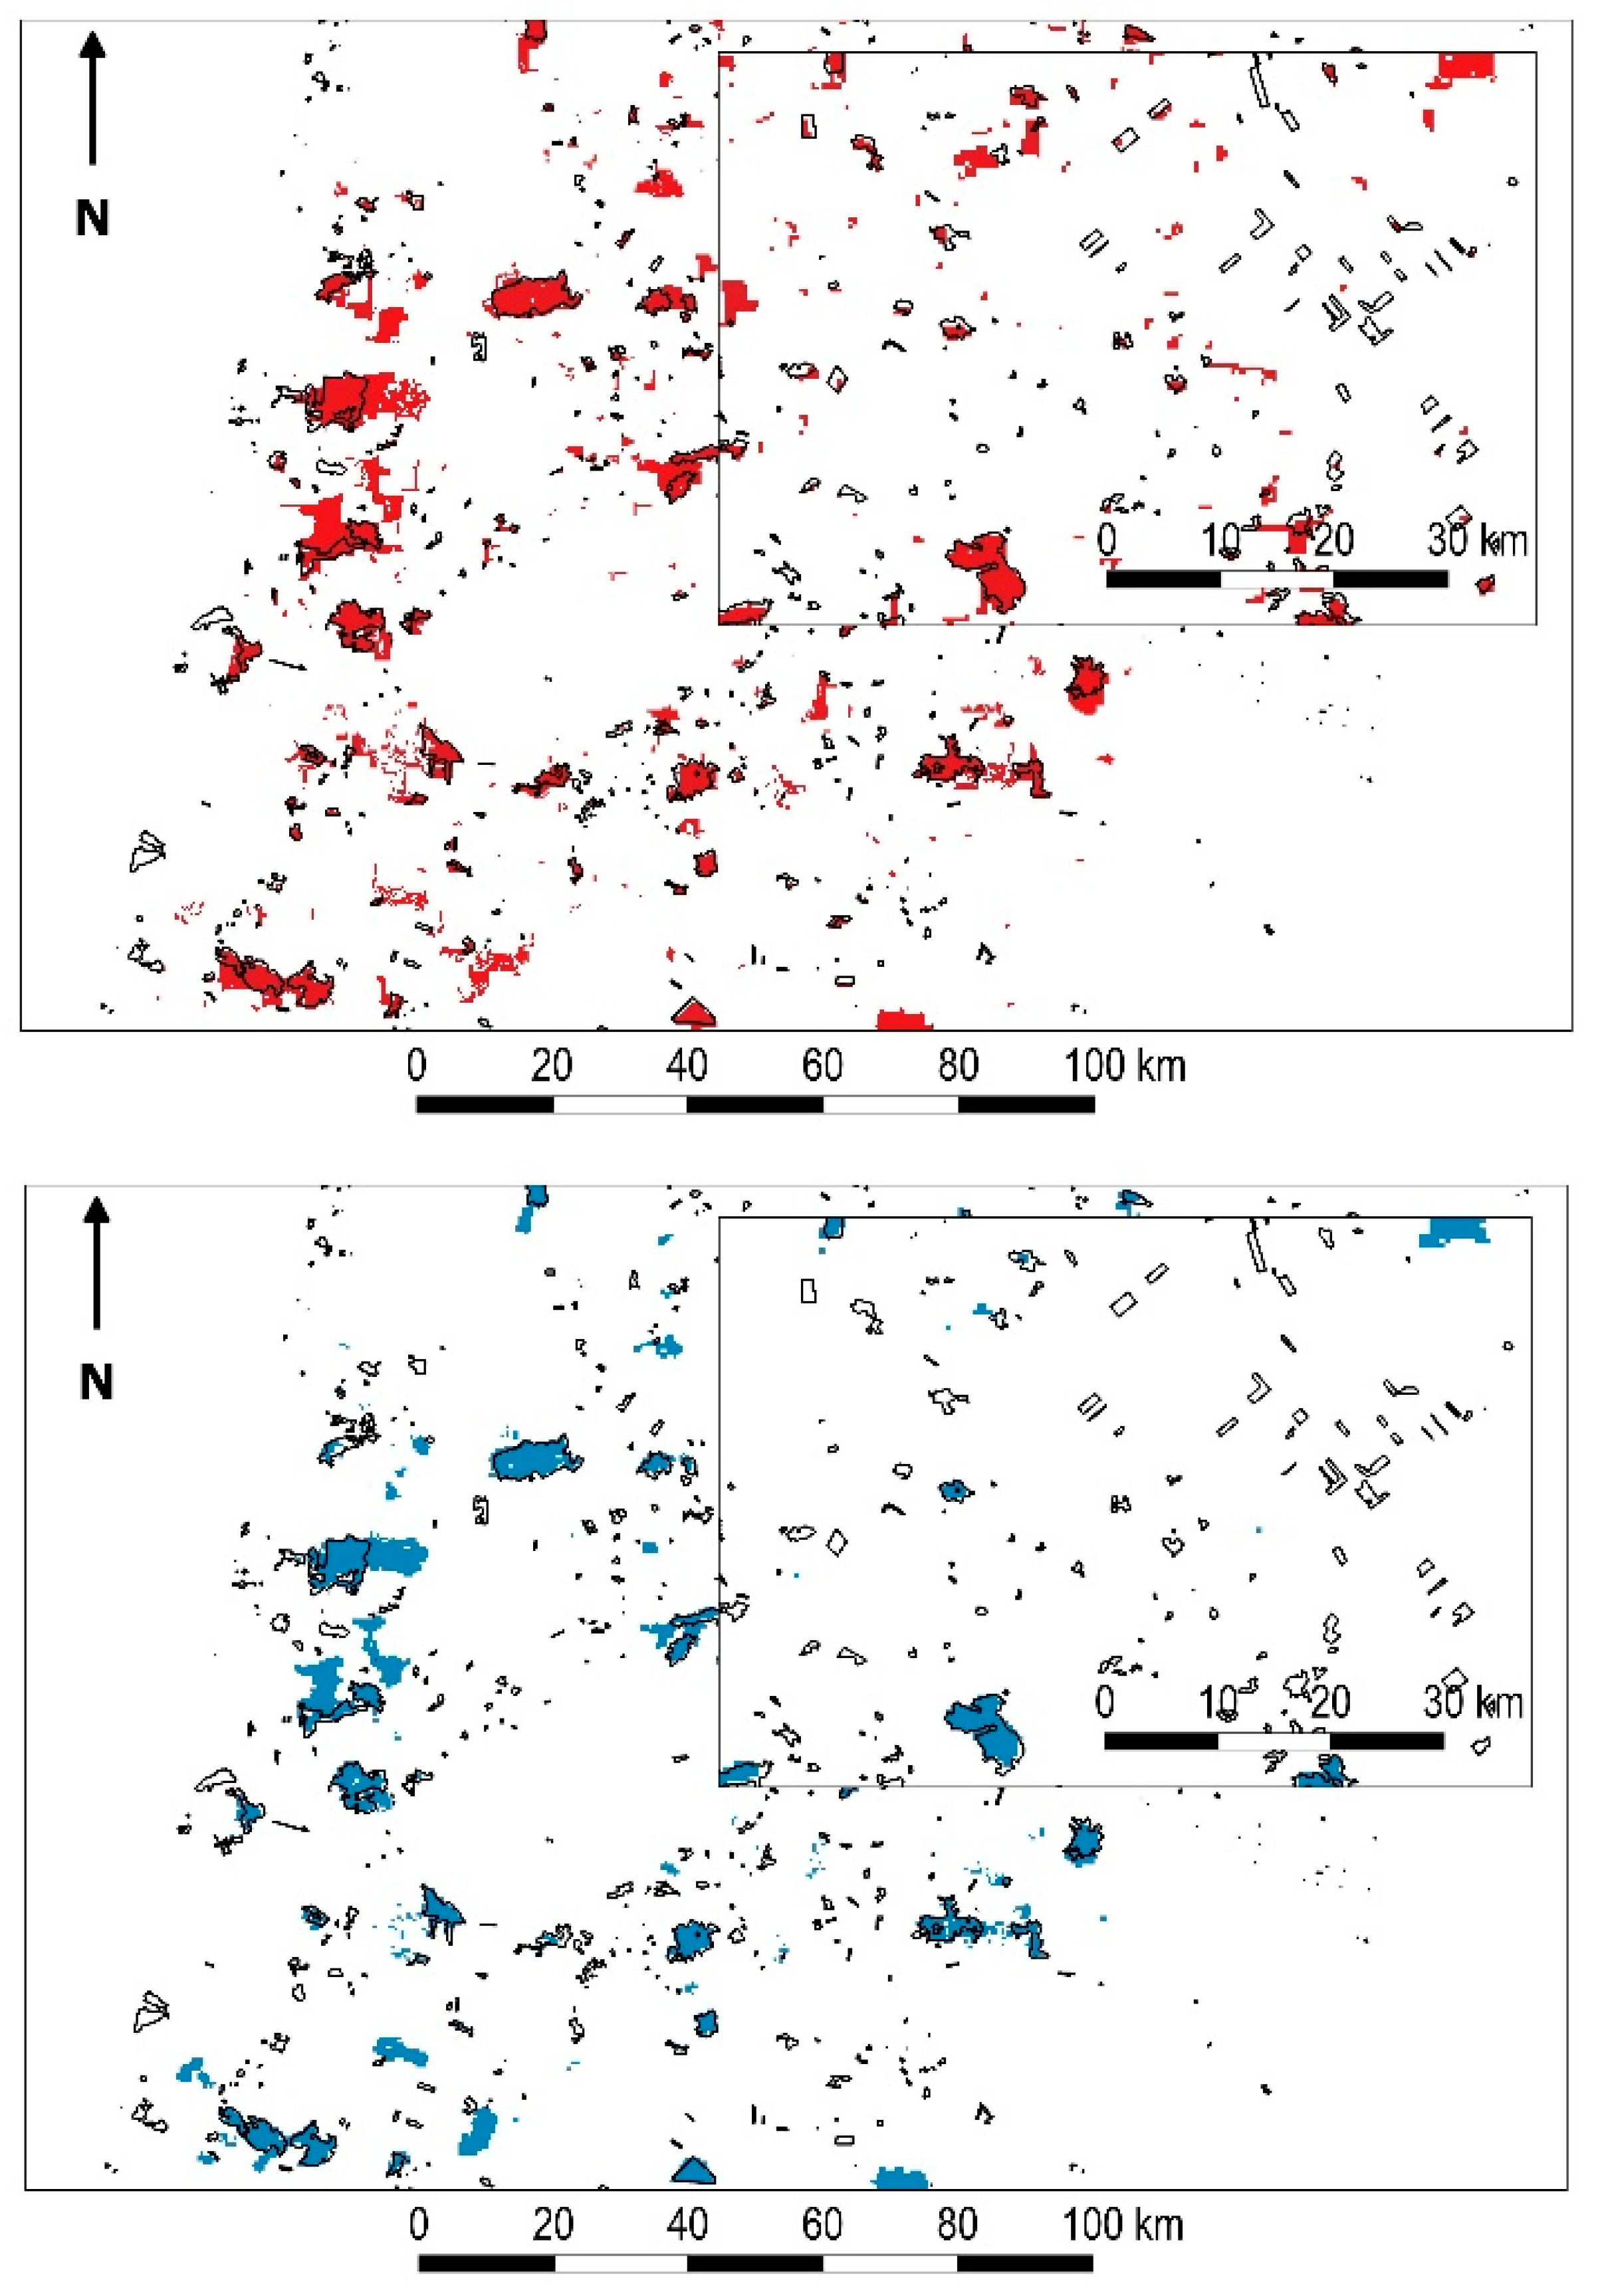
Figure 7 shows that most omissions cases are due to small fire scars (AQM-PROBA in red, MCD64A1 in blue and, black contour represents the reference data).
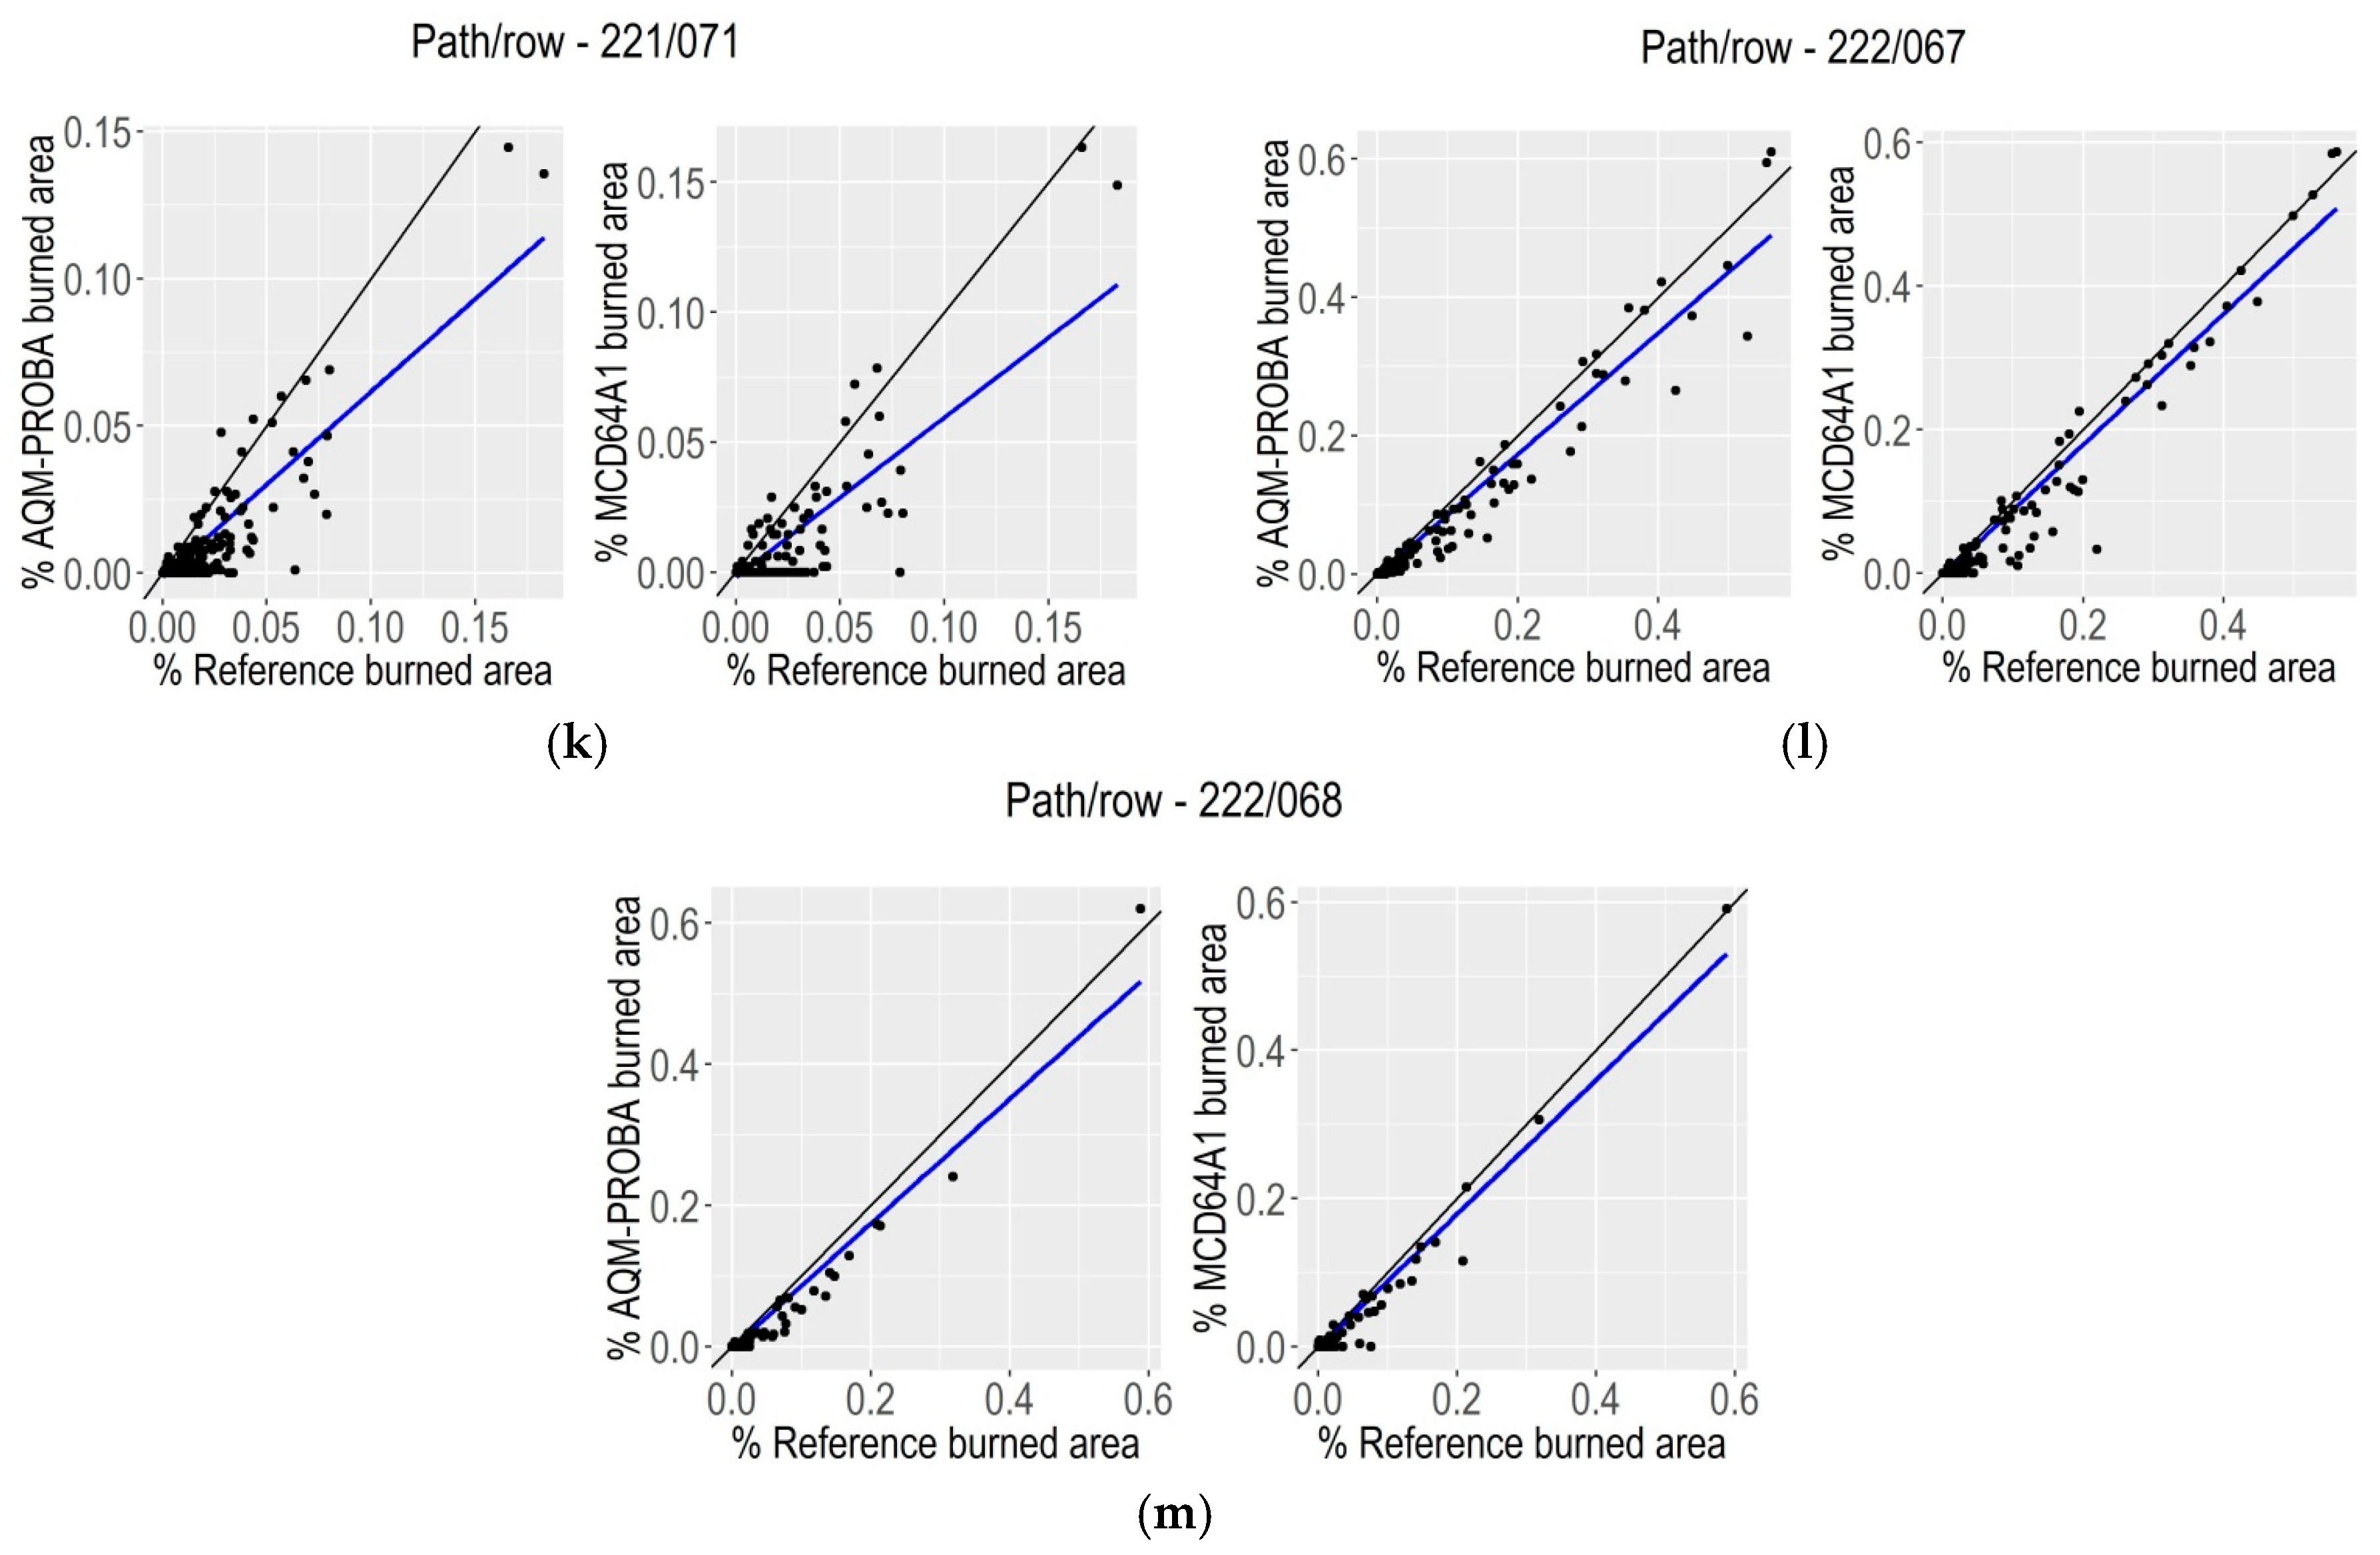
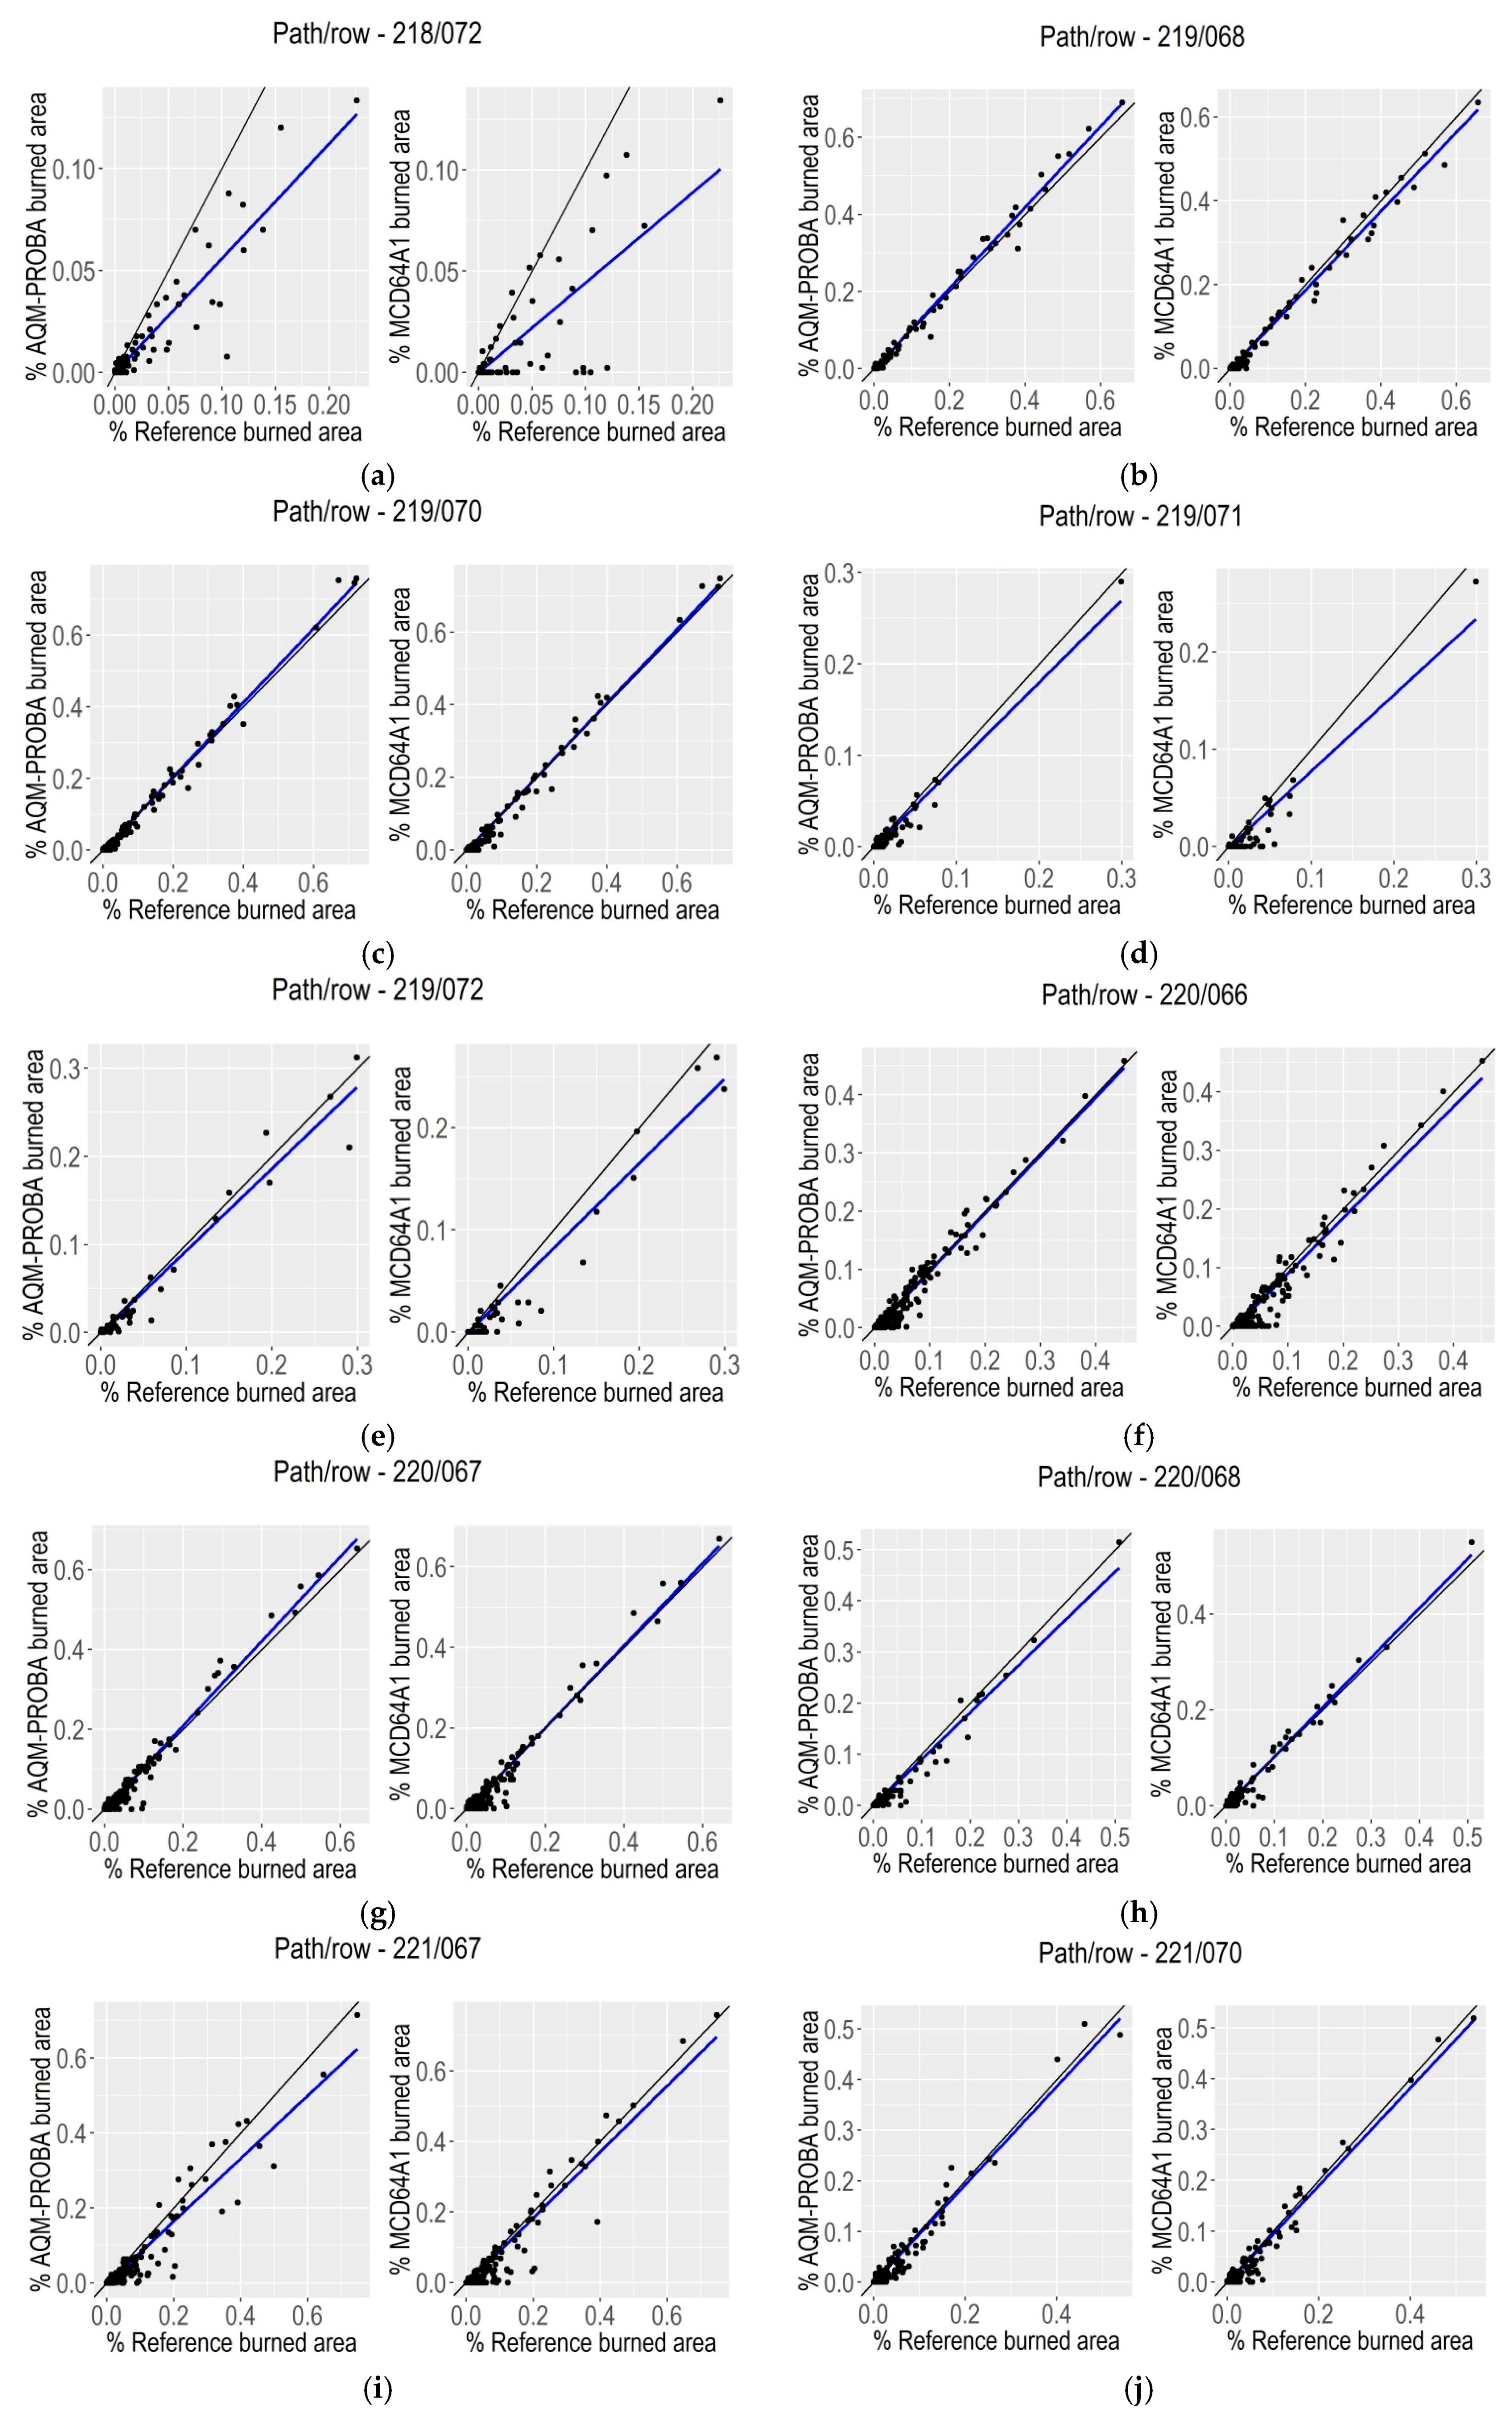
Figure 8 shows the burned area proportions classified in all the Landsat scenes plotted against the proportion classified as burned in the two BA products in a region of 10 by 10 km defined within each reference data scene. For all scenes, the AQM-PROBA showed a greater correlation with the Landsat burned area estimates than the MCD64A1 product. Both BA products underestimate the BA in most cases, except in 219/68, 219/70, 222/67 for AQM-PROBA-V and 220/68 for MCD64A1 (
Figure 8).
Table 6 shows the Kendall correlation index calculated for each product and for each Landsat scene. For AQM-PROBA, the highest Kendall’s correlation was found for scene 220/66 (0.85) and the lowest for scene 218/72 (0.51). For MCD64A1, the best result was found for scene 221/67 (0.72) and the worst for scene 218/72 (0.37). On average, the correlation between AQM-PROBA and the reference map was 0.7, with a standard deviation of 0.09, whereas for MCD64A1 the correlation was 0.56 with a standard deviation of 0.11 (
Table 6).
5. Discussion
Two aspects can be considered in the analysis of omission and commission errors: the first is related to errors along the edges of burn scars, due to the differences in spatial resolution of the datasets, possibly combined with georeferencing errors. The second is related to fires that occurred prior to the date of the first Landsat image, but were detected in the PROBA-V composite after this date, probably due to shortage of cloud-free data. This type of error was also identified in the results of MCD64A1. The uncertainty in detection dates can lead to this type of error in the accuracy assessment [
52].
Although the AQM-PROBA and MCD64A1 products are based on different data derived from different sensors, the divergences in the results presented may reflect the different methodologies applied. Both products use active fire for spectral characterization of burned pixels, but they are different in design. The AQM-PROBA is based on the spectral space of the NIR T2 and NIR T1-T2 values in PROBA-V images, with samples collected by VIIRS active fire, which is used to train the OC-SVM classification model. On the other hand, MCD64A1 uses spectral index data constructed in the NIR-SWIR spectral space (1.6 and 2.1 µm) and cumulative active fire maps to guide the selection of burned and unburned samples and to specify probabilities. In addition, the better spatial resolution of PROBA-V compared to MODIS data and the use of OC-SVDD may have an influence on the detection of smaller fire scars. In the AQM-PROBA product, isolated pixels are excluded from the final result, such that the minimum mapping area is 22 ha. Due to the 500 m spatial resolution of MODIS, the theoretical minimum area mapped by the MCD64A1 would be 50 ha. However, according to previous studies, it is hard to detect burned areas smaller than about 4 to 10 pixels in size [
64]. For instance, the minimum resolution at which MCD64A1 is reliable is 120 ha [
66].
Both products showed the same trend towards larger omission errors and lower correlation with the reference data when small burns dominate the fire size distribution. This is common when comparing images and reference data collected at different spatial resolutions, where the size and irregularity of the targets are determinant for higher omission errors [
5,
7,
15,
52]. The largest omission errors in both burned area products were observed where scars are typically small. Silva et al. [
15] using Satellite Pour l’Observation de la Terre (SPOT) Vegetation data over Africa, mentioned two atypical situations: small burned areas that were sufficiently dark to be detected (low values of NIR reflectance after the fire) and large burned areas that were frequently missed due to a small decrease in NIR reflectance values after the fire. The former case may explain the results obtained with scene 219/072 evaluated in our study. This scene contained small burned areas but yielded a Kendall coefficient of 0.71 for AQM-PROBA, similar to those obtained for areas with larger burns. Besides the presence of small burned areas, scene 218/72 covers a peculiar area where a rugged topography and extensive rock outcrops further complicated burned area detection with low-spatial resolution sensors.
Thus, we show that mapping accuracy is likely to vary significantly in space due to the observed contrast between the distribution of fire size number and area. The extent and fragmentation pattern of burning, namely on the relative importance of small versus large burns, introduces limitations in BA estimation when using coarse spatial resolution sensors. Since the study area is characterized by a high frequency of very small scars (<25 ha), a large number of omission errors was observed due to the coarse resolution of the BA products (500 m for MCD64A1 and 350 m for AQM-PROBA), in some cases leading to a substantial underestimation of total area burned. On the order hand, in regions with predominance of large fire scars, the BA coarse products are quite accurate, and may even lead to slight overestimation. High reflectance values of NIR after the fire may be the reason for the results of scene 221/067, where omission errors were high, despite the occurrence of large burns. One possible cause is the presence of low fuel loadings in the area, and the presence of quartz neosols [
67]. This soil has a whitish color and high reflectance values of the NIR channel due to the presence of sand and quartz in their composition [
68]. Libonati [
7] validated the AQM algorithm for scene 221/067 considering a multi temporal data set spanning a six-year period. This algorithm uses the index W, constructed by the spectral space of the NIR-MIR (middle infrared) spectral region of the MODIS sensor. The AQM algorithm is based on the MODIS MIR channels, suggesting that the use of different channels and indices may produce better results in the area. In this case, the spectral space of the MIR, used in AQM, can have a positive influence.
6. Conclusions
This study highlights the use of a One-Class Support Vector Machine classifier for burned area mapping using automated sample selection based on active fires. The procedure was applied to the Brazilian Savanna using Project for On-Board Autonomy—Vegetation (PROBA-V) reflectance and Visible Infrared Imaging Radiometer Suite (VIIRS) active fire data. Nevertheless, we must highlight that although the present study has used PROBA-V images and VIIRS active fire data, the approach may be easily adapted to other data sources.
Validation results using Landsat reference data, and a comparison with the MCD64A1 burned area product (MODIS/Terra and Aqua Burned Area Monthly L3 Global 500 m) showed a higher accuracy of the current algorithm in the Brazilian Cerrado. In general, the AQM-PROBA presented lower omission error compared with the MCD64A1 product, but the latter displayed lower commission errors. However, the AQM-PROBA displayed more balanced values of omission and commission and, consequently, a bias closer to 1 and a higher correlation with the fire reference data. Higher similarity was also observed between reference and AQM-PROBA for fire scars smaller than 100 ha.
One of the limitations of the presented methodology is the spectral limitation of the PROBA-V sensor, which has only four channels. Several studies have shown that the spectral space of short wave infra-red and middle infra-red channels in savanna areas is advantageous, especially at the 2.1 and 3.9 μm wavelengths, respectively [
69,
70,
71,
72,
73]. Thus, the implementation of the approach presented herein with spectral indexes presenting greater separability between burned and unburned surfaces may improve the results. Considering that burned areas in the Cerrado tend to show an increase in temperature after the fire occurrence [
74], another alternative to improve burned area detection may involve the use of thermal data.
Finally, the proposed methodology based on the use of one-class algorithms opens new perspectives on fire scar detection, since current burned area algorithms based on hybrid approaches are still hampered by the accuracy of active fire products. Moreover, the results of this study have demonstrated that the technique of automated sample selection based on active fires as proposed here produced accurate and promising results for burned area mapping, circumventing the need for human intervention in sample acquisition.

 ,
, 


