Article

Performance of Three MODIS Fire Products (MCD45A1, MCD64A1, MCD14ML), and ESA Fire_CCI in a Mountainous Area of Northwest Yunnan, China, Characterized by Frequent Small Fires

1
Institute of Eastern-Himalaya Biodiversity Research, Dali University, Hongsheng Rd. 2, Dali 671003, China
2
Institute for Environmental Sciences, University of Geneva, 66 Boulevard Carl Vogt, 1205 Geneva, Switzerland
3
Collaborative Innovation Center for Biodiversity and Conservation in the Three Parallel Rivers Region of China, Dali 671003, China
*
Author to whom correspondence should be addressed.
Remote Sens. 2017, 9(11), 1131; https://doi.org/10.3390/rs9111131
Submission received: 8 September 2017 / Revised: 11 October 2017 / Accepted: 1 November 2017 / Published: 6 November 2017
(This article belongs to the Special Issue Mountain Remote Sensing)

Abstract

:
An increasing number of end-users looking for ground data about fire activity in regions where accurate official datasets are not available adopt a free-of-charge global burned area (BA) and active fire (AF) products for applications at the local scale. One of the pressing requirements from the user community is an improved ability to detect small fires (less than 50 ha), whose impact on terrestrial environments is empirically known but poorly quantified, and is often excluded from global earth system models. The newest generation of BA algorithms combines the capabilities of both the BA and AF detection approaches, resulting in a general improvement of detection compared to their predecessors. Accuracy assessments of these products have been done in several ecosystems; but more complex ones, such as regions that are characterized by frequent small fires and steep terrain has never been assessed. This study contributes to the understanding of the performance of global BA and AF products with a first assessment of four selected datasets: MODIS-based MCD45A1; MCD64A1; MCD14ML; and, ESA’s Fire_CCI in a mountainous region of northwest Yunnan; P.R. China. Due to the medium to coarse resolution of the tested products and the reduced sizes of fires (often smaller than 50 ha) we used a polygon intersection assessment method where the number and locations of fire events extracted from each dataset were compared against a reference dataset that was compiled using Landsat scenes. The results for the two sample years (2006 and 2009) show that the older, non-hybrid products MCD45A1 and, MCD14ML were the best performers with Sørensen index (F1 score) reaching 0.42 and 0.26 in 2006, and 0.24 and 0.24 in 2009, respectively, while producer’s accuracies (PA) were 30% and 43% in 2006, and 16% and 47% in 2009, respectively. All of the four tested products obtained higher probabilities of detection when smaller fires were excluded from the assessment, with PAs for fires bigger than 50 ha being equal to 53% and 61% in 2006, 41% and 66% in 2009 for MCD45A1 and MCD14ML, respectively. Due to the technical limitations of the satellites’ sensors, a relatively low performance of the four products was expected. Surprisingly, the new hybrid algorithms produced worse results than the former two. Fires smaller than 50 ha were poorly detected by the products except for the only AF product. These findings are significant for the future design of improved algorithms aiming for increased detection of small fires in a greater diversity of ecosystems.

Graphical Abstract

1. Introduction

Since its first appearance soon after plants colonized the bare earth, fire has been an important natural disturbance and evolutionary force, playing a key role in shaping the spatial distribution of ecosystems and their composition [1,2,3]. Without fire, the vegetation cover of our planet would be very different to its current condition, with almost double the forest cover but less diverse ecosystems [4]. For this reason, it is very important to include fire in ecosystem modeling and to understand the past, present, and future role of fire regimes under changing climate conditions [5]. Fire regime is becoming a key concept in many scientific domains and its definition and interpretation is still a source of debates between scientists, in particular about which parameter in describing fire regimes should be taken into account [6]. The main parameters needed to understand the fire regimes of a given region are the spatial and temporal distribution patterns of burning, for which accurate data about the location and the date of fire events is required. Before the advent of satellite data, several countries have systematically recorded fire events in local, provincial, and national registries, and then organized those events in centralized databases, for example the Canadian National Fire Database (http://cwfis.cfs.nrcan.gc.ca/ha/nfdb, last accessed on 25 September 2017) or Switzerland’s Swissfire database (http://www.wsl.ch/swissfire/index_EN, last accessed on 25 September 2017). Official fire inventories are in general owned by government agencies and, unfortunately, not always freely accessible by the public. Moreover, especially for remote and less populated areas, data about historic fire events are often incomplete or inaccurate [7]. In China, the only official and publicly available ground-based data from the government is published in the China Statistical Yearbooks and China Forestry Statistical Yearbooks (partially available at http://www.stats.gov.cn/english/Statisticaldata/AnnualData/, last accessed on 25 September 2017). Basic information, such as total burned area, number of fire events, severity rank, and ignition sources are grouped yearly at the provincial level. However, locations are not provided except for a few particularly severe fire events. Unfortunately, the provincial scale of this data is not suitable for regional or local studies. Besides, past research comparing data found in Statistical Yearbooks with data extracted from satellite reported considerable differences in the estimations of burned areas, with a general tendency for underestimation by the Statistical Yearbooks [8].
In recent years, earth observation using sensors on board space-borne satellites has provided useful raw data to detect and monitor active fires and extract burned land patches, not only at national or larger geographic scales but also at the continental and global scales [9,10,11]. The availability of free-of-charge, global scale active fire (AF) and burned area (BA) products such as the MODIS derived products [12] has significantly increased the interest of global community end-users in their adoption for regional to local applications, especially in areas where ground data are lacking or are not publicly available [9]. Global AF algorithms use thermal sensors to detect unusual thermal signatures from ongoing fires, and, when this signal is very strong, they are quite reliable. However, detection is only possible during satellite overpass over the area that is burning, while clouds and dense smoke caused by fires may compromise their detection [13,14]. Examples of global AF detection products include the ATSR Word Fire Atlas product [15] and MODIS MCD14 [16,17]. Global BA products algorithms are designed to capture abrupt changes between pre- and post- fire reflectances that are caused by the altering effect of burning on the biomass and the deposit of char and ash on the ground. The resulting burn scars are more persistent in time than the thermal signatures of ongoing fires, but not always easy to detect or distinguish from other disturbances when burn severities are low. Among global BA products, the European Space Agency (ESA) produced GLOBSCAR for the year 2000, using data from the ERS-2 and ATSR-2 sensors [18]. ESA also developed the GBA2000 project [19] and its modified version, the L3JRC project [20], based on SPOT-VEGETATION data at 1 km resolution. The algorithms of these two products were combined with the GLOBSCAR algorithm to produce the GlobCarbon BA [21,22], a multi-sensor approach that covers a longer time period (1998–2007). ESA’s most recent BA algorithm was designed for ENVISAT’s MERIS sensor, which offers spectral bands in the visible and near infrared spectrum at a spatial resolution of 300 m. This latter BA product is called Fire_CCI [23]. Furthermore, NASA’s satellites Terra and Aqua are equipped with the MODIS sensors, whose data has been used to produce the MCD45 [13,24] and MCD64 [25] global BA products. The latter was integrated in the Global Fire Emission Database version 4 (GFED4), which is widely used for atmospheric and biogeochemical models [26,27]. The MODIS fire products are appreciated by the end-user for their user-friendly access and manipulation, their relatively high spatial resolution (500–1000 m), and their reliability [9,28]. Several alternative, hybrid, multi-sensor approaches can be found in the literature [29,30,31,32], but, for the moment, those methods have not yet delivered a final, ready-to-use product.
Satellite images are acquired using different types of sensors having different specs in terms of spatial, spectral, and temporal resolution. Consequently, the interpretation of burned vs. unburned pixels can potentially be very different among BA and AF algorithms. Comparative analyses and validation research have shown that, in dissimilar ecosystems, the performance of global AF, and BA products varies considerably [27,33,34,35,36,37]. To improve the regional discrimination of burned land, some authors proposed ecosystem specific algorithms that have adapted to these medium to coarse resolution sensors. For example, Bastarrika et al. [38] developed a new automatic burned area mapping algorithm based on MODIS time series for the Mediterranean ecosystem, obtaining higher accuracy (kappa = 0.846) and a lower omission error (17.1%) than the standard MCD45 product (kappa = 0.704, omission error = 38.6%). Chuvieco et al. [39] produced a 23-years long time series of burned land using 10-day composites of NOAA-AVHRR data in boreal forests; Merino-de-Miguel et al. used MODIS products in Galicia [40]; and, other studies employed MODIS products in western United States, Latin America, and northeast China [41,42,43,44].
All of the above-mentioned global BA and AF products have been widely validated for the main fire-prone biomes, such as boreal forests, Mediterranean scrub and pine forests, tropical forests, woody savannas, and grasslands [29,35,42,45,46,47,48,49], but alpine ecosystems have never been assessed. The major difficulty and biggest challenge for remote sensing analysts working in alpine environments is presented by the rugged terrain, featuring different degrees of slope and aspect, and heterogeneous landscapes. When modeling mountainous environments on 2-dimensional surfaces, important distortions are inevitably introduced. For example, linear distances on slopes are different than on flat land, affecting density maps, area calculations, and cost-distance analysis. Sun angle and relief affect illumination patterns, creating shadows that greatly reduce the intensity of spectral signals. Moreover, the extremely diversified and patchy landcover/land use mosaics which characterize remote and mountainous regions make their classification very difficult, requiring finer resolution data [50,51].
In this study, we assess the performance of selected global AF and BA products in a mountainous region of northwest Yunnan (NWY), China. Remote and mountainous areas provide high values of ecosystem services, which are also the most highly vulnerable due to human-induced threats [52]. NWY is one of the most biologically diverse temperate regions on earth, hosting a high variety of climates and natural habitats. Because of the rich biodiversity, high rate of endemism, and rare ecosystems, the region has been recognized as a global biodiversity hotspot [53,54] and one of its protected areas complex, the Three Parallel Rivers of Yunnan Protected Areas, is inscribed in the UNESCO World Heritage Sites list (http://whc.unesco.org/en/list/1083, last accessed on 25 September 2017). Among the most famous flag-species, we mention the endemic Yunnan Snub-nosed Monkey (Rhinopithecus bieti) and migratory birds like the Black-necked Crane (Grus nigricollis). The region is also known for its rich cultural heritage. More than 14 ethnic minority groups inhabit the region and interact with the environment in different ways, varying from shifting cultivation, intensive agriculture, fishing and hunting, gathering of forest products, and transhuman grazing. As the human population grows, threats to environment and biodiversity continue to increase [55]. Among the main impacting factors, forest fires cause direct destruction of forests and increase habitat fragmentation. The long-term impact of forest fires in this delicate ecosystem is largely unknown and no rigorous assessment of historical fire activity in the region has been done yet. The fire season in NWY lasts from December to May, during the dry and windy season. About 99% of forest fires whose ignition sources have been identified are human-caused, mainly due to the use of fire in agriculture and accidental starts, fire for heating and cooking, burning incense in graveyards, etc. [56,57]. Because of the complexity of topography and the mosaic of landscapes, the size of fires is often very small compared to other areas of China [56,58,59,60,61,62,63]. Similarly, the natural habitats of the region are highly fragmented or reduced to small niches, highly vulnerable to disturbances. Consequently, even small fires can have disastrous effects such as potentially wipe away entire ecosystems.
In order to improve the resources management and maintain the ecosystem services in the steep mountainous region of NWY, there is the pressing need to set up a database of historical fire events that will be used as input data for effective risk assessment models. To serve this purpose, we evaluated the potential of global fire products to detect fire events in NWY. We selected those products with the most suitable features in terms of spatial resolution and temporal span, and compared them with a reference dataset based on visual interpretation of Landsat TM scenes. The chosen products were: MODIS’s MCD45A1, MCD64A1, MCD14ML; and, ESA’s Fire_CCI. A detailed description of each product is provided in the next section. Based on our results, we cross-compared burned areas obtained from the best BA product with those obtained from the only pure AF products (MCD14ML), in order to evaluate the potential use of a merged AF and BA product similar to the ones proposed by Randerson et al. [32] or Tsela et al. [29]. Because of the medium-to-coarse resolution of the selected datasets, a relatively big rate of errors of detection of small fires (<50 ha) is very likely to occur. Small fires may cover only a fraction of the product’s pixel and the heterogeneity of burn severities may reduce the spectral signal left by the burn scar, reducing the probability of detection. In the case of the products using AF approaches, small fires’ duration may be too short to be detected. Previous studies reported larger errors of omission for small fires (e.g., [25,29,45,47,56]). The main aim of this study is to identify which product performs the best and to judge its suitability for applications that require a more accurate and quantified measure of fire activity. The best dataset could be used to generate seeds or as a control data for the accuracy assessment of future regions-specific algorithms.

2. Data and Methodology

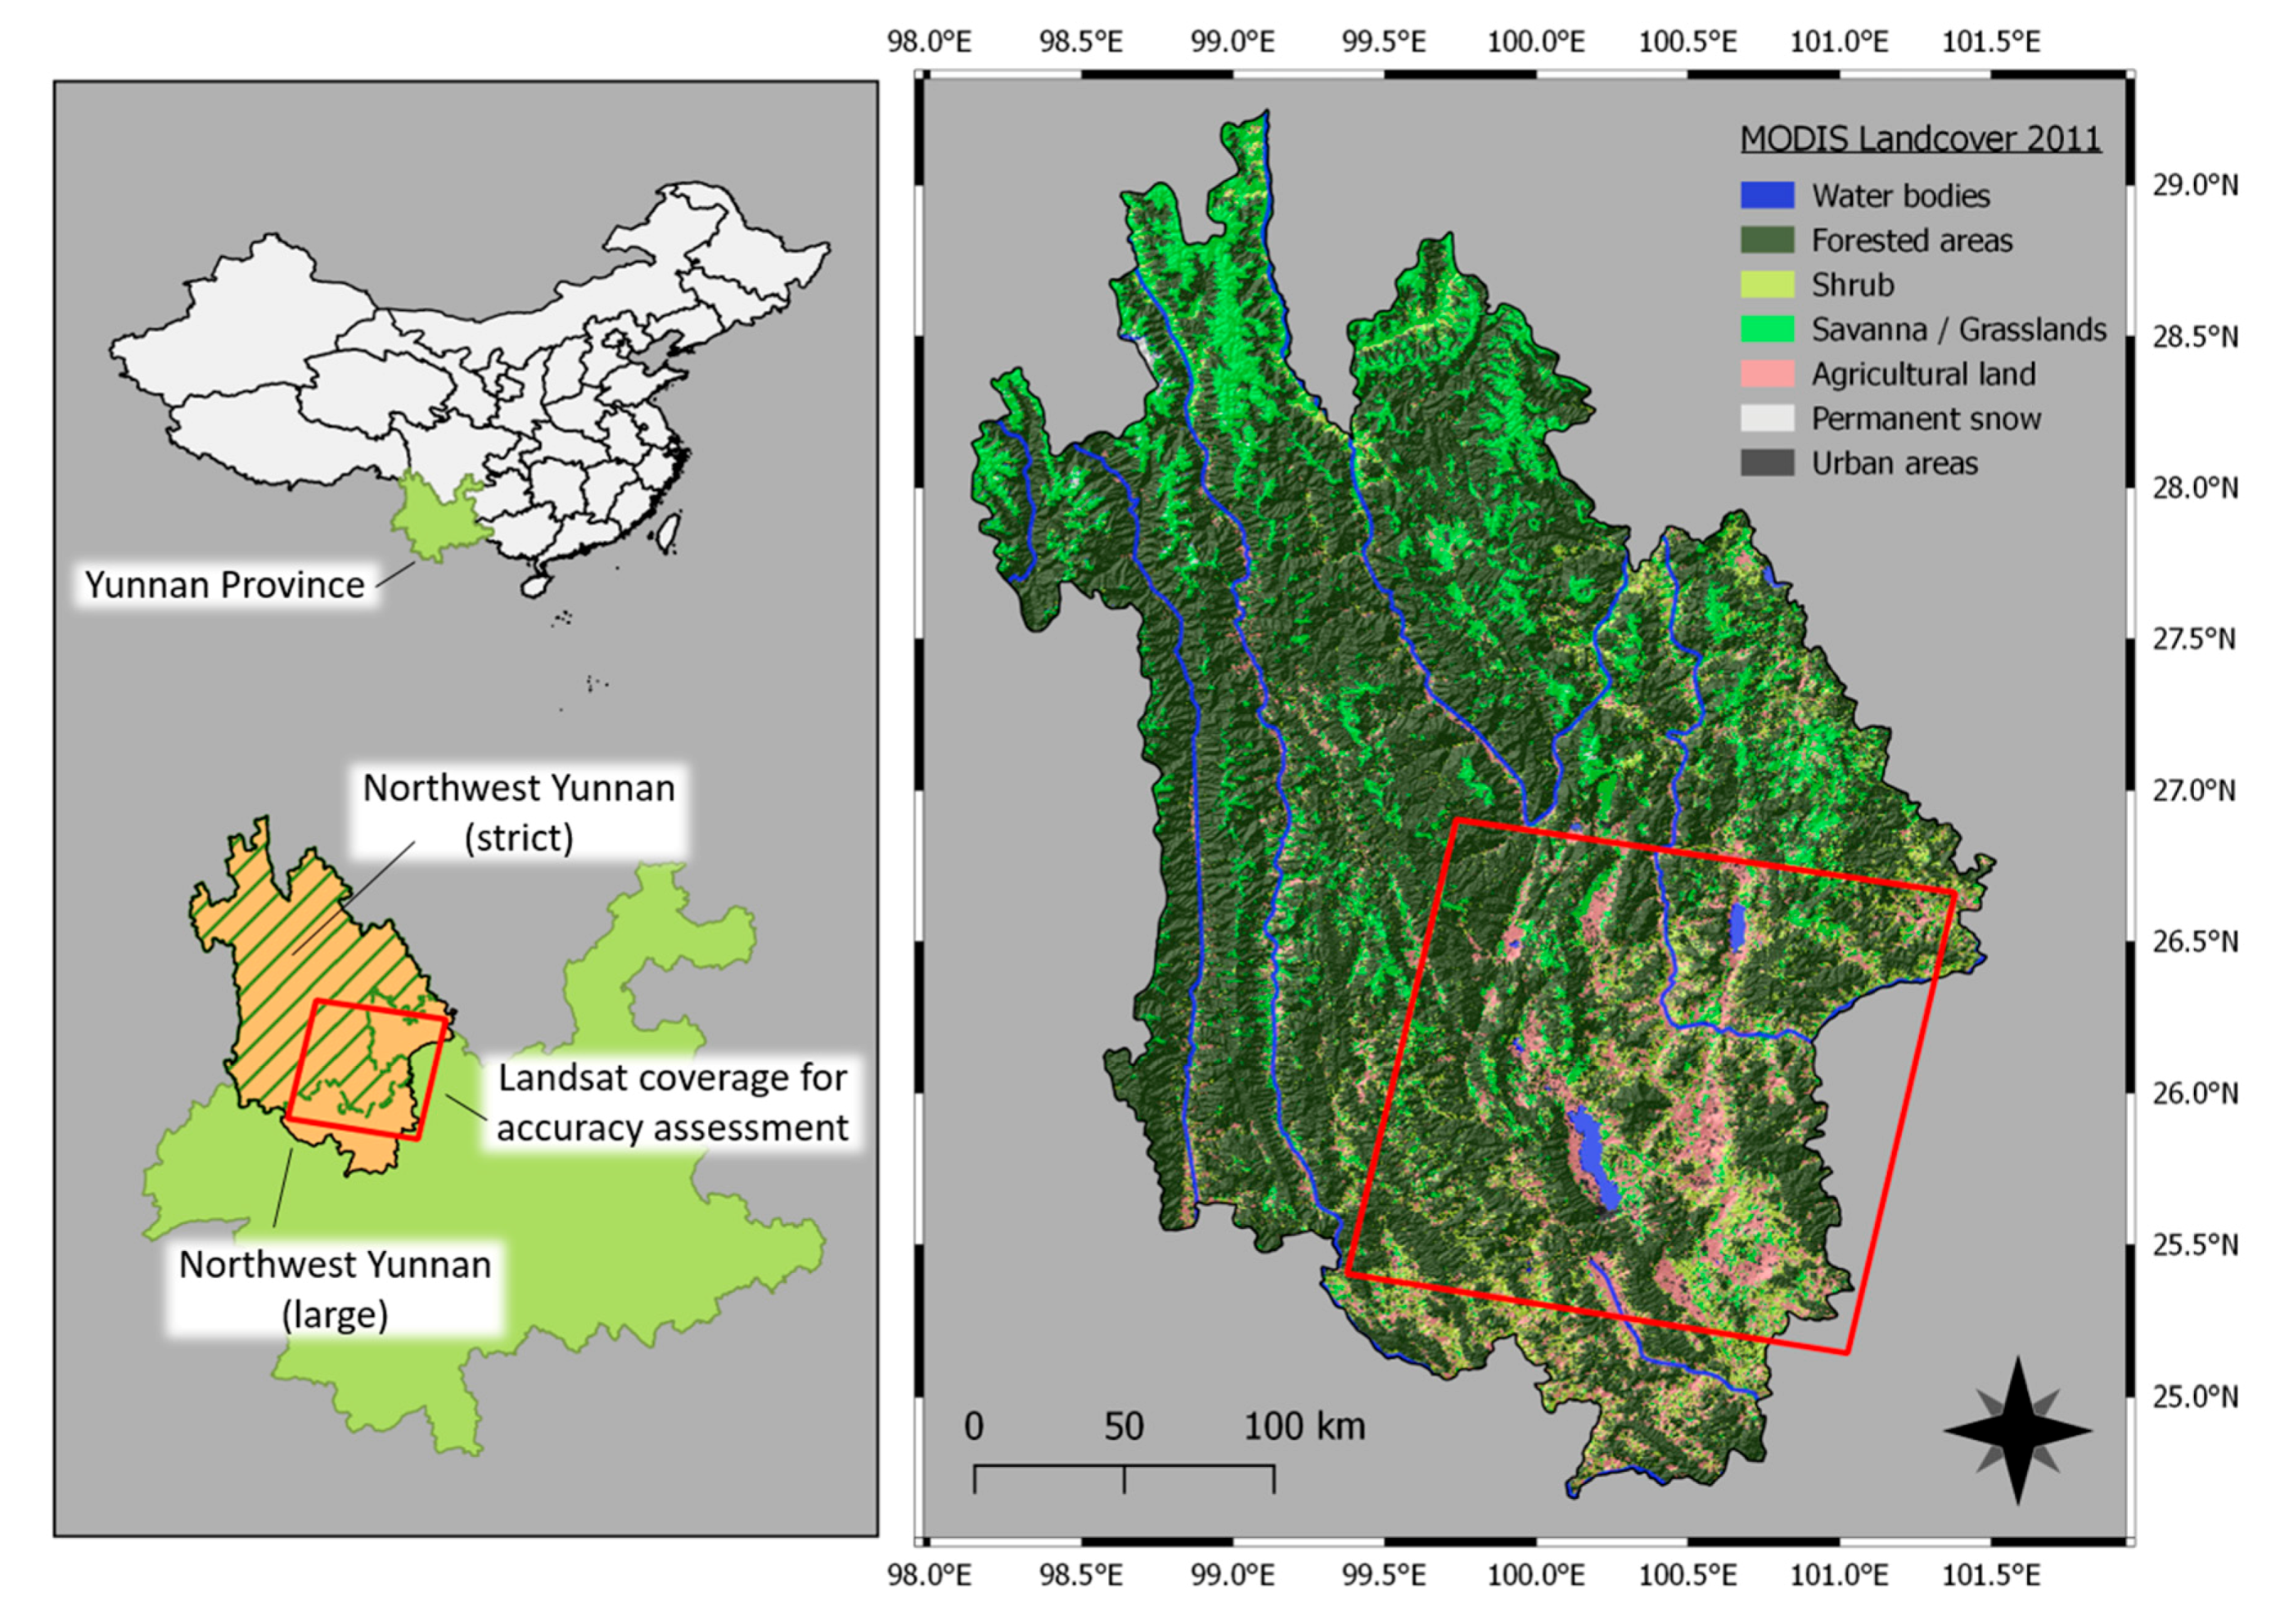
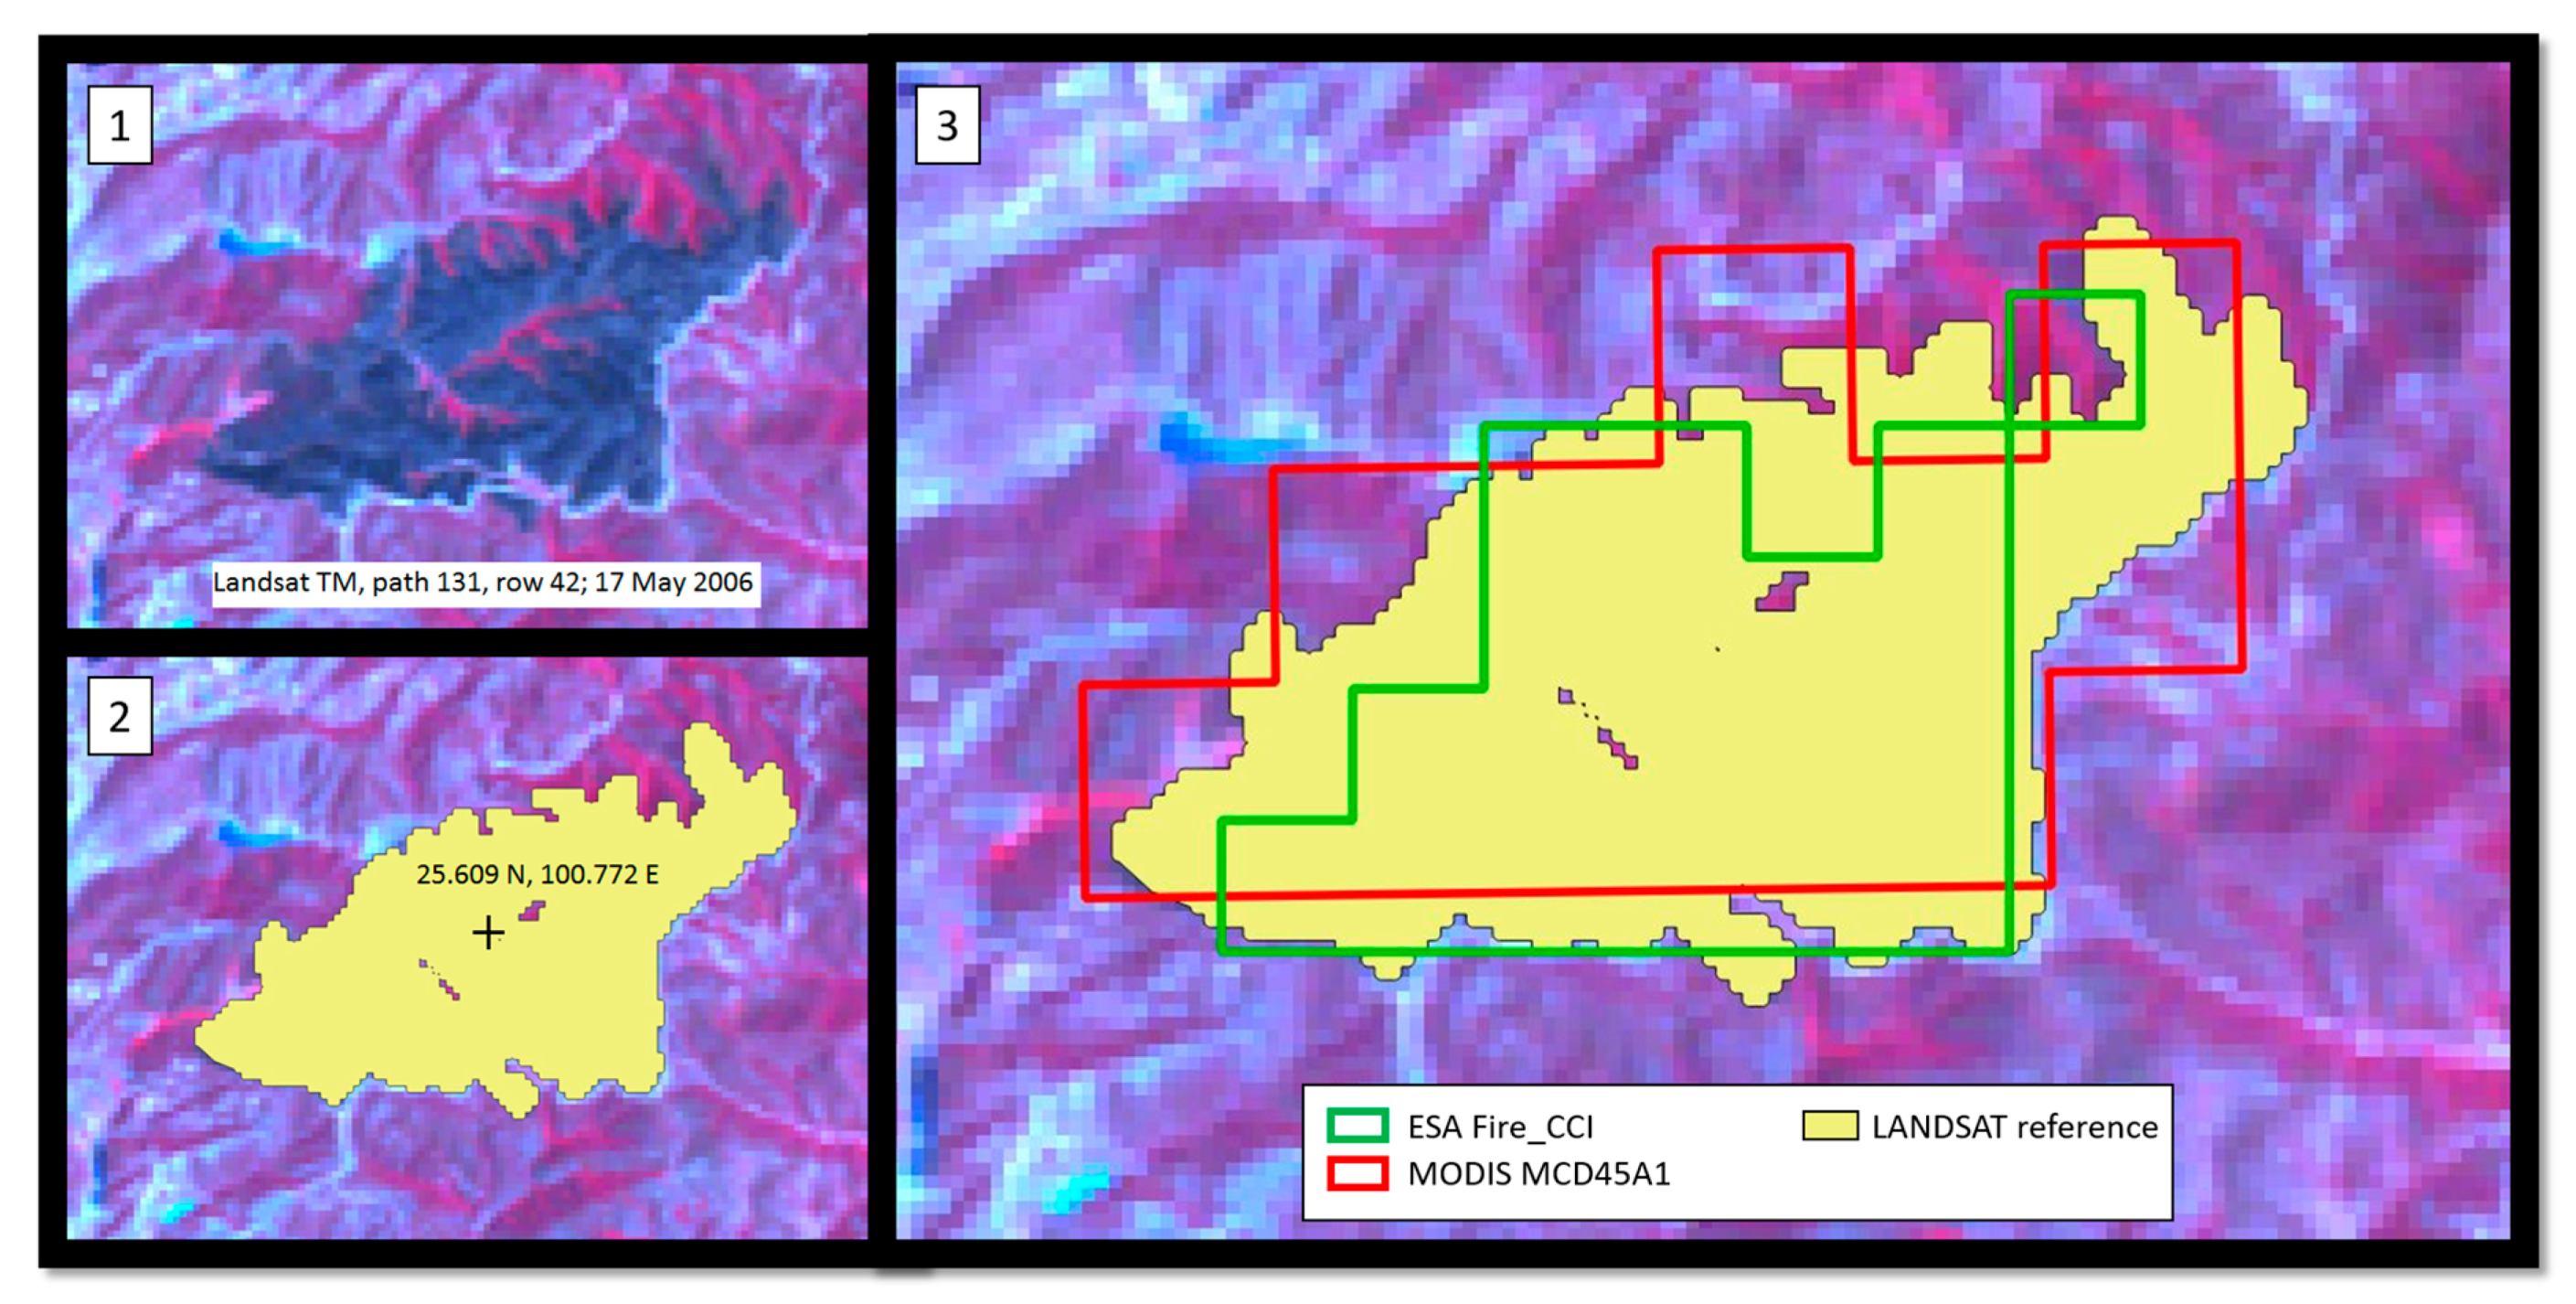
2.1. Description of Study Site

There is not a strict definition of the geographical limits of northwest Yunnan (NWY). In broad terms, NWY comprises the territories of four prefectures of the Yunnan province, in the People’s Republic of China: Deqing, Nujiang, Lijiang, and Dali. In a more restrictive definition, the southernmost counties belonging to the latter prefecture (Yongping, Yangbi, Weishan, Nanjian, Midu, and Xiangyun) and two counties in the eastern part of Lijiang (Yongsheng and Huaping) are not included in the region. In this study, we refer to NWY as the broader area, which covers a surface of about 86,700 km2. NWY is situated in the transitional region between the Qinghai-Tibet and the Yunnan-Guizhou Plateaus in the south-easternmost edge of the East Himalayas. Four major rivers (Salween, Mekong, Yangtze, and a tributary of the Irrawaddy) run in parallel across the region, separating high and narrow mountain ranges that reach more than 6000 m of elevation in the northern side of the region. Most of these mountain ranges are a part of the Hengduan Mountains but NWY includes other smaller complexes. The climate is under the influence of the Asian monsoon system with most of the precipitation falling from June to August, but due to the contrasting topography and the subtropical latitude, NWY hosts very particular climates and a great variety of landscapes, natural habitats, and biota. Vegetation types include subtropical evergreen broadleaf and coniferous forests, semi-savannas in hot-dry valleys, alpine and sub-alpine coniferous and mixed forests, alpine meadows, high plateau grasslands, etc. In general, annual precipitation is higher in the west, with maxima around 4000 mm in the Dulong valley, and decreases while moving to the east, with minima below 600 mm in the dry valleys [64,65,66]. A description of NWY and southwest China geology, climate, and vegetation can be found in [67].
Because of the large amount of time needed to manually map burned areas from Landsat scenes (see Section 2.2.5), for this analysis we selected one sample area corresponding to Landsat WRS-2 (Worldwide Reference System) path 131, row 42, and excluded the portions that are outside of the NWY boundary (see Figure 1). We chose this area because of its high frequency of fires and the availability of cloud-free satellite images for the accuracy assessment (see Section 2.2.5), due to the lower amount of annual precipitation, compared to other areas. Moreover, the variety of ecosystems that it contains, appropriately represent NWY.

2.2. Data Processing

In this study, we aim to test the ability of the chosen products in the detection of forest fires, which we consider as objects. We are interested in the number of fires and their location, and not in a subpixel analysis of burned area accuracy (more details in Section 2.3). Therefore, the main processing task consists in the aggregation of raw burned pixels to form consistent objects with unique id and attributes, called ‘fire events’. To guide the aggregation, spatial and temporal rules need to be defined, so that pixels spatially and temporally adjacent belonging to the same fire event are grouped. We chose to produce datasets that are tailored to the spatial and temporal resolution of the sensor from which they were originated. Spatial and temporal accuracies of each product were considered individually. This approach has the advantage to be more flexible to later treatments if fire events need to be further aggregated to satisfy user requirements.
The specifications and processing of the selected AF and BA products and the reference dataset, as well as the spatial and temporal rules for the aggregation of burned pixels are described in detail in the following subsections. Main products’ characteristics are summarized in Table 1. All data manipulations were performed using geoprocessing techniques within the free GIS software QGIS (http://www.qgis.org, last accessed on 25 September 2017).

2.2.1 MODIS Burned Area Collection 5.1 (MCD45A1)

MCD45A1 is one of the MODIS land products suite generated with global MODIS imagery from the Terra and Aqua satellites [68]. The algorithm used to generate this product relies on a bi-directional reflectance model change detection approach to map rapid changes in daily surface reflectance time series data, at a pixel size of 500 m. Fires occurred in previous seasons or years are excluded and only recent fires are mapped. MCD45A1 information and data access can be found on a dedicated website that is maintained by the University of Maryland (http://modis-fire.umd.edu/, last accessed on 25 September 2017). The data are delivered as monthly composites depicting per-pixel approximate Julian day of burning with an eight-day precision interval before and after the date of detection, confidence of detection, surface type, and other information. We selected this product for its relatively high spatial and temporal resolution, and for its good performance [49,69,70].
We downloaded monthly composites of MCD45A1 from 2001 to 2015, clipped to the extent of NWY (large) and reprojected to the local UTM zone, conserving the 500 m pixel size. To maximize the probability of detection, we kept fire pixels having both high and low confidence of detection levels, but we excluded fire pixels that are mapped over agricultural areas, as recommended in the product’s documentation. MCD45A1 retrieves landcover classes from the MODIS MCD12 Land Cover Type Yearly global product (https://lpdaac.usgs.gov/dataset_discovery/modis/modis_products_table/mcd12q1, last accessed on 25 September 2017). The burned pixels were then aggregated to form consistent fire events using the intersection (logical AND) of the following two rules:
  • Spatial rule: pixels should be directly adjacent to each other or within a maximum distance of 1 pixel. We chose a 1 pixel buffer to minimize inaccuracies due to the coarse spatial resolution of the sensor, such as partially burned pixels that remain undetected.
  • Temporal rule: pixels should have burning dates within a maximum temporal distance of 16 days. This rule is based on the 8-days precision interval before and after the date of detection proper to the product’s algorithm.
The resulting fire events were finally organized in a vector database.

2.2.2. MODIS Active Fire Collection 6 (MCD14ML)

The MODIS Active Fire product is produced using a contextual algorithm that applies thresholds to the brightness temperatures from the middle-infrared and thermal infrared channels of the MODIS instrument. Active fires are mapped at 1 km resolution during satellite overpass and, in order to limit false detections, potential burning pixels undergo a series of tests, masking operations, and further rejection tests. MCD14ML is a global monthly fire location product that is delivered as a plain ASCII files. It contains the geographic location, date, and some additional information for each fire pixel detected by the sensors. Data download, description, user manuals, and algorithm details can be found on the MODIS Active fire and Burned Area products website (http://modis-fire.umd.edu/, last accessed on 25 September 2017). We chose this product for the potential of its different approach and the relatively high resolution. In fact, even if the product’s pixel size is 1000 m, under very good observing conditions, a smaller fire of 100 m2 or even 50 m2 can be detected (see the user guide on http://modis-fire.umd.edu/pages/manuals.php, last accessed on 25 September 2017). Indeed, cloud coverage is the main factor compromising the good detection of active fires and fires may last too shortly to be detected during the next satellite overpass.
Monthly composites of MCD14ML from 2001 to 2015 were downloaded, clipped to the extent of our study region, and reprojected to the local UTM zone. Agriculture fires were masked using MCD12 landcover product. Because MCD14ML hotspots represent fires at 1 km resolution that could be located anywhere within the pixel, the whole pixel was considered as burned. We calculated a 500 m buffer around each point and aggregated the resulting polygons when they were touching or intersecting, and with AF dates differing less than four days, to form consistent fire events. The temporal distance is reduced when compared to MCD45A1 because the thermal sensor detects fires when they are active, with a high temporal accuracy.

2.2.3. MODIS Direct Broadcast Burned Area Collection 6 (MCD64A1)

MCD64 is the latest product of the MODIS Burned Area suite of products. It has been adopted as the standard MODIS burned area product for collection 6, replacing the former MCD45 suite, which will not be generated beyond Collection 5.1. It is based on a hybrid approach that exploits the potential of both MODIS 1 km active fires and 500 m surface reflectance input data. A burn-sensitive vegetation index is calculated from MODIS time series using the short-wave infrared channels, and dynamic thresholds are applied to detect persistent spectral changes. Afterwards, cumulative active fire maps are used to generate regional probability density functions for the classification of burned and unburned training samples that will guide the final determination of burned and unburned pixels. More information and a complete description of the algorithm can be found in [25]. MCD64A1 presents a general improvement in burned area detection over past collections. In particular, a significantly better detection of small fires, and the adaptability to different regional conditions across multiple ecosystems are among the main positive aspects of this product.
In the same manner as the previously introduced MODIS products, we retrieved and processed MCD64A1 GeoTIFF series. MCD12 landcover mask was applied to exclude burns over agricultural land and fire events were generated using the same spatial and temporal rules used for MCD45A1. Veraverbeke et al. [71] assessed the temporal accuracy of the MCD64A1 product to be more than 4 days before and after the date of detection. We opted for a 16-day temporal window to be consistent with MCD45A1.

2.2.4. ESA’s Fire_CCI

ESA’s Fire_CCI product provides the burned area metric used to quantify the Fire Disturbance variable of the Essential Climate Variables within the ESA’s Climate Change Initiative (ESA-CCI). ESA-CCI program details can be found on its webpage (http://cci.esa.int/, last accessed on 25 September 2017) and in [72]. The product was developed in an effort to meet end-users’ requirements of a higher resolution BA product. The developing team opted for the capabilities of the Envisat-MERIS 300 m resolution images, which are collected approximately every three days, depending on the latitude. Because the MERIS sensor was mainly designed for ocean color applications and not for land observations, its application to fire disturbance assessment is scarce [23]. To overcome these limitations, MERIS data was combined with daily hotspot locations from the MODIS thermal anomalies product (MCD14ML), also contributing to the reduction of commission errors related to the approaches that are entirely based on reflectance changes. The algorithm follows a hybrid two-phase approach: a seed selection phase from MODIS hotspots followed by a region growing analysis phase over the MERIS’s NIR band and a NIR-derived spectral index. The resulting product is offered in two forms: a Pixel BA product at 300 m resolution and a Grid BA product at 0.25 degrees resolution.
We downloaded monthly composites of Fire_CCI Pixel BA version 4.1 from http://www.esa-fire-cci.org (last accessed on 25 September 2017). The product time coverage spans from 2005 to 2011 but, as stated on the official website (http://www.esa-fire-cci.org/content/products-description, last accessed on 25 September 2017), in the near future, the product will cover the time series 2000–2017. It contains the date of the first detection layer, a confidence level layer, and a landcover layer for only the burned pixels, extracted from the CCI Landcover maps (https://www.esa-landcover-cci.org/, last accessed on 25 September 2017). Sub-setting, reprojection, and landcover masking operations were performed, and the same spatial rules as MCD45A1 were applied. Because for regions with high cloud coverage the date of detection may be several days or even weeks after the fire is over [73], the time interval used to aggregate pixels considered as belonging to the same fire event, was increased to 28 days.

2.2.5. Landsat Reference Dataset

No suitable official data on fires was available for our study region. Hence, we decided to compare the vector fire events datasets derived from the four selected AF and BA products with a reference dataset that was compiled using 30 m Landsat imagery. Using higher-resolution datasets, such as the Landsat and ASTER archives, is a robust approach that is commonly employed by researchers when assessing the accuracy of BA products [28,37,46,47,74]. Visual interpretation is a time-consuming task because it is performed manually by the analyst who, using empirical knowledge and personal experience, identifies and maps burned patches in the image. Burned areas are clearly visible in Landsat images when using the infrared band in the image composite (see Figure 2, black color), especially when comparing a pre-burn scene with a post-burn scene. Because of time availability constraints, we selected two sample years to be used in the accuracy assessment. The selected years were 2006, from Julian day 25 to 345; and 2009, from Julian day 17 to 52 of the following year (2010). These time frames were chosen for the particularly high fire activity in the study region and the availability of a relatively high number of cloud-free Landsat scenes within the two years. Five Landsat scenes for 2006 (Julian days 25, 57, 137, 217, 345) and six Landsat scenes for 2009 (Julian days 17, 33, 49, 81, 273, and 52 of year 2010) were used to perform visual interpretation, by comparing each scene with the following one in the time line. Additional scenes with partial visibility over the study region were kept as support in the process. Spectral indexes and transformations, such as Tasseled Cap, Normalized Difference Vegetation Index, Normalized Burn Ratio, and image differencing techniques were used to assist the analyst in the extraction of burned areas and the creation of the final reference dataset. Only fires bigger than 12.5 ha (half of a MODIS pixel) were included in the analysis.

2.3. Accuracy Assessment

Rigorous validation, accuracy assessment protocols, and recommendations exist in the literature [46,75,76], but are not suitable for the purpose of our study. The frequent small fires that characterize our study region are difficult to detect with precision using the medium-to-coarse resolution products that we selected to run this task. Specifically, sub-pixel accuracy of burned areas would not give results that are pertinent with what we really want to assess. Therefore, we opted for a more flexible methodology to evaluate their performance against a reference dataset. In this study, the assessment was performed using a polygon intersection approach (Figure 2), where the focus is put on the ability of AF and BA products to detect a fire event independently from the size and shape of the burn. Instead of assessing the accuracy of the detection pixel by pixel, we assessed the accuracy of the count and locations of fire events. If a fire event is fully or only partially detected, then the detection is considered as equally successful. To be considered valid, a burned polygon from the tested dataset should at least touch a reference polygon. Commission and omission errors are not related to the area of the fire events that were partially detected, but to those totally omitted or committed. In practice, we selected the tested products’ polygons that intersected reference polygons using spatial analysis tools within QGIS, and we compiled an error matrix with the entirety of the reference and tested datasets’ fire events. True negative data (non-fire polygons correctly detected), were not artificially created to be included in the error matrix, and they were therefore excluded from the accuracy assessment.
The usual binary error matrix metrics were extracted to quantify and compare the different products. The metrics were the user’s accuracy (UA), which is a measure of the reliability and precision of the product, the producer’s accuracy (PA), which denotes the sensitivity, or the probability of detection, and the F1 score [77], also known as Sørensen index or Dice’s coefficient, which is the harmonic mean of the two metrics previously mentioned. Other common metrics relying on true negative data, such as overall accuracy, were not calculated due to their absence in the error matrix. Equations of the three metrics are listed below:
F 1   Score :   F 1 = 2 TP 2 TP + FP + FN
User s   Accuracy :   UA = TP TP + FP × 100
Producer s   Accuracy :   PA = TP TP + FN × 100
where TP = True Positive values, fire events correctly detected by the tested product; FP = False Positive values, fire events erroneously detected by the tested product (commission); FN = False Negative values, fire events not detected by the tested product (omission).
The polygon intersection methodology used in this study could lead to inconsistent results when a tested product heavily overestimates burned areas, because within-polygon commission error is not included in the calculations. However, in general, BA algorithm designers tend to minimize commission errors at the cost of larger omission errors [48]. Moreover, this more flexible methodology can reduce classification errors due to image registration inaccuracies. By the mean of these metrics, we compared every tested product towards the reference dataset for the year 2006, 2009, 2006, and 2009 combined, and for three different fire sizes (full dataset: >12.5 ha; more than one MODIS pixel: >25 ha; more than two MODIS pixels: >50 ha) to highlight which product performs better with bigger and smaller fire sizes. Furthermore, we cross-analyzed the best BA performer with the only pure AF product to find out if the two products show divergent abilities in the detection of fires. A low number of correctly detected fires by both products would suggest that merging the two products could significantly increase the probability of detection (PA).

3. Results

Individual performances of the four tested global products are summarized in Table 2. Overall, the capabilities of all the products in the detection of small burned areas in this mountainous study region are relatively low. For both years 2006 and 2009, and consequently 2006 and 2009 combined, the best performer was MCD45A1, displaying the highest F1 scores (0.42, 0.24, 0.31, respectively) and the highest UA (lower errors of commission). The best PA was obtained by the only pure active fire product (MCD14ML), which reached 47% in 2009, but this result was to the detriment of UA, which was among the lowest, and had a negative impact on the F1 score. The other two products, MCD64A1 and Fire_CCI, showed lower performances in the detection of fire events. In 2006, the probability of detection of all the products increased when excluding smaller fire events from the analysis, exceeding 25% for fire sizes bigger than 50 ha (two MODIS pixels), except for Fire_CCI, who only scored 17%. In 2009, PAs improved with an increasing fire size, but for MCD45A1 and MCD64A1 the values were lower than in 2006, while for MCD14ML and Fire_CCI, PA values were higher (66% and 18% for fires bigger than 50 ha).
Details about PAs per fire event size are shown in Table 3. According to the reference dataset, there were 70 fire events in total in 2006: 15 fire events with a BA size between 12.5 to 25 ha, 19 fire events between 25 to 50 ha, and 36 fire events bigger than 50 ha. In 2009, a total of 144 fire events occurred with number (n) per size of 55, 45, and 44, respectively. In both years, most of the fire events that were correctly detected by the products were bigger than 50 ha. Only MCD14ML was able to conspicuously detect smaller fires, especially in 2009. The other products scored very low, with detected events smaller than 50 ha virtually null.
A more detailed analysis of the user’s accuracy is illustrated in Table 4. We classified each committed fire event by its size in pixels. We can clearly observe that most of the committed fire events are of very small size (mostly 1 pixel) for the three MODIS products, while Fire_CCI shows more weighty errors in both 2006 and 2009. The very low UA of MCD14ML shown in Table 3 appears less serious when adding fire size information.
The results of the cross-comparison of MCD45A1 and MCD14ML are shown in Table 5. For the two assessed years, the number of fire events correctly detected by both products was very small when compared to the sum of corrected detections when merging the two products. In total (2006 & 2009 combined), only 22 out of 120 correctly detected fires were in common between MCD45A1 and MCD14ML. If these two datasets were combined to form a unique merged dataset, the producer’s accuracy would clearly increase. PAs of the merged products, including all fire sizes, would be 59%, 55%, 56%, while MCD45A1 alone has 30%, 16%, 21%, and, MCD14ML alone has 43%, 47%, and 46% for the years 2006, 2009, and 2006 and 2009, respectively. Consequently, UA would also be smoothed down, with a negative impact on the F1 scores. Still, F1 scores for the merged product would be better than any single product in 2009 and the second best in 2006.

4. Discussion

Four different freely available global BA and AF datasets were compared towards a higher resolution reference dataset to assess their ability in the detection of fire events in a mountainous region characterized by frequent small size fires. Because the accuracy assessment methodology chosen in this study differs substantially from the ones used for studies in other regions, a direct comparison of the results with those studies cannot be done. However, our findings need to be critically interpreted and discussed in the peculiar context of detection and quantification of small fire events. As expected, due to the landscape and topographic characteristics of the target region, and the technical specifications of the tested global datasets, the performance of the products was relatively low. The F1 score, which is the harmonic mean of precision and recall (i.e., producer’s accuracy and user’s accuracy), was comprised between 0.08 and 0.42 in the two analyzed years. An F1 value below 0.5 means that correct detections are fewer than mistaken detections. A closer look at the omission and commission errors allows for the identification of the error type with the highest impact on the results. The choice of a given tradeoff between the two error types determines the results. For example, using less conservative rules (e.g., lower thresholds) to separate burned from unburned pixels will result in improved probabilities of detection at the cost of greater commission errors. As stated before, BA algorithm designers often opt for the opposite approach, containing commission errors at the cost of larger omission errors [48], and our results confirm this statement. Almost all of the analyzed models are more accurate (lower commission) than sensitive (higher omission). Only MCD14ML, the only pure AF-based product, displayed higher probabilities of detection (PA), but also showed the lowest UAs, leading to a relatively reduced F1 score. It is worth mentioning that the low PA may be overstated in our approach. In fact, active fires detected by the MCD14ML product may be correct, but the resulting burned area may be smaller than the minimum size that is considered in this analysis (12.5 ha), or may have left a very light burn scar that escaped the analyst’s interpretation when manually mapping fire perimeters for the reference dataset.
The influence of fire event size on the probability of detection can be highlighted when analyzing PAs for different fire sizes: every product obtained improved PAs for larger fires. Table 3 clearly illustrates the very poor detection of fires that are smaller than 50 ha by the tested products, except for MCD14ML, who reached PAs of between 13% and 49%. Comparable results were found in other studies [78]. 50 ha corresponded to two MODIS pixels. Sub-pixel analysis of burned patches performed in past studies [25,29,79] reported that a 50% of BA proportion in a MODIS pixel can be considered as an appropriate threshold for medium resolution burned area detection, while a threshold of 75% highly increased the sensitivity of the MODIS products. In our study, this was only true for the MCD14ML, while the other products had very low sensitivity for such small burned areas. A possible explanation for this difference could be the shape and location of small fires in this mountainous region that is characterized by narrow valleys with steep mountain flanks. The area of a small fire could span over two or more MODIS pixels, covering only small fractions of each pixel, consequently resulting in a failure of the detection of that fire event in any of the affected pixels. Moreover, several fires occur in herbaceous vegetation that burns very fast but also recovers very fast without leaving heavily marked and clearly spectrally-discernable scars. These conditions are not favorable to BA algorithms, which are based on abrupt and permanent changes in spectral reflectances [80].
One of the main differences between the four datasets is their algorithm approach. MCD45A1 is a pure BA-based dataset, MCD14ML is a pure AF-based dataset, while MCD64A1 and Fire_CCI use hybrid approaches. This difference was expected to cause dissimilar results. The fact that AF-based algorithms are more sensitive to small fires and in general show higher probabilities of detection, but also many false detections (errors of commission), was already highlighted in previous studies. More recent algorithms were designed using hybrid approaches in order to take advantage of both AF and BA methods, while trying to minimize the errors of commission. The latest MODIS product, MCD64A1, showed great potential and an improved detection of smaller fires in other cases, but its performance in our study region was not as good as its predecessor’s. Likewise, Tsela et al. [29] found that MCD45A1 detects smaller burned areas (50% of a MODIS pixel) better than MCD64A1, and when presenting the new hybrid algorithm, Giglio et al. [25] stated that the minimum burn size for reliable detection is in the order of 120 ha. ESA’s Fire_CCI product performed poorly as well. A possible reason for the failure of detection lies in the hybrid algorithms strategies: both hybrid approaches rely heavily on a probabilistic selection of candidate burned pixels based on MCD14ML. Hotspots are used as starting seeds for the Fire_CCI product, while the MCD64A1 product employs them as training samples for a classification over previously created maps of persistent changes in a vegetation index. Although in general very low, omission error from the AF product is entirely absorbed by the hybrid algorithm. Those fires not detected by the AF product will be excluded from further processing. This approach is very efficient to overcome excessive commission errors, but may be too restrictive for the detection of small burned patches in mountainous regions. Moreover, without a proper topographic adjustment of the raw satellite images, the real surface area of a pixel in a rugged terrain and on steep slopes is bigger than on a flat regular terrain, making the detection of small fires more difficult.
Because of the higher spatial resolution of the Fire_CCI product (300 m), a better detection of smaller fires was expected, but our results proved the opposite. For both of the assessed years, Fire_CCI performed similarly to MCD64A1, and worse than the other two products. Pixel size analysis showed a tendency for big commission errors due to confusion between burned land and other disturbances. Among the four tested products, Fire_CCI is the newest and its validation is still at its beginning stage. Preliminary comparisons showed good agreements with other global products, but greater omission and commission errors [28,33,73]. Further validation is in progress.
The cross-analysis of the two best performers, the BA-based MCD45A1 and the AF-based MCD14ML, revealed that these two products can detect several different fire events, and that by merging them directly, better probabilities of detection can be reached. On the other hand, the commission error would also be higher. Depending on the aim of a given study (e.g., quantification of burned areas), a direct merge would not be a suitable solution. However, this cross-comparison confirms that hybrid approaches can significantly improve the accuracy of burned area detection, and suggests that the existing approaches should be ameliorated, in order to include the detection of small fires in other ecosystems, such as the mountainous one that is analyzed in this study. Past merged products efforts have demonstrated an improvement of the results [29,32]. The latter research paper was an attempt to include small fires in the global assessment of the impact of fires on the ecosystems. The authors found that accounting for small fires increased the total burned area and biomass global carbon emissions by approximately 35% when these fires were included in simulations with the GFED3 biogeochemical model.
To balance the interpretation of the results, we need to mention the limits of the data and the methodology employed. First, mountainous regions host very complex environments with unique landscape and topography features, and are characterized by small fire events. Global algorithms are designed for analysis and applications at regional to global scales, therefore lower performances in these particularly small regions are somehow expected. When fires are small, the impact of incongruences in the geographic registration of the products increases. Additionally, the landcover mask that is used to remove agriculture fires from the analysis may contain classification errors and lead to further detection mistakes. Secondly, when defining the methodology, some compromises, like the choice of the rules for the aggregation of pixels belonging to the same fire event and the choice of an accuracy assessment method, need to be done. Polygon intersection means that at least a part of a fire event’s burned area is detected; it does not tell us anything about how accurately the shape and the area of the fire event is detected. Moreover, the two metrics quantifying error types, user’s accuracy (UA) and producer’s accuracy (PA), the way they were used in our assessment method, do not quantify the error within correctly detected fire events, but only the error of fires completely omitted or committed. Finally, the reference dataset was based on visual interpretation of Landsat scenes and the analyst’s empirical knowledge of the region. This method is widely recognized by the scientific community as being valid and efficient when assessing the accuracy of coarser resolution datasets, but on the other hand, it is still prone to interpretation mistakes, and it is a time-consuming task.

5. Conclusions

The impact of small size disturbances on terrestrial and atmospheric environments is very important, not only at local and regional scales, but also at the planetary and continental scales. Modeling of the Earth System should include those small fires in order to acquire a better understanding of fire disturbance as a global driving force of ecosystem change during time. Mountainous ecosystems are home to rich and rare biological species, and are very sensitive to changes induced by human activities and climate change. This study contributes to this understanding by delivering a first assessment of the strengths and shortcomings of the existing, free-of-charge, global BA and AF products, in an ecosystem that has never been assessed before: the mountainous region of northwest Yunnan, at the southeastern edge of the Himalaya complex. The four global products tested in this study were selected because of their relatively high temporal and spatial resolution. The outcomes of the accuracy assessment allowed for the identification of the best product and a preliminary insight into fire activity in this region. Our main conclusions are as follows:
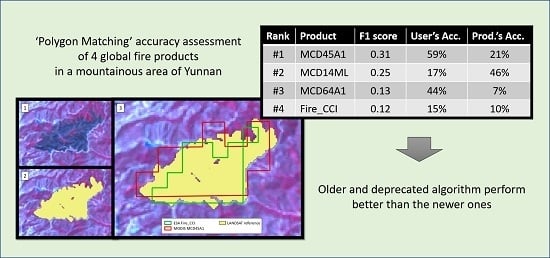
  • The analyzed global AF and BA products shows poorer results in our mountainous area than in other ecosystems, mainly due to the smaller size of fires. For burned areas bigger than 50 ha, the best product could detect more than 60% of the fire events. Detection decreases drastically for smaller burned areas.
  • The two former MODIS fire products, first MCD45A1 then MCD14ML, were the best performers in our study area, followed by MCD64A1 and Fire_CCI. These results did not align with our expectations. The newest algorithms are designed using hybrid approaches that combine the capabilities of both AF and BA methods. Therefore, among other improvements, they should have performed better in the detection of small fires. On the contrary, they obtained lower scores and higher commission and omission errors than their predecessors. This has important implications for the design of future algorithms. MCD45A1 being the best performer suggests that its bi-directional reflectance based approach is still valid and deserves more consideration, for example, by being integrated in a hybrid approach. Unfortunately, MCD45A1 has been discontinued since January 2017 and replaced by the hybrid MCD64A1, which produced worse results.
  • At present, the usefulness of the existing global BA and AF products for the quantification of small fires is still marginal. The spatial resolution limitation of the sensors that are used to generate these datasets represents a physical limit that cannot be passed. Yet, taking into account the high rate of omission and commission, MCD45A1 and MCD14ML’s data can be used to obtain preliminary insights on the fire activity of regions that are characterized by relatively small fires or to partially assess the accuracy of other burned area extraction methods.
Hence, based on the results of the present study, we recommend a re-evaluation of the new hybrid algorithms so that they can account for small fires occurring in ecosystems that feature complex landscape and topographic traits. Improved algorithms would not only benefit global and continental scale applications, but also serve the increasing number of users that are working in smaller regions where no other reliable data about fire activity is available. Our study suggests that, despite the sensors resolution limitations, there is room for improvements in algorithm design. Adopting sensors with higher spatial resolution like the MERIS sensor used in the Fire_CCI product is undoubtedly the right direction to follow to improve the burned area mapping phase. Still, the first selection of seeds based on MODIS thermal bands needs to be rethought.
We believe that a more accurate quantification of small fires, as well as other disturbance phenomena at global scale will be soon achievable, also thanks to the onset of big data technology. Existing alternatives could lie on higher resolution AF products like the 375 m VIIRS AF sensor aboard the Suomi National Polar-orbiting Partnership satellite [81], which collects images about every 12 h. However, its archive is very recent, beginning from the year 2012. Active fire data for previous years need to rely on the MODIS or other AF products. In addition, the Landsat archive offers four decades of 30 m resolution imagery, which has been widely used for all sorts of fire-related applications. In this perspective, recently, a lot of effort is put in the reconstruction of fire history using Landsat-based algorithms, such as the Burned Area Essential Climate Variable (BAECV) algorithm, which has been applied to the conterminous United States [82]. This algorithm maps burned areas with a minimum size of 4.05 ha, which is an ideal minimum size for mountainous areas. A first assessment performed by Vanderhoof et al. [83] found that, in a mountainous ecoregion of the western United States, BAECV detected 33% and 76% of fires with sizes 4.05 to 10 ha and 10 to 25 ha, respectively. These are very positive and encouraging results, which are calling for the application and validation of BAECV and other Landsat-based fire extraction algorithms over other regions of the world.

Acknowledgments

This study was funded by the National Natural Science Foundation of China (31560599 and 31560118), and Science Foundation of Yunnan (2015FB157). The authors are extremely thankful to Neil Russell Mennie for the English spelling review of the manuscript and to the three anonymous reviewers for their valuable suggestions.

Author Contributions

Davide Fornacca, Wen Xiao and Guopeng Ren conceived the research topic. Davide Fornacca designed the methodology, conducted the literature review, data acquisition, analysis, tables, and wrote the manuscript. Wen Xiao and Guopeng Ren provided methodology support, continuous follow up of the research process, and assisted in the editing.

Conflicts of Interest

The authors declare no conflict of interest.

References

  1. Pausas, J.G.; Keeley, J.E. A burning story: The role of fire in the history of life. Bioscience 2009, 59, 593–601. [Google Scholar] [CrossRef] [Green Version]
  2. Bond, W.J.; Keeley, J.E. Fire as a global “herbivore”: The ecology and evolution of flammable ecosystems. Trends Ecol. Evol. 2005, 20, 387–394. [Google Scholar] [CrossRef] [PubMed]
  3. Pyne, S.J.; Andrews, P.L.; Laven, R.D. Introduction to Wildland Fire, 2nd ed.; John Wiley & Sons: New York, NY, USA, 1996; ISBN 978-0471549130. [Google Scholar]
  4. Bond, W.J.; Woodward, F.I.; Midgley, G.F. The global distribtuion of ecosystems in a world without fire. New Phytol. 2005, 165, 525–538. [Google Scholar] [CrossRef] [PubMed]
  5. Bowman, D.M.J.S.; Balch, J.K.; Artaxo, P.; Bond, W.J.; Carlson, J.M.; Cochrane, M.A.; Antonio, C.M.D.; Defries, R.S.; Doyle, J.C.; Harrison, S.P.; et al. Fire in the Earth System. Science 2010, 324, 481–484. [Google Scholar] [CrossRef] [PubMed]
  6. Krebs, P.; Pezzatti, G.B.; Mazzoleni, S.; Talbot, L.M.; Conedera, M. Fire regime: History and definition of a key concept in disturbance ecology. Theory Biosci. 2010, 129, 53–69. [Google Scholar] [CrossRef] [PubMed]
  7. Summers, W.T.; Coloff, S.G.; Conard, S.G. Synthesis of Knowledge: Fire History and Climate Change; Joint Fire Science Program Project: Boise, ID, USA, 2011; Available online: digitalcommons.unl.edu/cgi/viewcontent.cgi?article=1018&context=jfspsynthesis (accessed on 6 November 2017).
  8. Yan, X.; Ohara, T.; Akimoto, H. Bottom-up estimate of biomass burning in mainland China. Atmos. Environ. 2006, 40, 5262–5273. [Google Scholar] [CrossRef]
  9. Mouillot, F.; Schultz, M.G.; Yue, C.; Cadule, P.; Tansey, K.; Ciais, P.; Chuvieco, E. Ten years of global burned area products from spaceborne remote sensing—A review: Analysis of user needs and recommendations for future developments. Int. J. Appl. Earth Obs. Geoinf. 2014, 26, 64–79. [Google Scholar] [CrossRef]
  10. Tian, X.; Mcrae, D.J.; Shu, L.; Wang, M.; Li, H. Satellite remote-sensing technologies used in forest fire management. J. For. Res. 2005, 16, 73–78. [Google Scholar] [CrossRef]
  11. Zhang, J.H.; Yao, F.M.; Liu, C.; Yang, L.M.; Boken, V.K. Detection, emission estimation and risk prediction of forest fires in China using satellite sensors and simulation models in the past three decades—An overview. Int. J. Environ. Res. Public Health 2011, 8, 3156–3178. [Google Scholar] [CrossRef] [PubMed]
  12. Justice, C.O.; Giglio, L.; Korontzi, S.; Owens, J.; Morisette, J.T.; Roy, D.; Descloitres, J.; Alleaume, S.; Petitcolin, F.; Kaufman, Y. The MODIS fire products. Remote Sens. Environ. 2002, 83, 244–262. [Google Scholar] [CrossRef]
  13. Roy, D.P.; Boschetti, L.; Justice, C.O.; Ju, J. The collection 5 MODIS burned area product—Global evaluation by comparison with the MODIS active fire product. Remote Sens. Environ. 2008, 112, 3690–3707. [Google Scholar] [CrossRef]
  14. Giglio, L. Characterization of the tropical diurnal fire cycle using VIRS and MODIS observations. Remote Sens. Environ. 2007, 108, 407–421. [Google Scholar] [CrossRef]
  15. Arino, O.; Casadio, S.; Serpe, D. Global night-time fire season timing and fire count trends using the ATSR instrument series. Remote Sens. Environ. 2012, 116, 226–238. [Google Scholar] [CrossRef]
  16. Giglio, L.; Descloitres, J.; Justice, C.O.; Kaufman, Y.J. An enhanced contextual fire detection algorithm for MODIS. Remote Sens. Environ. 2003, 87, 273–282. [Google Scholar] [CrossRef]
  17. Giglio, L.; Schroeder, W.; Justice, C.O. The collection 6 MODIS active fire detection algorithm and fire products. Remote Sens. Environ. 2016, 178, 31–41. [Google Scholar] [CrossRef]
  18. Simon, M.; Plummer, S.; Fierens, F.; Hoelzemann, J.J.; Arino, O. Burnt area detection at global scale using ATSR-2: The GLOBSCAR products and their qualification. J. Geophys. Res. D Atmos. 2004, 109, 1–16. [Google Scholar] [CrossRef]
  19. Tansey, K. Vegetation burning in the year 2000: Global burned area estimates from SPOT VEGETATION data. J. Geophys. Res. 2004, 109, D14S03. [Google Scholar] [CrossRef]
  20. Tansey, K.; Grégoire, J.-M.; Defourny, P.; Leigh, R.; Pekel, J.-F.; van Bogaert, E.; Bartholomé, E. A new, global, multi-annual (2000–2007) burnt area product at 1 km resolution. Geophys. Res. Lett. 2008, 35, 1–6. [Google Scholar] [CrossRef]
  21. Plummer, S.; Arino, O.; Ranera, F.; Tansey, K.; Chen, J.; Dedieu, G.; Eva, H.; Piccolini, I.; Leigh, R.; Borstlap, G.; et al. An update on the globcarbon initiative: Multi-sensor estimation of global biophysical products for global terrestrial carbon studies. In Proceedings of the Envisat Symposium, Montreux, Switzerland, 23–27 April 2007; Available online: envisat.esa.int/workshops/envisatsymposium/proceedings/sessions/2S2/460668pl.pdf (accessed on 2 November 2017).
  22. Plummer, S.; Arino, O.; Simon, M.; Steffen, W. Establishing a earth observation product service for the terrestrial carbon community: The globcarbon initiative. Mitig. Adapt. Strateg. Glob. Chang. 2006, 11, 97–111. [Google Scholar] [CrossRef]
  23. Alonso-Canas, I.; Chuvieco, E. Global burned area mapping from ENVISAT-MERIS and MODIS active fire data. Remote Sens. Environ. 2015, 163, 140–152. [Google Scholar] [CrossRef]
  24. Roy, D.P.; Jin, Y.; Lewis, P.E.; Justice, C.O. Prototyping a global algorithm for systematic fire-affected area mapping using MODIS time series data. Remote Sens. Environ. 2005, 97, 137–162. [Google Scholar] [CrossRef]
  25. Giglio, L.; Loboda, T.; Roy, D.P.; Quayle, B.; Justice, C.O. An active-fire based burned area mapping algorithm for the MODIS sensor. Remote Sens. Environ. 2009, 113, 408–420. [Google Scholar] [CrossRef]
  26. Giglio, L.; Randerson, J.T.; van der Werf, G.R. Analysis of daily, monthly, and annual burned area using the fourth-generation global fire emissions database (GFED4). J. Geophys. Res. Biogeosci. 2013, 118, 317–328. [Google Scholar] [CrossRef]
  27. Giglio, L.; Randerson, J.T.; van der Werf, G.R.; Kasibhatla, P.S.; Collatz, G.J.; Morton, D.C.; DeFries, R.S. Assessing variability and long-term trends in burned area by merging multiple satellite fire products. Biogeosciences 2010, 7, 1171–1186. [Google Scholar] [CrossRef] [Green Version]
  28. Padilla, M.; Stehman, S.V.; Ramo, R.; Corti, D.; Hantson, S.; Oliva, P.; Alonso-Canas, I.; Bradley, A.V.; Tansey, K.; Mota, B.; et al. Comparing the accuracies of remote sensing global burned area products using stratified random sampling and estimation. Remote Sens. Environ. 2015, 160, 114–121. [Google Scholar] [CrossRef]
  29. Tsela, P.; Wessels, K.; Botai, J.; Archibald, S.; Swanepoel, D.; Steenkamp, K.; Frost, P. Validation of the two standard MODIS satellite burned-area products and an empirically-derived merged product in South Africa. Remote Sens. 2014, 6, 1275–1293. [Google Scholar] [CrossRef]
  30. Van Der Werf, G.R.; Randerson, J.T.; Giglio, L.; Collatz, G.J.; Mu, M.; Kasibhatla, P.S.; Morton, D.C.; Defries, R.S.; Jin, Y.; Van Leeuwen, T.T. Global fire emissions and the contribution of deforestation, savanna, forest, agricultural, and peat fires (1997–2009). Atmos. Chem. Phys. 2010, 10, 11707–11735. [Google Scholar] [CrossRef] [Green Version]
  31. Van der Werf, G.R.; Randerson, J.T.; Giglio, L.; Collatz, G.J.; Kasibhatla, P.S.; Arellano, A.F. Interannual variability in global biomass burning emissions from 1997 to 2004. Atmos. Chem. Phys. 2006, 6, 3423–3441. [Google Scholar] [CrossRef] [Green Version]
  32. Randerson, J.T.; Chen, Y.; Van Der Werf, G.R.; Rogers, B.M.; Morton, D.C. Global burned area and biomass burning emissions from small fires. J. Geophys. Res. Biogeosci. 2012, 117, 1–23. [Google Scholar] [CrossRef]
  33. Chuvieco, E.; Yue, C.; Heil, A.; Mouillot, F.; Alonso-Canas, I.; Padilla, M.; Pereira, J.M.; Oom, D.; Tansey, K. A new global burned area product for climate assessment of fire impacts. Glob. Ecol. Biogeogr. 2016, 25, 619–629. [Google Scholar] [CrossRef]
  34. Boschetti, L.; Eva, H.D.; Brivio, P.A.; Grégoire, J.M. Lessons to be learned from the comparison of three satellite-derived biomass burning products. Geophys. Res. Lett. 2004, 31, 2–5. [Google Scholar] [CrossRef]
  35. Núñez-Casillas, L.; García Lázaro, J.R.; Moreno-Ruiz, J.A.; Arbelo, M. A Comparative Analysis of Burned Area Datasets in Canadian Boreal Forest in 2000. Sci. World J. 2013, 2013, 289056. [Google Scholar] [CrossRef] [PubMed]
  36. Freeborn, P.; Cochrane, M.; Wooster, M. A Decade Long, Multi-Scale Map Comparison of Fire Regime Parameters Derived from Three Publically Available Satellite-Based Fire Products: A Case Study in the Central African Republic. Remote Sens. 2014, 6, 4061–4089. [Google Scholar] [CrossRef]
  37. Schroeder, W.; Prins, E.; Giglio, L.; Csiszar, I.; Schmidt, C.; Morisette, J.; Morton, D. Validation of GOES and MODIS active fire detection products using ASTER and ETM+ data. Remote Sens. Environ. 2008, 112, 2711–2726. [Google Scholar] [CrossRef]
  38. Bastarrika, A.; Chuvieco, E.; Martin, M.P. Automatic burned land mapping from MODIS time series images: Assessment in Mediterranean ecosystems. IEEE Trans. Geosci. Remote Sens. 2011, 49, 3401–3413. [Google Scholar] [CrossRef]
  39. Chuvieco, E.; Englefield, P.; Trishchenko, A.P.; Luo, Y. Generation of long time series of burn area maps of the boreal forest from NOAA-AVHRR composite data. Remote Sens. Environ. 2008, 112, 2381–2396. [Google Scholar] [CrossRef]
  40. Merino-de-Miguel, S.; Huesca, M.; González-Alonso, F. Modis reflectance and active fire data for burn mapping and assessment at regional level. Ecol. Modell. 2010, 221, 67–74. [Google Scholar] [CrossRef]
  41. Fraser, R.H.; Li, Z.; Cihlar, J. Hotspot and NDVI Differencing Synergy (HANDS)-A New Technique for Burned Area Mapping over Boreal Forest. Remote Sens. Environ. 2000, 74, 362–376. [Google Scholar] [CrossRef]
  42. Urbanski, S.P.; Salmon, J.M.; Nordgren, B.L.; Hao, W.M. A MODIS direct broadcast algorithm for mapping wildfire burned area in the western United States. Remote Sens. Environ. 2009, 113, 2511–2526. [Google Scholar] [CrossRef]
  43. Chuvieco, E.; Opazo, S.; Sione, W.; Valle, H.; Anaya, J.; Bella, D.; Cruz, I.; Manzo, L.; López, G.; Mari, N.; et al. Global Burned-Land Estimation in Latin America Using Modis Composite Data. Ecol. Appl. 2008, 18, 64–79. [Google Scholar] [CrossRef] [PubMed]
  44. Yang, W.; Zhang, S.; Tang, J.; Bu, K.; Yang, J.; Chang, L. A MODIS time series data based algorithm for mapping forest fire burned area. Chin. Geogr. Sci. 2013, 23, 344–352. [Google Scholar] [CrossRef]
  45. Csiszar, I.A.; Morisette, J.T.; Giglio, L. Validation of active fire detection from moderate-resolution satellite sensors: The MODIS example in Northern Eurasia. IEEE Trans. Geosci. Remote Sens. 2006, 44, 1757–1764. [Google Scholar] [CrossRef]
  46. Roy, D.P.; Frost, P.G.H.; Justice, C.O.; Landmann, T.; Le Roux, J.L.; Gumbo, K.; Makungwa, S.; Dunham, K.; Du Toit, R.; Mhwandagara, K.; et al. The Southern Africa Fire Network (SAFNet) regional burned-area product-validation protocol. Int. J. Remote Sens. 2005, 26, 4265–4292. [Google Scholar] [CrossRef]
  47. De Araújo, F.M.; Ferreira, L.G. Satellite-based automated burned area detection: A performance assessment of the MODIS MCD45A1 in the Brazilian savanna. Int. J. Appl. Earth Obs. Geoinf. 2015, 36, 94–102. [Google Scholar] [CrossRef]
  48. Roy, D.P.; Boschetti, L. Southern Africa validation of the MODIS, L3JRC, and GlobCarbon burned-area products. IEEE Trans. Geosci. Remote Sens. 2009, 47, 1032–1044. [Google Scholar] [CrossRef]
  49. Anaya, J.A.; Chuvieco, E. Accuracy assessment of burned area products in the orinoco basin. Photogramm. Eng. Remote Sens. 2012, 78, 53–60. [Google Scholar] [CrossRef]
  50. Weiss, D.J.; Walsh, S.J. Remote Sensing of Mountain Environments. Geogr. Compass 2009, 3, 1–21. [Google Scholar] [CrossRef]
  51. Heinimann, A.; Breu, T.; Kohler, T. The challenge of applying Geographic Information Systems to sustainable mountain development. Mt. Res. Dev. 2003, 23, 312–319. [Google Scholar] [CrossRef]
  52. Grêt-Regamey, A.; Brunner, S.H.; Kienast, F. Mountain Ecosystem Services: Who Cares? Mt. Res. Dev. 2012, 32, S23–S34. [Google Scholar] [CrossRef]
  53. Mittermeier, R.A.; Myers, N.; Thomsen, J.B.; da Fonseca, G.A.B.; Olivieri, S. Biodiversity Hotspots and Major Tropical Wilderness Areas: Approaches to Setting Conservation Priorities. Conserv. Biol. 1998, 12, 516–520. [Google Scholar] [CrossRef]
  54. Mackinnon, J.R.; Carey, G. A Biodiversity Review of China; World Wide Fund for Nature (WWF) International, WWF China Programme: Beijing, China, 1996. [Google Scholar]
  55. Xiao, W.; Ding, W.; Cui, L.W.; Zhou, R.L.; Zhao, Q.K. Habitat degradation of Rhinopithecus bieti in Yunnan, China. Int. J. Primatol. 2003, 24, 389–398. [Google Scholar] [CrossRef]
  56. Li, J.; Song, Y.; Huang, X.; Li, M. Comparison of forest burned areas in mainland China derived from MCD45A1 and data recorded in yearbooks from 2001 to 2011. Int. J. Wildl. Fire 2014, 24, 103–113. [Google Scholar] [CrossRef]
  57. Xu, J.; Wilkes, A. Biodiversity impact analysis in northwest Yunnan, southwest China. Biodivers. Conserv. 2004, 13, 959–983. [Google Scholar] [CrossRef]
  58. Qin, X.; Li, Z.; Zhang, Z. Distribution Pattern of Fires in China Based on Satellite Data. In Proceedings of the 2010 Second lITA International Conference on Geoscience and Remote Sensing, Qingdao, China, 28–31 August 2010; pp. 503–506. [Google Scholar]
  59. Li, X.; Zhao, G.; Yu, X.; Yu, Q. A comparison of forest fire indices for predicting fire risk in contrasting climates in China. Nat. Hazards 2014, 70, 1339–1356. [Google Scholar] [CrossRef]
  60. Lü, A.; Tian, H.; Liu, M.; Liu, J.; Melillo, J.M. Spatial and temporal patterns of carbon emissions from forest fires in China from 1950 to 2000. J. Geophys. Res. 2006, 111, 1–12. [Google Scholar] [CrossRef]
  61. Shu, L.; Tian, X.; Wang, M. A Study on Forest Fire Occurrence in China. In Proceedings of the XII World Forestry Congress, Quebec City, QC, Canada, 21–23 September 2003; Available online: http://www.fao.org/docrep/ARTICLE/WFC/XII/0278-B1.HTM (accessed on 2 November 2017).
  62. Zhao, F.; Shu, L.; Tian, X.; Wang, M. Change trends of forest fire danger in Yunnan province in 1957–2007. Chin. J. Ecol. 2009, 28, 2333–2338. [Google Scholar]
  63. Tian, X.; Zhao, F.; Shu, L.; Wang, M. Changes in forest fire danger for south-western China in the 21st century. Int. J. Wildl. Fire 2014, 23, 185–195. [Google Scholar] [CrossRef]
  64. Tang, C.Q. Subtropical montane evergreen broad-leaved forests of Yunnan, China: Diversity, succession dynamics, human influence. Front. Earth Sci. China 2010, 4, 22–32. [Google Scholar] [CrossRef]
  65. Wang, C.; He, Z.; Zhu, W. Ouline of vegetation in Dulongjiang river watershed, Yunnan. Chin. J. Ecol. 2001, 20, 26–33. [Google Scholar]
  66. Ming, Q.; Shi, Z. New discussion on dry valley formation in the Three Parallel Rivers region. J. Desert Res. 2007, 27, 99–104. [Google Scholar]
  67. Tang, C.Q. The Subtropical Vegetation of Southwestern China: Plant Distribution, Diversity and Ecology; Plant and Vegetation; Springer: Dordrecht, The Netherlands, 2015; Volume 11, Available online: https://books.google.com.hk/books?hl=en&lr=&id=iHy6CAAAQBAJ&oi=fnd&pg=PR7&dq=The+Subtropical+Vegetation+of+Southwestern+China&ots=K0xHul_-Nv&sig=-n6mcAJitSpK_q6r6YwAaiP6NH8&redir_esc=y#v=onepage&q=The%20Subtropical%20Vegetation%20of%20Southwestern%20China&f=false (accessed on 2 November 2017).
  68. Justice, C.O.; Townshend, J.R.G.; Vermote, E.F.; Masuoka, E.; Wolfe, R.E.; Saleous, N.; Roy, D.P.; Morisette, J.T. An overview of MODIS Land data processing and product status. Remote Sens. Environ. 2002, 83, 3–15. [Google Scholar] [CrossRef]
  69. Chang, D.; Song, Y. Comparison of L3JRC and MODIS global burned area products from 2000 to 2007. J. Geophys. Res. 2009, 114, 1–20. [Google Scholar] [CrossRef]
  70. Ruiz, J.A.; Lázaro, J.R.; Cano, I.D.; Leal, P.H. Burned area mapping in the North American boreal forest using terra-MODIS LTDR (2001-2011): A comparison with the MCD45A1, MCD64A1 and BA GEOLAND-2 products. Remote Sens. 2013, 6, 815–840. [Google Scholar] [CrossRef]
  71. Veraverbeke, S.; Sedano, F.; Hook, S.J.; Randerson, J.T.; Jin, Y.; Rogers, B.M. Mapping the daily progression of large wildland fires using MODIS active fire data. Int. J. Wildl. Fire 2014, 23, 655–667. [Google Scholar] [CrossRef]
  72. Hollmann, R.; Merchant, C.J.; Saunders, R.; Downy, C.; Buchwitz, M.; Cazenave, A.; Chuvieco, E.; Defourny, P.; de Leeuw, G.; Forsberg, R.; et al. The ESA Climate Change Initiative: Satellite Data Records for Essential Climate Variables. Bull. Am. Meteorol. Soc. 2013, 94, 1541–1552. [Google Scholar] [CrossRef] [Green Version]
  73. Pettinari, M.L.; Chuvieco, E.; Alonso-Canas, I.; Parellada, M.P. ESA CCI ECV Fire Disturbance: Product User Guide, Version 2.1. 2016. Available online: http://www.esa-fire-cci.org/documents (accessed on 3 November 2017).
  74. Barbosa, P.M.; Grégoire, J.-M.; Pereira, J.M. An Algorithm for Extracting Burned Areas from Time Series of AVHRR GAC Data Applied at a Continental Scale. Remote Sens. Environ. 1999, 69, 253–263. [Google Scholar] [CrossRef]
  75. Morisette, J.T.; Baret, F.; Liang, S. Special issue on global land product validation. IEEE Trans. Geosci. Remote Sens. 2006, 44, 1695–1697. [Google Scholar] [CrossRef]
  76. Olofsson, P.; Foody, G.M.; Herold, M.; Stehman, S.V.; Woodcock, C.E.; Wulder, M.A. Good practices for estimating area and assessing accuracy of land change. Remote Sens. Environ. 2014, 148, 42–57. [Google Scholar] [CrossRef]
  77. Fleiss, J.L.; Levin, B.; Paik, M.C. Statistical Methods for Rates and Proportions, 3rd ed.; John Wiley & Sons: New York, NY, USA, 2003. [Google Scholar]
  78. Hantson, S.; Padilla, M.; Corti, D.; Chuvieco, E. Strengths and weaknesses of MODIS hotspots to characterize global fire occurrence. Remote Sens. Environ. 2013, 131, 152–159. [Google Scholar] [CrossRef]
  79. Boschetti, L.; Flasse, S.P.; Brivio, P.A. Analysis of the conflict between omission and commission in low spatial resolution dichotomic thematic products: The Pareto Boundary. Remote Sens. Environ. 2004, 91, 280–292. [Google Scholar] [CrossRef]
  80. Hall, J.V.; Loboda, T.V.; Giglio, L.; McCarty, G.W. A MODIS-based burned area assessment for Russian croplands: Mapping requirements and challenges. Remote Sens. Environ. 2016, 184, 506–521. [Google Scholar] [CrossRef]
  81. Schroeder, W.; Oliva, P.; Giglio, L.; Csiszar, I.A. The New VIIRS 375m active fire detection data product: Algorithm description and initial assessment. Remote Sens. Environ. 2014, 143, 85–96. [Google Scholar] [CrossRef]
  82. Hawbaker, T.J.; Vanderhoof, M.K.; Beal, Y.J.; Takacs, J.D.; Schmidt, G.L.; Falgout, J.T.; Williams, B.; Fairaux, N.M.; Caldwell, M.K.; Picotte, J.J.; et al. Mapping burned areas using dense time-series of Landsat data. Remote Sens. Environ. 2017, 198, 504–522. [Google Scholar] [CrossRef]
  83. Vanderhoof, M.K.; Fairaux, N.; Beal, Y.J.G.; Hawbaker, T.J. Validation of the USGS Landsat Burned Area Essential Climate Variable (BAECV) across the conterminous United States. Remote Sens. Environ. 2017, 198, 393–406. [Google Scholar] [CrossRef]
Figure 1. Location of the study area. The most restrictive boundaries of northwest Yunnan and a broader definition of the region, as well as the Landsat coverage selected for the accuracy assessment are represented. The large map shows the main landcover classes according to MODIS MCD12Q1 product for 2011 over a shaded relief. The four major rivers flowing across the region in a parallel manner on the northern section, from West to East: the Dulongjiang (tributary of the Irrawaddy), the Nujiang (upper Salween), the Lancangjiang (upper Mekong), and the Jinshajiang (upper Yangtze). (MCD12Q1 reference: (https://lpdaac.usgs.gov/dataset_discovery/modis/modis_products_table/mcd12q1, last accessed on 25 September 2017).
Remotesensing 09 01131 g001
Figure 2. Example of polygon intersection assessment: (1) Burn scar visible on Landsat false color infrared composite; (2) Reference dataset manually mapped burn polygon; (3) European Space Agency’s (ESA’s) Fire_CCI and MCD45A1 products overlay. Despite both products show different degrees of omission and commission errors at a sub-pixel level, in our accuracy assessment, the two detections of the fire event are considered equally successful.
Remotesensing 09 01131 g002
Table 1. Summary of the selected active fire (AF) and burned areas (BA) products.
ProductSatelliteSpatial ResolutionTemporal ResolutionTime CoverageAlgorithmReference
MCD45A1MODIS Aqua & Terra500 mDaily (Terra: day; Aqua: night)2001–January 2017Bi-directional reflectance model-based change detection approach[24]
MCD14MLMODIS Aqua & Terra1000 mDaily (Terra: day; Aqua: night)2001–presentContextual algorithm applied on middle and shortwave infrared channels[17]
MCD64A1MODIS Aqua & Terra500 mDaily (Terra: day; Aqua: night)2001–presentHybrid algorithm using AF hotspots and dynamic threshold over multi temporal spectral indices changes[25]
Fire_CCIEnvisat-MERIS and MODIS Aqua & Terra300 mDaily (MODIS AF); ~3 days (MERIS)2005–2011Hybrid algorithm using AF hotspots and multi-temporal changes in reflectance[23]
Table 2. Performances of MCD45A1, MCD64A1, MCD14ML, and Fire_CCI products in a control site in northwest Yunnan for the year 2006, 2009, and 2006 & 2009 combined. F1 score and user’s accuracy (UA) are shown for burned areas (BA) > 12.5 ha (full dataset) only, while producer’s accuracy (PA) is shown for BA > 12.5 ha, > 25 ha, and > 50 ha.
200620092006 & 2009
F1 ScoreUA (%)PA (%) BA > 12.5 haPA (%) BA > 25 haPA (%) BA > 50 haF1 ScoreUA (%)PA (%) BA > 12.5 haPA (%) BA > 25 haPA (%) BA > 50 haF1 ScoreUA (%)PA (%) BA > 12.5 haPA (%) BA > 25 haPA (%) BA > 50 ha
MCD45A10.42703036530.24521624410.3159212846
MCD64A10.22691316250.08305690.134471016
MCD14ML0.26194351610.24164757660.2517465564
Fire_CCI0.16371013170.1111013180.1215101318
Table 3. Number of fire events correctly detected (det) and producer’s accuracy (PA) of MCD45A1, MCD64A1, MCD14ML, and Fire_CCI products in a control site in northwest Yunnan for the year 2006, 2009, and 2006, and 2009 combined. Three different BA sizes are shown: 12.5 to 25 ha, 25 to 50 ha, and >50 ha.
200620092006 & 2009
BA 12.5–25 ha (n = 15)BA 25–50 ha (n = 19)BA > 50 ha (n = 36)BA 12.5–25 ha (n = 55)BA 25–50 ha (n = 45)BA > 50 ha (n = 44)BA 12.5–25 ha (n = 70)BA 25–50 ha (n = 64)BA > 50 ha (n = 80)
detPAdetPAdetPAdetPAdetPAdetPAdetPAdetPAdetPA
MCD45A116.7%15.3%1952.8%23.6%36.7%1840.9%34.3%46.3%3746.3%
MCD64A100.0%00.0%1336.1%23.6%12.2%49.1%22.9%11.6%1721.3%
MCD14ML213.3%631.6%2261.1%1730.9%2248.9%2965.9%1927.1%2843.8%5163.8%
Fire_CCI00.0%15.3%616.7%23.6%48.9%818.2%22.9%57.8%1417.5%
Table 4. Number of committed fire events organized by their size in pixels. Pixel sizes is relative to individual fire products.
N° of Fire Events/Commission Pixels
20062009
1 px2 px3 px4–7 px8–20 px>20 px1 px2 px3 px4–7 px8–20 px>20 px
MCD45A172923441
MCD64A122592
MCD14ML1002072396915213
Fire_CCI3.23225519713137
Table 5. Cross-comparison of reference fires detected and not detected by MODIS MCD14ML (active fire) and MCD45A1 (burned area). The tables emphasize fires detected by both products, fires detected by only one of the two products, and fire not detected by both products. This cross-comparison is useful to evaluate if the two products are sensitive to the same fire events or detect different fire events. Producer’s accuracy is calculated using the detection rate of a possible merged product (merged detection).
MCD14ML Cross MCD45A1
2006 Fires > 12.5 ha2009 Fires > 12.5 ha2006 & 2009 Fires > 12.5 ha
MCD14MLTot. MCD45A1MCD14MLTot. MCD45A1MCD14MLTot. MCD45A1
detnot detdetnot detdetnot det
MCD 45A1detected101121MCD 45A1detected121123MCD 45A1detected222244
not detected2029not detected5665not detected7694
Tot. MCD14ML30Tot. MCD14ML68Tot. MCD14ML98
Ref. Landsat fires70Ref. Landsat fires144Ref. Landsat fires214
Merged fires177Merged fires438Merged fires615
Merged detection41Merged detection79Merged detection120
Omitted29Omitted65Omitted94
Committed136Committed359Committed495
Producer’s Acc58.6%Producer’s Acc54.9%Producer’s Acc56.1%
User’s Acc23.2%User’s Acc18.0%User’s Acc19.5%
F1 score0.33F1 score0.27F1 score0.29

