Fire Regimes and Their Drivers in the Upper Guinean Region of West Africa


Geospatial Sciences Center of Excellence, South Dakota State University, Brookings, SD 57007, USA
*
Author to whom correspondence should be addressed.
Remote Sens. 2017, 9(11), 1117; https://doi.org/10.3390/rs9111117
Submission received: 15 September 2017
/
Revised: 20 October 2017
/
Accepted: 31 October 2017
/
Published: 2 November 2017
Abstract
:The Upper Guinean region of West Africa exhibits strong geographic variation in land use, climate, vegetation, and human population and has experienced phenomenal biophysical and socio-economic changes in recent decades. All of these factors influence spatial heterogeneity and temporal trends in fires, but their combined effects on fire regimes are not well understood. The main objectives of this study were to characterize the spatial patterns and interrelationships of multiple fire regime components, identify recent trends in fire activity, and explore the relative influences of climate, topography, vegetation type, and human activity on fire regimes. Fire regime components, including active fire density, burned area, fire season length, and fire radiative power, were characterized using MODIS fire products from 2003 to 2015. Both active fire and burned area were most strongly associated with vegetation type, whereas fire season length was most strongly influenced by climate and topography variables, and fire radiative power was most strongly influenced by climate. These associations resulted in a gradient of increasing fire activity from forested coastal regions to the savanna-dominated interior, as well as large variations in burned area and fire season length within the savanna regions and high fire radiative power in the westernmost coastal regions. There were increasing trends in active fire detections in parts of the Western Guinean Lowland Forests ecoregion and decreasing trends in both active fire detections and burned area in savanna-dominated ecoregions. These results portend that ongoing regional landscape and socio-economic changes along with climate change will lead to further changes in the fire regimes in West Africa. Efforts to project future fire regimes and develop regional strategies for adaptation will need to encompass multiple components of the fire regime and consider multiple drivers, including land use as well as climate.
1. Introduction
Wildfires are a principal force shaping ecological patterns and processes across diverse terrestrial ecosystems. The complex interactions of ignition sources with vegetation, climate, and topography give rise to fire regimes, an ecological concept describing the range of fire characteristics occurring at a given geographic location and time period [1,2]. Fire regimes can be characterized by various metrics, including fire size, seasonality, frequency, intensity, and severity. Examining multiple components of the fire regime is therefore necessary for understanding the geographic patterns, drivers, and ecological effects of fire [3]. This knowledge is essential for projecting how fire regimes will respond to future changes in climate and land use, and for developing strategies to adapt to these changes. West Africa, in particular, is a region where fire has a significant impact on terrestrial ecosystems [4,5]. The region also exhibits strong geographic variation in land use, climate, vegetation types, and human population, all of which influence spatial heterogeneity of fire regimes. The main goal of this study was to explore the influences of climate, vegetation, and land use on multiple fire regime components across the forest and woody savanna zones of West Africa.
Over the past four decades West Africa has lost a substantial portion of its natural vegetation, including savannas, woodlands, and forests, to expanding croplands and human settlements. As a result, the remaining natural vegetation is highly fragmented [5,6]. A recent analysis of satellite remote sensing data indicated a decreasing trend of woody vegetation cover across the savanna ecoregions along with widespread degradation of the humid forests [7]. The tropical humid forest (also known as the Upper Guinean forest, UGF), a globally significant biodiversity hotspot [8], is estimated to have lost over 80% of its original forest cover, with the remainder distributed in a fragmented agriculture-forest mosaic [9,10]. Moreover, West Africa’s population almost doubled between 1990 and 2015 (180 to 353 million), and it is projected to nearly double again by 2050, from 353 million to 797 million [11]. The region has also been experiencing climate change in recent decades. Temperatures have become warmer, and precipitation has either not changed or declined for many locations below the Sahel, especially along the Guinea Coast [12].
In the rapidly changing environment of West Africa, fire regimes are affected by changes that alter fuel conditions and ignitions, but fire also serves as a driver of vegetation and land use change. As a result, fire and vegetation change are linked via strong positive and negative feedbacks [4]. Yet, studies of fire regimes in this region are rare. Quite recently, Prichard et al. [13] reviewed fire regimes across the world’s major bioregions and pointed out the relative scarcity of literature on African savannas. Surprisingly this review did not include any examples of research on tropical forest fires in Africa.
Much of our knowledge of fire regimes in West Africa has been gleaned from studies conducted at broader continental to global extents. In a global characterization of fire regimes, Archibald et al. [14] found that most of the region was dominated by relatively frequent, small-sized fires with low intensity. Additionally, the West African fire regime was largely controlled by human impacts [2]. Another global analysis of burned areas also indicated that human activities strongly influence fire size distribution in West Africa through land cover changes, fire ignitions, landscape fragmentation, and fire management [15,16]. Multiple studies have found evidence of decreasing fire activity in the dry, savanna-dominated regions across Africa [17,18,19]. Most regional to continental scale fire studies have not explicitly addressed the tropical forest regions of West Africa, where fire is relatively rare. However, there is evidence that fires have encroached into the northern portions of the dry tropical forest zone in recent decades, leading to degradation and eventual loss of forest vegetation [4].
Although studies of fire have been conducted in other tropical regions, the distinctive physical and social environments of West Africa suggest that knowledge from such studies is not directly transferable. For example, land use pressure in the forested zone is dominated by selective logging, small-scale slash-and-burn farming and bush meat hunting, in contrast to the agro-industrial pressures that are prevalent in the tropical Americas [20]. Disproportionate dependence on forest resources, high levels of poverty, and recent history of wars and political instability are all important socio-economic characteristics of the Upper Guinean region. Given these unique features, better regional information about the patterns and drivers of fire regime is needed to support projections of future fire regime changes and aid in the development of adaptation strategies. To help meet these needs, we conducted a regional study of fire regimes in the forest and woody savanna dominated portions of West Africa and addressed the following research questions:
- What are the spatial patterns and interrelationships of multiple fire regime components in the Upper Guinean region?
- What are the overall trends in fire activity and how do they differ amongst the humid forest and the savanna-dominated ecoregions?
- How do the relative influences of climate, topography, vegetation type, and human activity vary across different fire regime components?
2. Materials and Methods
2.1. Study Area
Our study area encompassed a portion of the UGF region and consisted of five West African countries distributed along the Atlantic coast between Senegal and Togo. This area covered 985,480 km2 and included Ghana, Côte d’Ivoire, Liberia, Sierra Leone, and Guinea (Figure 1). The climate is characterized by a strong rainfall gradient with peak rainfall (≈4000 mm/year) near the coasts of Guinea, Sierra Leone and Liberia. Rainfall decreases rapidly in a north-easterly direction to only ≈1200 mm/year at the forest savannah-boundary [10] and less than 1200 mm/year in the driest portions of the study area. Generally, decreasing rainfall is associated with a longer dry season and higher inter-annual variability of rainfall [21]. The rainfall regimes are modulated by the Intertropical Convergence Zone (ITCZ) and the West Africa Monsoon (WAM) and are influenced by teleconnections with climate modes, such as the El Niño-Southern Oscillation (ENSO) and Atlantic Multidecadal Oscillation (AMO) [21,22].
Along this rainfall gradient, natural vegetation varies from dense evergreen rainforests, to moist and dry closed-canopy semi-deciduous forests, to woodlands and savannas [10]. The area is mainly covered by four of the World Wide Fund (WWF) terrestrial ecoregions of the world [23]. These are the Eastern Guinean Forests (EGF) and Western Guinean Lowland Forests (WGLF), together comprising the Upper Guinean Forests; and the Guinean Forest–Savanna Mosaic (GFSM) and West Sudanian Savanna (WSS) ecoregions (Figure 1a). The principal land use is agriculture based on food and cash crops, chiefly cereals, cocoa, tubers, rubber, and fruit trees [6]. Other important land use practices include mining and timber exploitation in the forested regions, agro-pastoralism, and tree harvesting for fuel-wood, especially charcoal, in the drier savanna-dominated regions [6].
2.2. Remotely-Sensed Fire Data
2.2.1. Active Fires
We obtained active fire detections at 1-km resolution from the combined MODIS Terra (10:30 am/pm Equatorial nominal overpass time) and Aqua (1:30 pm/am Equatorial nominal overpass time) active fire product MCD14ML, level 3 Collection 6 [24,25]. We used the detection confidence and hot-spot type fields in the MCD14ML data to respectively remove low confidence fires (<30%) and non-vegetation fires. We used the fire radiative power (FRP) measurement associated with each MODIS active fire detection as a measure of fire intensity [25]. FRP is the rate of fire energy released per unit time, and this information is retrieved using MODIS mid-infrared wavelengths [26]. In Collection 6 of the MCD14ML product, FRP retrieval uses a radiance-based approach in which the 4-μm radiance of individual fire pixels and surrounding background pixels are compared [24,26]. FRP can be interpreted as a measure of biomass combustion rate, and is increasingly used by the atmospheric emissions modeling community to estimate vegetation burning emissions [27,28].
2.2.2. Burned Area
We used the MODIS burned area product, MCD64A1 Collection 6, to measure burned area. This product uses an improved algorithm that incorporates both surface reflectance and active fire input data [29]. Consequently, this product has generally improved burned area detection than the previous product MCD45A1, with higher accuracy and significantly better detection of small burns [30]. The MCD64A1 product has a spatial resolution of 500 m at a daily time step.
2.3. Derived Fire Regime Variables
We summarized the active fire and burned area data from 2003 to 2015, covering the period within which data were simultaneously collected by both MODIS Terra and Aqua satellites. Four main grid-based fire regime metrics were calculated: mean annual active fire density, percent mean annual burned area, fire season length, and mean fire radiative power (Table 1). We also generated other indicators of fire seasonality, including peak fire month, the percentage of active fire detections occurring in the peak month, and the percent monthly distributions of active fires and area burned by ecoregion. Variables were summarized for a grid of 0.25° raster cells and for the four major ecoregions described previously.
2.3.1. Active Fire Density
We summarized the active fire data into time series of monthly and annual active fire counts for each grid cell and ecoregion. We used the annual active fire densities to compute the mean annual active fire density (fires km−2 year−1) for each grid cell and ecoregion.
2.3.2. Annual Burned Area
Monthly and annual burned areas were calculated for each grid cell and ecoregion and summarized as a percent of the total land area. We used the annual burned area data to compute the mean annual burned area (% year−1) for each grid cell and ecoregion.
2.3.3. Fire Season Characteristics
We used the grid-based monthly time series data to compute a monthly climatology of active fire density for each grid cell using methods developed by Chuvieco et al. [31] and Moreno and Chuvieco [32]. Following these same authors, we computed fire season length as the number of calendar months within a year in which the monthly fire climatology was greater than the long-term average annual fire density per each grid [32]. We further identified the peak fire month for each grid cell as the calendar month in which the maximum climatological fire density was recorded [33]. We also calculated the percentage of active fire detections recorded in the peak fire month as a proportion of the total annual active fire detections for each grid cell. To examine the intra-annual variability of fire activity by ecoregion, we used the ecoregion-based monthly fire data to calculate the percent of total active fire counts and the percent of total burned area that occurred during each month.
2.3.4. Mean Fire Radiative Power
We calculated the mean fire radiative power (MW km−2) for each climate grid by averaging fire radiative power values of all fire pixels over all years in each grid cell. The distribution of mean fire radiative power was heavily right-skewed. Therefore, we carried out a logarithmic (base 10) transformation to make the distribution more symmetric and reduce the influence of outlying values.
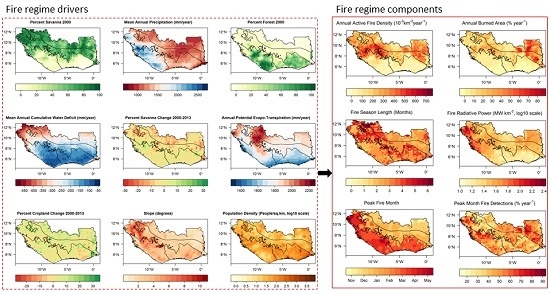
2.4. Predictor Variables for Analyses of Fire Drivers
Predictor variables were selected to characterize the major climatic, land cover/land use, and human factors that we expected to be associated with the geographic pattern of fire regimes [34,35] (Table 1). We used the Tropical Rainfall Measuring Mission (TRMM) monthly product 3B43-v7 at 0.25° spatial resolution to generate mean annual rainfall and annual maximum cumulative water deficit (MCWD). MCWD estimates accumulated water deficit within a particular year and is an indicator of the intensity and length of the dry season [36]. More negative values of MCWD indicate higher levels of moisture stress. We computed MCWD using methods described by Aragão et al. [36]. We also included annual potential evapotranspiration estimates from the CGIAR-CSI Global-Aridity and Global-PET Geospatial Database [37]. Higher values of potential evapotranspiration indicate greater moisture stress. All predictor variables were aggregated to match the 0.25° spatial resolution of the TRMM data.
We generated vegetation cover and vegetation change maps from 2-km spatial resolution USGS region-specific land cover/use maps for West Africa for 2000 and 2013, which were created through visual interpretation of Landsat images [6]. Some of the detailed USGS cover types were aggregated into broader classes. The “forest” class included forest, degraded forest, woodland, and swamp forest. The “savanna” class included savanna, bowe, and herbaceous savanna. The “cropland” class included agriculture, irrigated agriculture, agriculture in shallows and recession, and cropland and fallow with oil palms. We expressed these classes as percent cover at the 0.25° grid cell resolution.
We obtained a protected area (PA) boundaries polygon layer from the World Database on Protected Areas (accessed in November 2016). We reclassified PAs into two classes (production reserve and eco-reserve) based on their level of protection as defined by the Protected Categories System of the International Union for Conservation of Nature (IUCN). Production reserve (PR) encompassed PAs of IUCN category VI, which are designated for natural ecosystems’ protection and sustainable use. Eco-reserves (ER) encompassed PAs of IUCN category I to V, which are designated to maintain and protect biodiversity and ecosystem integrity with minimal human influence. We assigned all areas outside PAs to non-protected (NP) status. We rasterized the PA polygons by resampling to the TRMM grid, and retaining PA status as the raster values.
The new Gridded Population of the World (GPWv4) dataset, at 1 km grid resolution (CIESIN, 2015) was used to obtain 2010 population density estimates. We extracted the major roads (functional class 0-3) GIS layer from the Global Roads Open Access Data Set (gROADSv1, [38]). We ran the Euclidean distance function in ArcGIS 10.2 to generate a raster grid of distances to the nearest major road. We calculated slope from a 90 m spatial resolution digital elevation model using ArcGIS 10.2.
To check for excessive data redundancy, we screened the intercorrelations among the predictors and found that nearly all had Pearson correlations <0.65 and >−0.65 (Table 1). An exception was MCWD which had stronger correlations with the savanna and forest variables.
2.5. Analysis Methods
2.5.1. Question 1: What Are the Spatial Patterns and Interrelationships of Multiple Fire Regime Components in the Upper Guinean Region?
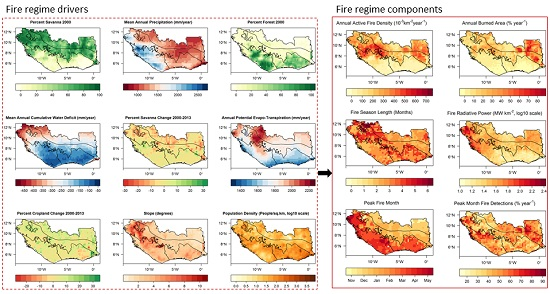
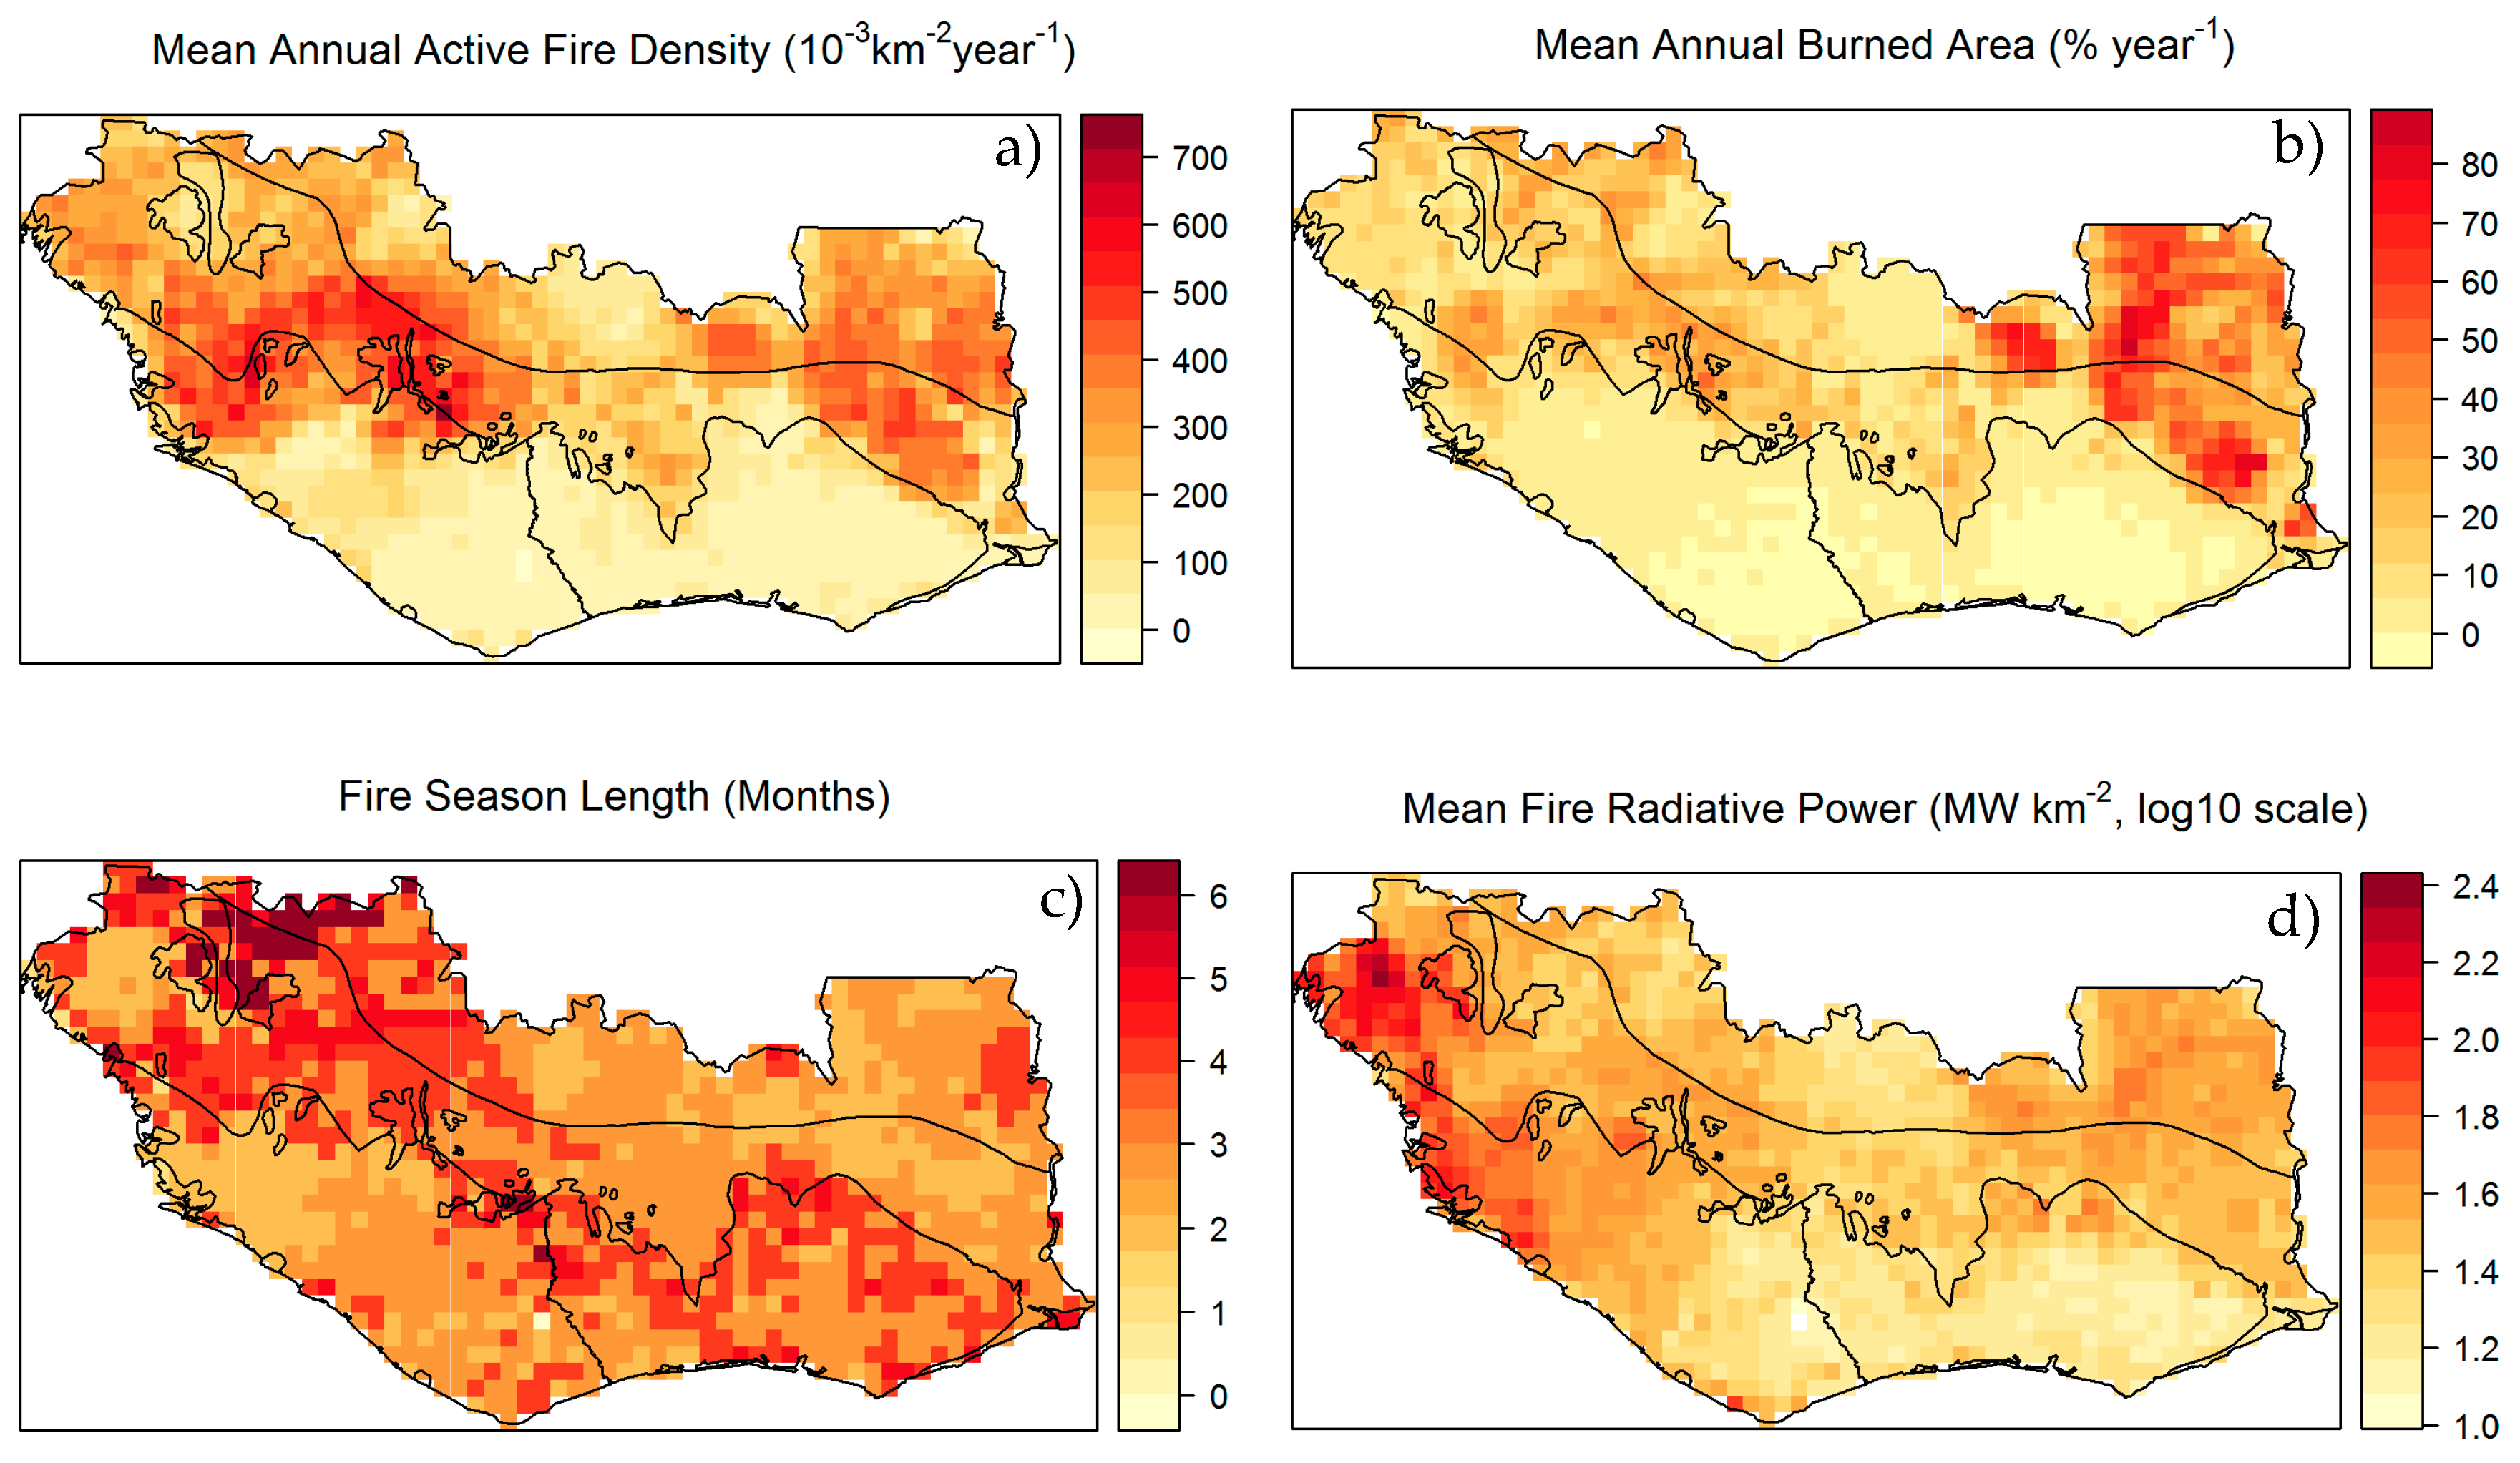
To characterize the spatial patterns of fire activity in the Upper Guinean region, we mapped the four main fire regime components: mean annual active fire density, percent mean annual burned area, fire season length, and mean fire radiative power. We graphed the bivariate relationships amongst these fire regime components, and used the Kendall non-parametric rank correlation coefficient test to determine the direction and the strength of correlations among their spatial patterns. We also mapped peak fire month and the corresponding percent of fire detections and graphed the seasonal cycle of fire distribution and tabulated summaries of fire regime characteristics by ecoregion.
2.5.2. Question 2: What Are the Overall Trends in Fire Activity and How Do They Differ Amongst the Humid Forest and the Savanna-Dominated Ecoregions?
We used the non-parametric Mann–Kendall test to test for increasing monotonic upward or downward trends in annual time series active fire density and burned area for each grid cell and ecoregion. The Mann–Kendall test was used for trend detection in previous fire regime analysis [42]. We followed criteria outlined in Liu et al. [7] for the grid-based trend test and set a significance level of 0.1. Trends were calculated only for grid cells with at least six data points, and at most eight consecutive missing data points.
2.5.3. Question 3: How Do the Relative Influences of Climate, Topography, Vegetation Type, and Human Activity Vary across Different Fire Regime Components?
We used Boosted Regression Trees (BRT) to determine the most important environmental drivers of each of the four main fire regime components: active fire density, burned area, fire season length, and fire radiative power. BRT is a nonparametric machine-learning approach combining the advantages of regression trees, which relate a response to their predictors by recursive binary splits, and boosting algorithms, which combine many simple models to give improved predictive performance [43]. It is relatively insensitive to outliers and is able to handle various data types, accommodate missing data in predictor variables, automatically model interactions among explanatory variables, and produce easily interpretable results [43]. We implemented BRT analyses using the gbm functions in the dismo package in R 3.4.1 [44].
In order to avoid overfitting, we used cross-validation procedure to identify optimal model parameters (tree complexity-tc, learning rate-lr, and number of trees-nt), and the best combination of these parameters was selected by maximizing the variance explained by the model. Model fitting were evaluated using 10-fold cross-validation correlation between observed and model fitted datasets [44]. We used a Gaussian error model and a bag fraction of 0.75, and obtained the best tc = 3 for all BRT models of the four fire regime components. In the active fire density model, lr of 0.075, and nt of 2400 were selected. In the burned area model, lr of 0.05, and nt of 2160 were selected. In the fire season length model, lr of 0.025, and nt of 2100 were selected. In the fire radiative power model, lr of 0.075, and nt of 1800 were selected.
BRT measured the relative influence of each predictor variable based on the number of times that variable was selected for splitting, weighted by the squared improvement to the model resulting from these splits, and averaged over all trees [43]. The relative influence of each variable was scaled to a total of 100%, with higher values indicating stronger influence on the fire regime component. The marginal effect of each variable was visualized using partial dependence graphs, which showed the effect of that variable on a fire regime component after accounting for the average effects of all other variables [43].
3. Results
3.1. Question 1: What Are the Spatial Patterns and Interrelationships of Multiple Fire Regime Components in the Upper Guinean Region?
Figure 2 depicts geographic distributions of the four main fire regime components. An overarching gradient of fire activity were evident in relation to patterns of precipitation and vegetation, with the highest values of active fire density, burned area, and fire radiative power clustered in the Guinean Forest–Savanna Mosaic (GFSM) and Western Sudanian Savanna (WSS) ecoregions in the North. In contrast, there was much lower fire activity in the Western Guinean Lowland Forest (WGLF) and Eastern Guinean Forest (EGF) ecoregions located in the South. However, the different fire regime components also exhibited distinctive patterns. Unusually high active fire density and relatively long fire seasons ranging from 4 to 6 months were observed in the western portion of the study area at the boundary between the WGLF and the GFSM (Figure 2). The highest fire radiative power was concentrated near the coast in the westernmost portion of the study area. In contrast, burned area was highest in the WSS and GFSM ecoregions in the northeastern portion of the study area. This area also had slightly lower active fire density than the northwestern region, along with a relatively short fire season length of 2–3 months.
Among the fire regime components, the strongest relationship was between active fire density and burned area (τ = 0.61, p < 0.0001, Figure 3). Active fire density had a moderate relationship with fire radiative power (τ = 0.48, p < 0.0001). All other relationships were weak and mostly nonlinear (Figure 3).
At the ecoregion scale, active fire density was highest in the GFSM, followed by WSS and then WGLF; and burned area was highest in the WSS, followed by GFSM, and then WGLF (Table 2). Among all ecoregions, the forested EGF recorded the lowest active fire density, burned area, and fire radiative power (Table 2). Fire season averaged about 3-months in all ecoregions (Table 2). Within ecoregions fire season length was spatially heterogeneous, with fire seasons longer than three months localized in the north-western part of the study area and in portions of the EGF.
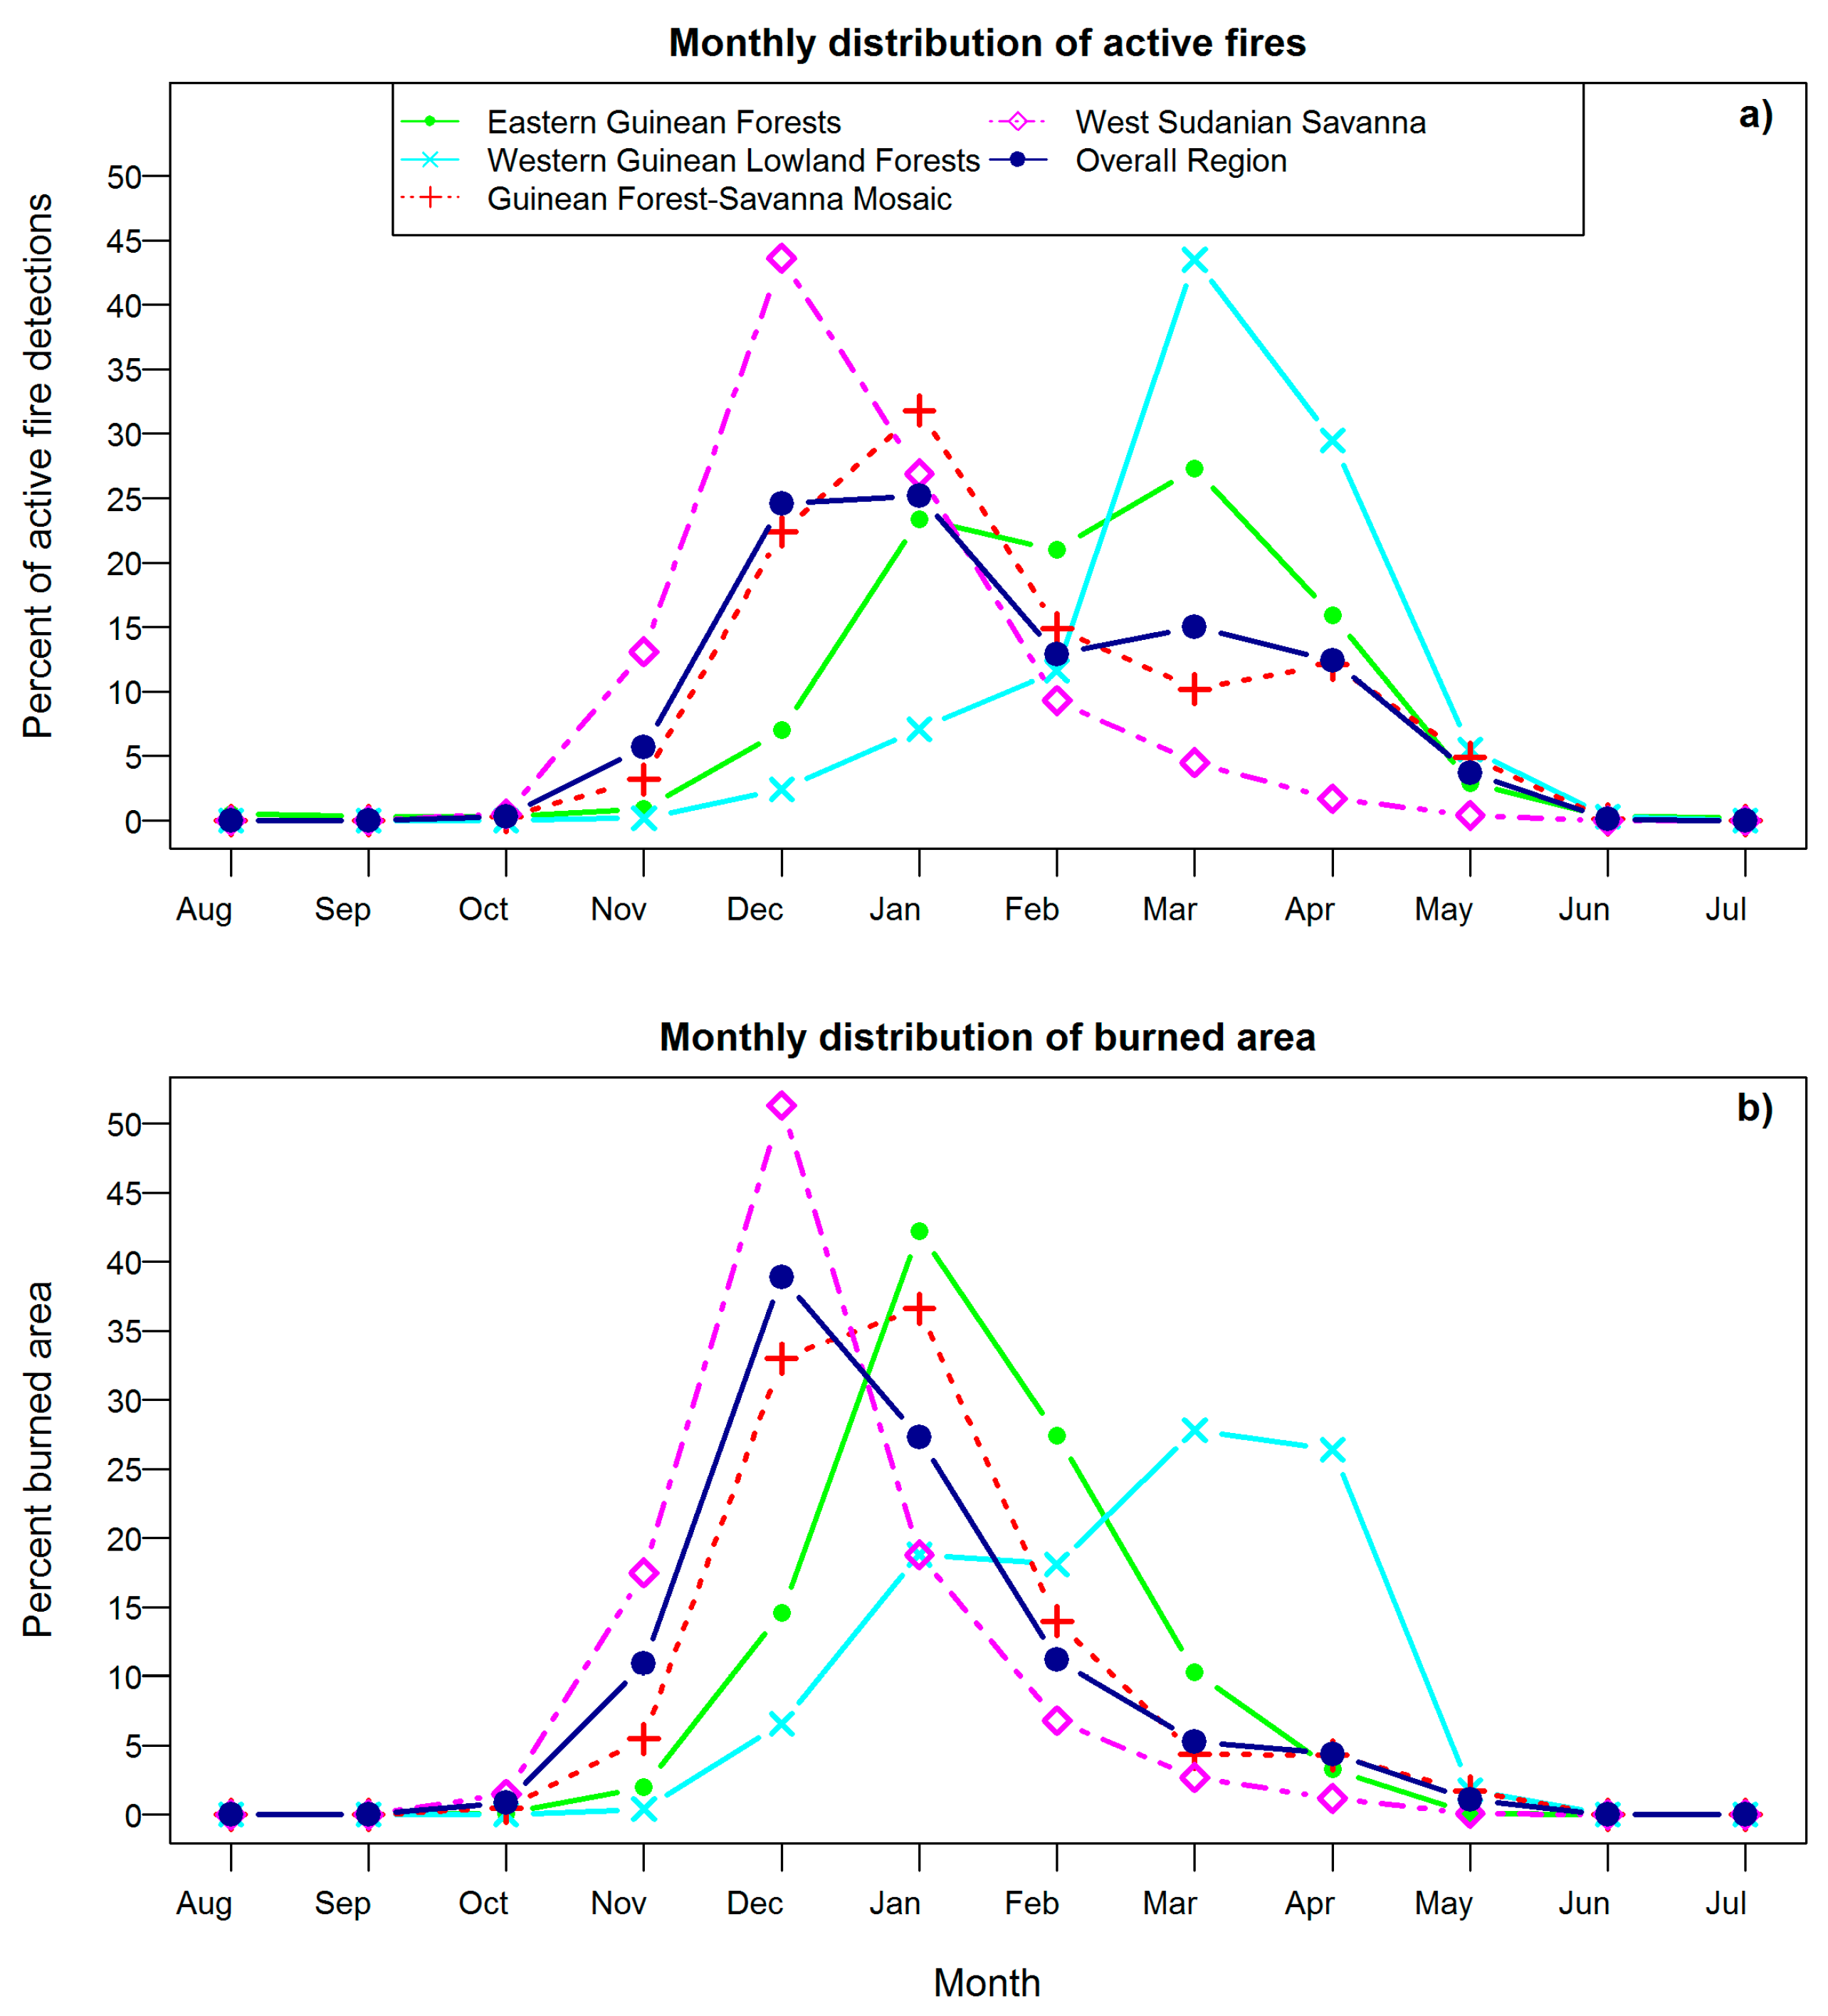
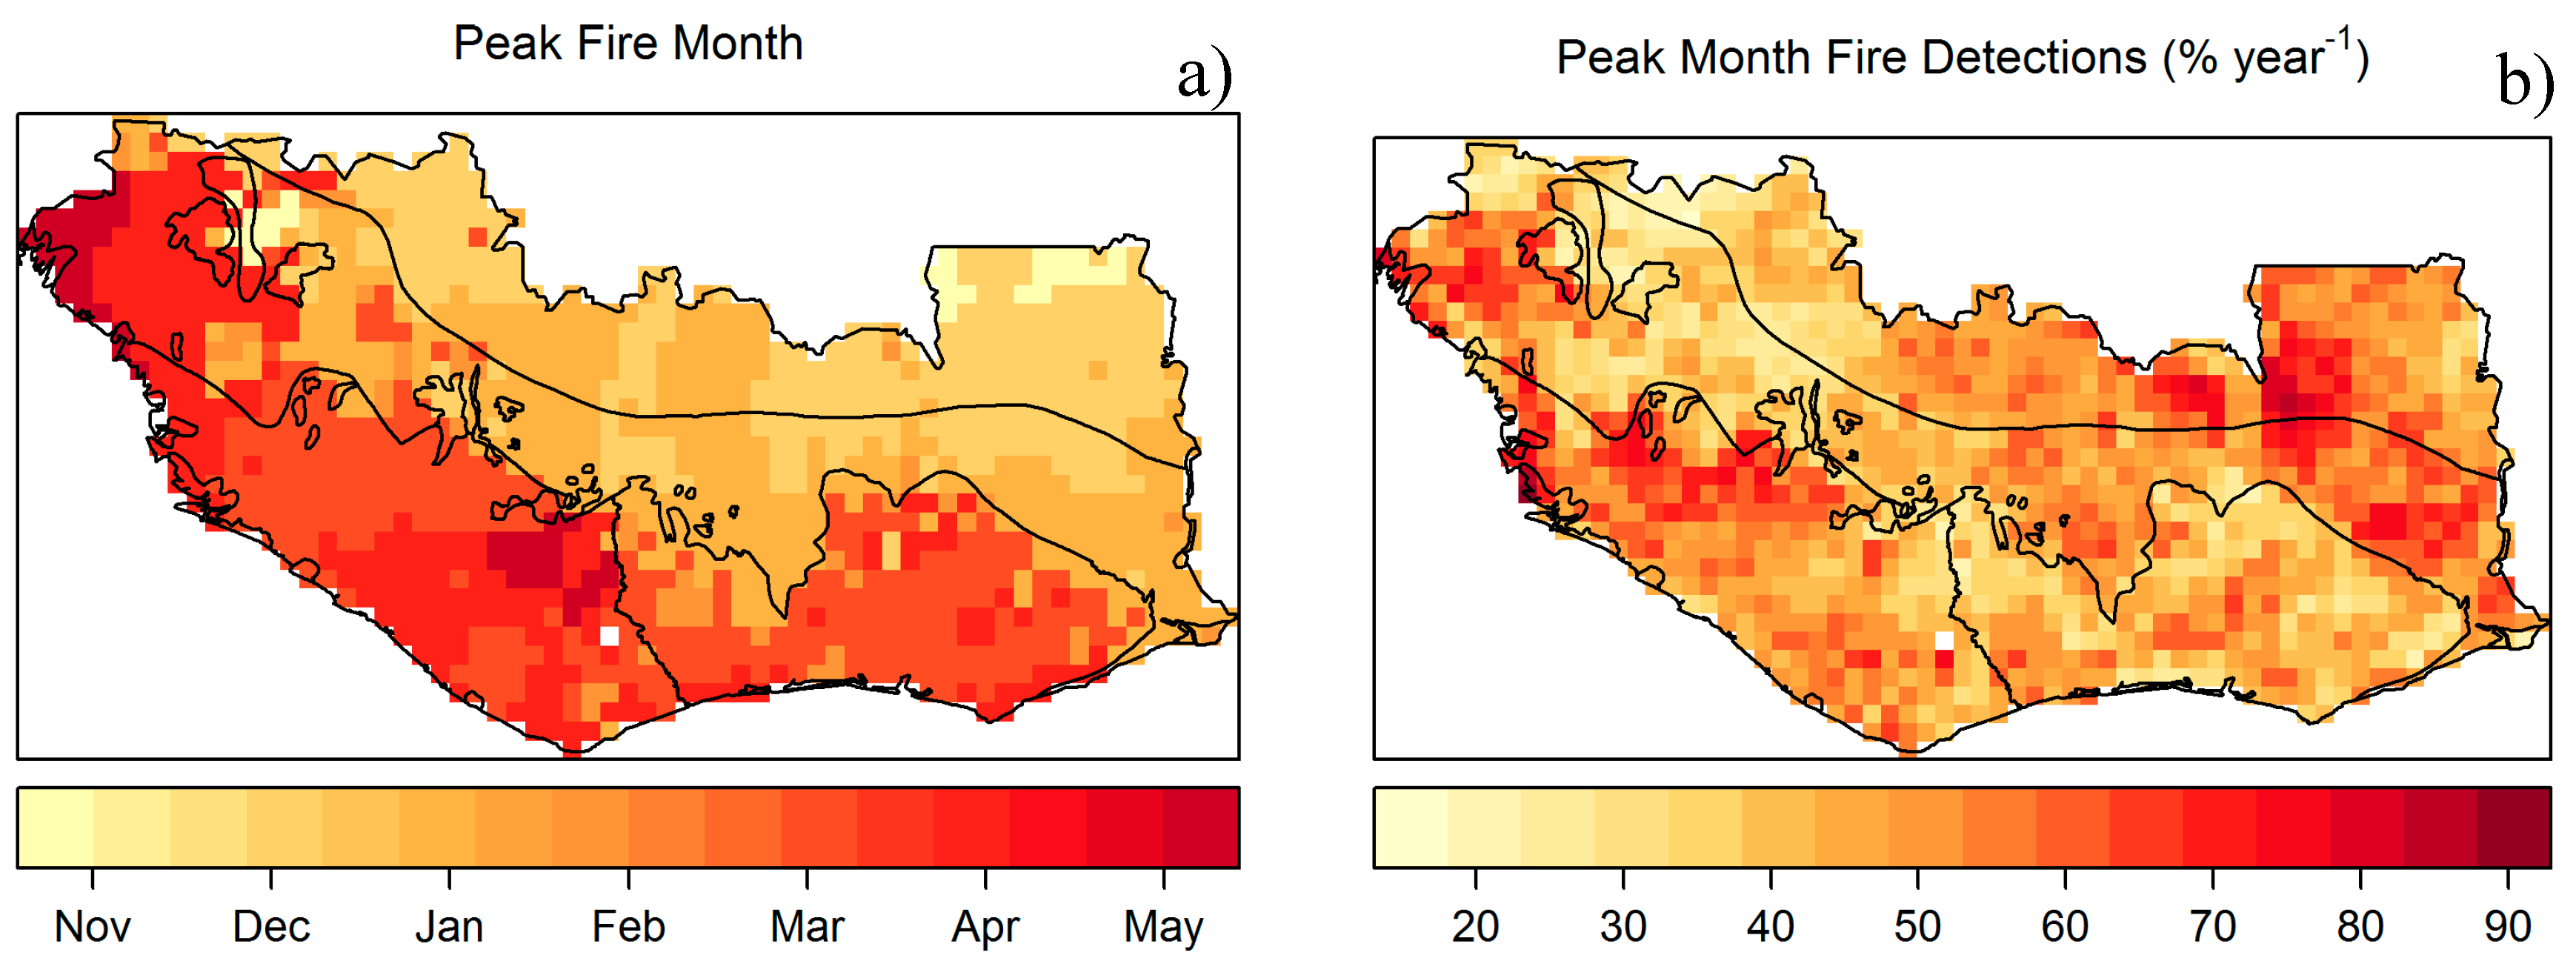
The fire season generally occurred between November and May, with variation in seasonal patterns across ecoregions (Figure 4). In the savanna ecoregions, most fires occurred between November and February, while in the forested ecoregions most fires occurred between January and May. The savanna-dominated ecoregions had earlier peak fire months, mainly December and January (Figure 5a). On the contrary, in the forested ecoregions fire activity peaked later in the fire season, mainly in March and April. The percentage of active fire detections during the peak fire month was highly spatially varied (Figure 5b).
3.2. Question 2: What Are the Overall Trends in Fire Activity and How Do They Differ Amongst the Humid Forest and the Savanna-Dominated Ecoregions?
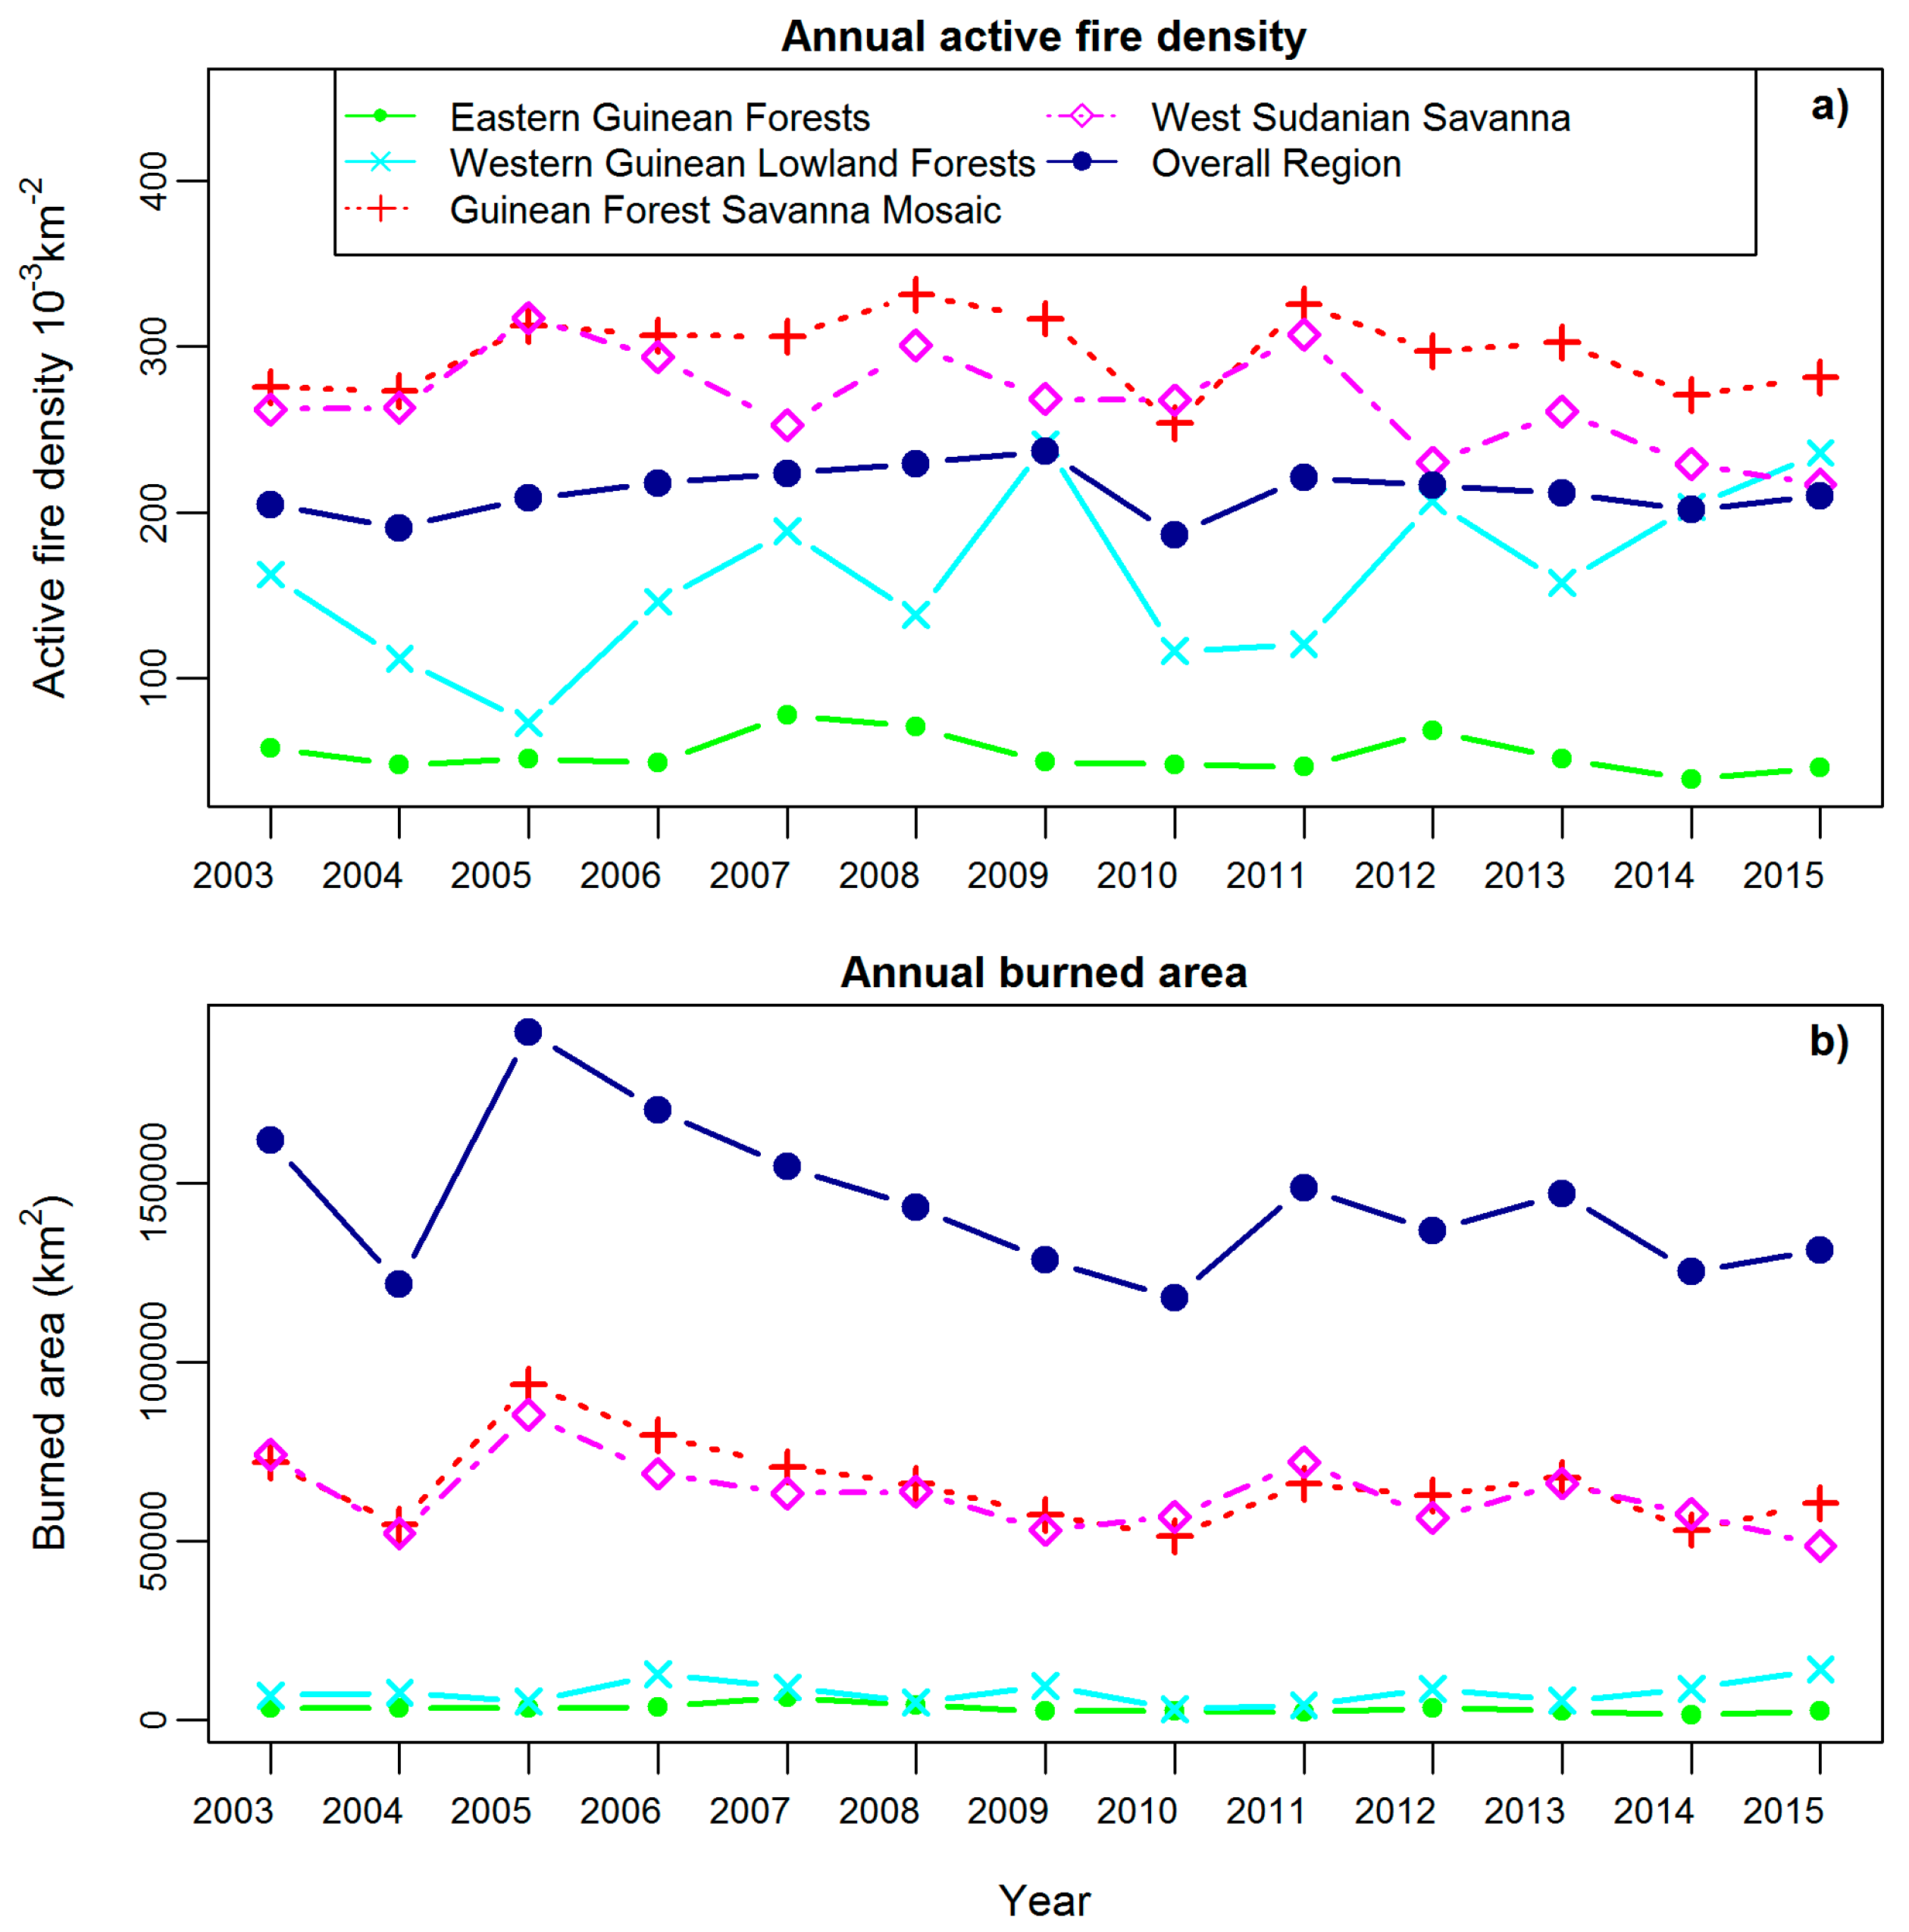
At the ecoregion level, the trend in active fire density was weakly positive in the WGLF ecoregion and weakly negative in the EGF and WSS ecoregions (Figure 6a, Table 3). There were also weak decreasing trends in burned area in the EGF, GFSM, and WSS ecoregions (Figure 6b, Table 3). However, the temporal trends in fire activity also varied geographically within ecoregions (Figure 7). We found clusters of increasing active fire detections in parts of the WGLF, particularly in Sierra Leone and western Liberia (Figure 7a). There were also clusters of decreasing active fire and burned area in the central portions of the WSS and the GFSM, particularly in Côte d’Ivoire (Figure 7).
3.3. Question 3: How Do the Relative Influences of Climate, Topography, Vegetation Type, and Human Activity Vary across Different Fire Regime Components?
Cross-validated correlations between the BRT predictions and observed values were 0.91 for active fire density, 0.88 for burned area, 0.64 for fire season length, and 0.89 for fire radiative power. The most important predictor variables identified by the BRT algorithm varied among the four fire regime components (Figure 8).
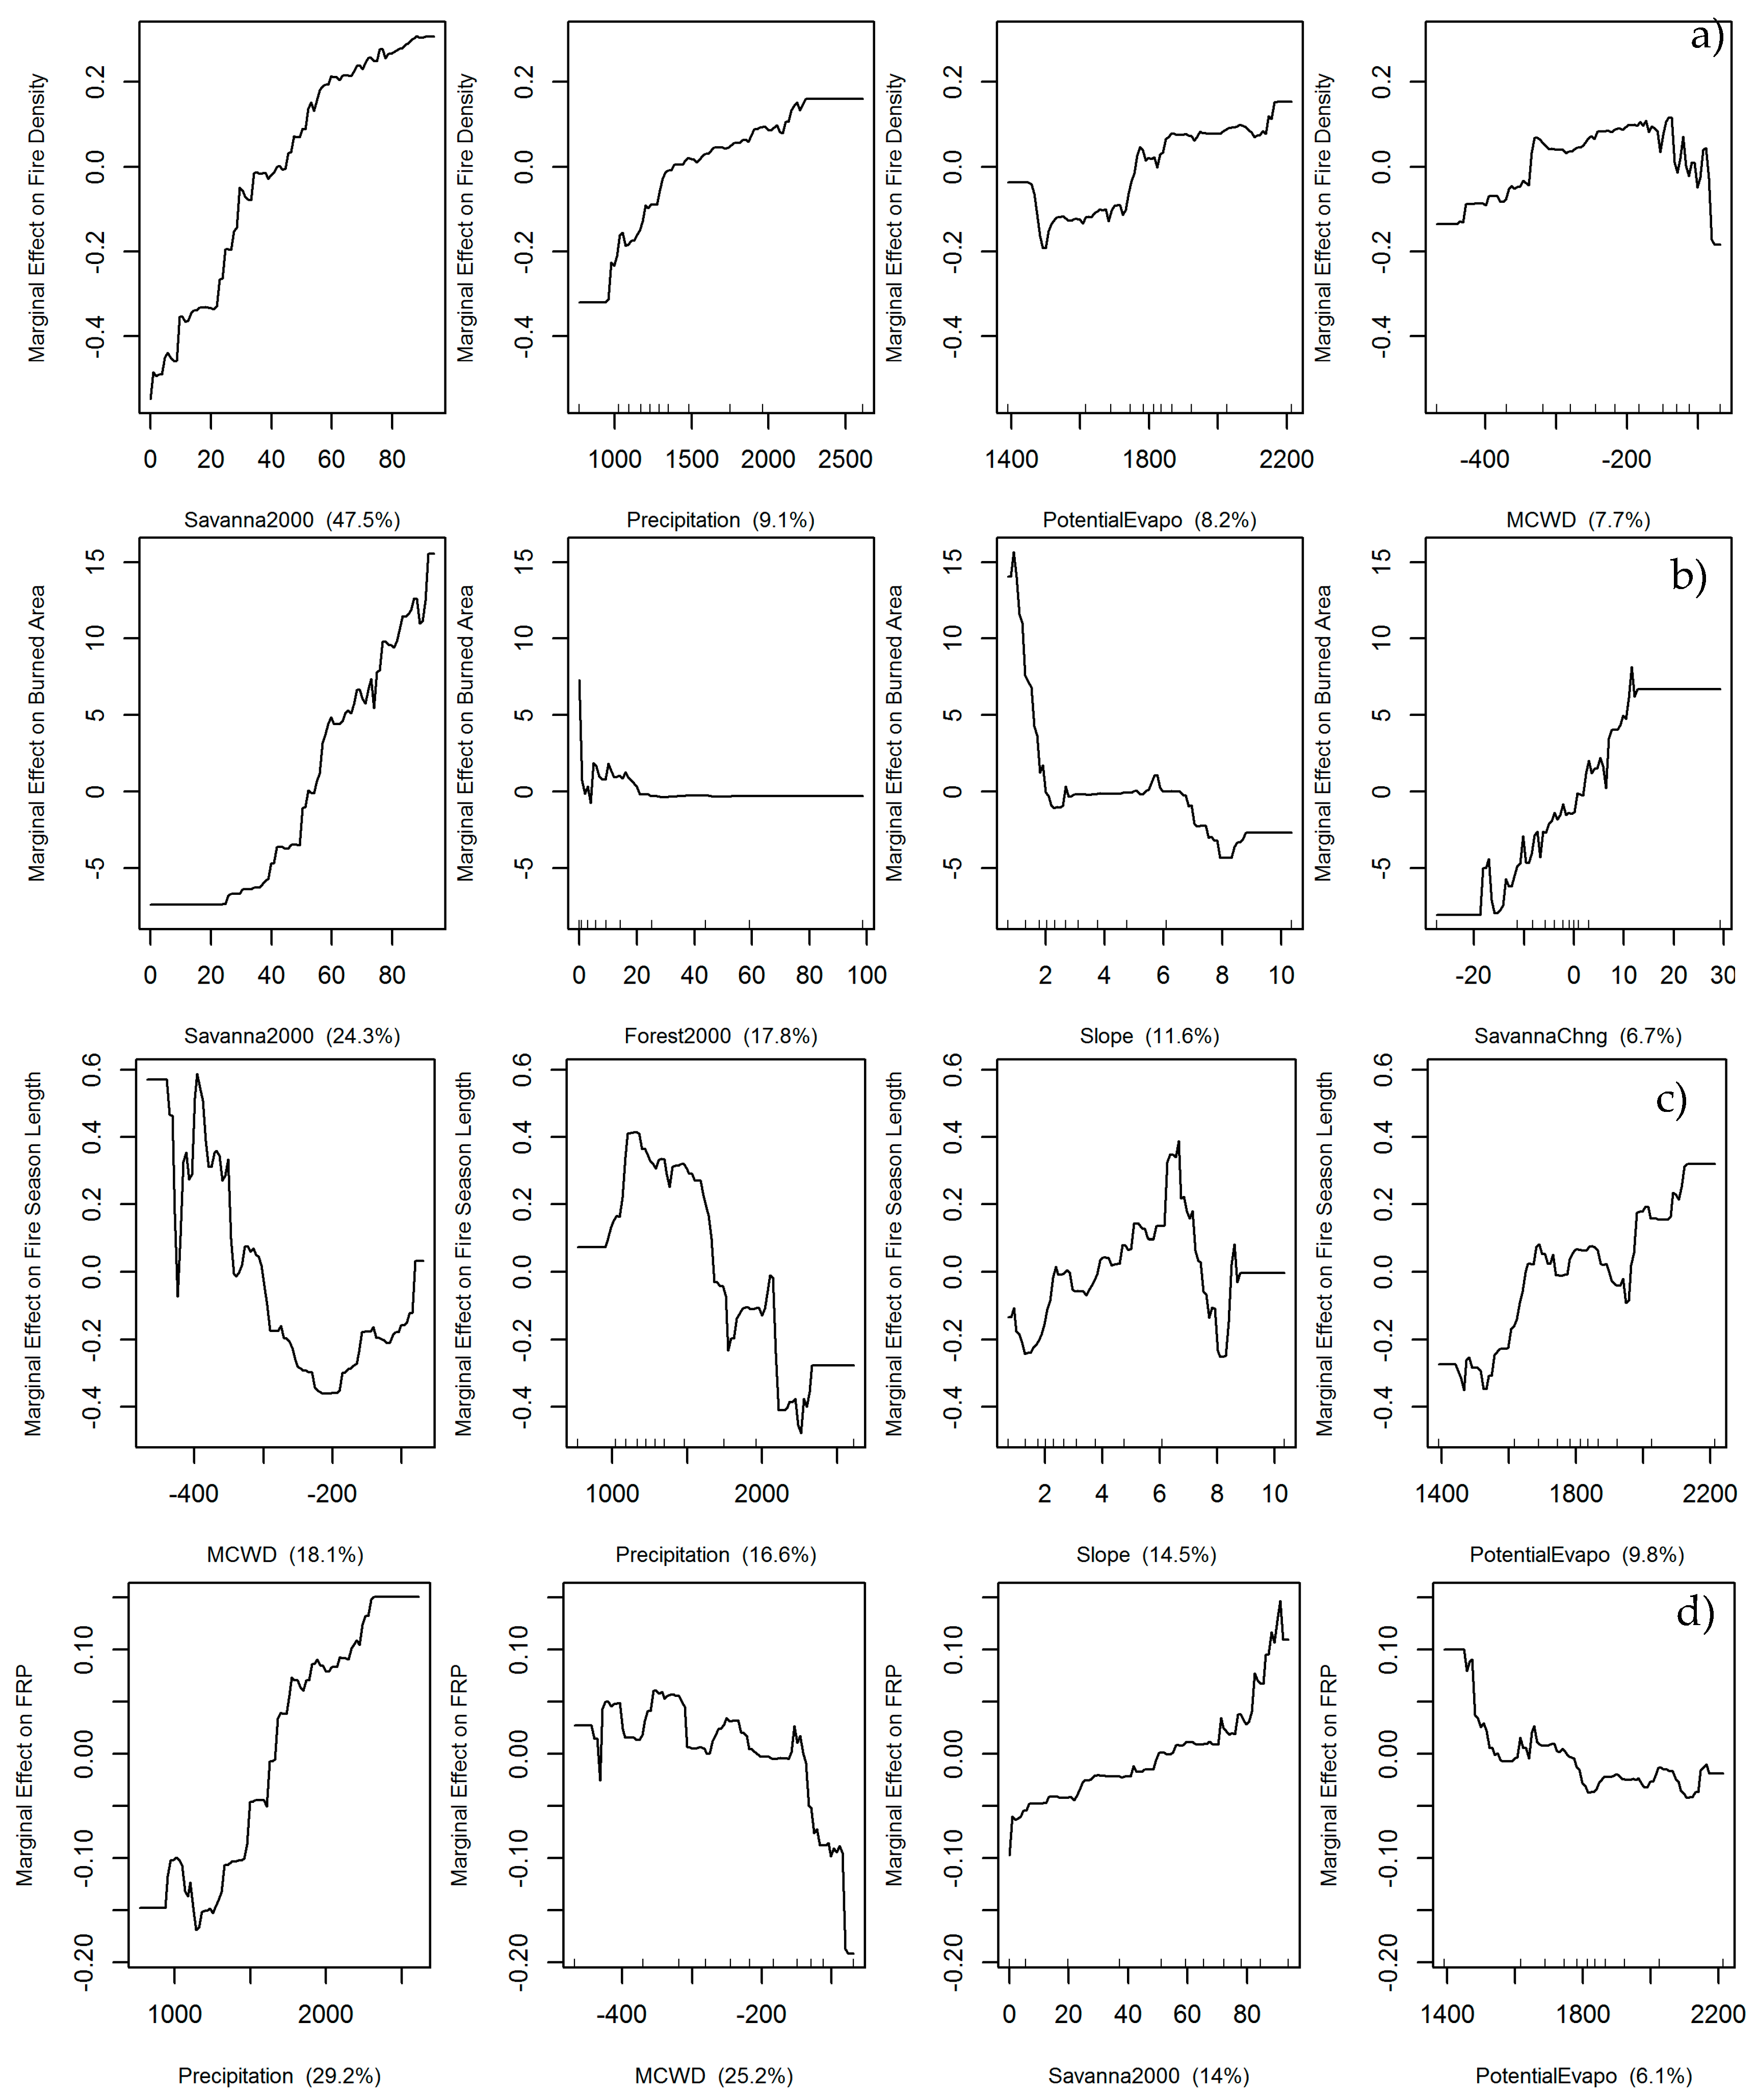
For active fire density, savanna cover was the most influential variable followed by precipitation, potential evapotranspiration, and maximum cumulative water deficit (MCWD). All these variables were positively associated with active fire density, except MCWD (Figure 9a). MCWD had a nonlinear relationship, in which active fire density was highest at intermediate water deficits (MCWD ≈ −150, Figure 9a) which may provide dry conditions favorable for fire activity. In contrast, high moisture stress (low MCWD values) may suppress fire activity due to low primary productivity and fuel availability, and low moisture stress (high MCWD values) may limit fire activity because of high fuel moisture. Forest cover and distance to roads had weaker influences on active fire density (4.8%, and 4.2% relative importance, respectively; Supplementary Materials Figure S1).
For burned area, the most important predictor variables were savanna cover, forest cover, slope, savanna cover change, MCWD, cropland change, potential evapotranspiration, precipitation, and protected area status in order of decreasing importance. Burned area was positively associated with savanna cover, but negatively associated with forest cover and slope. Loss of savanna cover during the study period was associated with lower burned area, whereas gain in savanna cover was associated with higher burned area (Figure 9b). A higher gain in cropland was generally associated with higher burned area (Supplementary Materials Figure S2). Burned area was lowest at the highest water stress (low MCWD values) and increased with decreasing water stress (increasing MCWD values).
For fire season length, the three climatic indices, slope, population density, and forest cover were the most important predictor variables (Figure 9c and Figure S3). The fire season was longest when water deficit was high (lowest MCWD values). Fire season length decreased with decreasing water stress up to an MCWD value of −200 mm/year, and then increased slightly at the lowest levels of water stress (highest MCWD values). Annual precipitation was negatively associated with fire season length except at the lowest precipitation levels (≤1200 mm/year). Potential evapotranspiration was positively associated with fire season length. Thus, for all three climatic variables, longer fire seasons were generally associated with drier conditions. Slope had a nonlinear relationship with fire season length, with a positive association at low slope values and a negative association at higher slope values. Population density was positively associated fire season length. Forest cover also had a unimodal relationship with fire season length, where the longest fire seasons were associated with 20–40% forested land cover (Supplementary Materials Figure S3).
For fire radiative power, the three climatic indices had the strongest influences followed by savanna cover and slope (Figure 9d and Supplementary Materials Figure S4). Thus, the four most influential drivers were the same for fire radiative power and active fire density, although their levels of influence varied and the relationships with MCWD and potential evapotranspiration were different. Fire radiative power was positively associated with higher annual precipitation and negatively associated with evapotranspiration, suggesting that fire intensity was highest in wetter and more productive environments. In contrast, fire radiative power was highest when water deficit was high (lowest MCWD values) and decreased with decreasing water stress (highest MCWD values), suggesting that greater moisture stress during the dry season was also associated with more intense burning (Figure 9d).
4. Discussion
4.1. Vegetation Constraints on Regional Patterns of Fire Activity
There was strong variability in the spatial and temporal patterns of fires across the Upper Guinean region. As expected, the savanna-dominated ecoregions were the epicenters of fire activity, with the highest density of active fires, burned area, and to large extent fire intensity. Savannas are fire-adapted ecosystems, with abundant fine fuels and low fuel moisture during the dry season [45,46,47]. Savanna also constitutes the most widespread vegetation type in the study area (Figure 1 and Figure S5) and thus provides the majority of fuels that support ignition and fire spread. Therefore, concentration of fire activity in the savanna and mixed forest–savanna ecoregions was not surprising. Less fire activity was observed in the humid forest ecoregions because these forests tend to offer some buffering against fire encroachment. Tropical forests are usually fire resistant because they have relatively low amounts of herbaceous fuels and relatively high fuel moisture in their shaded understories [48].
In the BRT analyses, active fires and burned area both had the strongest associations with savanna vegetation type. The geographic distribution of savanna was in turn related to the overarching regional gradients of precipitation and moisture stress, but the BRT results emphasized that vegetation, rather than climate per se, had the strongest proximal influence on fire activity. Recent vegetation change was also identified as an important driver of fire. Our finding that savanna loss was associated with lower burned area is consistent with previous studies which found reductions in burned area due to conversion of savannas to agriculture [17,18,49]. However, cropland gain during the study period was also associated with higher burned area, and this relationship may reflect the use of fire to clear forested areas for agriculture. In contrast to savanna, forest areas with lower cover were associated with more burned area. These results emphasize that whereas human disturbances through forest fragmentation and degradation tend to enhance fire activity in forested areas, such disturbances tend to diminish fire activity in savanna-dominated landscapes.
We also observed trends in fire activity that are likely associated with regional changes in land use and vegetation patterns. Increasing trends in active fire detections were identified in the Western Guinean Lowland Forest (WGLF) ecoregion. This result affirms recent findings by Ichoku et al. [5] who reported increasing active fire detections in parts of forested West Africa. Recently, Liu et al. [7] observed decreasing trends of woody vegetation in the WGLF, an indication of forest loss and degradation in that area. Thus, increasing active fire detections here may be connected with a generally decreasing tree cover and increasing amounts of herbaceous/shrub vegetation and fine fuels, as has been documented in other forested regions of West Africa [4]. Furthermore, our observation of a generally decreasing trend in fire activity in savanna-dominated ecoregions is consistent with previous studies which reported declining fire activity in African savannas [5,17,18]. Liu et al. [7] reported decreasing trends in woody cover and increasing enhanced vegetation index (EVI) across much of the woody savanna and forest–savanna mosaic ecoregions, suggesting that decreasing fire activity is indeed linked with increasing agriculture and declining tree cover in these areas.
4.2. Distinctive Fire Regimes in the Transition and Savanna Zones
Differences in multiple fire regime components between the northeastern and the northwestern parts of the study area underscored the complexity of factors controlling fire regimes. When the fire season is long with a late peak, as in the northwestern subregion, the fires that start early in the season are usually smaller in size [14] and thus have the potential to break up fuel continuity and reduce total burned area later in the season. It has been shown in a variety of ecosystems that fires reduce fuel loads and thereby inhibit spread of subsequent fires and reduce burned area [50,51]. Moreover, many parts of the northwestern landscape have rugged topography (Supplementary Materials Figure S5), which may have inhibited fire spread leading to lower area burned in the northwestern subregion. These relationships were reflected in the BRT analyses, which found that rugged landscapes with steeper slopes had generally lower burned area and longer fire seasons than landscapes with lower slopes and more gentle terrain.
In contrast, the shorter fire season and earlier peak fire month in the northeastern subregion suggest that flammable and contiguous fuels allowed large areas to burn within a shorter period. These findings are consistent with experimental results from the Kruger National Park in South Africa which found that total burned area was mainly controlled by fuel availability rather than the number of fire events [2]. The northeastern landscape was generally flat and encompassed the largest protected areas of savanna in the study area, located in central and northern Ghana and north-eastern Côte d’Ivoire (Figure 1 and Figure S5), thereby providing the most contiguous savanna cover with continuous fuel beds that are conducive to ignition and rapid fire spread. The BRT results showed that protected eco-reserves, which are mostly savannas, had more burned area than other protection categories (Supplementary Materials Figure S2), meaning that fires were more likely to burn in continuous savanna landscapes where human interference is minimal.
Notwithstanding these explanations, we acknowledge that this observed dichotomy between active fire and burned area may also reflect the geographic variability in the probability of ignitions growing into fires large enough to be detectable by the MODIS burned area algorithm. Although the current burned area product, MCD64A1, has improved detection of small burned areas [30], its performance in highly heterogeneous landscapes such as this study area has not been quantified. Thus, burned area may be underestimated in the northwestern portion of our study area if the fire regime there is comprised of many small fires. However, we believe that relative geographic differences in fire regimes that we have observed are valid: many smaller fires occurring over a longer fire season in the northwest versus fewer, larger fires burning more area over a shorter fire season in the northeast.
Archibald et al. [14] reported that small-sized and low intensity fires dominate the West African fire regime. However, we found particularly high fire intensity values in western part of the study area. This distinct pattern of fire intensity could be partly explained by the climatic conditions in the far western portion of the study area. This area is unique in that it has high annual precipitation combined with high moisture stress during the dry season as reflected in high maximum cumulative water deficits (Supplementary Materials Figure S5), as well as the latest peak fire months within the study area. The BRT results confirmed that precipitation and maximum cumulative water deficit were the two most important drivers of fire radiative power. Thus, the high fire radiative power in this region may reflect a combination of high fuel loads generated during the growing season followed by low fuel moisture during the fire season, leading to relatively high fire intensity compared to other portions of the study area with either lower fuel loads or higher fuel moisture during the fire season. Furthermore, the late peak fire month in this area likely increased the potential for high intensity fires because fuels later in the fire season are exposed to prolonged dry and warm conditions and therefore have lower fuel moisture than in the early season [52].
4.3. Climatic Influences on Fire Regime Components
Our findings that more severe moisture deficits were associated with fewer active fires and less burned area, but were also associated with longer fire season lengths and higher fire radiative power (FRP), emphasize the heterogeneous impacts of moisture stress on the fire regime. The general association between drier conditions and lower fire activity indicates that after accounting for differences between major vegetation types, fuel loads rather than fuel moisture are the primary factor limiting fire initiation and spread. High levels of moisture stress lead to reduced primary productivity and consequently result in reduced fuel loads that limit fire activity, whereas more rainfall and lower moisture stress lead to increased fuel loads and fuel continuity.
The overriding influence of the three moisture variables on FRP (Figure 9d and Figure S4) emphasize that climatic variables, rather than vegetation type, were the main determinants of fire intensity [2,52]. As discussed in the previous section, the BRT results indicate that FRP is constrained by a combination of productivity and fuel moisture effects. The highest FRP levels occurred where annual precipitation was high and evapotranspiration was low, indicating the potential for high productivity throughout the growing season, but cumulative moisture stress was high, indicating severe moisture stress and low fuel moisture during the dry season.
Fire season length was most strongly influenced by climate, topography, and population density. Although vegetation types and their associated fuels primarily control the spatial variability in ignition and fire spread, they have less influence on the timing of fire activity during the year. The association of longer fire season length with higher cumulative moisture deficit supports earlier observation by Giglio et al. [33] that fire season length in the tropics is largely controlled by duration of the dry season. This relationship was further supported by the positive associations of fire season length with potential evapotranspiration and negative association with precipitation. Nonetheless, our analyses also showed that human population density was an important modifier of fire season length but not active fire density nor burned area. The association of population density with longer fire seasons suggests that anthropogenic activities have more control on the timing of fires than the amount of fire events in these highly-human modified landscapes. Thus, the longer fire seasons in the Eastern Guinean Forest ecoregion may reflect the constraints of climate as well as land use practices, which tend to make fires more persistent even though they are less widespread [31].
5. Conclusions
In the Upper Guinean Region of West Africa, different components of the fire regime were influenced by different environmental drivers. As a result, the various combinations of these environmental factors create distinctive fire regimes throughout the region. The strong gradient of increasing fire activity from the wetter coastal regions to the drier regions in the north was related primarily to the shift from forest to savanna vegetation types rather than direct climatic effects. Within the savanna zone, there was a distinction between fire regimes with high active fire density, low burned area, long fire seasons, and late peak fire months compared to fire regimes with fewer active fires, higher burned area, shorter fire seasons, and earlier peak fire months. There was also an area of particularly high fire intensity located in the westernmost coastal regions of the study area. These differences were attributable to the combined effects of vegetation cover, recent land use changes, topography, and climate. Increasing trends in active fire detections in parts of the forested zone and decreasing trends in both active fire detections and burned area in the savanna zone were likely associated with differential impacts of land use change in these distinctive ecoregions. We conclude that while ongoing climate change will continue to influence fire regimes throughout the region, land use change and the resulting feedbacks between fire and vegetation will have a major impact as well. Efforts to project future fire regimes and develop regional strategies for adaptation will therefore need to encompass multiple components of the fire regime and consider multiple drivers, including land use as well as climate. It will also be essential to develop a stronger understanding of how these drivers affect the timing and spatial pattern of ignitions, the abundance and spatial connectivity of available fuels, and the amount of biomass consumed by fire.
Supplementary Materials
The following are available online at www.mdpi.com/2072-4292/9/11/1117/s1: Figure S1: Partial dependence plots of the nine most important variables influencing the spatial pattern of active fire density. Figure S2: Partial dependence plots of the nine most important variables influencing the spatial pattern of burned area. Figure S3: Partial dependence plots of the nine most important variables influencing the spatial pattern of fire season length. Figure S4: Partial dependence plots of the nine most important variables influencing the spatial pattern of fire radiative power. Figure S5: Maps of the 10 most important independent variables in the BRT models.
Acknowledgments
This work was supported by a NASA Earth and Space Science (NESSF) Fellowship awarded to Francis Dwomoh. We also acknowledge support from the USDA Forest Service, Southern Research Station through cooperative agreements 11-CA-11330136-098 and 14-CA-11330136-015, and from the NASA SERVIR program through grant NNX16AN22G. We thank Gray Tappan, USGS Earth Resources Observation and Science (EROS) Center, for providing the land use/cover data and assisting in its interpretation. Many thanks to Zhihua Liu for his technical assistance.
Author Contributions
Francis Dwomoh and Michael Wimberly conceived of and designed the experiments. Francis Dwomoh processed and analyzed the data. Francis Dwomoh and Michael Wimberly wrote the paper.
Conflicts of Interest
The authors declare no conflict of interest.
References
- Whitman, E.; Batllori, E.; Parisien, M.-A.; Miller, C.; Coop, J.D.; Krawchuk, M.A.; Chong, G.W.; Haire, S.L. The climate space of fire regimes in north-western North America. J. Biogeogr. 2015, 42, 1736–1749. [Google Scholar] [CrossRef]
- Archibald, S. Managing the human component of fire regimes: lessons from Africa. Philos. Trans. R. Soc. B 2016, 371, 1–11. [Google Scholar] [CrossRef] [PubMed]
- Liu, Z.; Wimberly, M.C. Climatic and Landscape Influences on Fire Regimes from 1984 to 2010 in the Western United States. PLoS ONE 2015, 10, e0140839. [Google Scholar] [CrossRef] [PubMed]
- Dwomoh, F.K.; Wimberly, M.C. Fire regimes and forest resilience: Alternative vegetation states in the West African tropics. Landsc. Ecol. 2017, 32, 1849–1865. [Google Scholar] [CrossRef]
- Ichoku, C.; Ellison, L.T.; Willmot, K.E.; Matsui, T.; Amin, K.D.; Charles, K.G.; Jun, W.; Eric, M.W.; Jejung, L.; Jimmy, A.; et al. Biomass burning, land-cover change, and the hydrological cycle in Northern sub-Saharan Africa. Environ. Res. Lett. 2016, 11, 095005. [Google Scholar] [CrossRef]
- CILSS. Landscapes of West Africa—A Window on a Changing World; U.S. Geological Survey EROS: Garretson, SD, USA, 2016.
- Liu, Z.; Wimberly, M.; Dwomoh, F. Vegetation Dynamics in the Upper Guinean Forest Region of West Africa from 2001 to 2015. Remote Sens. 2017, 9, 5. [Google Scholar] [CrossRef]
- Myers, N.; Mittermeier, R.A.; Mittermeier, C.G.; da Fonseca, G.A.B.; Kent, J. Biodiversity hotspots for conservation priorities. Nature 2000, 403, 853–858. [Google Scholar] [CrossRef] [PubMed]
- Norris, K.; Asase, A.; Collen, B.; Gockowksi, J.; Mason, J.; Phalan, B.; Wade, A. Biodiversity in a forest-agriculture mosaic—The changing face of West African rainforests. Biol. Conserv. 2010, 143, 2341–2350. [Google Scholar] [CrossRef]
- Poorter, L.; Bongers, F.; Kouamé, F.N.; Hawthorne, W.D. Biodiversity of West African Forests: An Ecological Atlas of Woody Plant Species; CABI Publishing: Oxford, UK, 2004; p. 528. [Google Scholar]
- DeSA, U.N. World Population Prospects: The 2015 Revision, Volume II: Demographic Profiles (ST/ESA/SER.A/380); Population Division of the Department of Economic and Social Affairs of the United Nations Secretariat: New York, NY, USA, 2015. [Google Scholar]
- Sylla, M.B.; Nikiema, P.M.; Gibba, P.; Kebe, I.; Klutse, N.A.B. Climate Change over West Africa: Recent Trends and Future Projections. In Adaptation to Climate Change and Variability in Rural West Africa; Yaro, A.J., Hesselberg, J., Eds.; Springer International Publishing: Cham, Switzerland, 2016; pp. 25–40. [Google Scholar]
- Prichard, S.J.; Stevens-Rumann, C.S.; Hessburg, P.F. Tamm Review: Shifting global fire regimes: Lessons from reburns and research needs. For. Ecol. Manag. 2017, 396, 217–233. [Google Scholar] [CrossRef]
- Archibald, S.; Lehmann, C.E.R.; Gómez-Dans, J.L.; Bradstock, R.A. Defining pyromes and global syndromes of fire regimes. Proc. Natl. Acad. Sci. USA 2013, 110, 6442–6447. [Google Scholar] [CrossRef] [PubMed]
- Hantson, S.; Lasslop, G.; Kloster, S.; Chuvieco, E. Anthropogenic effects on global mean fire size. Int. J. Wildland Fire 2015, 24, 589–596. [Google Scholar] [CrossRef]
- Hantson, S.; Pueyo, S.; Chuvieco, E. Global fire size distribution is driven by human impact and climate. Glob. Ecol. Biogeogr. 2015, 24, 77–86. [Google Scholar] [CrossRef]
- Andela, N.; van der Werf, G.R. Recent trends in African fires driven by cropland expansion and El Nino to La Nina transition. Nat. Clim. Chang. 2014, 4, 791–795. [Google Scholar] [CrossRef]
- Grégoire, J.-M.; Eva, H.D.; Belward, A.S.; Palumbo, I.; Simonetti, D.; Brink, A. Effect of land-cover change on Africa’s burnt area. Int. J. Wildland Fire 2013, 22, 107–120. [Google Scholar] [CrossRef]
- Grégoire, J.-M.; Simonetti, D. Interannual changes of fire activity in the protected areas of the SUN network and other parks and reserves of the West and Central Africa Region Derived from MODIS Observations. Remote Sens. 2010, 2, 446–463. [Google Scholar] [CrossRef]
- Malhi, Y.; Adu-Bredu, S.; Asare, R.A.; Lewis, S.L.; Mayaux, P. African rainforests: Past, present and future. Philos. Trans. R. Soc. B 2013, 368, 1–10. [Google Scholar] [CrossRef] [PubMed] [Green Version]
- Barbé, L.L.; Lebel, T.; Tapsoba, D. Rainfall Variability in West Africa during the Years 1950–90. J. Clim. 2002, 15, 187–202. [Google Scholar] [CrossRef]
- Liebmann, B.; Bladé, I.; Kiladis, G.N.; Carvalho, L.M.V.; Senay, G.B.; Allured, D.; Leroux, S.; Funk, C. Seasonality of African Precipitation from 1996 to 2009. J. Clim. 2012, 25, 4304–4322. [Google Scholar] [CrossRef]
- Olson, D.M.; Dinerstein, E.; Wikramanayake, E.D.; Burgess, N.D.; Powell, G.V.N.; Underwood, E.C.; D'amico, J.A.; Itoua, I.; Strand, H.E.; Morrison, J.C.; et al. Terrestrial Ecoregions of the World: A New Map of Life on Earth. BioScience 2001, 51, 933–938. [Google Scholar] [CrossRef]
- Giglio, L.; Schroeder, W.; Justice, C.O. The collection 6 MODIS active fire detection algorithm and fire products. Remote Sens. Environ. 2016, 178, 31–41. [Google Scholar] [CrossRef]
- Giglio, L. MODIS Collection 5 Active Fire Product User’s Guide Version 2.5. 2013. Available online: http://modis-fire.umd.edu/pages/manuals.php (accessed on 25 July 2015).
- Wooster, M.J.; Zhukov, B.; Oertel, D. Fire radiative energy for quantitative study of biomass burning: derivation from the BIRD experimental satellite and comparison to MODIS fire products. Remote Sens. Environ. 2003, 86, 83–107. [Google Scholar] [CrossRef]
- Freeborn, P.H.; Wooster, M.J.; Hao, W.M.; Ryan, C.A.; Nordgren, B.L.; Baker, S.P.; Ichoku, C. Relationships between energy release, fuel mass loss, and trace gas and aerosol emissions during laboratory biomass fires. J. Geophys. Res. 2008, 113, D01301. [Google Scholar] [CrossRef]
- Tang, W.; Arellano, A.F. Investigating dominant characteristics of fires across the Amazon during 2005–2014 through satellite data synthesis of combustion signatures. J. Geophys. Res. 2017, 122, 1224–1245. [Google Scholar] [CrossRef]
- Giglio, L.; Loboda, T.; Roy, D.P.; Quayle, B.; Justice, C.O. An active-fire based burned area mapping algorithm for the MODIS sensor. Remote Sens. Environ. 2009, 113, 408–420. [Google Scholar] [CrossRef]
- Giglio, L.; Boschetti, L.; Roy, D.; Hoffman, A.A.; Humber, M. Collection 6 MODIS Burned Area Product User’s Guide Version 1.0. 2016. Available online: http://modis-fire.umd.edu/pages/manuals.php (accessed on 12 May 2017).
- Chuvieco, E.; Giglio, L.; Justice, C. Global characterization of fire activity: Toward defining fire regimes from Earth observation data. Glob. Change Biol. 2008, 14, 1488–1502. [Google Scholar] [CrossRef]
- Moreno, M.V.; Chuvieco, E. Characterising fire regimes in Spain from fire statistics. Int. J. Wildland Fire 2013, 22, 296–305. [Google Scholar] [CrossRef]
- Giglio, L.; Csiszar, I.; Justice, C.O. Global distribution and seasonality of active fires as observed with the Terra and Aqua Moderate Resolution Imaging Spectroradiometer (MODIS) sensors. J. Geophys. Res. 2006, 111, G02016. [Google Scholar] [CrossRef]
- Argañaraz, J.P.; Gavier Pizarro, G.; Zak, M.; Landi, M.A.; Bellis, L.M. Human and biophysical drivers of fires in semiarid Chaco mountains of Central Argentina. Sci. Total Environ. 2015, 520, 1–12. [Google Scholar] [CrossRef] [PubMed]
- Hawbaker, T.J.; Radeloff, V.C.; Stewart, S.I.; Hammer, R.B.; Keuler, N.S.; Clayton, M.K. Human and biophysical influences on fire occurrence in the United States. Ecol. Appl. 2013, 23, 565–582. [Google Scholar] [CrossRef] [PubMed]
- Aragão, L.E.O.C.; Malhi, Y.; Roman-Cuesta, R.M.; Saatchi, S.; Anderson, L.O.; Shimabukuro, Y.E. Spatial patterns and fire response of recent Amazonian droughts. Geophys. Res. Lett. 2007, 34, L07701. [Google Scholar] [CrossRef]
- Trabucco, A.; Zomer, R.J. Global Aridity Index (Global-Aridity) and Global Potential Evapo-Transpiration (Global-PET) Geospatial Database. CGIAR Consortium for Spatial Information. 2009. Available online: http://www.csi.cgiar.org (accessed on 3 November 2016).
- Center for International Earth Science Information Network—CIESIN—Columbia University; Information Technology Outreach Services—ITOS—University of Georgia. Global Roads Open Access Data Set, Version 1 (gROADSv1); NASA Socioeconomic Data and Applications Center (SEDAC): Palisades, NY, USA, 2013. [Google Scholar]
- IUCN; UNEP-WCMC. The World Database on Protected Areas (WDPA); UNEP-WCMC: Cambridge, UK, 2016. [Google Scholar]
- Huffman, G.J.; Bolvin, D.T.; Nelkin, E.J.; Wolff, D.B.; Adler, R.F.; Gu, G.; Hong, Y.; Bowman, K.P.; Stocker, E.F. The TRMM Multisatellite Precipitation Analysis (TMPA): Quasi-Global, Multiyear, Combined-Sensor Precipitation Estimates at Fine Scales. J. Hydrometeorol. 2007, 8, 38–55. [Google Scholar] [CrossRef]
- Jarvis, A.; Reuter, H.I.; Nelson, A.; Guevara, E. Hole-Filled Seamless SRTM Data V4, International Centre for Tropical Agriculture (CIAT). 2008. Available online: http://srtm.csi.cgiar.org (accessed on 2 November 2016).
- Rodrigues, M.; San Miguel, J.; Oliveira, S.; Moreira, F.; Camia, A. An Insight into Spatial-Temporal Trends of Fire Ignitions and Burned Areas in the European Mediterranean Countries. J. Earth Sci. Eng. 2013, 3, 497–505. [Google Scholar]
- Elith, J.; Leathwick, J.R.; Hastie, T. A working guide to boosted regression trees. J. Anim. Ecol. 2008, 77, 802–813. [Google Scholar] [CrossRef] [PubMed]
- Elith, J.; Leathwick, J.R. Boosted Regression Trees for Ecological Modeling. 2016. Available online: https://cran.r-project.org/web/packages/dismo/vignettes/brt.pdf (accessed on 24 October 2016).
- Murphy, B.P.; Bowman, D.M.J.S. What controls the distribution of tropical forest and savanna? Ecol. Lett. 2012, 15, 748–758. [Google Scholar] [CrossRef] [PubMed]
- Pausas, J.G. Alternative fire-driven vegetation states. J. Veg. Sci. 2015, 26, 4–6. [Google Scholar] [CrossRef]
- Ratnam, J.; Bond, W.J.; Fensham, R.J.; Hoffmann, W.A.; Archibald, S.; Lehmann, C.E.R.; Anderson, M.T.; Higgins, S.I.; Sankaran, M. When is a ‘forest’ a savanna, and why does it matter? Glob. Ecol. Biogeogr. 2011, 20, 653–660. [Google Scholar] [CrossRef]
- Cochrane, M.A. Fire science for rainforests. Nature 2003, 421, 913–919. [Google Scholar] [CrossRef] [PubMed]
- Andela, N.; Morton, D.C.; Giglio, L.; Chen, Y.; van der Werf, G.R.; Kasibhatla, P.S.; DeFries, R.S.; Collatz, G.J.; Hantson, S.; Kloster, S.; et al. A human-driven decline in global burned area. Science 2017, 356, 1356–1362. [Google Scholar] [CrossRef] [PubMed]
- Parks, S.A.; Miller, C.; Holsinger, L.M.; Baggett, L.S.; Bird, B.J. Wildland fire limits subsequent fire occurrence. Int. J. Wildland Fire 2016, 25, 182–190. [Google Scholar] [CrossRef]
- Price, O.F.; Pausas, J.G.; Govender, N.; Flannigan, M.; Fernandes, P.M.; Brooks, M.L.; Bird, R.B. Global patterns in fire leverage: The response of annual area burnt to previous fire. Int. J. Wildland Fire 2015, 24, 297–306. [Google Scholar] [CrossRef]
- Barrett, K.; Kasischke, E.S. Controls on variations in MODIS fire radiative power in Alaskan boreal forests: Implications for fire severity conditions. Remote Sens. Environ. 2013, 130, 171–181. [Google Scholar] [CrossRef]
Figure 1.
Map of study the area overlaid with: (a) terrestrial ecoregions of the world [23]; and (b) a 2 km spatial resolution West African land cover/land use map for 2013 developed by the USGS. We aggregated the original cover types into eight general classes.
Figure 1.
Map of study the area overlaid with: (a) terrestrial ecoregions of the world [23]; and (b) a 2 km spatial resolution West African land cover/land use map for 2013 developed by the USGS. We aggregated the original cover types into eight general classes.
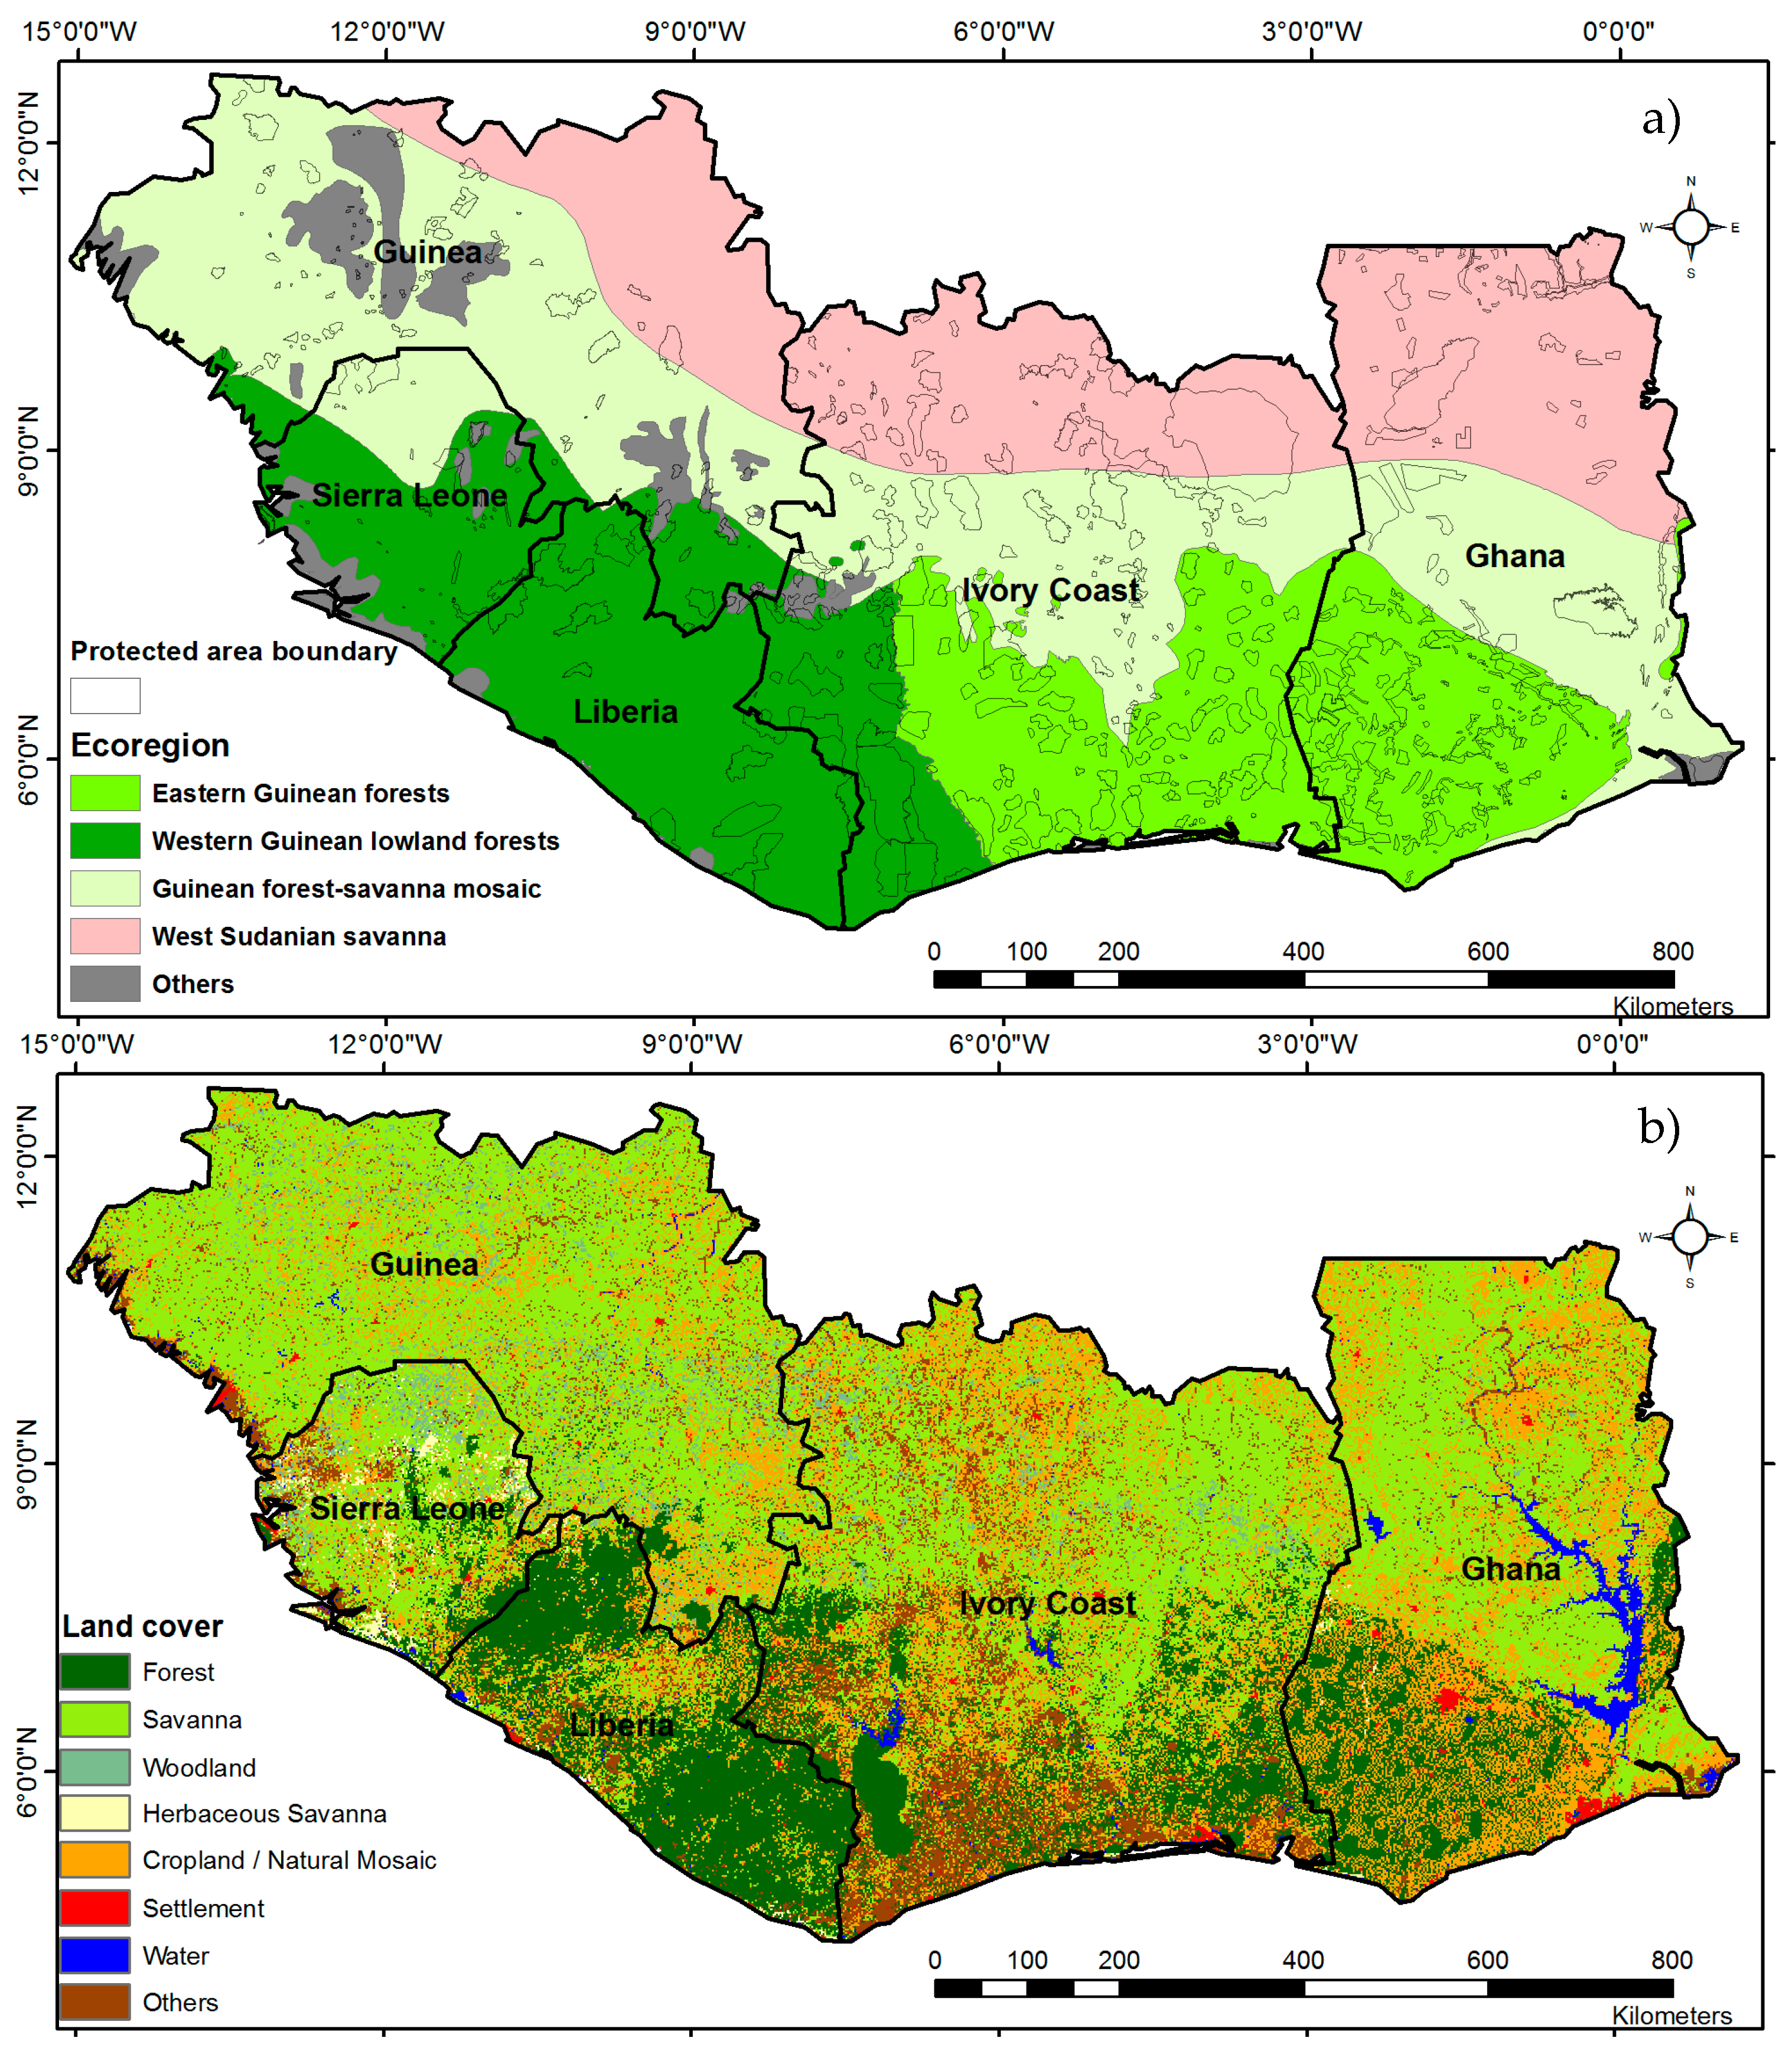
Figure 2.
Maps of four major fire regime components, which were the response variables in the BRT models: (a) active fire density; (b) percent burned area; (c) fire season length; (d) fire radiative power.
Figure 2.
Maps of four major fire regime components, which were the response variables in the BRT models: (a) active fire density; (b) percent burned area; (c) fire season length; (d) fire radiative power.

Figure 3.
Bivariate relationships amongst the four fire-regime components, with Kendall non-parametric rank correlation coefficients indicating the direction and strength of correlations among each component pairs. Each variable’s name (Table 1) is shown on the diagonal. The lower triangle shows the bivariate scatter plots with a fitted smoothed line. The upper triangle shows the correlations and associated p-values: *** p <0.001, ** p < 0.05, ▪ p ≥ 0.05. Larger font sizes indicate stronger correlations.
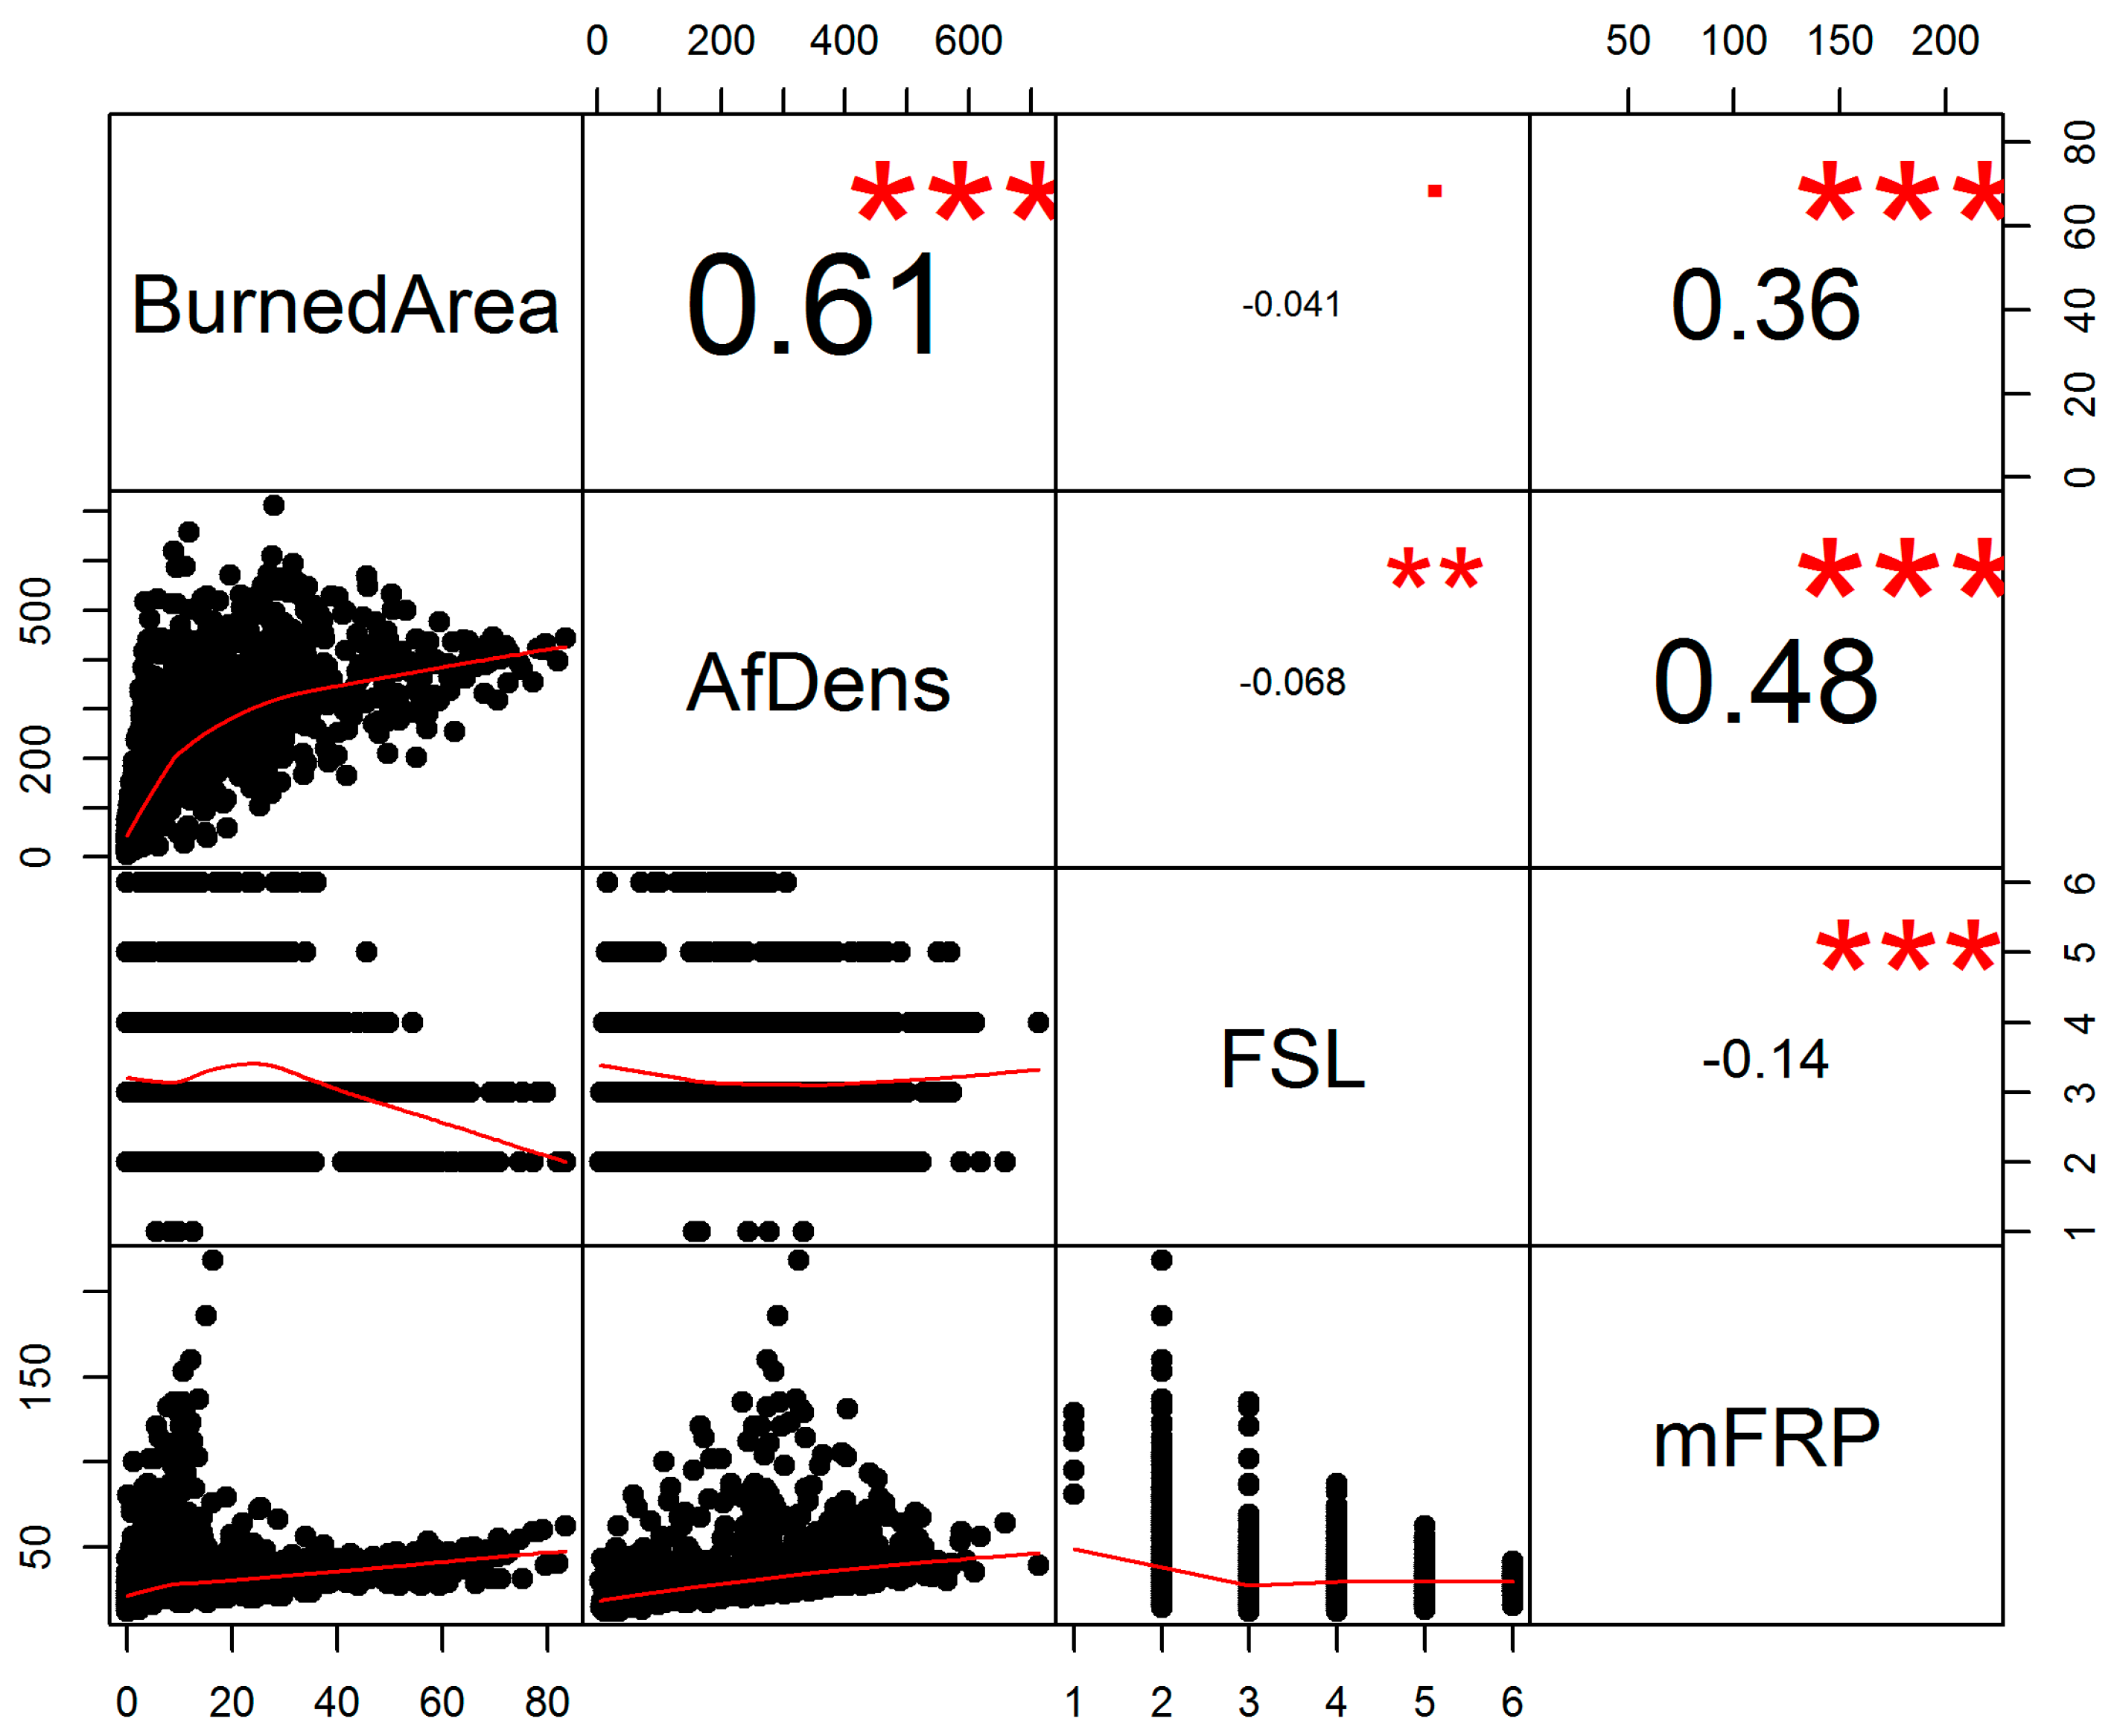
Figure 4.
Seasonal cycle of fire activity represented by the monthly percent distribution of: (a) MODIS active fire detections; (b) burned area, across ecoregions and the entire study area.
Figure 4.
Seasonal cycle of fire activity represented by the monthly percent distribution of: (a) MODIS active fire detections; (b) burned area, across ecoregions and the entire study area.

Figure 5.
Maps indicating: (a) calendar month with the maximum active fire detections; (b) the percentage of the total annual active fire detections recorded in the peak fire month.
Figure 5.
Maps indicating: (a) calendar month with the maximum active fire detections; (b) the percentage of the total annual active fire detections recorded in the peak fire month.

Figure 6.
Time series of: (a) annual MODIS active fire density; (b) total burned area across ecoregions and the entire study area for the period 2003–2015.
Figure 6.
Time series of: (a) annual MODIS active fire density; (b) total burned area across ecoregions and the entire study area for the period 2003–2015.

Figure 7.
Results of Mann–Kendall trend test of annual: (a) MODIS active fire density; (b) percent burned area for each grid cell for the period 2003–2015. Cells with p-values less than or equal to 0.1 are highlighted in the maps. Grid cells without enough data points to calculate trend are shown in white.
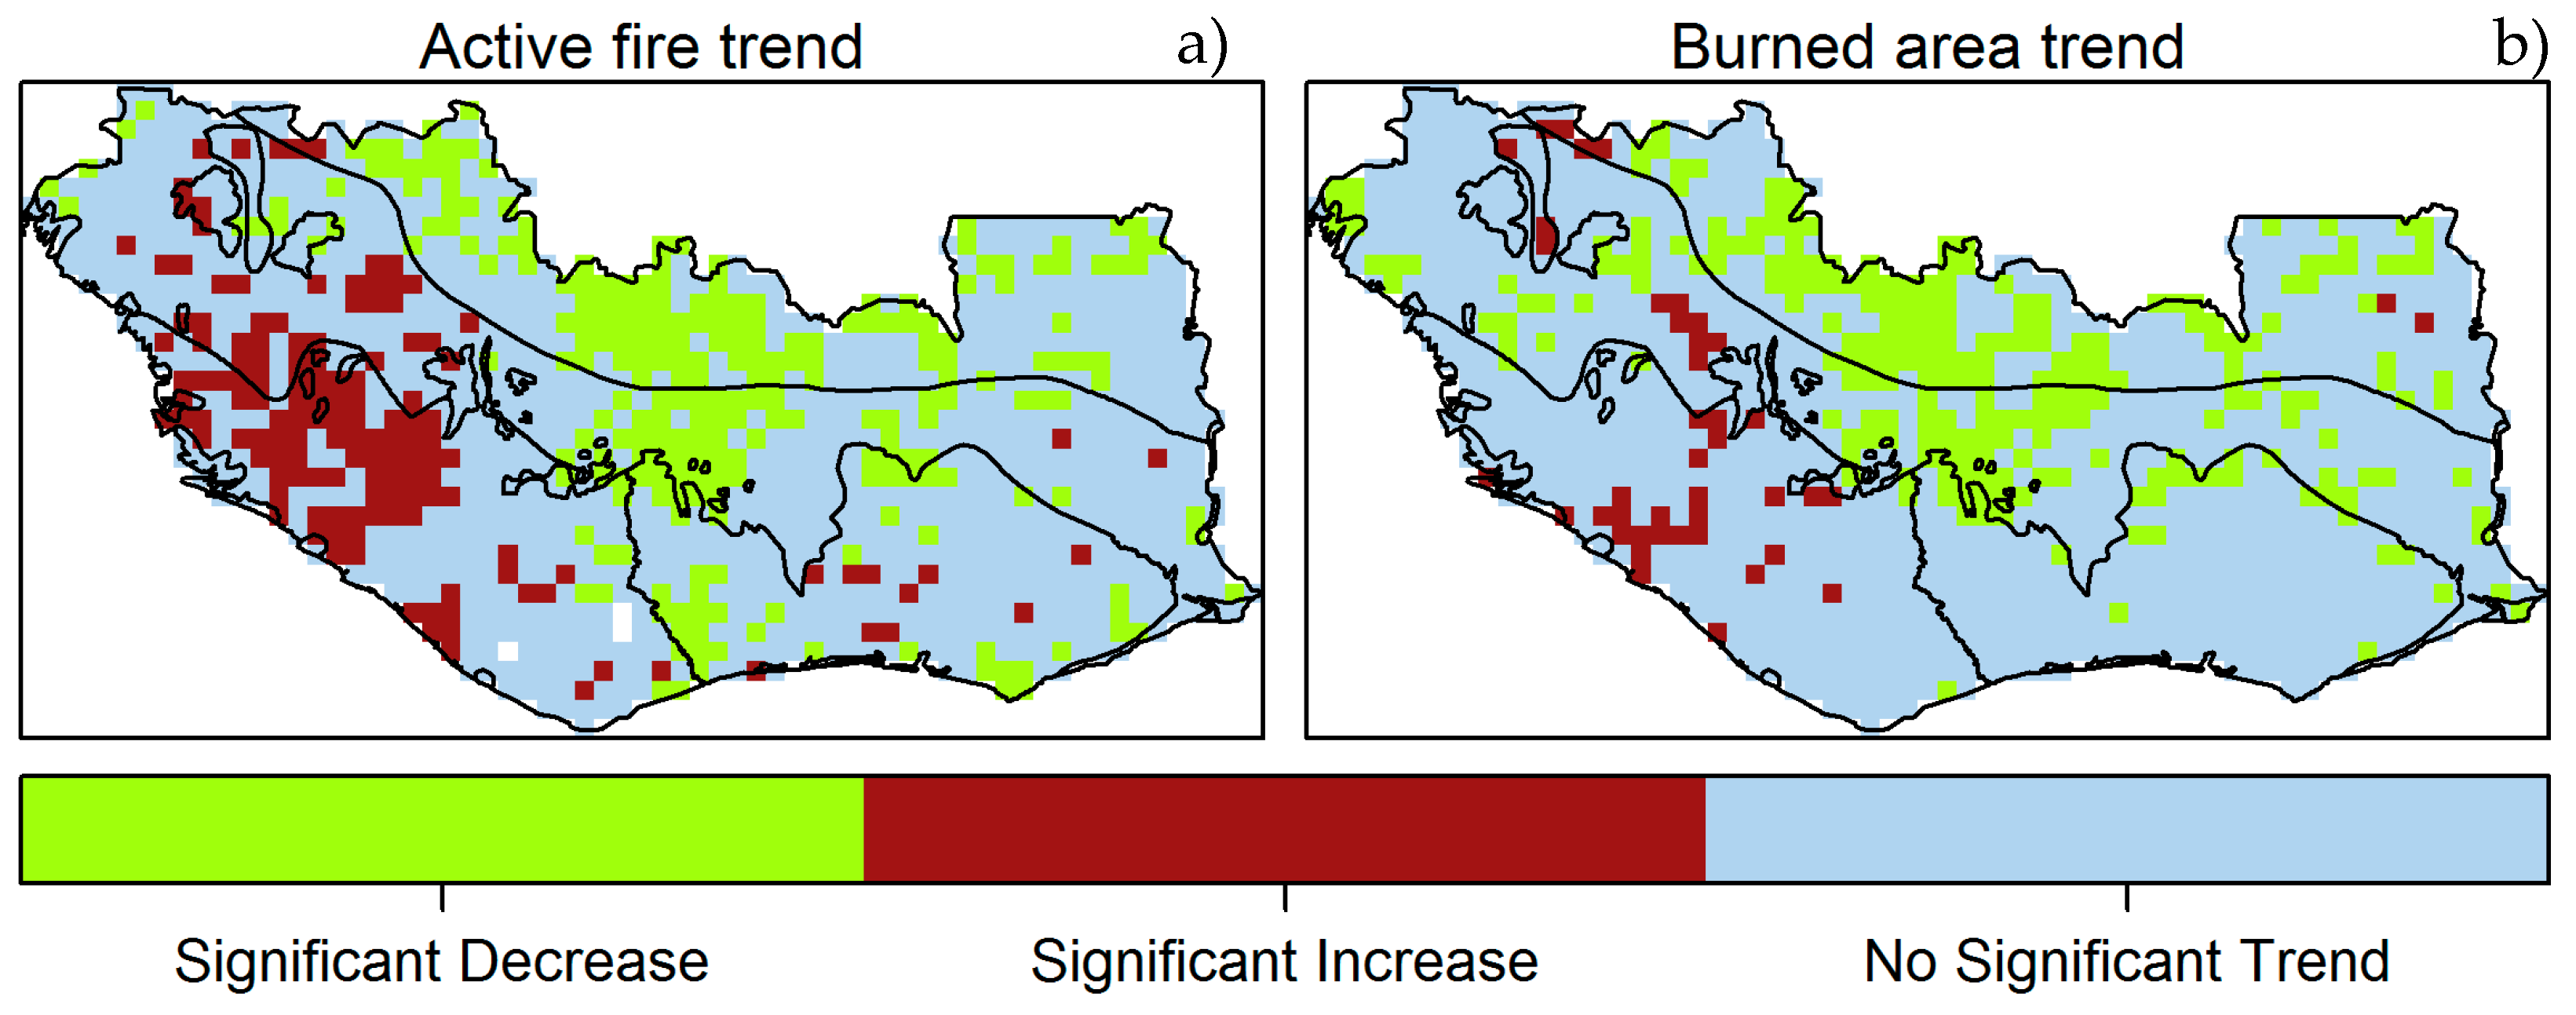
Figure 8.
Relative influences of the top 10 predictors from the BRT models of fire regime components. Only variables with relative importance values ≥5% of the variation are plotted here. Abbreviations of predictor variables and their descriptions are provided in Table 1.
Figure 8.
Relative influences of the top 10 predictors from the BRT models of fire regime components. Only variables with relative importance values ≥5% of the variation are plotted here. Abbreviations of predictor variables and their descriptions are provided in Table 1.
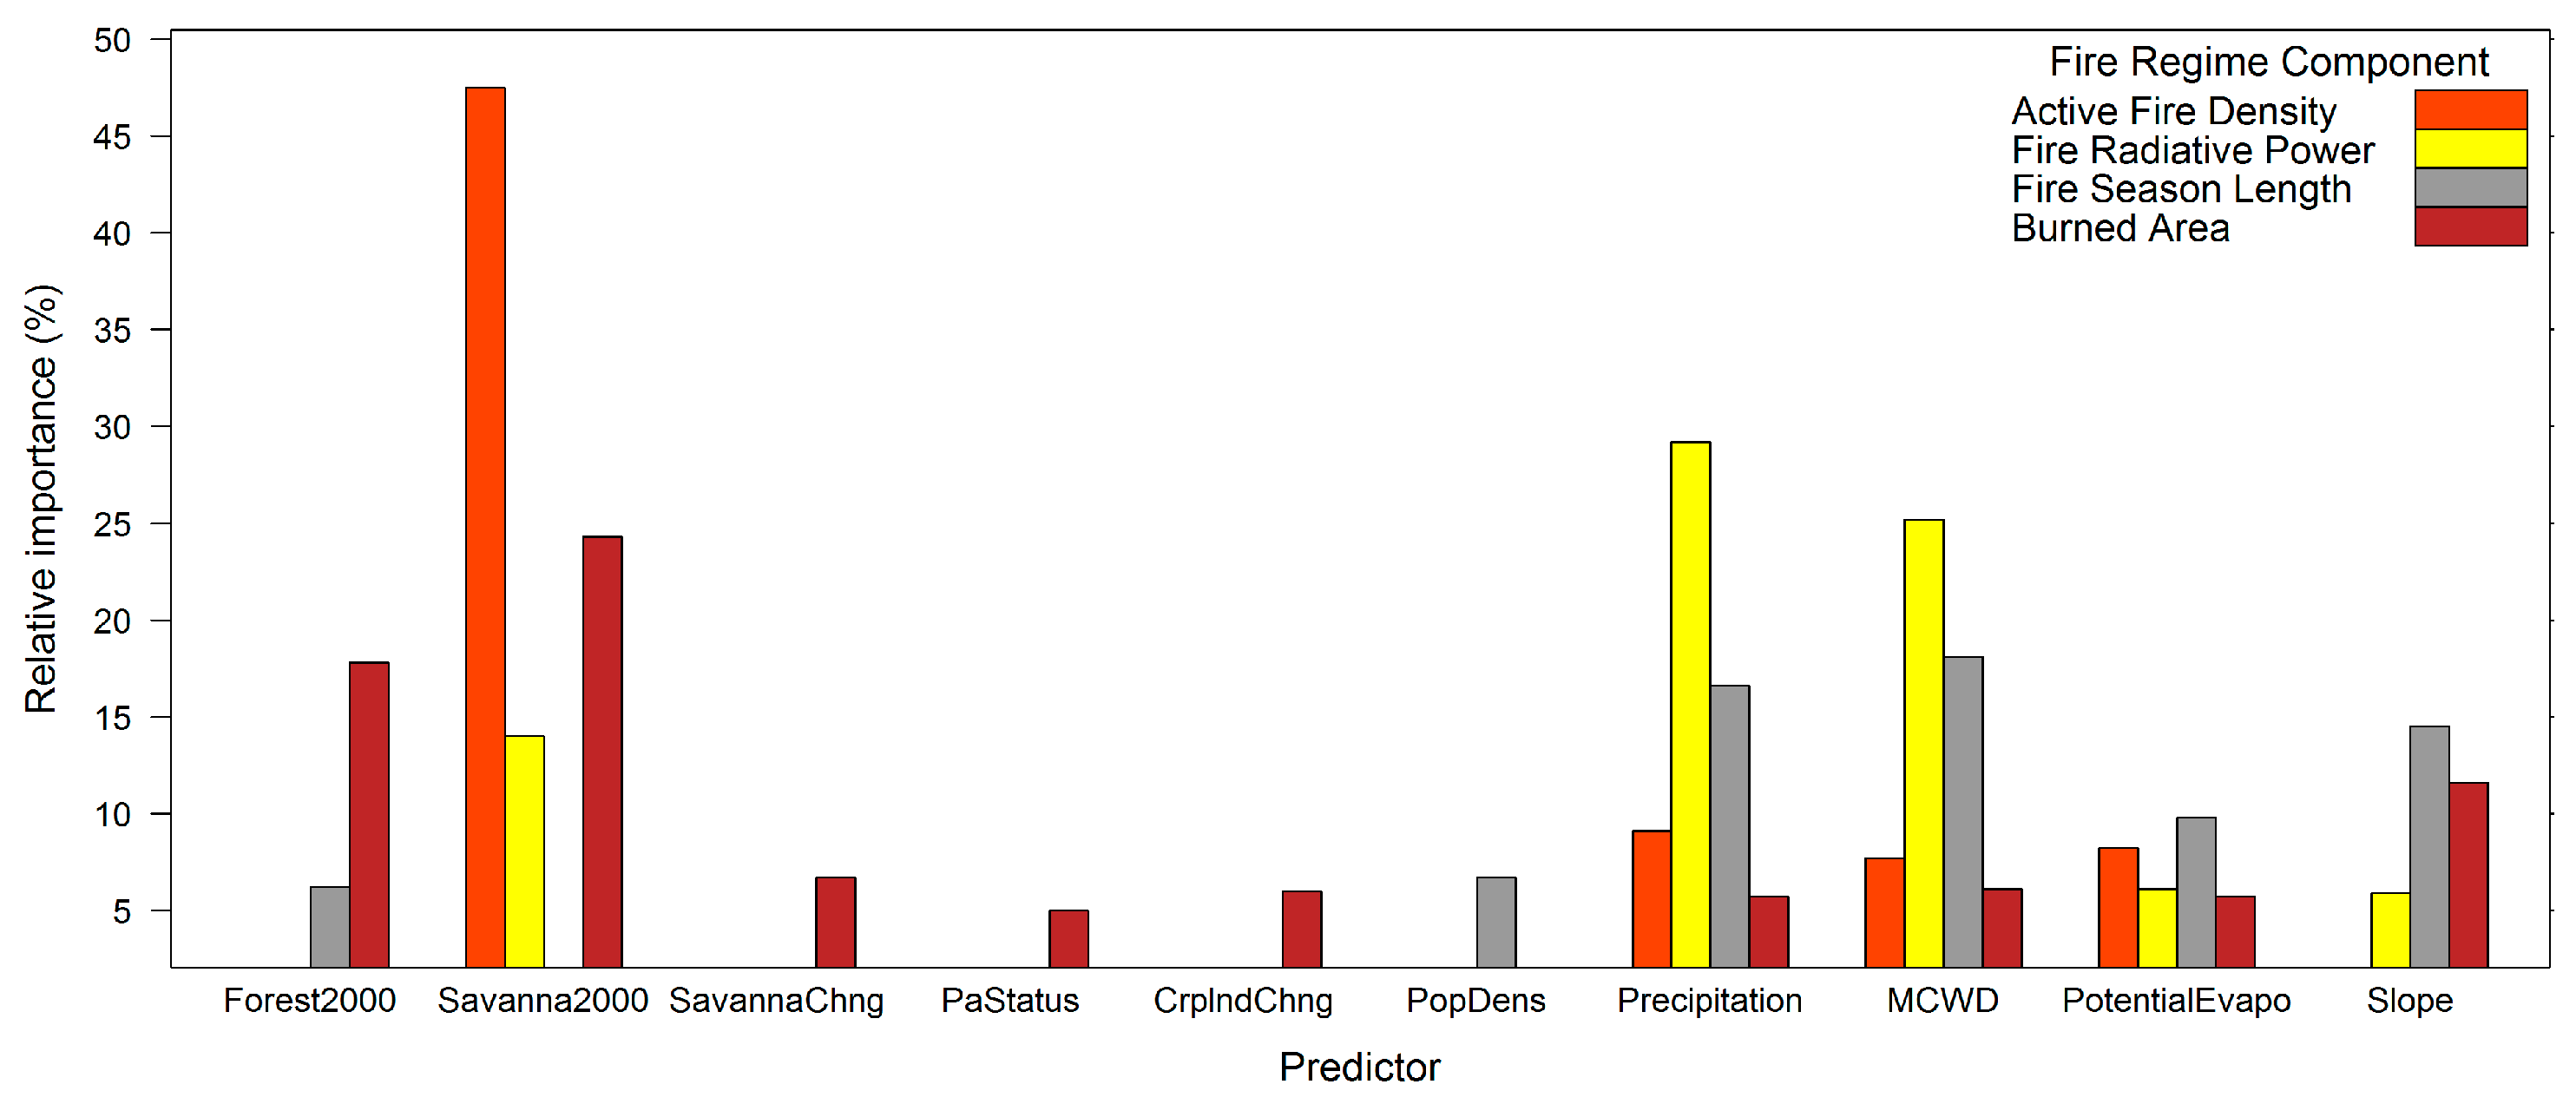
Figure 9.
Partial dependence plots of the top four (4) predictors from the BRT model for each fire regime component: (a) active fire density; (b) percent burned area; (c) fire season length; (d) fire radiative power. The plots represent the effect of each predictor on fire activity after considering the average effect of all predictors in the model. Abbreviations of predictor variables and their corresponding full names are described in Table 1.


Table 1.
Data layers used in the analyses. All variables were re-scaled to the TRMM spatial resolution of 0.25°.
Table 1.
Data layers used in the analyses. All variables were re-scaled to the TRMM spatial resolution of 0.25°.
| Data Layer | Sources and Description | Variable Name (Units) |
|---|---|---|
| Fire variables | ||
| Active Fire Density | Mean annual fire density for 2003–2015 derived from 1 km monthly MODIS active fire product MCD14ML collection 6 [24] | AfDens (fires 10−3 km−2 year−1) |
| Fire Radiative Power | Mean fire radiative power per pixel of active fire detections for 2003–2015 derived from MCD14ML collection 6 | mFRP (MW km−2) |
| Fire Season Length | Length of the active fire period for 2003–2015 generated from MCD14ML collection 6 | FSL (months/year) |
| Burned Area | Mean annual burned area for 2003–2015, as a percent of grid cell area, generated from 500 m monthly Burned Area product MCD64A1 Collection 6 [30] | BurnedArea (% year−1) |
| Predictor variables | ||
| Vegetation | ||
| Forest cover 2000 | Proportion of grid cell covered by forest in 2000, derived from 2 km resolution USGS land cover map [6] | Forest2000 (%) |
| Forest Change | Change in proportion of forest between 2000 and 2013 (generated from [6]) | ForestChng (%) |
| Savanna cover 2000 | Proportion of grid cell covered by savanna in 2000, derived from USGS land cover map [6] | Savanna2000 (%) |
| Savanna Change | Change in proportion of savanna between 2000 and 2013 (generated from [6]) | SavannaChng (%) |
| Protected Area Status | IUCN Protected Categories System [39] | PaStatus: 1: Production-Reserve (PR), 2: Eco-Reserve (ER), 3: Non-protected (NP) |
| Climate | ||
| Mean Annual Precipitation | Mean annual precipitation for 2003–2015, derived from Tropical Rainfall Measuring Mission (TRMM) monthly product 3B43-v7 [40] | Precipitation (mm/year) |
| Mean Annual Cumulative Water Deficit | Mean annual maximum cumulative water deficit for 2003–2015, calculated from TRMM product 3B43-v7 | MCWD (mm/year) |
| Potential Evapotranspiration | Global Aridity Index & Potential Evapo-Transpiration Climate Database, ≈1 km resolution [37] | PotentialEvapo (mm/year) |
| Human | ||
| Population Density | Population density in 2010 generated from Gridded Population of the World (GPWv4), ≈1 km resolution from CIESIN (Center for International Earth Science Information Network—Columbia University, 2015) | PopDens (persons/km2 log10 scale) |
| Distance to Road | Euclidean distance to major roads (functional class 0–3), derived from Global Roads Open Access Data Set [38] | Dist2Road (km log10 scale) |
| Cropland 2000 | Proportion of grid cell covered by cropland/agriculture in 2000, generated from USGS land cover map [6] | Crplnd2000 (%) |
| Cropland Change | Change in proportion of cropland between 2000 and 2013, generated from USGS land cover map [6] | CrplndChng (%) |
| Distance to Cropland | Euclidean distance to cropland in 2000, generated from USGS land cover map [6] | Dist2Crplnd (km) |
| Topography | ||
| Slope | Slope from ≈90 m resolution SRTM DEM [41] | Slope (degrees) |
Table 2.
Summary of fire regime characteristics (mean ± standard deviation) across ecoregions for the period 2003–2015.
Table 2.
Summary of fire regime characteristics (mean ± standard deviation) across ecoregions for the period 2003–2015.
| Fire Regime Metric | Western Guinean Lowland Forests (WGLF) | Eastern Guinean Forests (EGF) | Guinean Forest Savanna Mosaic (GFSM) | West Sudanian Savanna (WSS) |
|---|---|---|---|---|
| Annual Active Fire Density (fires 10−3 km−2 year−1) | 162 ± 51 | 54 ± 11 | 297 ± 24 | 267 ± 31 |
| Percent Annual Burned Area (% year−1) | 3.8 ± 1.6 | 1.8 ± 0.7 | 21.2 ± 3.8 | 27.2 ± 4.5 |
| Fire Season Length (months) | 2.9 ± 0.8 | 3.4 ± 0.7 | 3.3 ± 1.0 | 3.2 ± 0.9 |
| Fire Radiative Power (MW km−2) | 47 ± 79 | 23 ± 34 | 42 ± 86 | 34 ± 44 |
Table 3.
Nonparametric Mann–Kendall tests to detect trends in fire activity at ecoregion scale from 2003–2015. Positive Kandall’s tau statistic values indicate increasing trends, whilst negative values indicate decreasing trends.
Table 3.
Nonparametric Mann–Kendall tests to detect trends in fire activity at ecoregion scale from 2003–2015. Positive Kandall’s tau statistic values indicate increasing trends, whilst negative values indicate decreasing trends.
| Fire Regime Metric | Statistic | Western Guinean Lowland Forests | Eastern Guinean Forests | Guinean Forest Savanna Mosaic | West Sudanian Savanna |
|---|---|---|---|---|---|
| Annual Active Fire Density | Tau | 0.359 | −0.333 | −0.103 | −0.385 |
| p-value | 0.1 * | 0.127 | 0.669 | 0.077 * | |
| Annual Burned Area | Tau | 0.077 | −0.333 | −0.359 | −0.308 |
| p-value | 0.76 | 0.127 | 0.1 * | 0.161 |
* Significant at α = 0.1
© 2017 by the authors. Licensee MDPI, Basel, Switzerland. This article is an open access article distributed under the terms and conditions of the Creative Commons Attribution (CC BY) license (http://creativecommons.org/licenses/by/4.0/).
Share and Cite
MDPI and ACS Style
Dwomoh, F.K.; Wimberly, M.C. Fire Regimes and Their Drivers in the Upper Guinean Region of West Africa. Remote Sens. 2017, 9, 1117. https://doi.org/10.3390/rs9111117
AMA Style
Dwomoh FK, Wimberly MC. Fire Regimes and Their Drivers in the Upper Guinean Region of West Africa. Remote Sensing. 2017; 9(11):1117. https://doi.org/10.3390/rs9111117
Chicago/Turabian StyleDwomoh, Francis K., and Michael C. Wimberly. 2017. "Fire Regimes and Their Drivers in the Upper Guinean Region of West Africa" Remote Sensing 9, no. 11: 1117. https://doi.org/10.3390/rs9111117
Note that from the first issue of 2016, this journal uses article numbers instead of page numbers. See further details here.