Deriving Spatio-Temporal Development of Ground Subsidence Due to Subway Construction and Operation in Delta Regions with PS-InSAR Data: A Case Study in Guangzhou, China


 , ,
, ,
Abstract
:
1. Introduction
2. Study Area, InSAR Dataset, and Methods
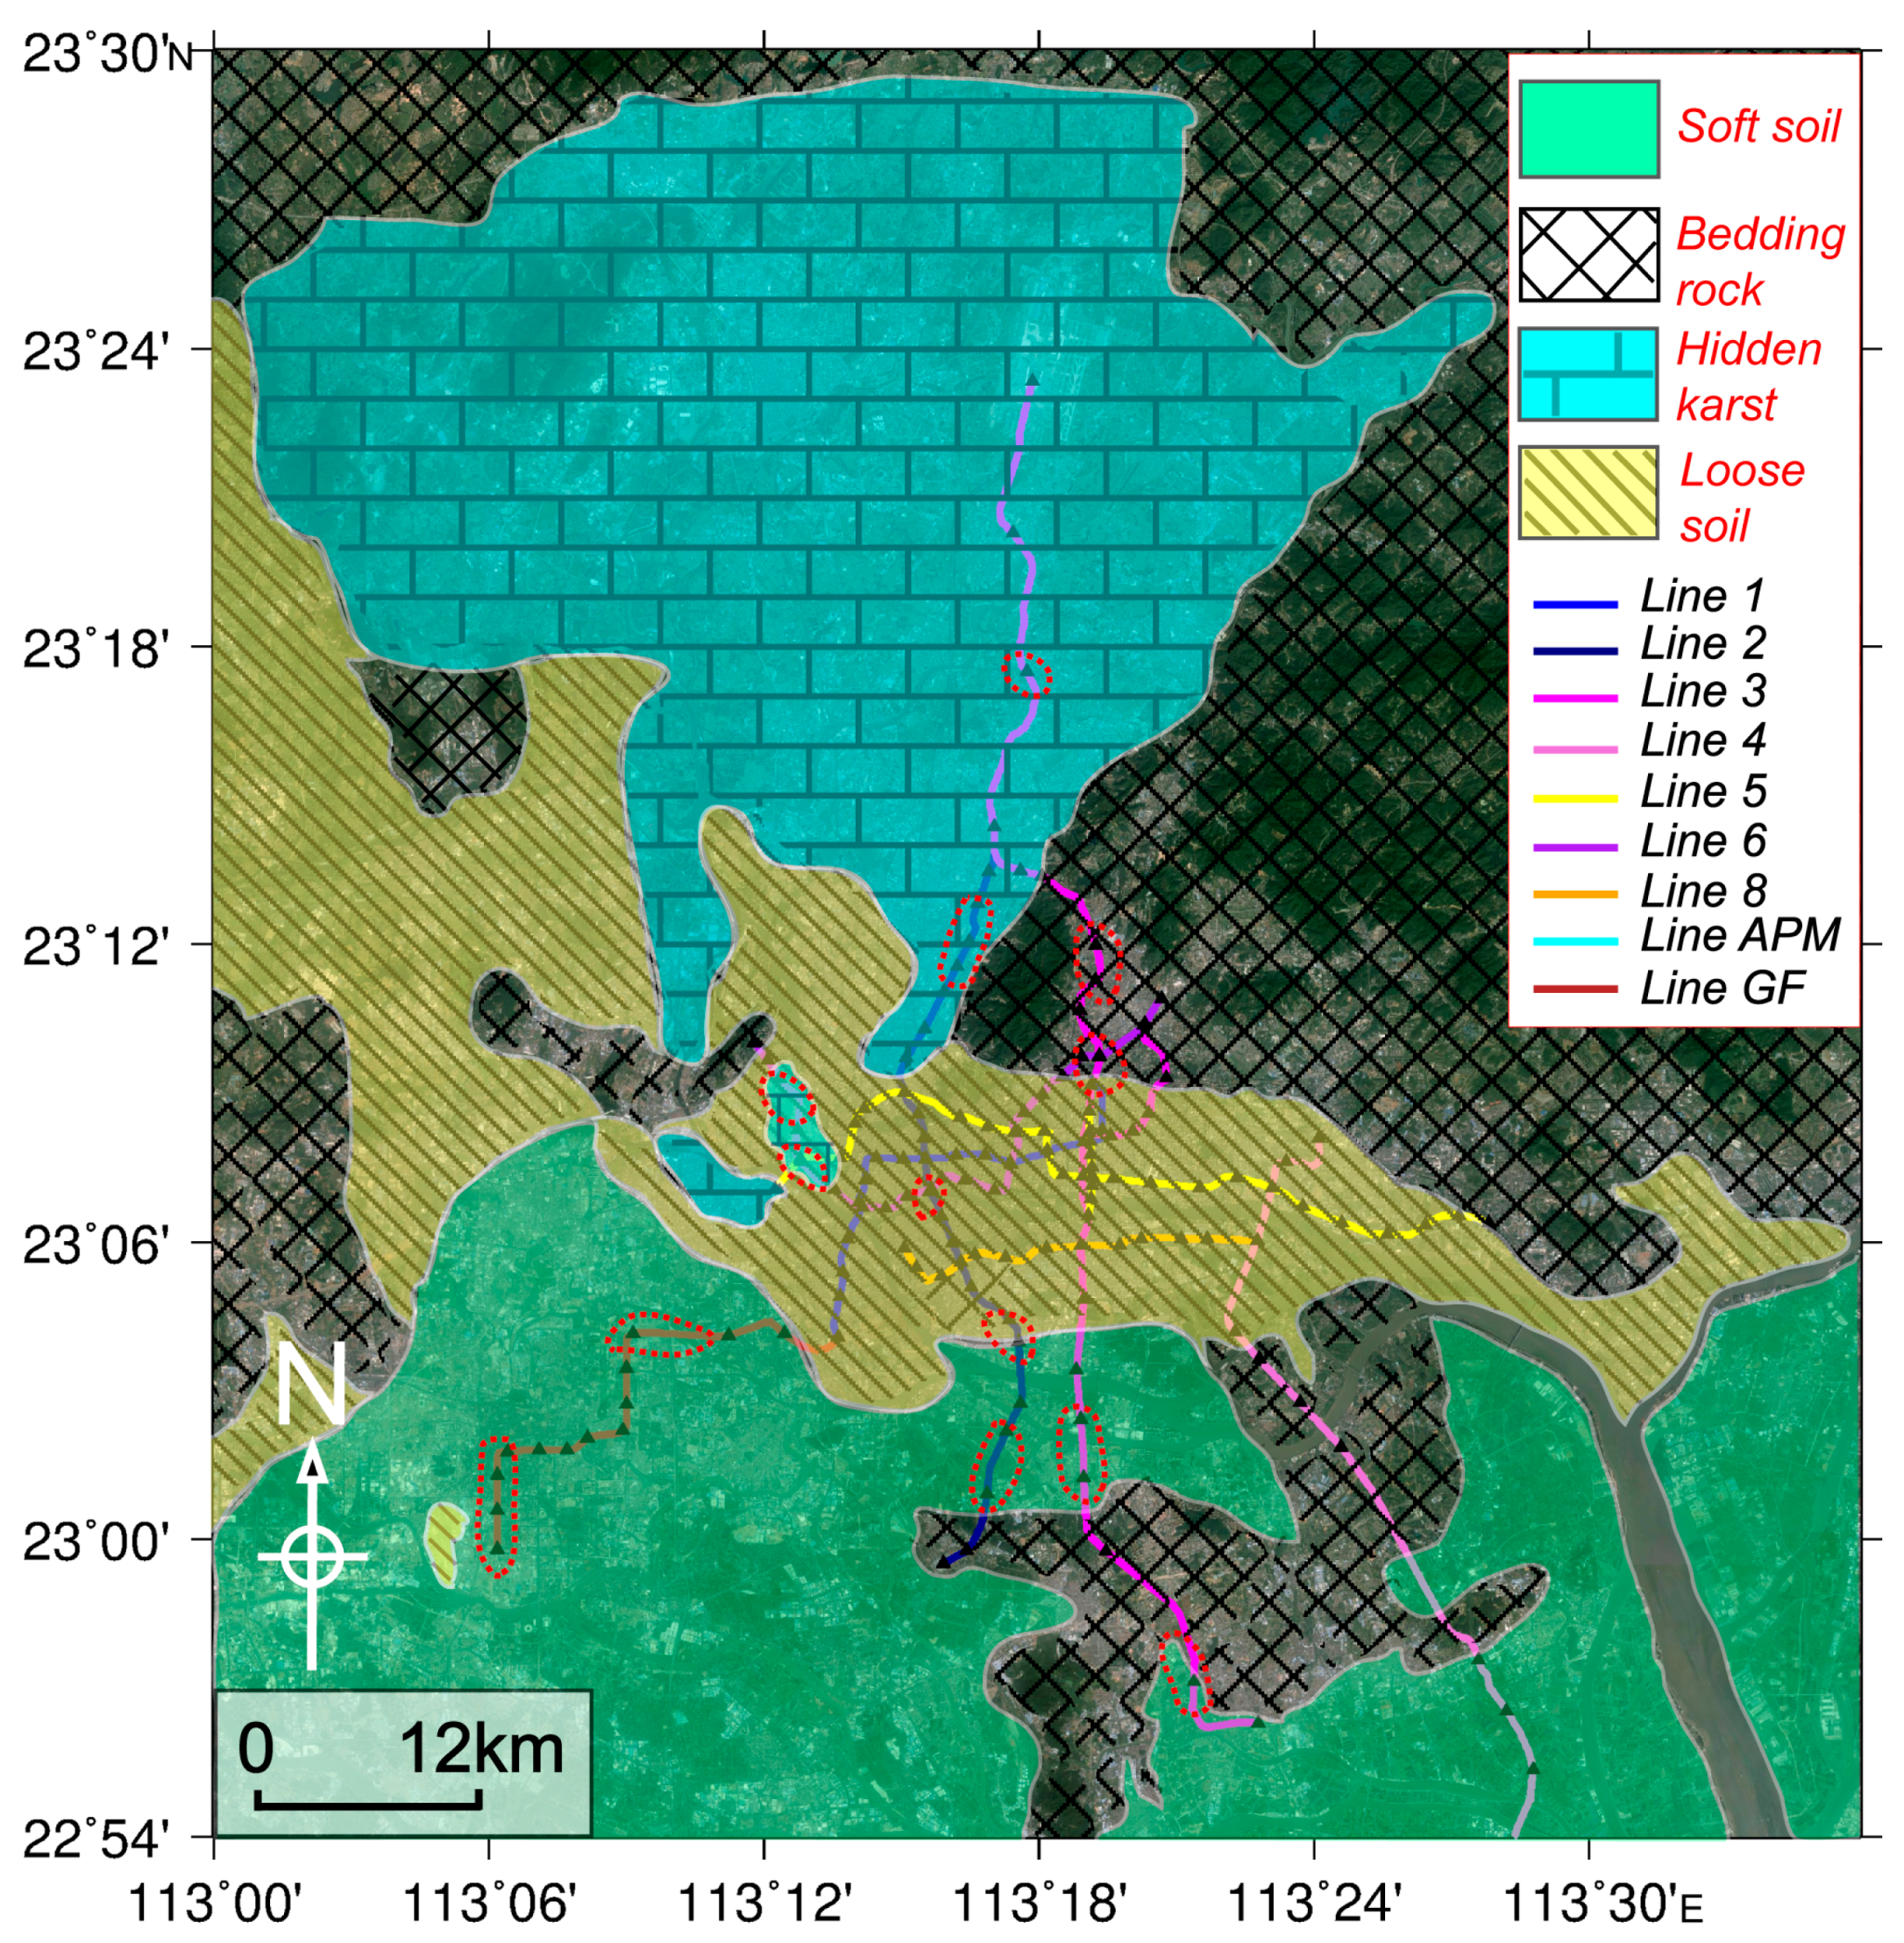
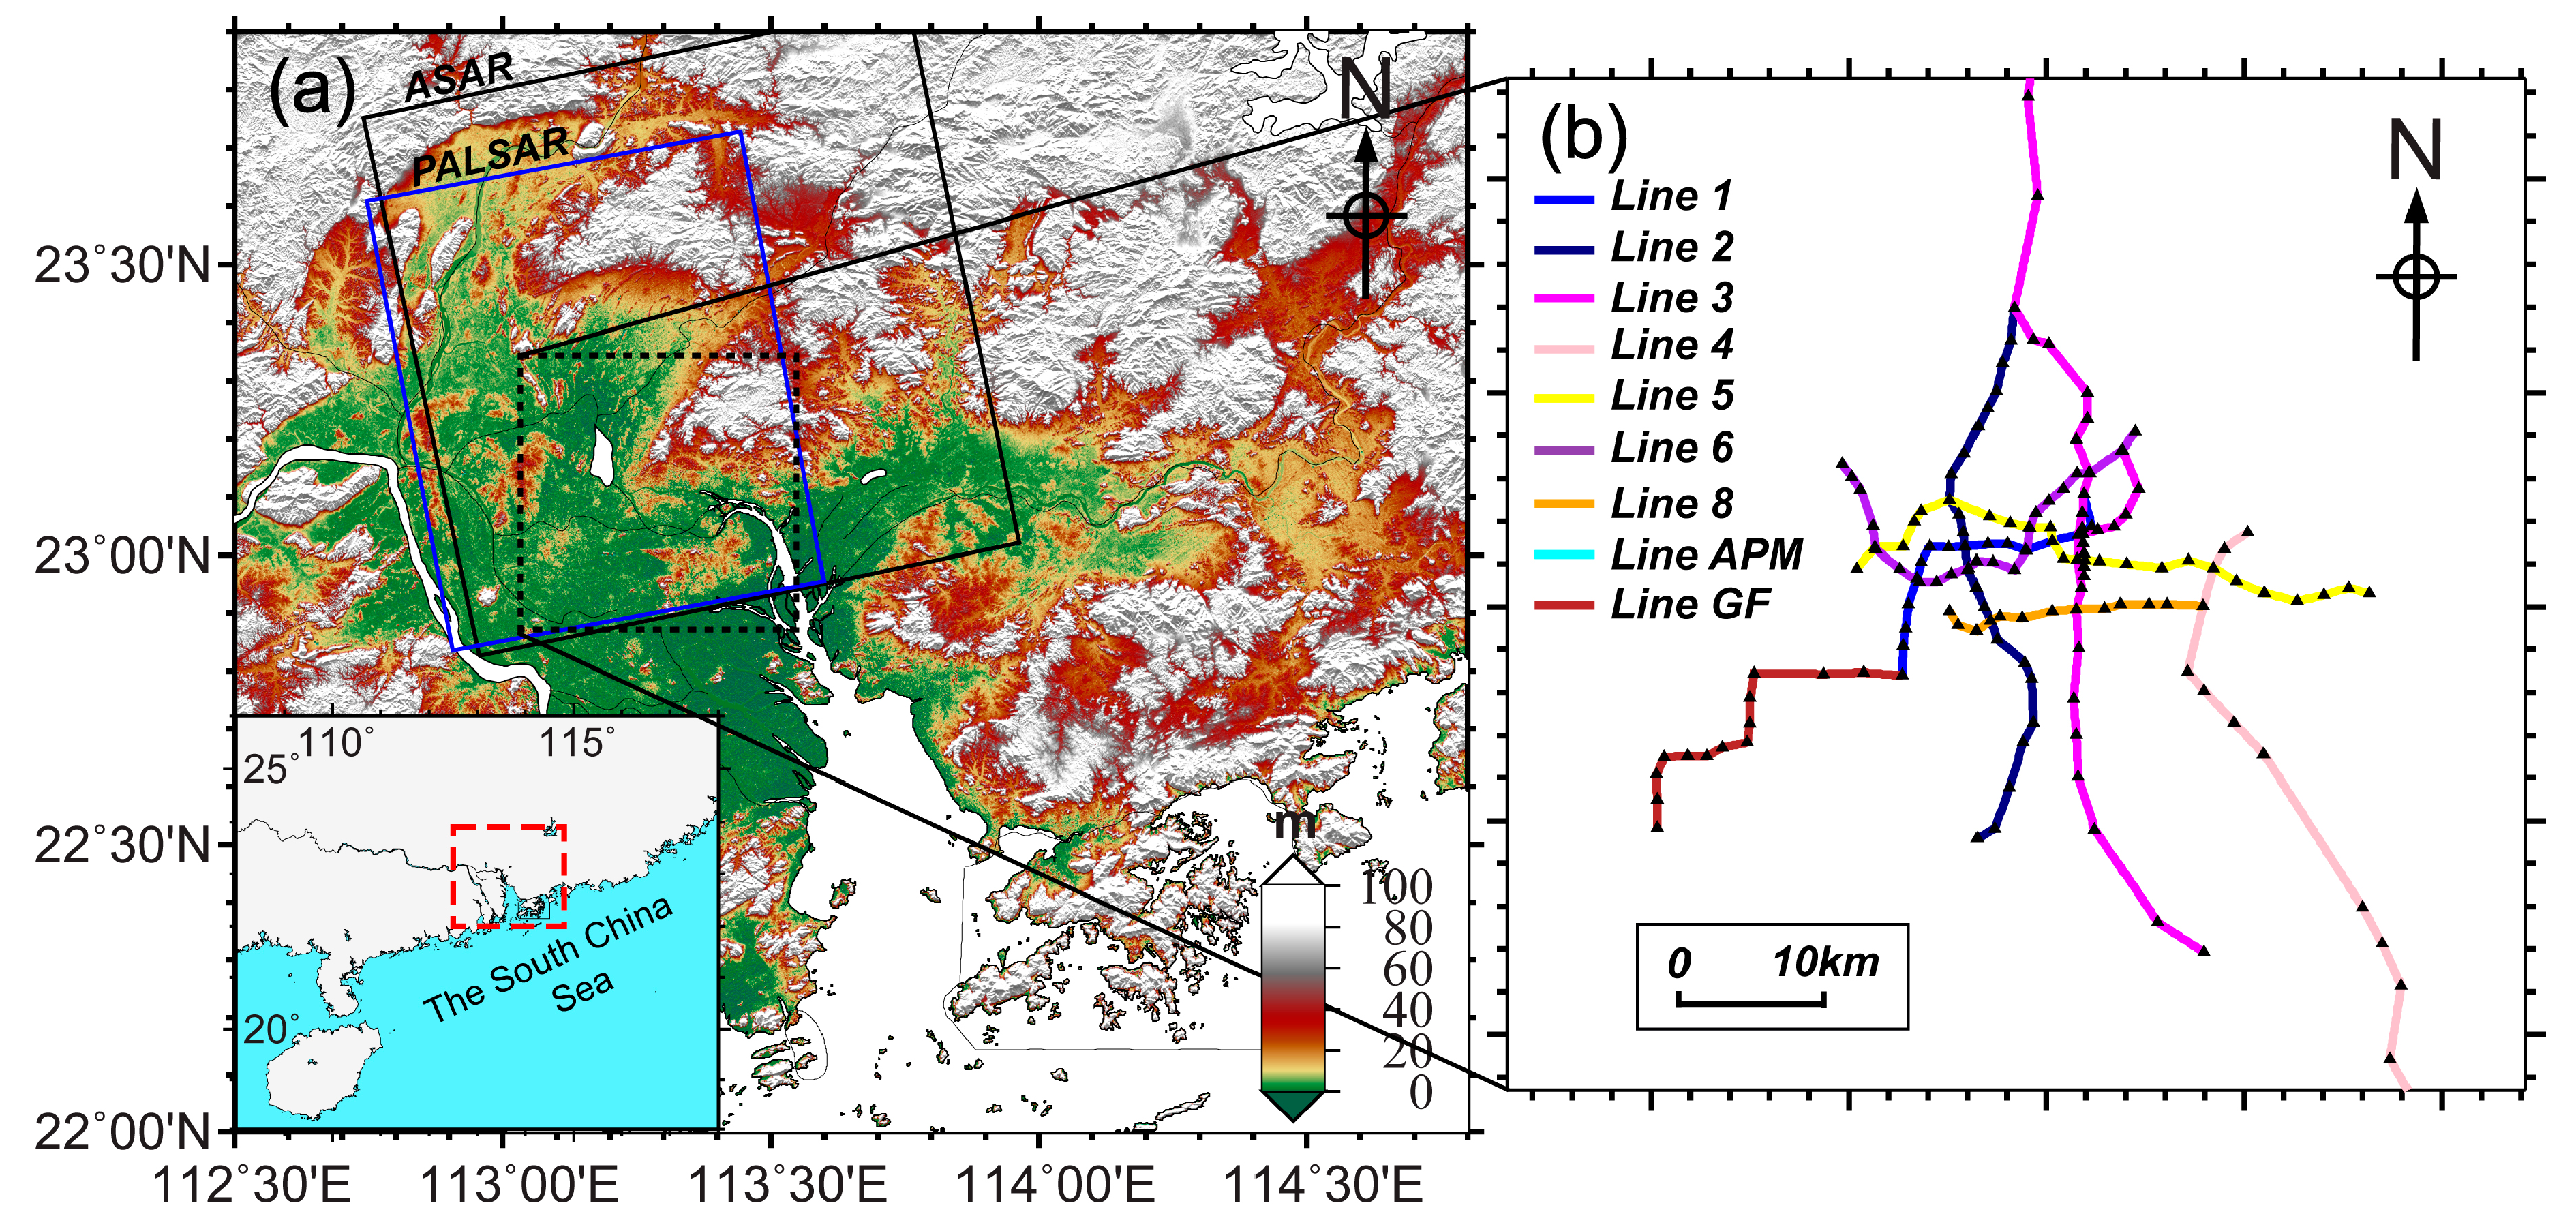
2.1. Study Area
2.2. InSAR Data Processing
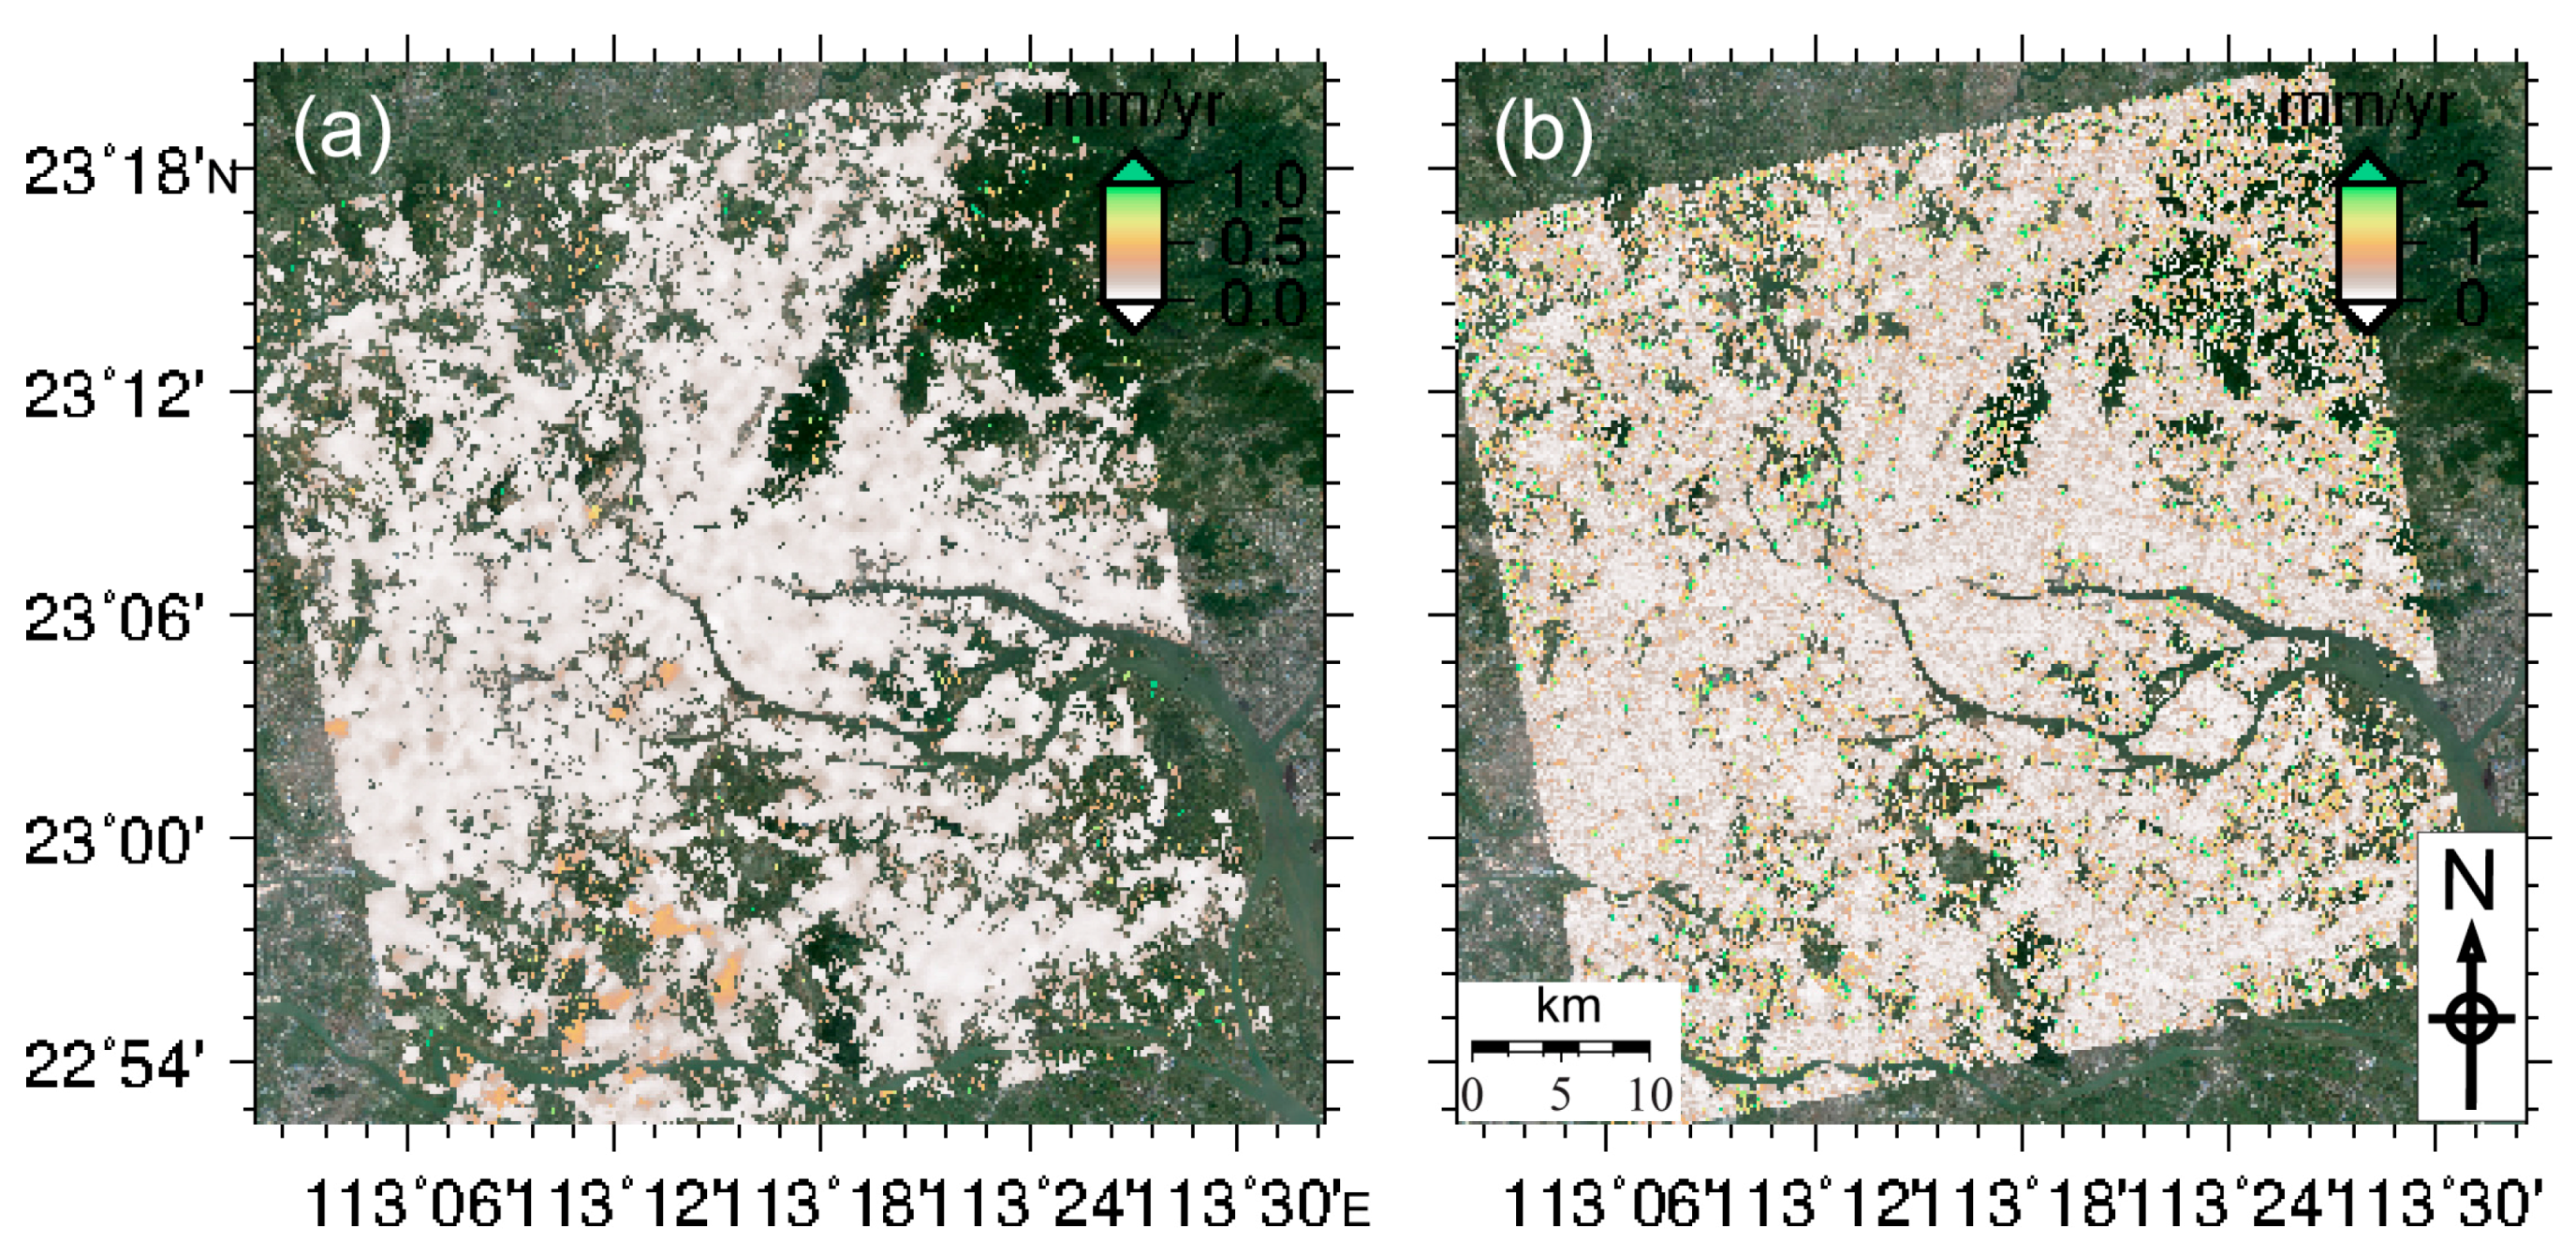
2.3. Calibration and Validation
3. Ground Subsidence of the Guangzhou Subway Network
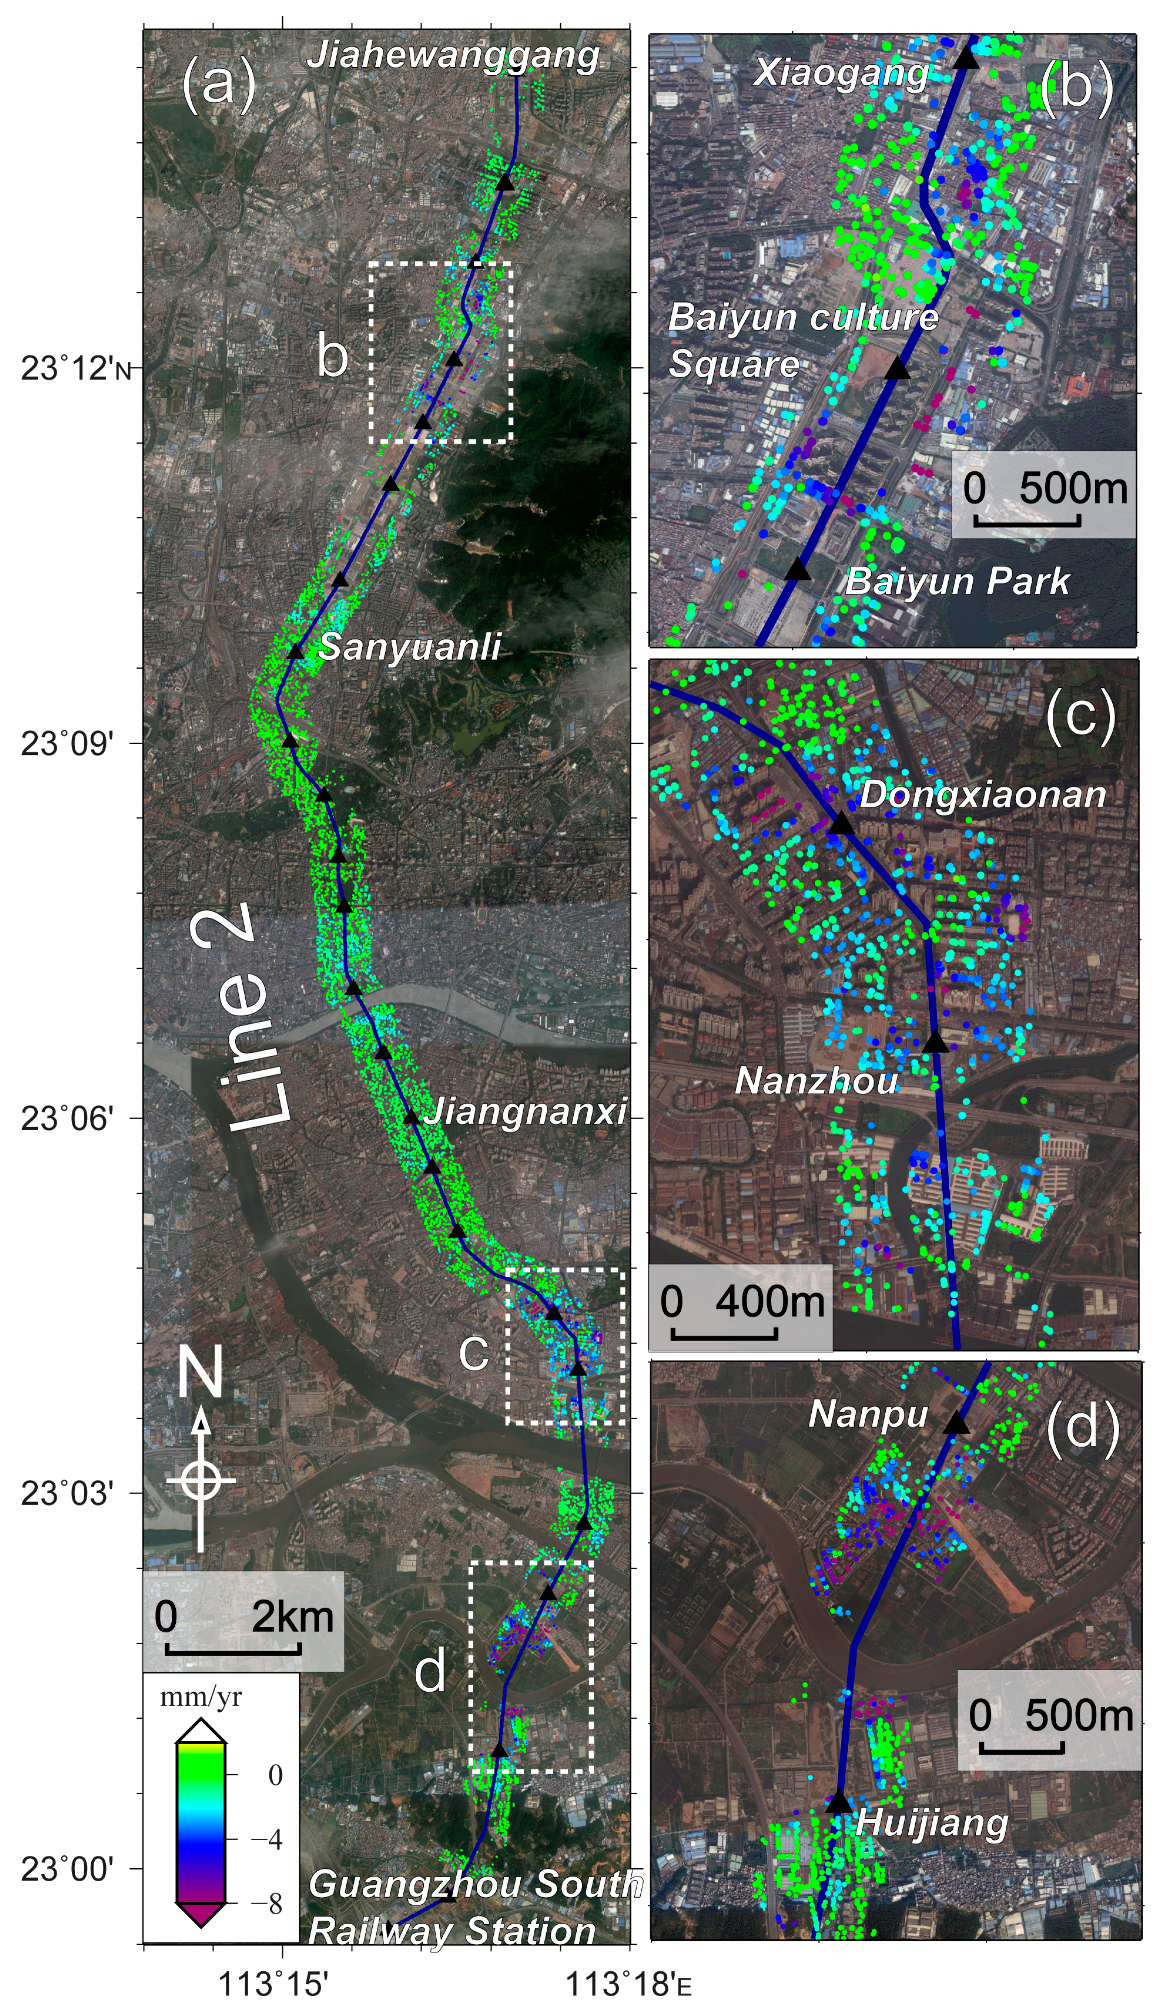
3.1. Line Two
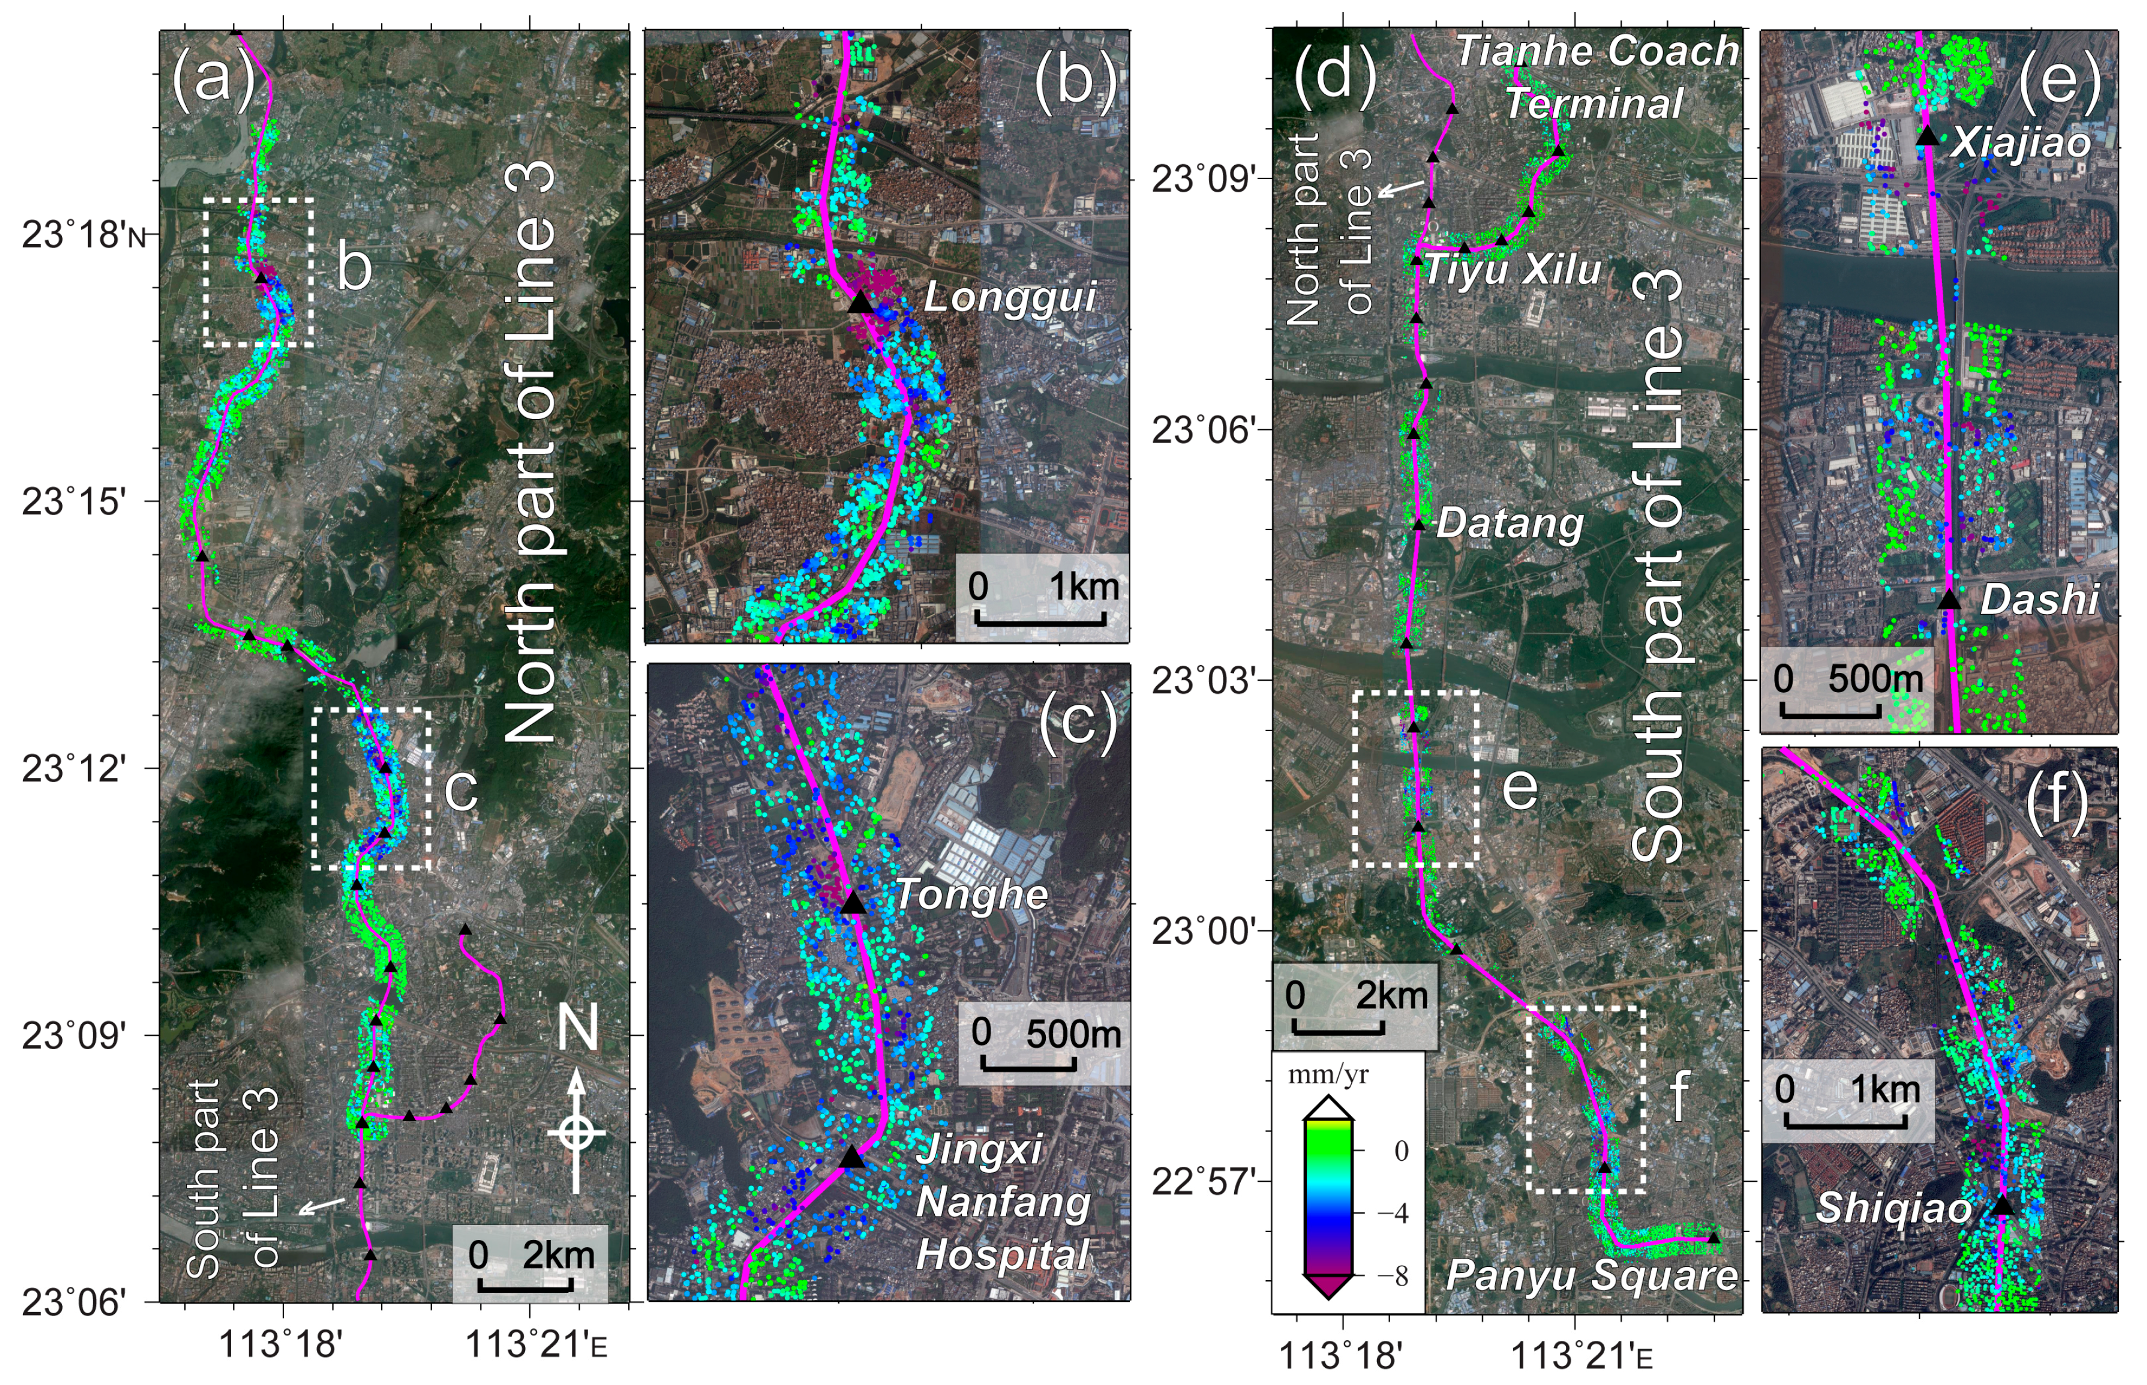
3.2. Line Three
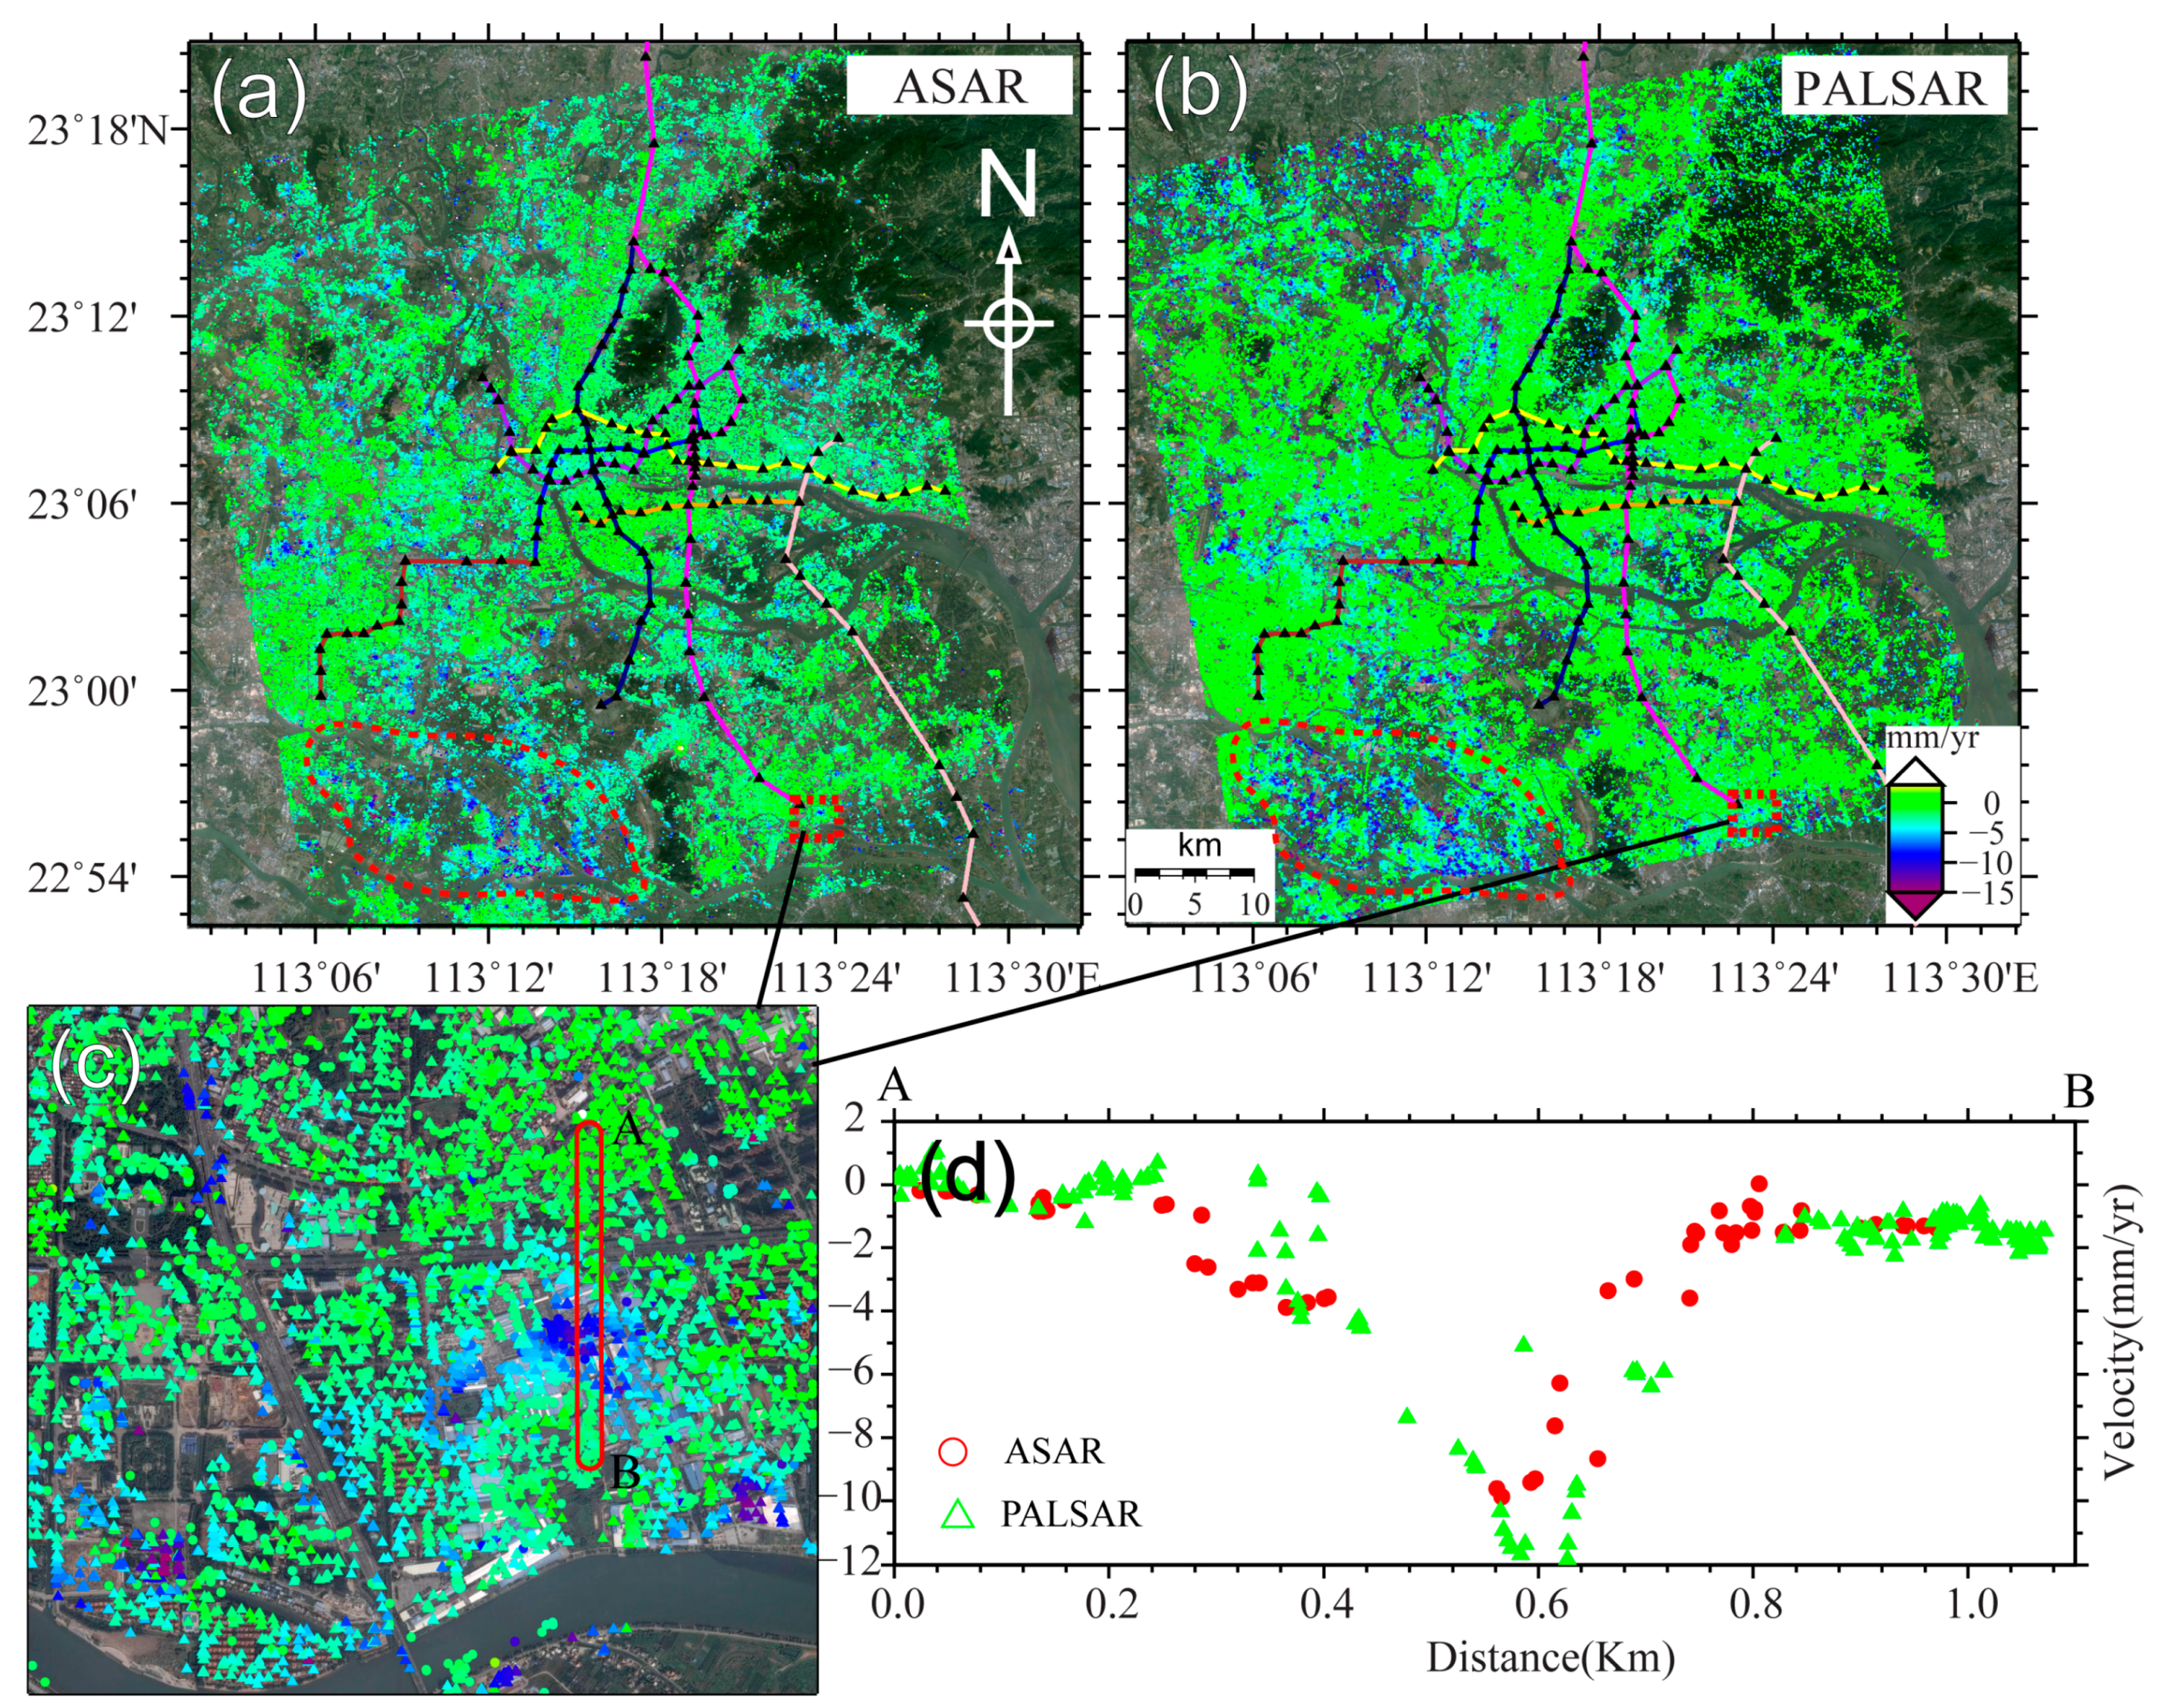
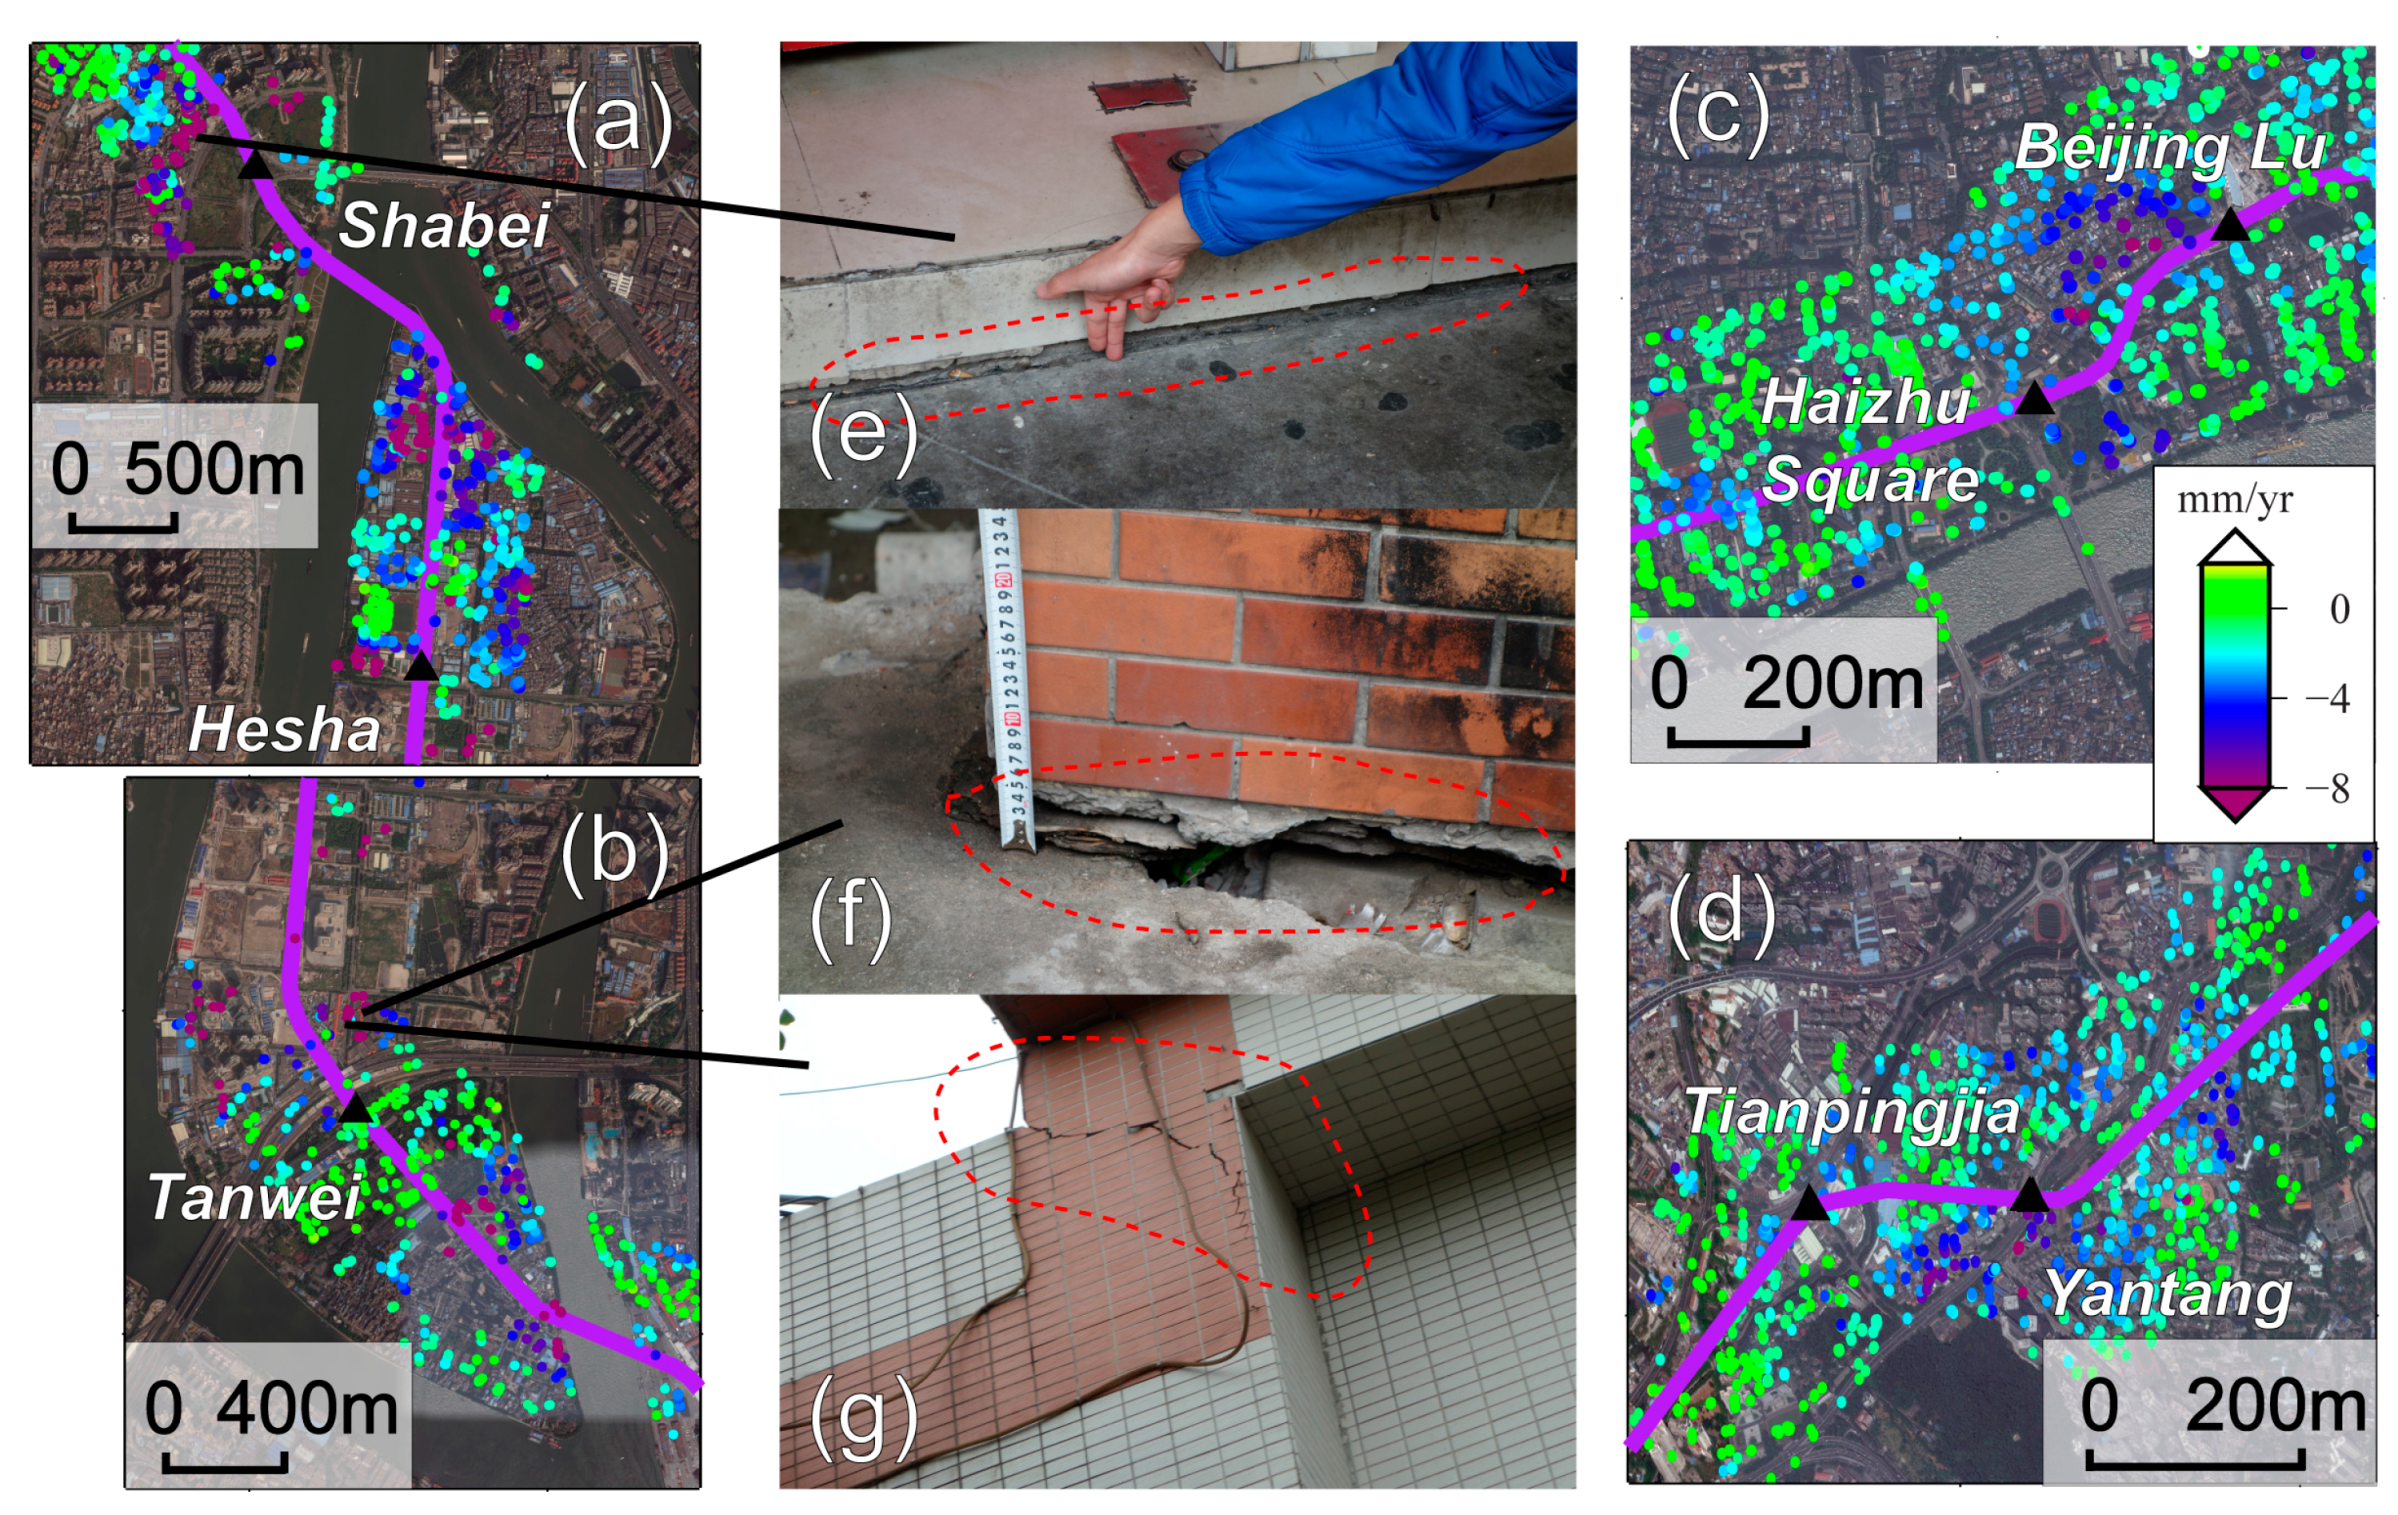
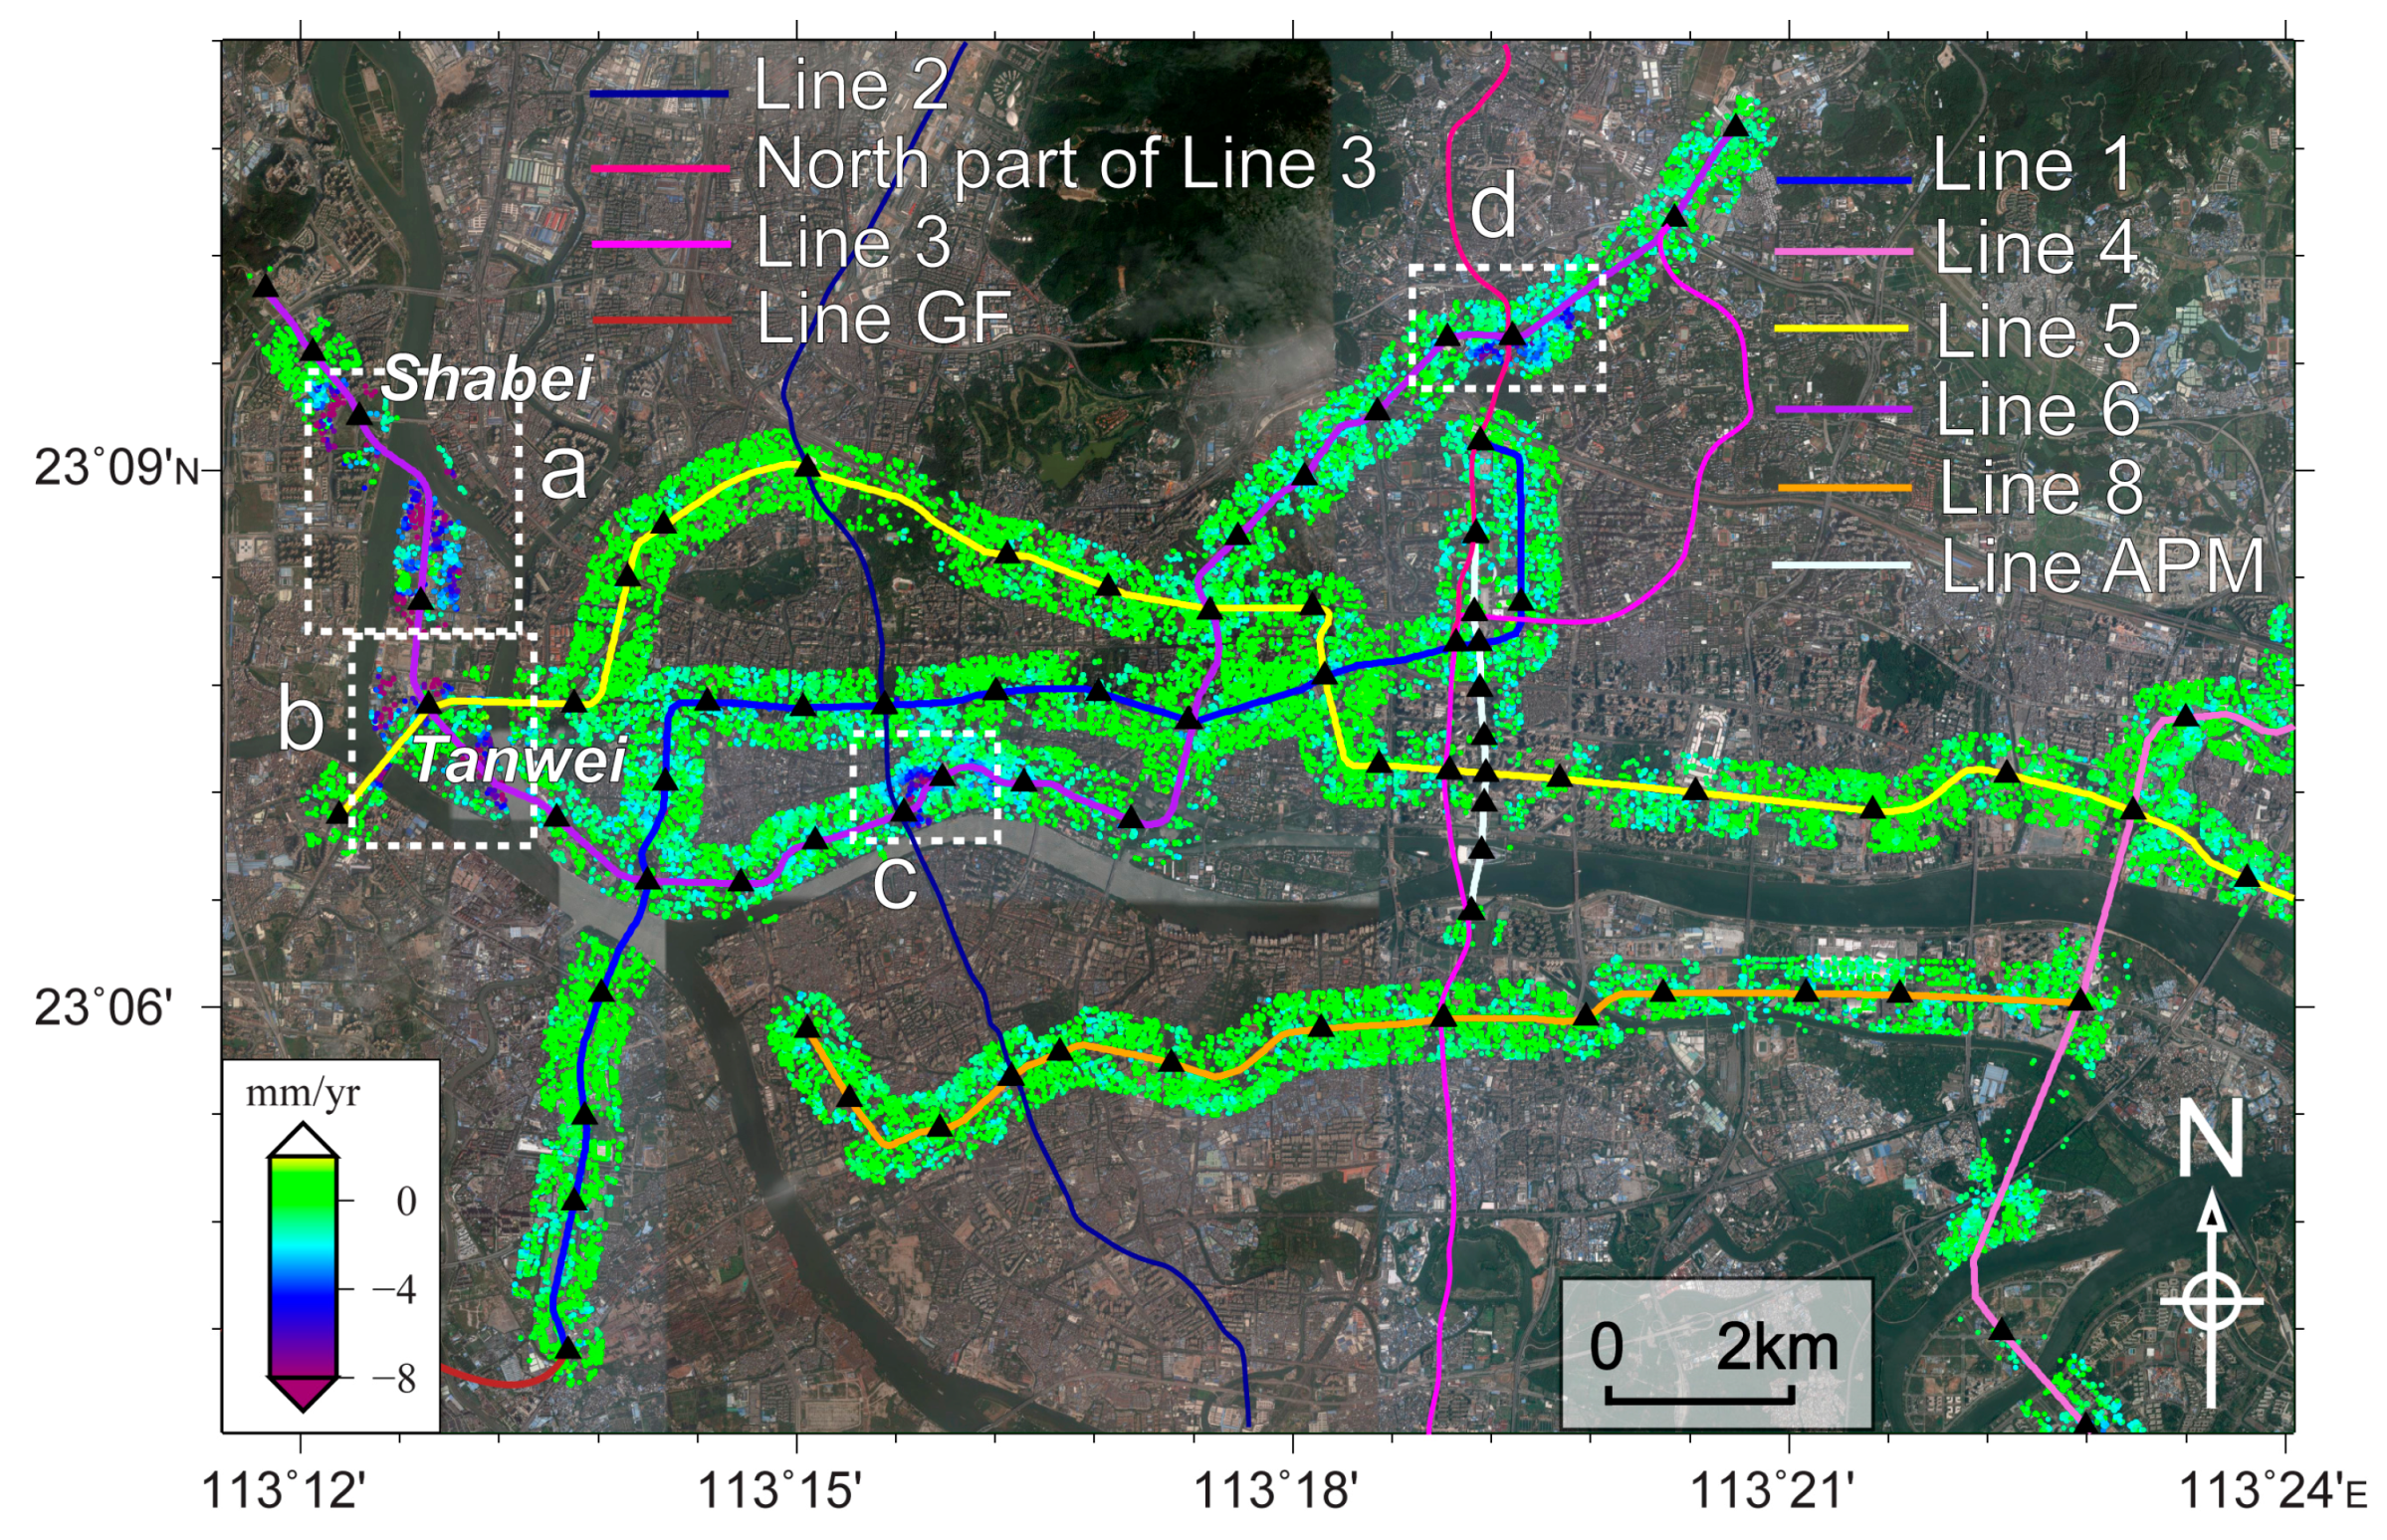
3.3. Subway Network Including Lines One, Four, Five, Six, Eight, and APM
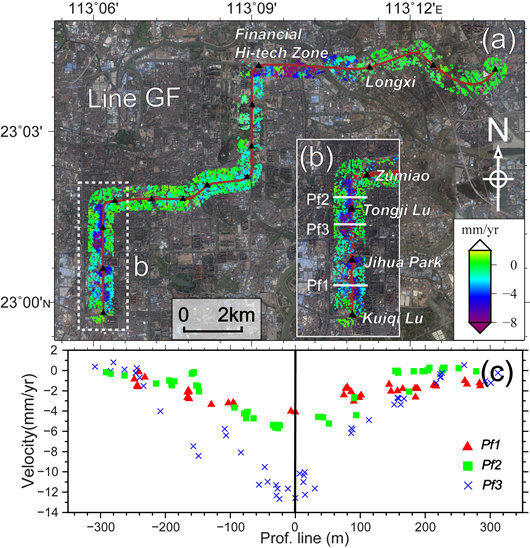
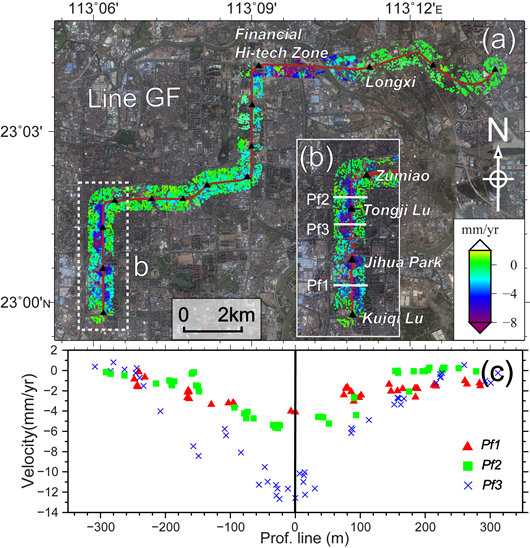
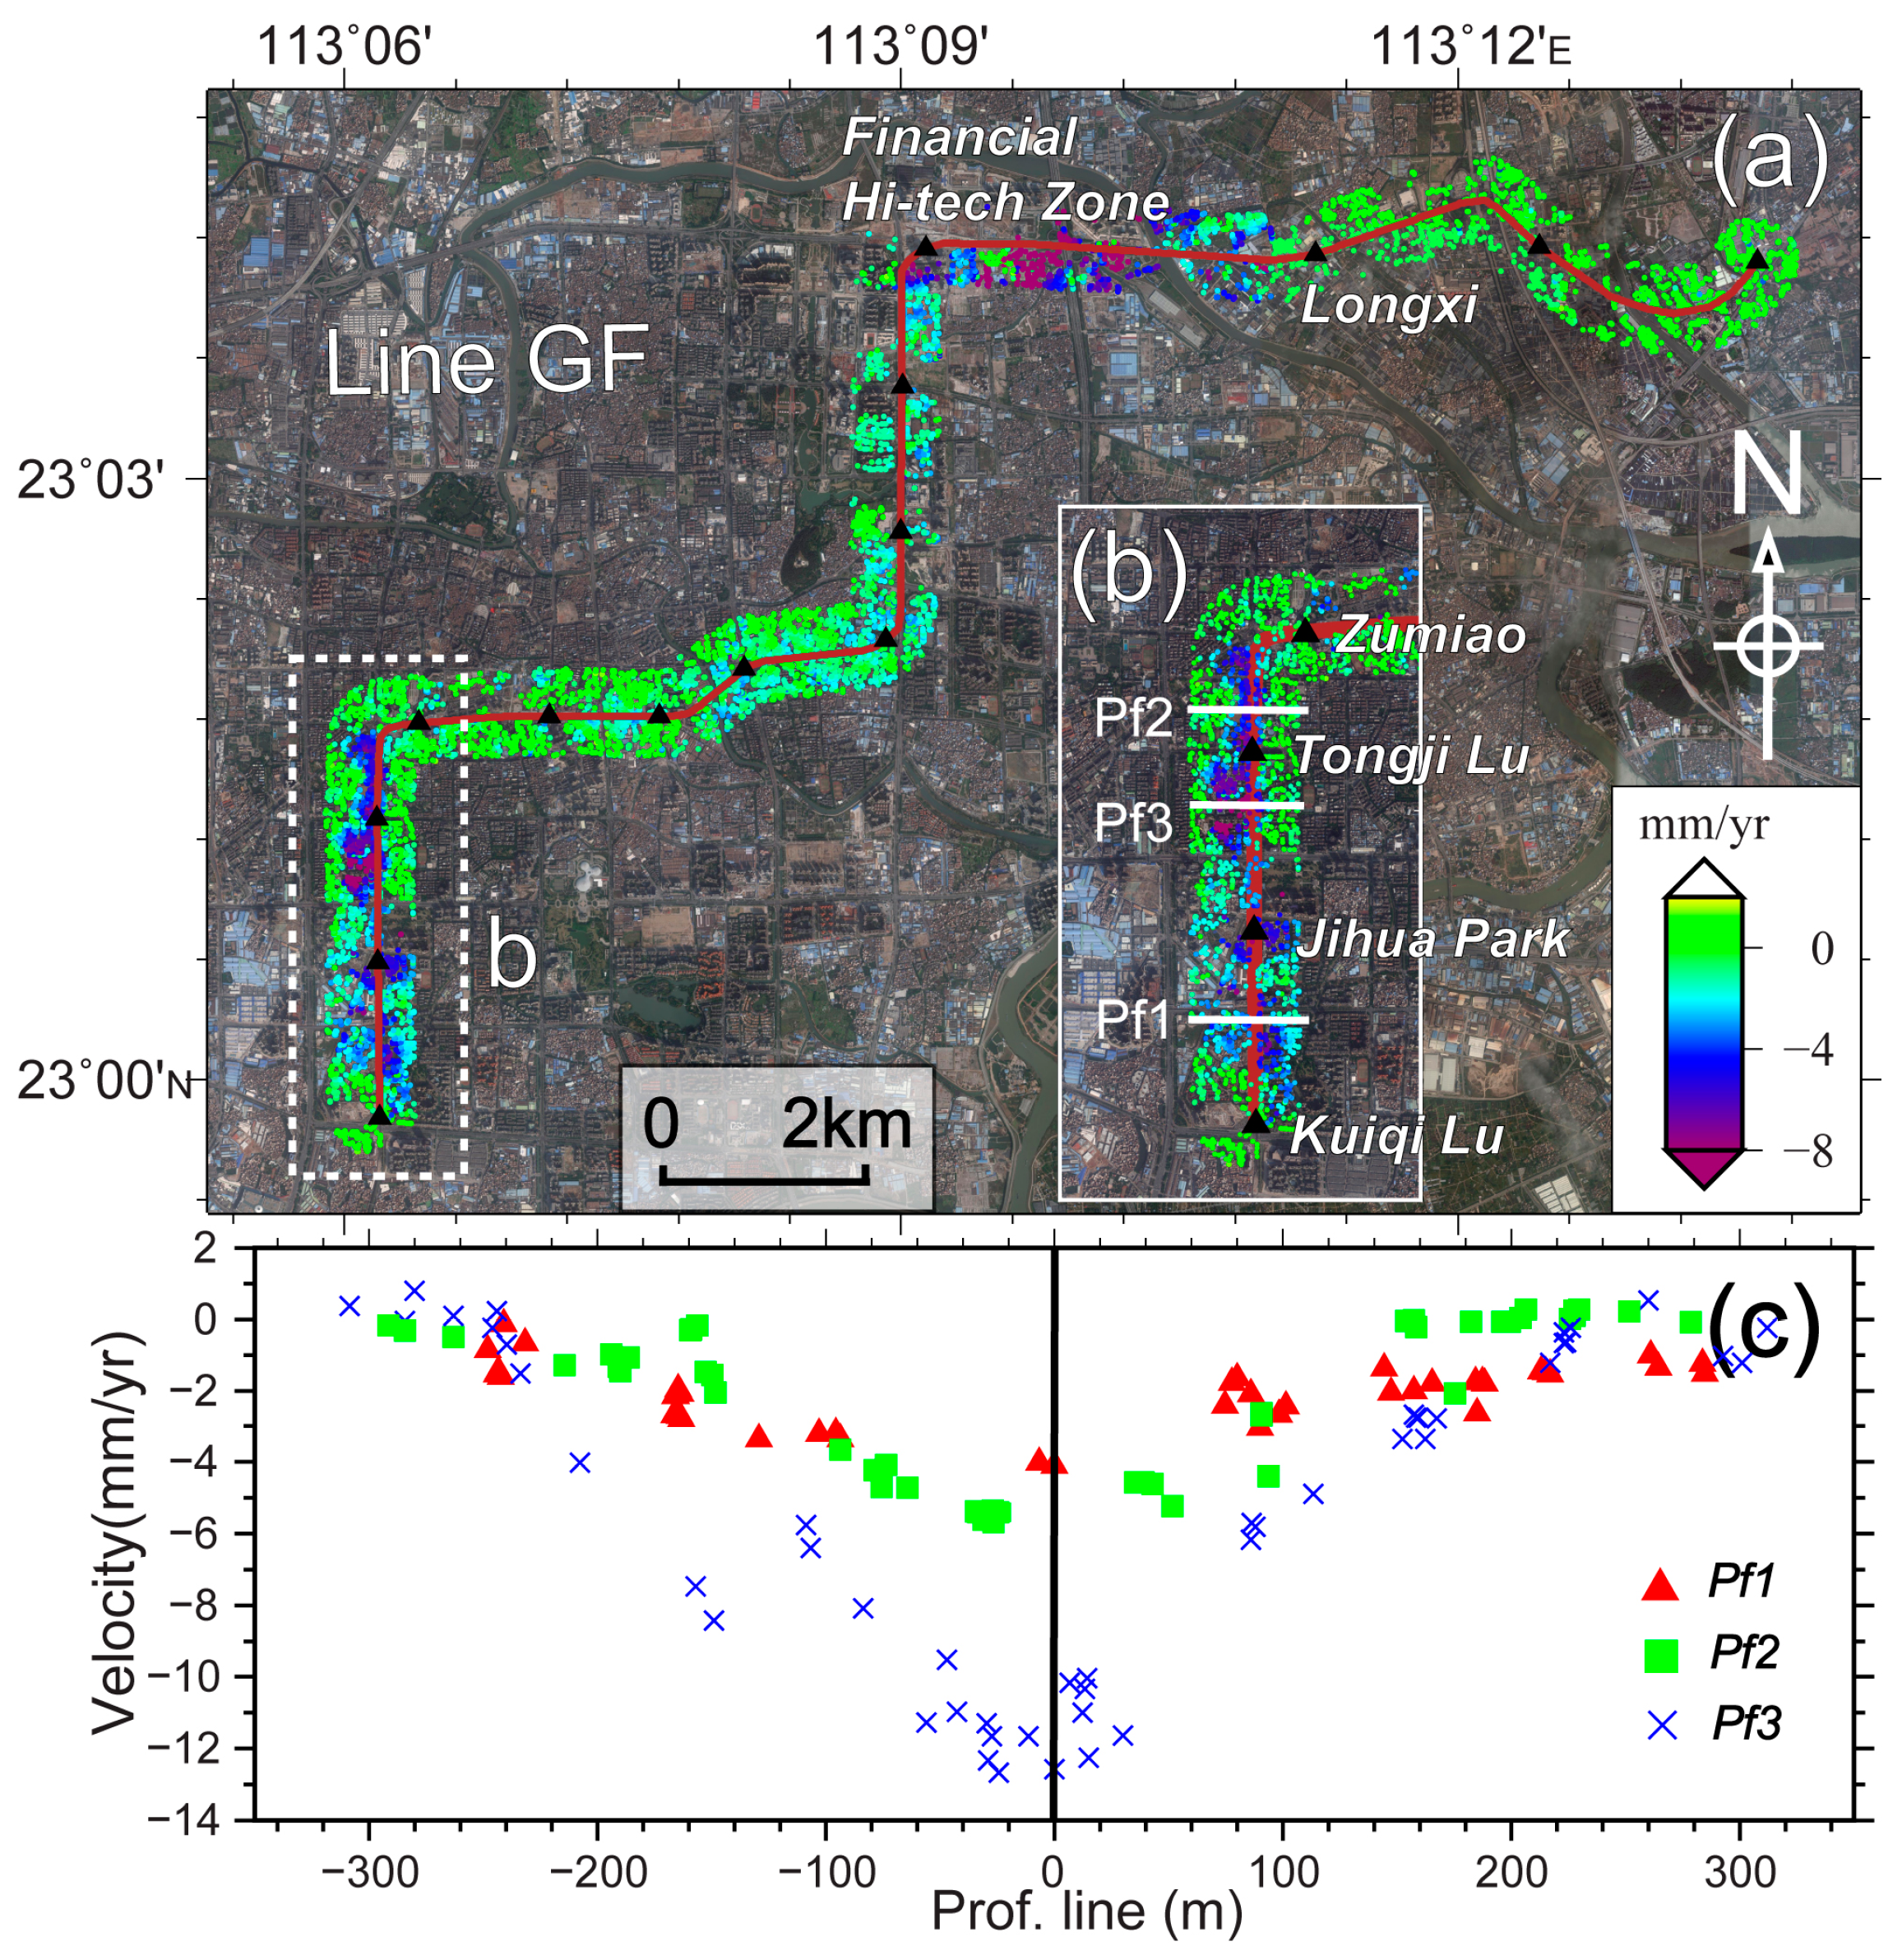
3.4. Line GuangFo (Line GF)
4. Tunneling-Induced Ground Subsidence Modeling
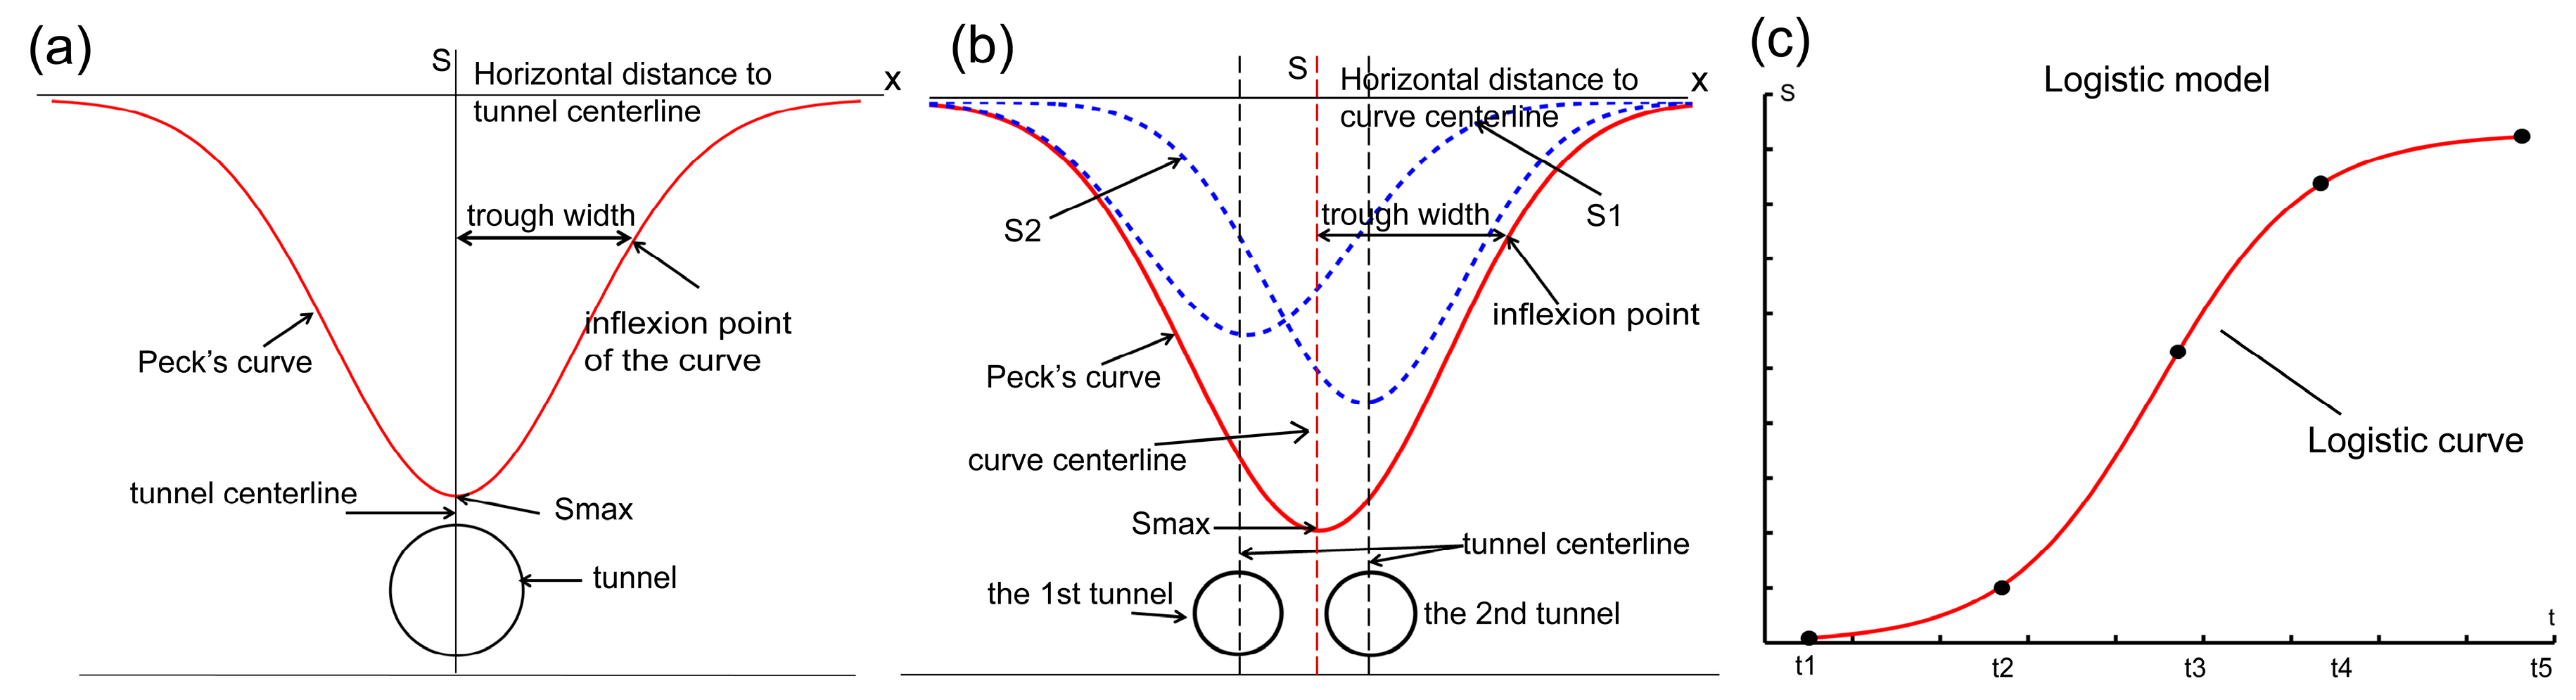
4.1. Peck’s Formula and the Logistic Time Model
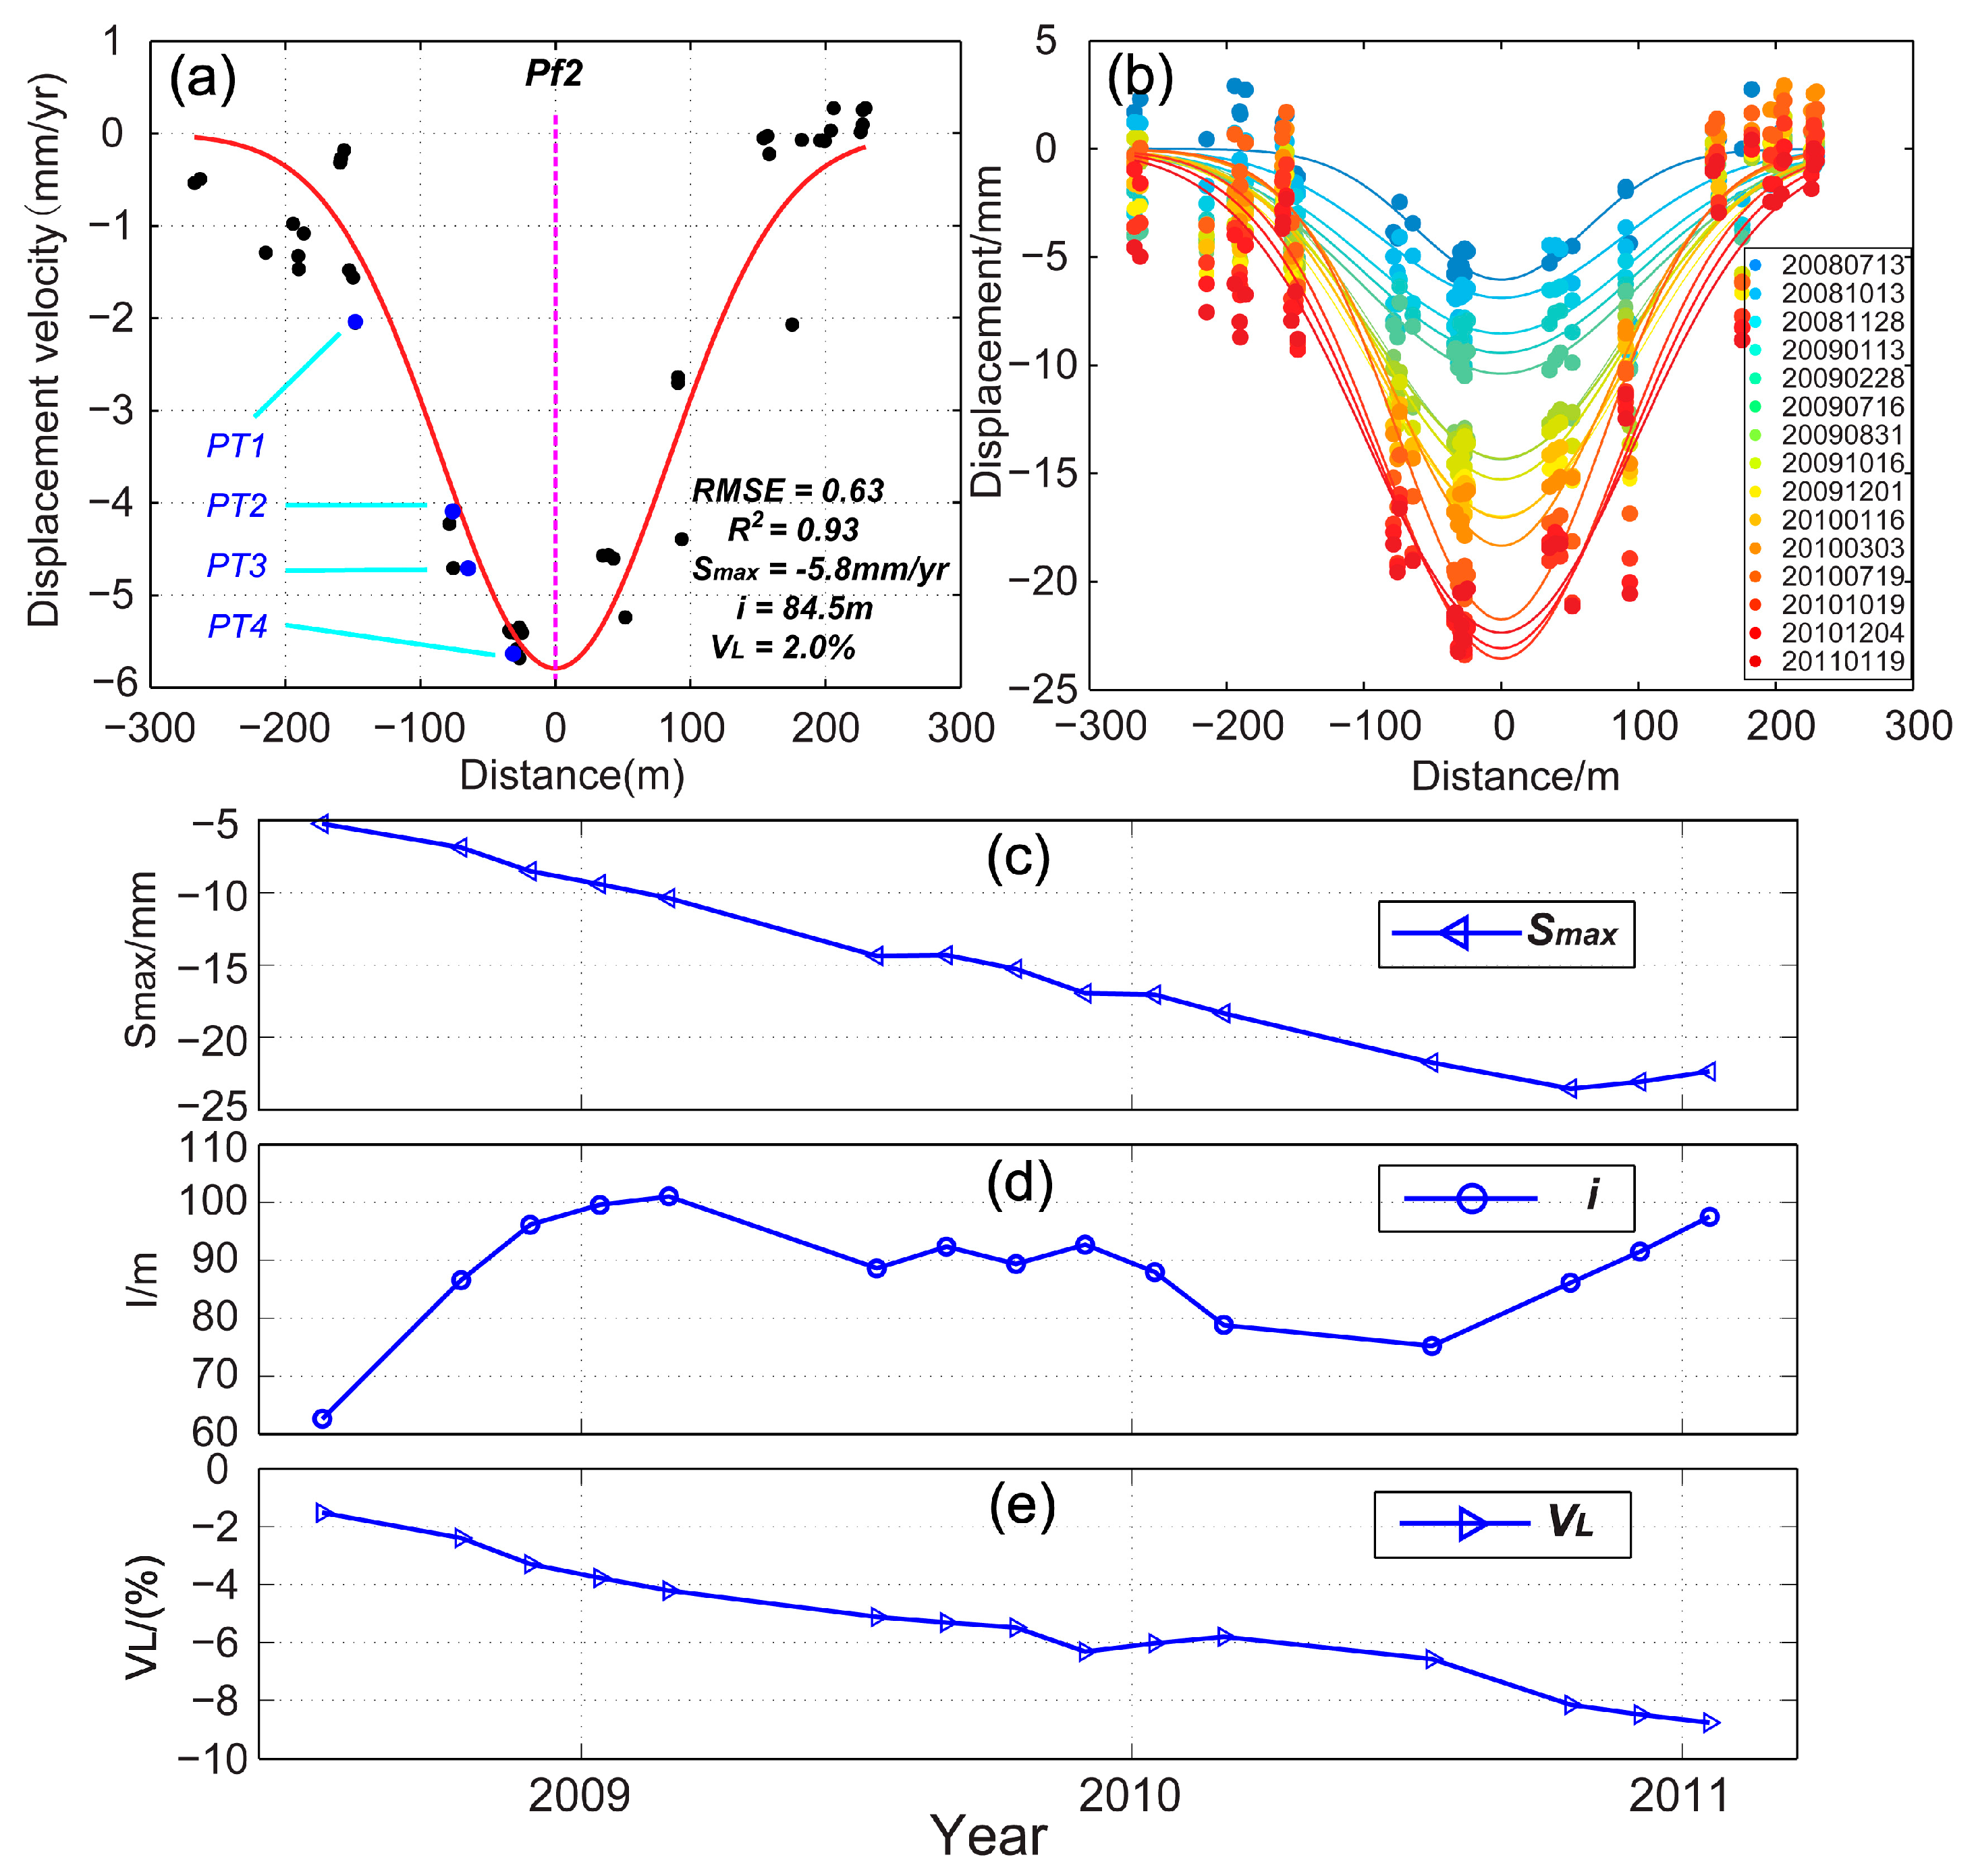
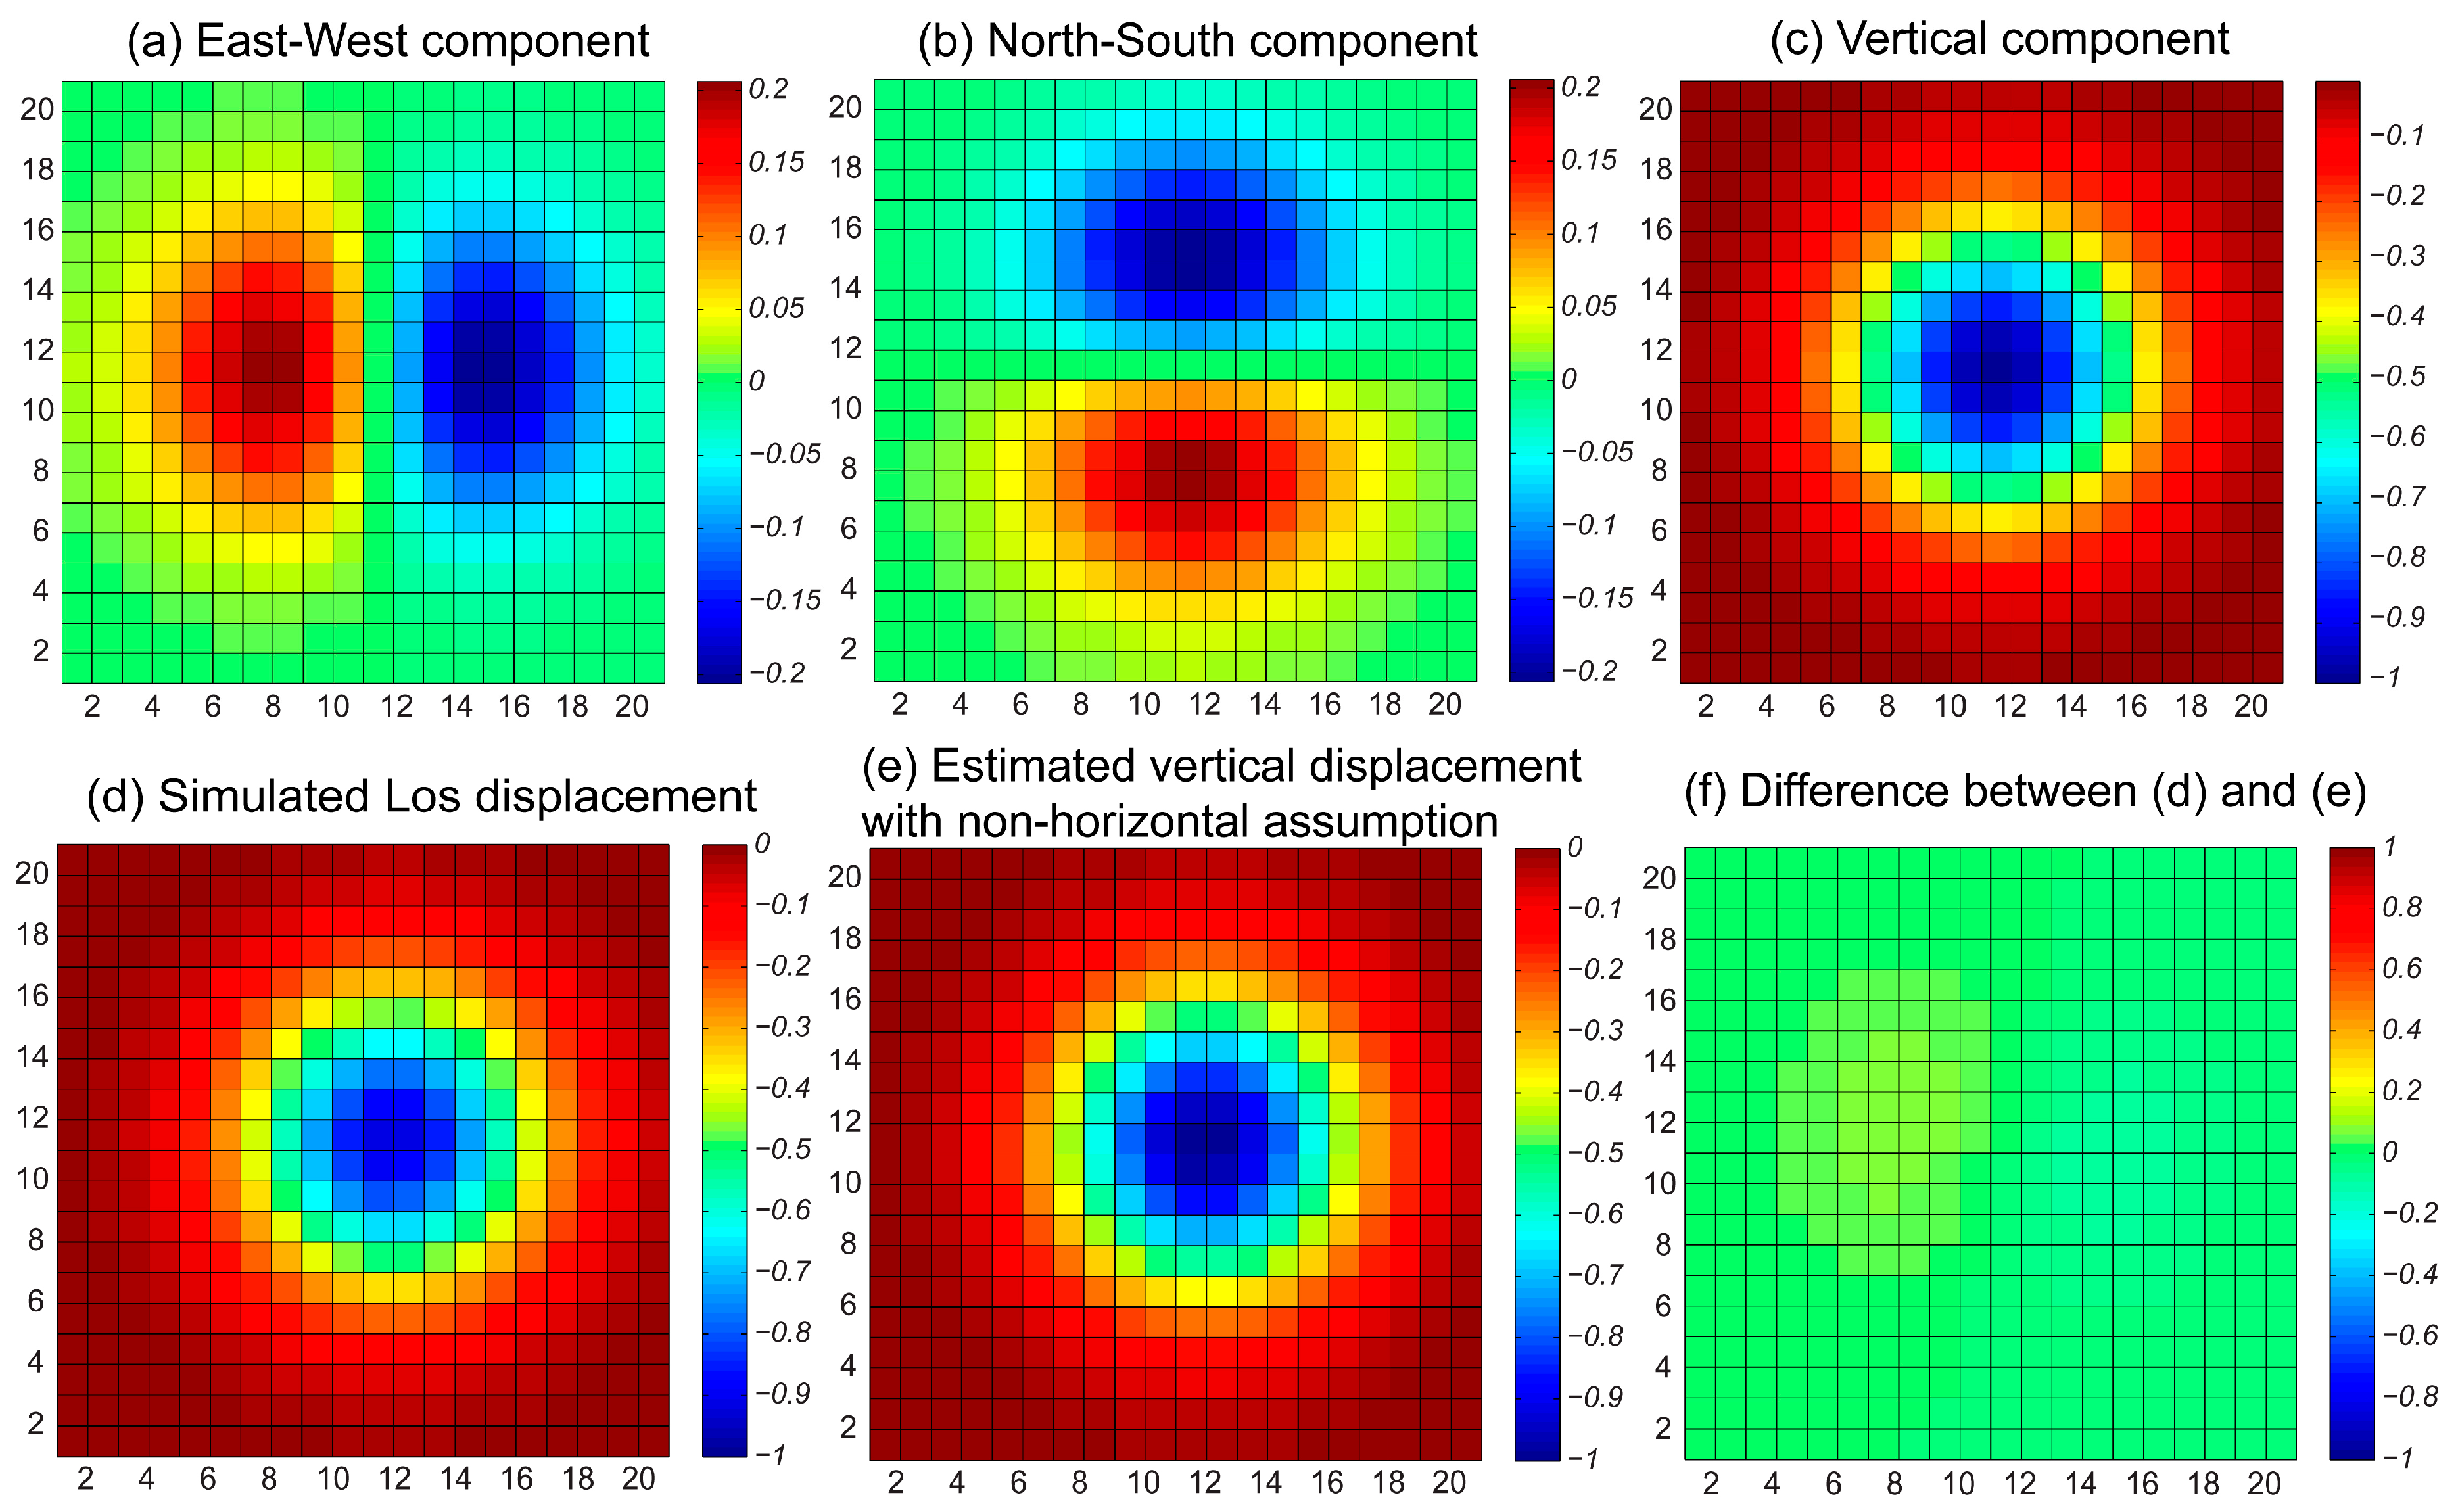
4.2. Spatial Variation of the Settlement Trough
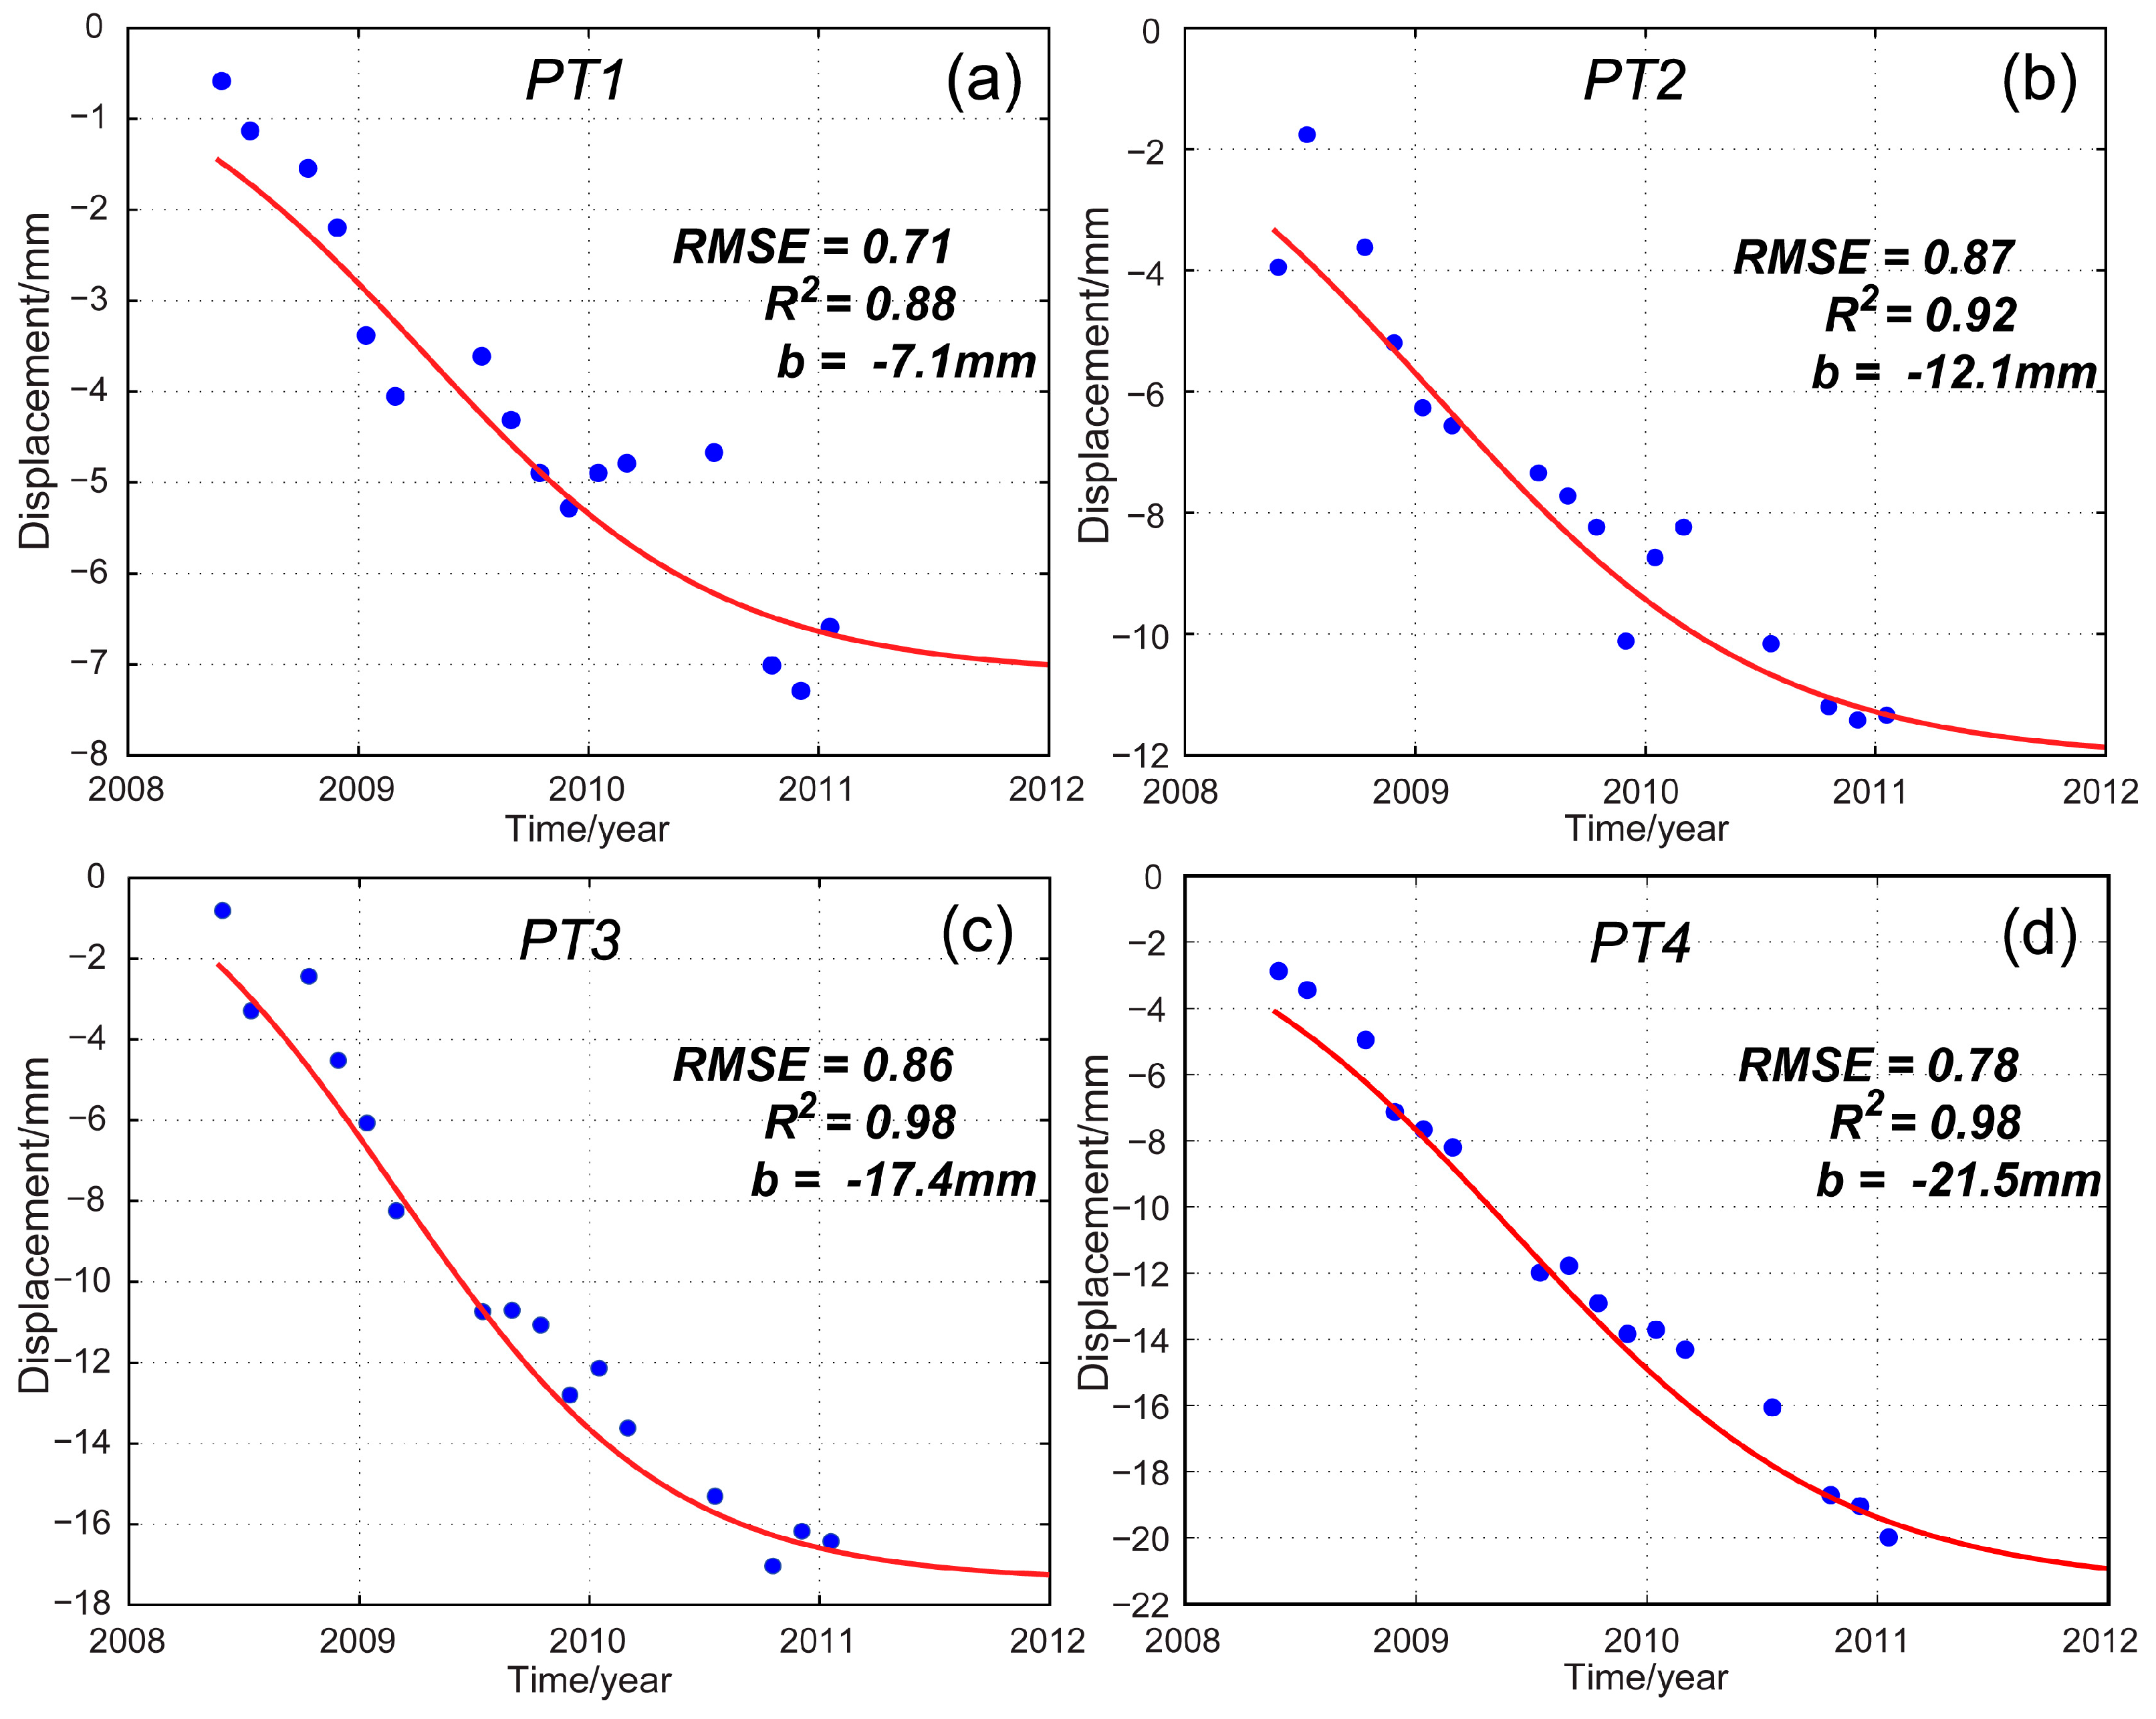
4.3. Temporal Variation of PTs
5. Discussion
5.1. Subsidence along Subway Lines in Delta Areas
5.2. Ground Subsidence of Subway Network and Geological Conditions
5.3. Further Improvement of Subway Monitoring with InSAR
6. Conclusions
Acknowledgments
Author Contributions
Conflicts of Interest
Abbreviations
| ASAR | Advanced Synthetic Aperture Radar |
| ENVISAT | Environmental Satellite |
| PALSAR | Phased Array type L-band Synthetic Aperture Radar |
| ALOS | Advanced Land Observation Satellite |
| IPTA | Interferometric Point Target Analysis |
| DEM | Digital Elevation Model |
| SAR | Synthetic Aperture Radar |
| LOS | Line-Of-Sight |
| No. | Number |
| InSAR | Interferometric Synthetic Aperture Radar |
| PS-InSAR | Persistent Scatterer Interferometric Synthetic Aperture Radar |
| PT | Point Target |
| SRTM | Shuttle Radar Topography Mission |
| APM | Zhujiang New Town automated people mover system |
| GF | GuangFo |
| Pf | Profile+A11B6A12:B17B11:B17 |
Appendix A


| No. | SAR Sensor | Acquisition Date | Perp_B (m) | Temp_B (day) | SAR Sensor | Acquisition Date | Perp_B (m) | Temp_B (day) |
|---|---|---|---|---|---|---|---|---|
| 1 | ASAR | 2007/04/23 | −63.941 | −525 | PALSAR | 2007/07/11 | −109.624 | −920 |
| 2 | ASAR | 2007/05/28 | −20.586 | −490 | PALSAR | 2007/08/26 | 117.551 | −874 |
| 3 | ASAR | 2007/07/02 | 201.324 | −455 | PALSAR | 2007/10/11 | 320.738 | −828 |
| 4 | ASAR | 2007/08/06 | 359.937 | −420 | PALSAR | 2008/01/11 | 642.339 | −736 |
| 5 | ASAR | 2007/09/10 | 428.338 | −385 | PALSAR | 2008/05/28 | 1044.648 | −598 |
| 6 | ASAR | 2007/10/15 | 223.502 | −350 | PALSAR | 2008/07/13 | −893.790 | −552 |
| 7 | ASAR | 2007/11/19 | 272.394 | −315 | PALSAR | 2008/10/13 | −1747.478 | −-460 |
| 8 | ASAR | 2008/05/12 | 82.061 | −140 | PALSAR | 2008/11/28 | −1547.674 | −414 |
| 9 | ASAR | 2008/06/16 | −16.821 | −105 | PALSAR | 2009/01/13 | −1247.589 | −368 |
| 10 | ASAR | 2008/07/21 | 52.467 | −70 | PALSAR | 2009/02/28 | −1251.581 | −322 |
| 11 | ASAR | 2008/08/25 | 464.493 | −35 | PALSAR | 2009/07/16 | −595.590 | −184 |
| 12 | ASAR | 2008/09/29 | 0 | 0 | PALSAR | 2009/08/31 | −305.935 | −138 |
| 13 | ASAR | 2008/11/03 | 427.851 | 35 | PALSAR | 2009/10/16 | −178.100 | −92 |
| 14 | ASAR | 2008/12/08 | −86.414 | 70 | PALSAR | 2009/12/01 | −243.643 | −46 |
| 15 | ASAR | 2009/01/12 | 249.802 | 105 | PALSAR | 2010/01/16 | 0 | 0 |
| 16 | ASAR | 2009/04/27 | −115.195 | 210 | PALSAR | 2010/03/03 | 341.146 | 46 |
| 17 | ASAR | 2009/06/01 | −96.704 | 245 | PALSAR | 2010/07/19 | 595.503 | 184 |
| 18 | ASAR | 2009/08/10 | 322.399 | 315 | PALSAR | 2010/10/19 | 871.944 | 276 |
| 19 | ASAR | 2009/09/14 | 263.386 | 350 | PALSAR | 2010/12/04 | 836.577 | 322 |
| 20 | ASAR | 2009/10/19 | 188.442 | 385 | PALSAR | 2011/01/19 | 1156.677 | 368 |
| 21 | ASAR | 2009/11/23 | 203.992 | 420 | ||||
| 22 | ASAR | 2009/12/28 | −85.578 | 455 | ||||
| 23 | ASAR | 2010/02/01 | 210.405 | 490 | ||||
| 24 | ASAR | 2010/03/08 | 234.188 | 525 | ||||
| 25 | ASAR | 2010/04/12 | 393.560 | 560 | ||||
| 26 | ASAR | 2010/05/17 | 18.411 | 595 | ||||
| 27 | ASAR | 2010/06/21 | 279.802 | 630 | ||||
| 28 | ASAR | 2010/07/26 | 87.535 | 665 | ||||
| 29 | ASAR | 2010/0810 | 374.686 | 700 |
Appendix B
References
- Kontogianni, V.A.; Stiros, S.C. Induced deformation during tunnel excavation: Evidence from geodetic monitoring. Eng. Geol. 2005, 79, 115–126. [Google Scholar] [CrossRef]
- Kavvadas, M.J. Monitoring ground deformation in tunneling: Current practice in transportation tunnels. Eng. Geol. 2005, 79, 93–113. [Google Scholar] [CrossRef]
- Ma, L.; Ding, L.; Luo, H. Non-linear description of ground settlement over twin tunnels in soil. Tunn. Undergr. Space Technol. 2014, 42, 144–151. [Google Scholar] [CrossRef]
- Wu, J.C.; Hu, F.M. Monitoring ground subsidence along the Shanghai maglev zone using TerraSAR-X images. IEEE Geosci. Remote Sens. Lett. 2017, 14, 117–121. [Google Scholar] [CrossRef]
- Massonnet, D.; Rossi, M.; Carmona, C.; Adragna, F.; Peltzer, G.; Feigl, K. The displacement field of the Landers earthquake mapped by radar interferometry. Nature 1993, 364, 138–142. [Google Scholar] [CrossRef]
- Ferretti, A.; Prati, C.; Rocca, F.L. Permanent Scatterers in SAR Interferometry. IEEE Trans. Geosci. Remote Sens. 2001, 39, 8–20. [Google Scholar] [CrossRef]
- Berardino, P.; Fornaro, G.; Lanari, R.; Sansosti, E. A new algorithm for surface deformation monitoring based on small baseline differential SAR Interferograms. IEEE Trans. Geosci. Remote Sens. 2002, 40, 2375–2383. [Google Scholar] [CrossRef]
- Ding, C.; Feng, G.; Li, Z.; Shan, X.; Du, Y.; Wang, H. Spatio-temporal error sources analysis and accuracy improvement in Landsat 8 image ground displacement measurements. Remote Sens. 2016, 8, 937. [Google Scholar] [CrossRef]
- Feng, G.; Li, Z.; Xu, B.; Shan, X.; Zhang, L.; Zhu, J. Coseismic deformation of the 2015 Mw 6.4 Pishan, China, earthquake estimated from Sentinel-1a and ALOS2 data. Seismol. Res. Lett. 2016, 87, 800–806. [Google Scholar] [CrossRef]
- Hu, J.; Ding, X.L.; Zhang, L.; Sun, Q.; Li, Z.W.; Zhu, J.J.; Lu, Z. Estimation of 3-D surface displacement based on InSAR and deformation modeling. IEEE Trans. Geosci. Remote Sens. 2017, 55, 2007–2016. [Google Scholar] [CrossRef]
- Hu, J.; Li, Z.W.; Ding, X.L.; Zhu, J.J.; Zhang, L.; Sun, Q. Resolving three-dimensional surface displacements from InSAR measurements: A review. Earth-Sci. Rev. 2014, 133, 1–17. [Google Scholar] [CrossRef]
- Fu, H.; Zhu, J.; Wang, C.; Wang, H.; Zhao, R. Underlying topography estimation over forest areas using high-resolution P-band single-baseline PolInSAR data. Remote Sens. 2017, 9, 363. [Google Scholar] [CrossRef]
- Zhao, R.; Li, Z.W.; Feng, G.C.; Wang, Q.J.; Hu, J. Monitoring surface deformation over permafrost with an improved SBAS-InSAR algorithm: With emphasis on climatic factors modeling. Remote Sens. Environ. 2016, 184, 276–287. [Google Scholar] [CrossRef]
- Du, Y.N.; Zhang, L.; Feng, G.C.; Lu, Z.; Sun, Q. On the accuracy of topographic residuals retrieved by MTInSAR. IEEE Trans. Geosci. Remote Sens. 2017, 99, 1–13. [Google Scholar] [CrossRef]
- Yang, Z.F.; Li, Z.W.; Zhu, J.J.; Preusse, A.; Yi, H.W.; Wang, Y.J.; Papst, M. An extension of the insar-based probability integral method and its application for predicting 3-D mining-induced displacements under different extraction conditions. IEEE Trans. Geosci. Remote Sens. 2017, 99, 1–11. [Google Scholar] [CrossRef]
- Zhao, Q.; Lin, H.; Jiang, L.M.; Chen, F.L.; Cheng, S.L. A study of ground deformation in the Guangzhou urban area with Persistent Scatterer Interferometry. Sensors 2009, 9, 503–518. [Google Scholar] [CrossRef] [PubMed]
- Perissin, D.; Wang, Z.; Lin, H. Shanghai subway tunnels and highways monitoring through Cosmo-Skymed Persistent Scatterers. ISPRS-J. Photogramm. Remote Sens. 2012, 73, 58–67. [Google Scholar]
- Xu, B.; Feng, G.C.; Li, Z.W.; Wang, Q.J.; Wang, C.C.; Xie, R.A. Coastal subsidence monitoring associated with land reclamation using the Point Target Based SBAS-InSAR method: A case study of Shenzhen, China. Remote Sens. 2016, 8, 652. [Google Scholar] [CrossRef]
- Chen, W.F.; Gong, H.L.; Chen, B.B.; Liu, K.S.; Gao, M.; Zhou, C.F. Spatiotemporal evolution of land subsidence around a subway using insar time-series and the entropy method. GISci. Remote Sens. 2016, 54, 78–94. [Google Scholar] [CrossRef]
- Falorni, G.; Iannacone, J.P. Signature of Tunneling-Induced Ground Deformation in Urban Areas Revealed by Time Series Analysis. In Proceedings of the Vancouver TAC, Vancouver, BC, Canada, 26–28 October 2014. [Google Scholar]
- García Robles, J.; Salvá Gomar, B.; Arnaud, A. Non-Linear Motion Detection using SAR Images in Urban Tunnelling. In Proceedings of the ITA World Tunnel Congress, Dubrovnik, Croatia, 22–28 May 2015. [Google Scholar]
- Barla, G.; Tamburini, A.; Del Conte, S.; Giannico, C. Insar monitoring of tunnel induced ground movements. Geomech. Tunn. 2016, 9, 15–22. [Google Scholar] [CrossRef]
- Peck, R.B. Deep excavations and tunneling in soft ground. In Proceedings of the 7th International Conference on Soil Mechanics and Foundation Engineering, Mexico City, Mexico, 22–23 October 1969; pp. 225–290. [Google Scholar]
- O’Reilly, M.P.; New, B.M. Settlements above tunnels in the United Kingdom—Their magnitude and prediction. In Proceedings of the Tunnelling, Institute of Mining Metallurgy, London, UK, 7–11 June 1982; pp. 173–181. [Google Scholar]
- Xu, H.Z.; Shi, B.; Li, X.H. Logistic growth model and its applicability for predicting settlement during the whole process. Rock Soil Mech. 2005, 26, 387–391. [Google Scholar]
- Zhang, W.Z.; Zou, Y.F.; Ren, X.F. Research on logistic model in forecasting subsidence single-point during mining. J. Min. Saf. Eng. 2009, 26, 486–489. [Google Scholar]
- Mo, Y.; Yue, H.; Hu, B.; Wu, B. A study of logistic equation applied to predicting ground settlement induced by subway tunneling work. Chin. J. Eng. Geophys. 2010, 7, 115–119. [Google Scholar]
- Yang, Z.F.; Li, Z.W.; Zhu, J.J.; Yi, H.W.; Hu, J.; Feng, G.C. Deriving Dynamic Subsidence of Coal Mining Areas Using InSAR and Logistic Model. Remote Sens. 2017, 9, 125. [Google Scholar] [CrossRef]
- Chen, F.; Lin, H.; Zhang, Y.; Lu, Z. Ground subsidence geo-hazards induced by rapid urbanization: Implications from InSAR observation and geological analysis. Nat. Hazards Earth Syst. Sci. 2012, 12, 935–942. [Google Scholar] [CrossRef] [Green Version]
- Ao, M.S.; Wang, C.C.; Xie, R.; Zhang, X.; Hu, J.; Du, Y.N.; Li, Z.; Zhu, J.; Dai, W.; Kuang, C. Monitoring the land subsidence with Persistent Scatterer Interferometry in Nansha district, Guangdong, China. Nat. Hazards 2015, 75, 2947–2964. [Google Scholar] [CrossRef]
- Liao, H.Y. Technology for Shield Tunnel in Mixed Face Ground Conditions: Study & Practice in Shield Tunneling Projects of Guangzhou Metro; China Architecture & Building Press: Beijing, China, 2012. (In Chinese) [Google Scholar]
- Werner, C.; Wegmüller, U.; Strozzi, T.; Wiesmann, A. Interferometric Point Target Analysis for deformation mapping. In Proceedings of the 2003 IEEE International Geoscience and Remote Sensing Symposium, Amherst, MA, USA, 21–25 July 2003. [Google Scholar]
- Stramondo, S.; Bozzano, F.; Marra, F.; Wegmuller, U.; Cinti, F.R.; Moro, M.; Saroli, M. Subsidence induced by urbanisation in the city of Rome detected by advanced InSAR technique and geotechnical investigations. Remote Sens. Environ. 2008, 112, 3160–3172. [Google Scholar] [CrossRef]
- Jiang, H.; Feng, G.; Wang, T.; Bürgmann, R. Toward full exploitation of coherent and incoherent information in Sentinel—1 tops data for retrieving surface displacement: Application to the 2016 Kumamoto (Japan) earthquake. Geophys. Res. Lett. 2017, 44, 1758–1767. [Google Scholar] [CrossRef]
- Wang, L.; Gao, H.; Feng, G. InSAR and GPS inversion for source parameters of the 2016 mw6.4 Meinong, Taiwan earthquake. Chin. J. Geophys. 2017, 60, 2578–2588. [Google Scholar]
- Feng, G.; Jónsson, S.; Klinger, Y. Which fault segments ruptured in the 2008 Wenchuan earthquake and which did not? new evidence from near—Fault 3d surface displacements derived from SAR image offsets. Bull. Seismol. Soc. Am. 2017, 107, 1–16. [Google Scholar] [CrossRef]
- Zhang, G.; Shan, X.; Zhang, Y.; Hetland, E.; Qu, C.; Feng, G. Blind thrust rupture of the 2015 m w, 6.4 pishan earthquake in the northwest Tibetan plateau by joint inversion of insar and seismic data. J. Asian Earth Sci. 2016, 132, 118–128. [Google Scholar] [CrossRef]
- Huang, J.M.; Guo, Y.; Hu, R.Q.; Zhou, Z.Y. Analysis of land subsidence in Jinshazhou area, Guangzhou city. Chin. J. Geol. Hazard Cont. 2013, 24, 61–67. (In Chinese) [Google Scholar]
- Shirlaw, J.N. Observed and calculated pore pressures and deformations induced by an earth balance shield: Discussion. Can. Geotech. J. 2011, 32, 181–189. [Google Scholar] [CrossRef]
- Suwansawat, S.; Einstein, H.H. Describing settlement troughs over twin tunnels using a superposition technique. J. Geotech. Geoenviron. Eng. 2007, 133, 445–468. [Google Scholar] [CrossRef]
- Shen, S.L.; Wu, H.N.; Cui, Y.J.; Yin, Z.Y. Long-term settlement behaviour of metro tunnels in the soft deposits of Shanghai. Tunn. Undergr. Space Technol. 2014, 40, 309–323. [Google Scholar] [CrossRef]
- Ge, D.Q.; Zhang, L.; Li, M.; Liu, B.; Wang, Y. Beijing subway tunnelings and high-speed railway subsidence monitoring with PSInSAR and TerraSAR-X data. In Proceedings of the 2016 IEEE International Geoscience and Remote Sensing Symposium, Beijing, China, 10–15 July 2016. [Google Scholar]
- Duan, G.Y.; Gong, H.L.; Liu, H.; Zhang, Y.; Chen, B.B.; Lei, K.C. Monitoring and analysis of land subsidence along Beijing-Tianjin inter-city railway. J. Indian Soc. Remote Sens. 2016, 44, 1–17. [Google Scholar]
- Batuhan, O.; Timothy, H.D.; Shimon, W.; Enrique, C.C.; Jiang, Y. Mexico City subsidence observed with Persistent Scatterer InSAR. Int. J. Appl. Earth Obs. Geoinf. 2011, 13, 1–12. [Google Scholar]
- Yan, Y.J.; Doin, M.P.; Lopez-Quiroz, P.; Tupin, F.; Fruneau, B.; Pinel, V. Mexico City subsidence measured by InSAR time series: Joint analysis using PS and SBAS approaches. IEEE J. Sel. Top. Appl. Earth Obs. Remote Sens. 2012, 5, 1312–1326. [Google Scholar] [CrossRef] [Green Version]
- Du, Y.N.; Feng, G.C.; Peng, X.; Li, Z.W. Subsidence Evolution of the Leizhou Peninsula, China, Based on InSAR Observation from 1992 to 2010. Appl. Sci. 2017, 7, 466. [Google Scholar] [CrossRef]
- Ren, D.J.; Shen, S.L.; Cheng, W.C.; Zhang, N.; Wang, Z.F. Geological formation and geo-hazards during subway construction in Guangzhou. Environ. Earth Sci. 2016, 75, 1–14. [Google Scholar] [CrossRef]
- Liu, J.F.; Qi, T.Y.; Wu, Z.R. Analysis of ground movement due to metro station driven with enlarging shield tunnels under building and its parameter sensitivity analysis. Tunn. Undergr. Space Technol. 2012, 28, 287–296. [Google Scholar] [CrossRef]
- Cui, Z.D.; Tan, J. Analysis of long-term settlements of Shanghai subway line 1 based on the in situ monitoring data. Nat. Hazards. 2015, 75, 465–472. [Google Scholar] [CrossRef]
- Attewell, P.B.; Farmer, I.W. Ground deformations resulting from shield tunneling in London clay. Can. Geotech. J. 1974, 11, 380–395. [Google Scholar] [CrossRef]
- Lei, M.; Wang, Q.; Liu, X.; Xu, B.; Zhang, H. Influence of ocean tidal loading on InSAR offshore areas deformation monitoring. Geod. Geodyn. 2017, 8, 70–76. [Google Scholar] [CrossRef]


| Metro Segment | R2 | RMSE | Smax/(mm/year) | i/(m) | VL/(%) |
|---|---|---|---|---|---|
| Kuiqi Lu to Jihua Park | 0.73 | 0.54 | −3.9 | 160.2 | 2.5% |
| Tongji Lu to Zu Miao | 0.86 | 0.79 | −5.0 | 106.7 | 2.2 |
| 0.83 | 0.76 | −4.8 | 79.8 | 1.6 | |
| 0.95 | 0.43 | −4.6 | 108.2 | 2.0 | |
| 0.88 | 1.04 | −8.0 | 65.1 | 2.1 | |
| 0.75 | 1.08 | −6.0 | 77.0 | 1.9 | |
| 0.77 | 1.08 | −6.2 | 74.9 | 1.9 | |
| 0.93 | 0.63 | −5.8 | 84.5 | 2.0 | |
| 0.92 | 0.62 | −5.5 | 95.1 | 2.1 |
© 2017 by the authors. Licensee MDPI, Basel, Switzerland. This article is an open access article distributed under the terms and conditions of the Creative Commons Attribution (CC BY) license (http://creativecommons.org/licenses/by/4.0/).
Share and Cite
Wang, H.; Feng, G.; Xu, B.; Yu, Y.; Li, Z.; Du, Y.; Zhu, J. Deriving Spatio-Temporal Development of Ground Subsidence Due to Subway Construction and Operation in Delta Regions with PS-InSAR Data: A Case Study in Guangzhou, China. Remote Sens. 2017, 9, 1004. https://doi.org/10.3390/rs9101004
Wang H, Feng G, Xu B, Yu Y, Li Z, Du Y, Zhu J. Deriving Spatio-Temporal Development of Ground Subsidence Due to Subway Construction and Operation in Delta Regions with PS-InSAR Data: A Case Study in Guangzhou, China. Remote Sensing. 2017; 9(10):1004. https://doi.org/10.3390/rs9101004
Chicago/Turabian StyleWang, Huiqiang, Guangcai Feng, Bing Xu, Yongping Yu, Zhiwei Li, Yanan Du, and Jianjun Zhu. 2017. "Deriving Spatio-Temporal Development of Ground Subsidence Due to Subway Construction and Operation in Delta Regions with PS-InSAR Data: A Case Study in Guangzhou, China" Remote Sensing 9, no. 10: 1004. https://doi.org/10.3390/rs9101004