4.1. Validation of the IceMap250 Algorithm
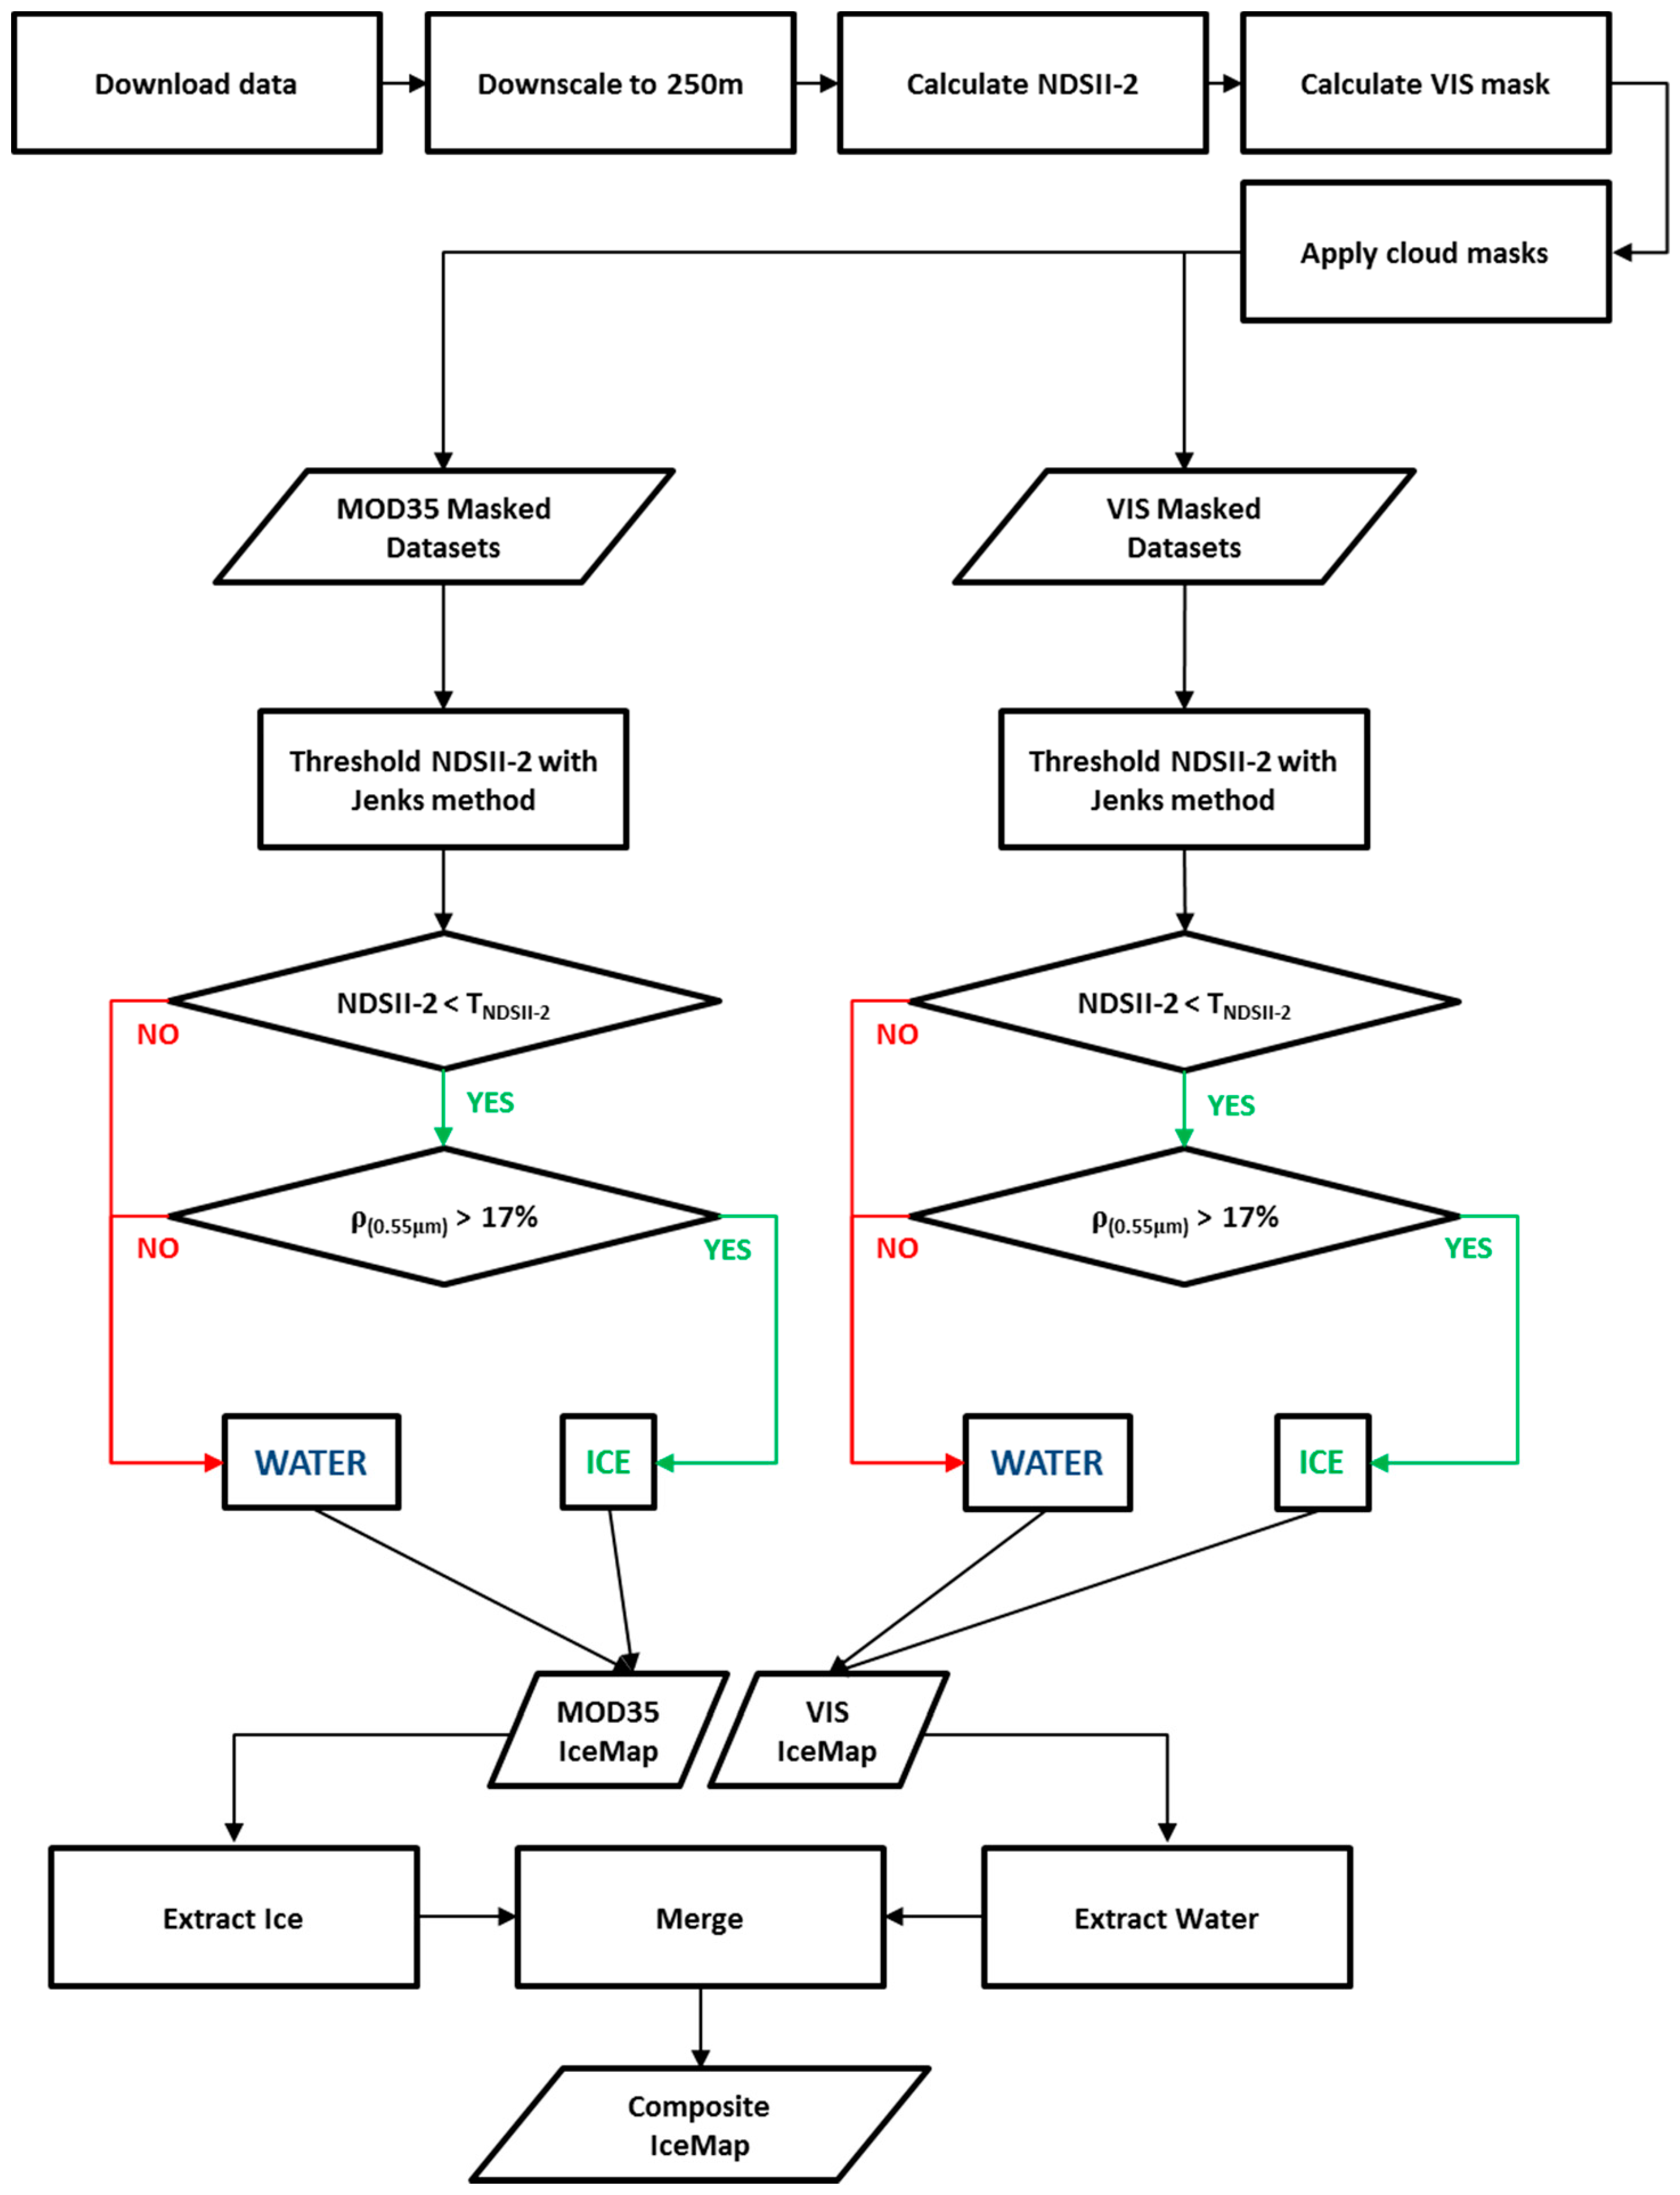
The IceMap250 algorithm automatically generates a 250 m spatial resolution ice presence map for every scene of MODIS data available over a selected territory. After processing all available scenes for a single date, for either Terra or Aqua, the algorithm builds a composite of the ice maps to obtain a unique daily ice map product.
Validation of the IceMap250 products was achieved using datasets of imagery from three important periods of the sea ice regime, as described in the
Section 2.2.1 of this document. Validation points, common to all evaluated products (
Table 3), were sampled to cumulate 500 points for each period. To gather the points for validation, a regularly spaced grid at 25 km was generated over the study domain from which points that were common to the MOD29 product and to the IceMap250 maps generated from both the MOD35 and VIS masks were kept. From these points, 500 points were randomly selected for each period for a total of 1500 validation points. Ground truth was generated manually by photo-interpretation of each point, for all three ice regime periods, based on the 250 m downscaled true color images. The validation points were selected from dates in 2013, 2015, and 2016 (see
Section 2.2.1), different than those used for the calibration points used in
Section 3.4.
The photo-interpretation process used is described as follows. The validation points for each scene of every ice regime period were scanned, one by one, to classify them as either ice or water. The classification for all points was performed by the same analyst for consistency. When such data was available, the classification was cross-validated using either a Landsat 7 ETM+ true color composite and/or RADARSAT-1 SAR imagery.
From these 1500 validation points, contingency tables were generated for every ice regime period to identify strengths and weaknesses of the different products. Kappa values [
54] were also calculated to give a general overview of the classification performance.
4.2. Validation of the Composite Maps: Assessment of Accuracy Using Contingency Tables
The stable period contingency table (
Table 4) shows that the main error source is the mislabeling of water as sea ice. The validation results clearly show that the main factor affecting the accuracy of the maps is the spatial resolution. Considering that openings in the ice cover tend to be straight, narrow features, such as leads, during this period, the error observed in 1 km resolution products such as MOD29 could be related simply to an inability to detect these features. Since the composite map merges information from both IceMap250 MOD35 and VIS maps, it will carry the kappa score of the highest scoring, since all products are compared on common points. However, the composite map has a larger coverage than the MOD35 product since it appends the water retrieved by the VIS product.
Algorithmic changes seem to have a small, non-significant impact on accuracy. The impact of the downscaling, on the other hand, seems to be positive, as we can see from the high kappa value obtained for the IceMap250 composite map. This result has to be interpreted with parsimony, as there are only a few areas of open water that were randomly selected for the validation points (also due to their rarity during stable cover). Considering these important facts, the high kappa value of the IceMap250 MOD35, VIS, and composite should be interpreted as a sign of relative accuracy, as only one error in classifying water as ice has a significant impact on the kappa due to the small number of water pixels. When looking at
Table 4, the reader should focus more on the overall accuracy than on the kappa value.
The melt period contingency table (
Table 5) shows that all of the algorithms achieve high performance discriminating sea ice and water in most situations, the kappa value consistently being greater than 88%. During this period, a higher spatial resolution seems to contribute to improving the results. The melt period is characterized by its generally low extent of cloud cover when compared to freeze-up, making it easier to accurately map sea ice distribution.
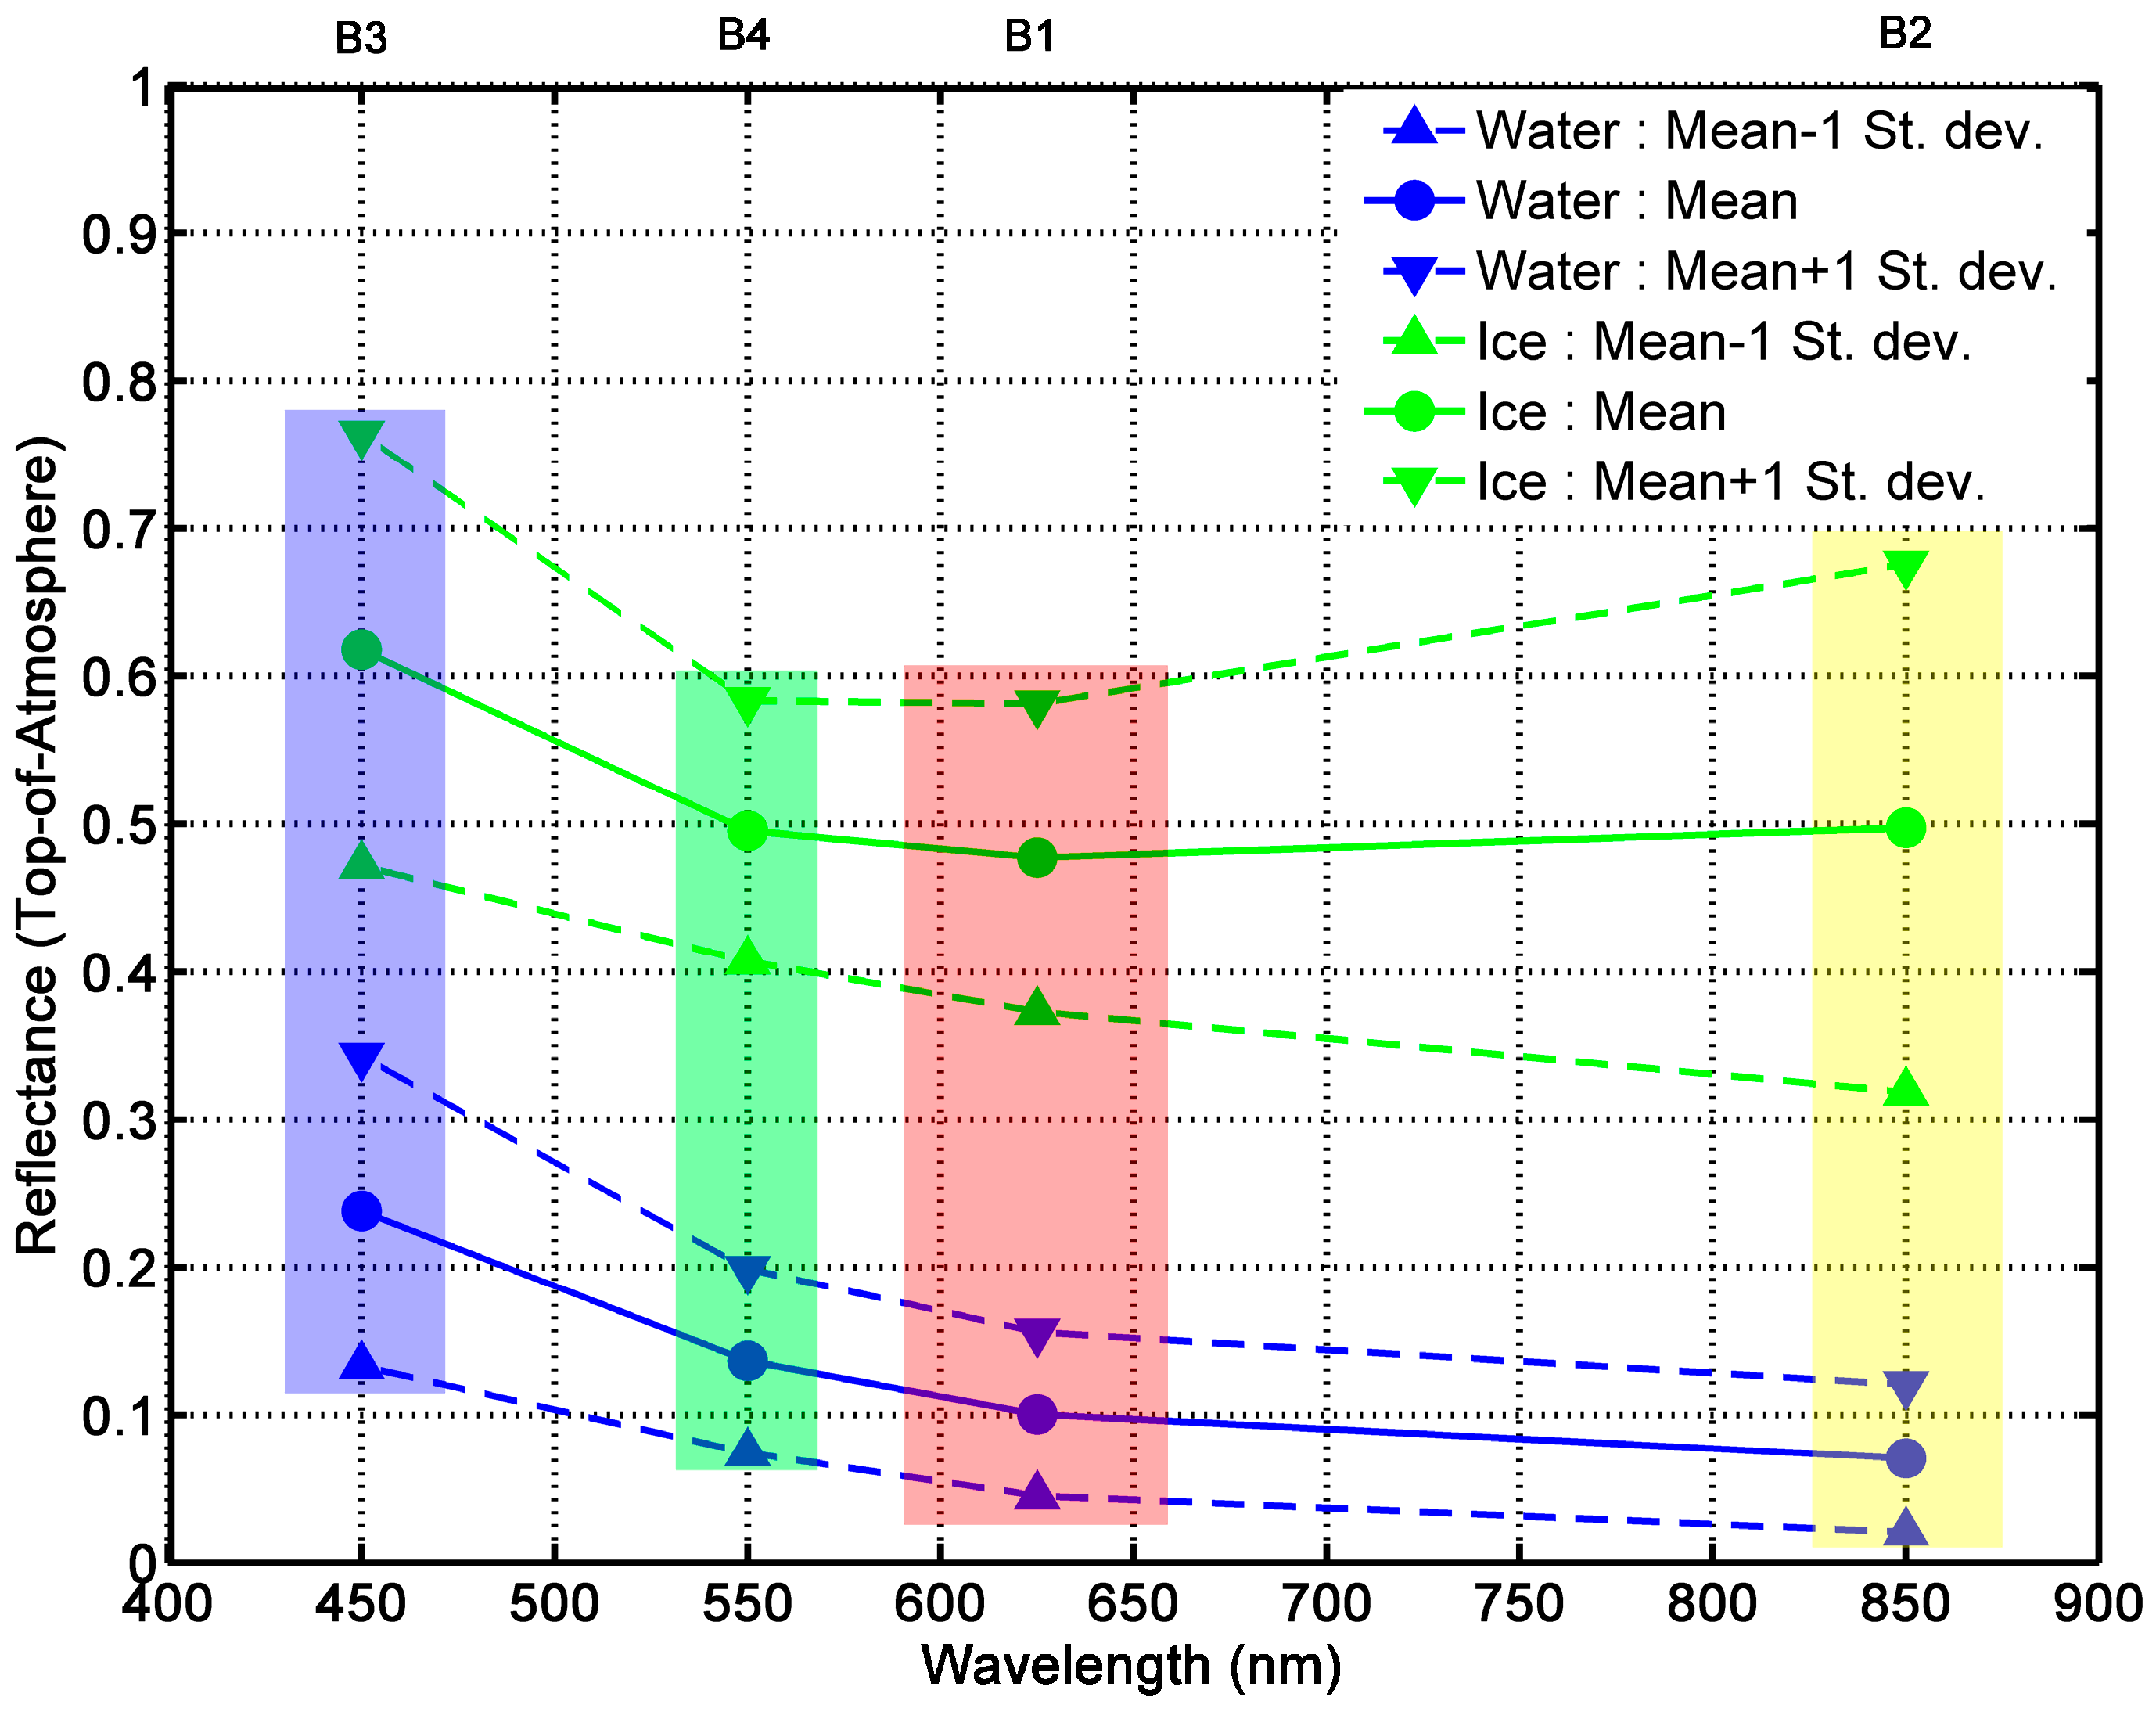
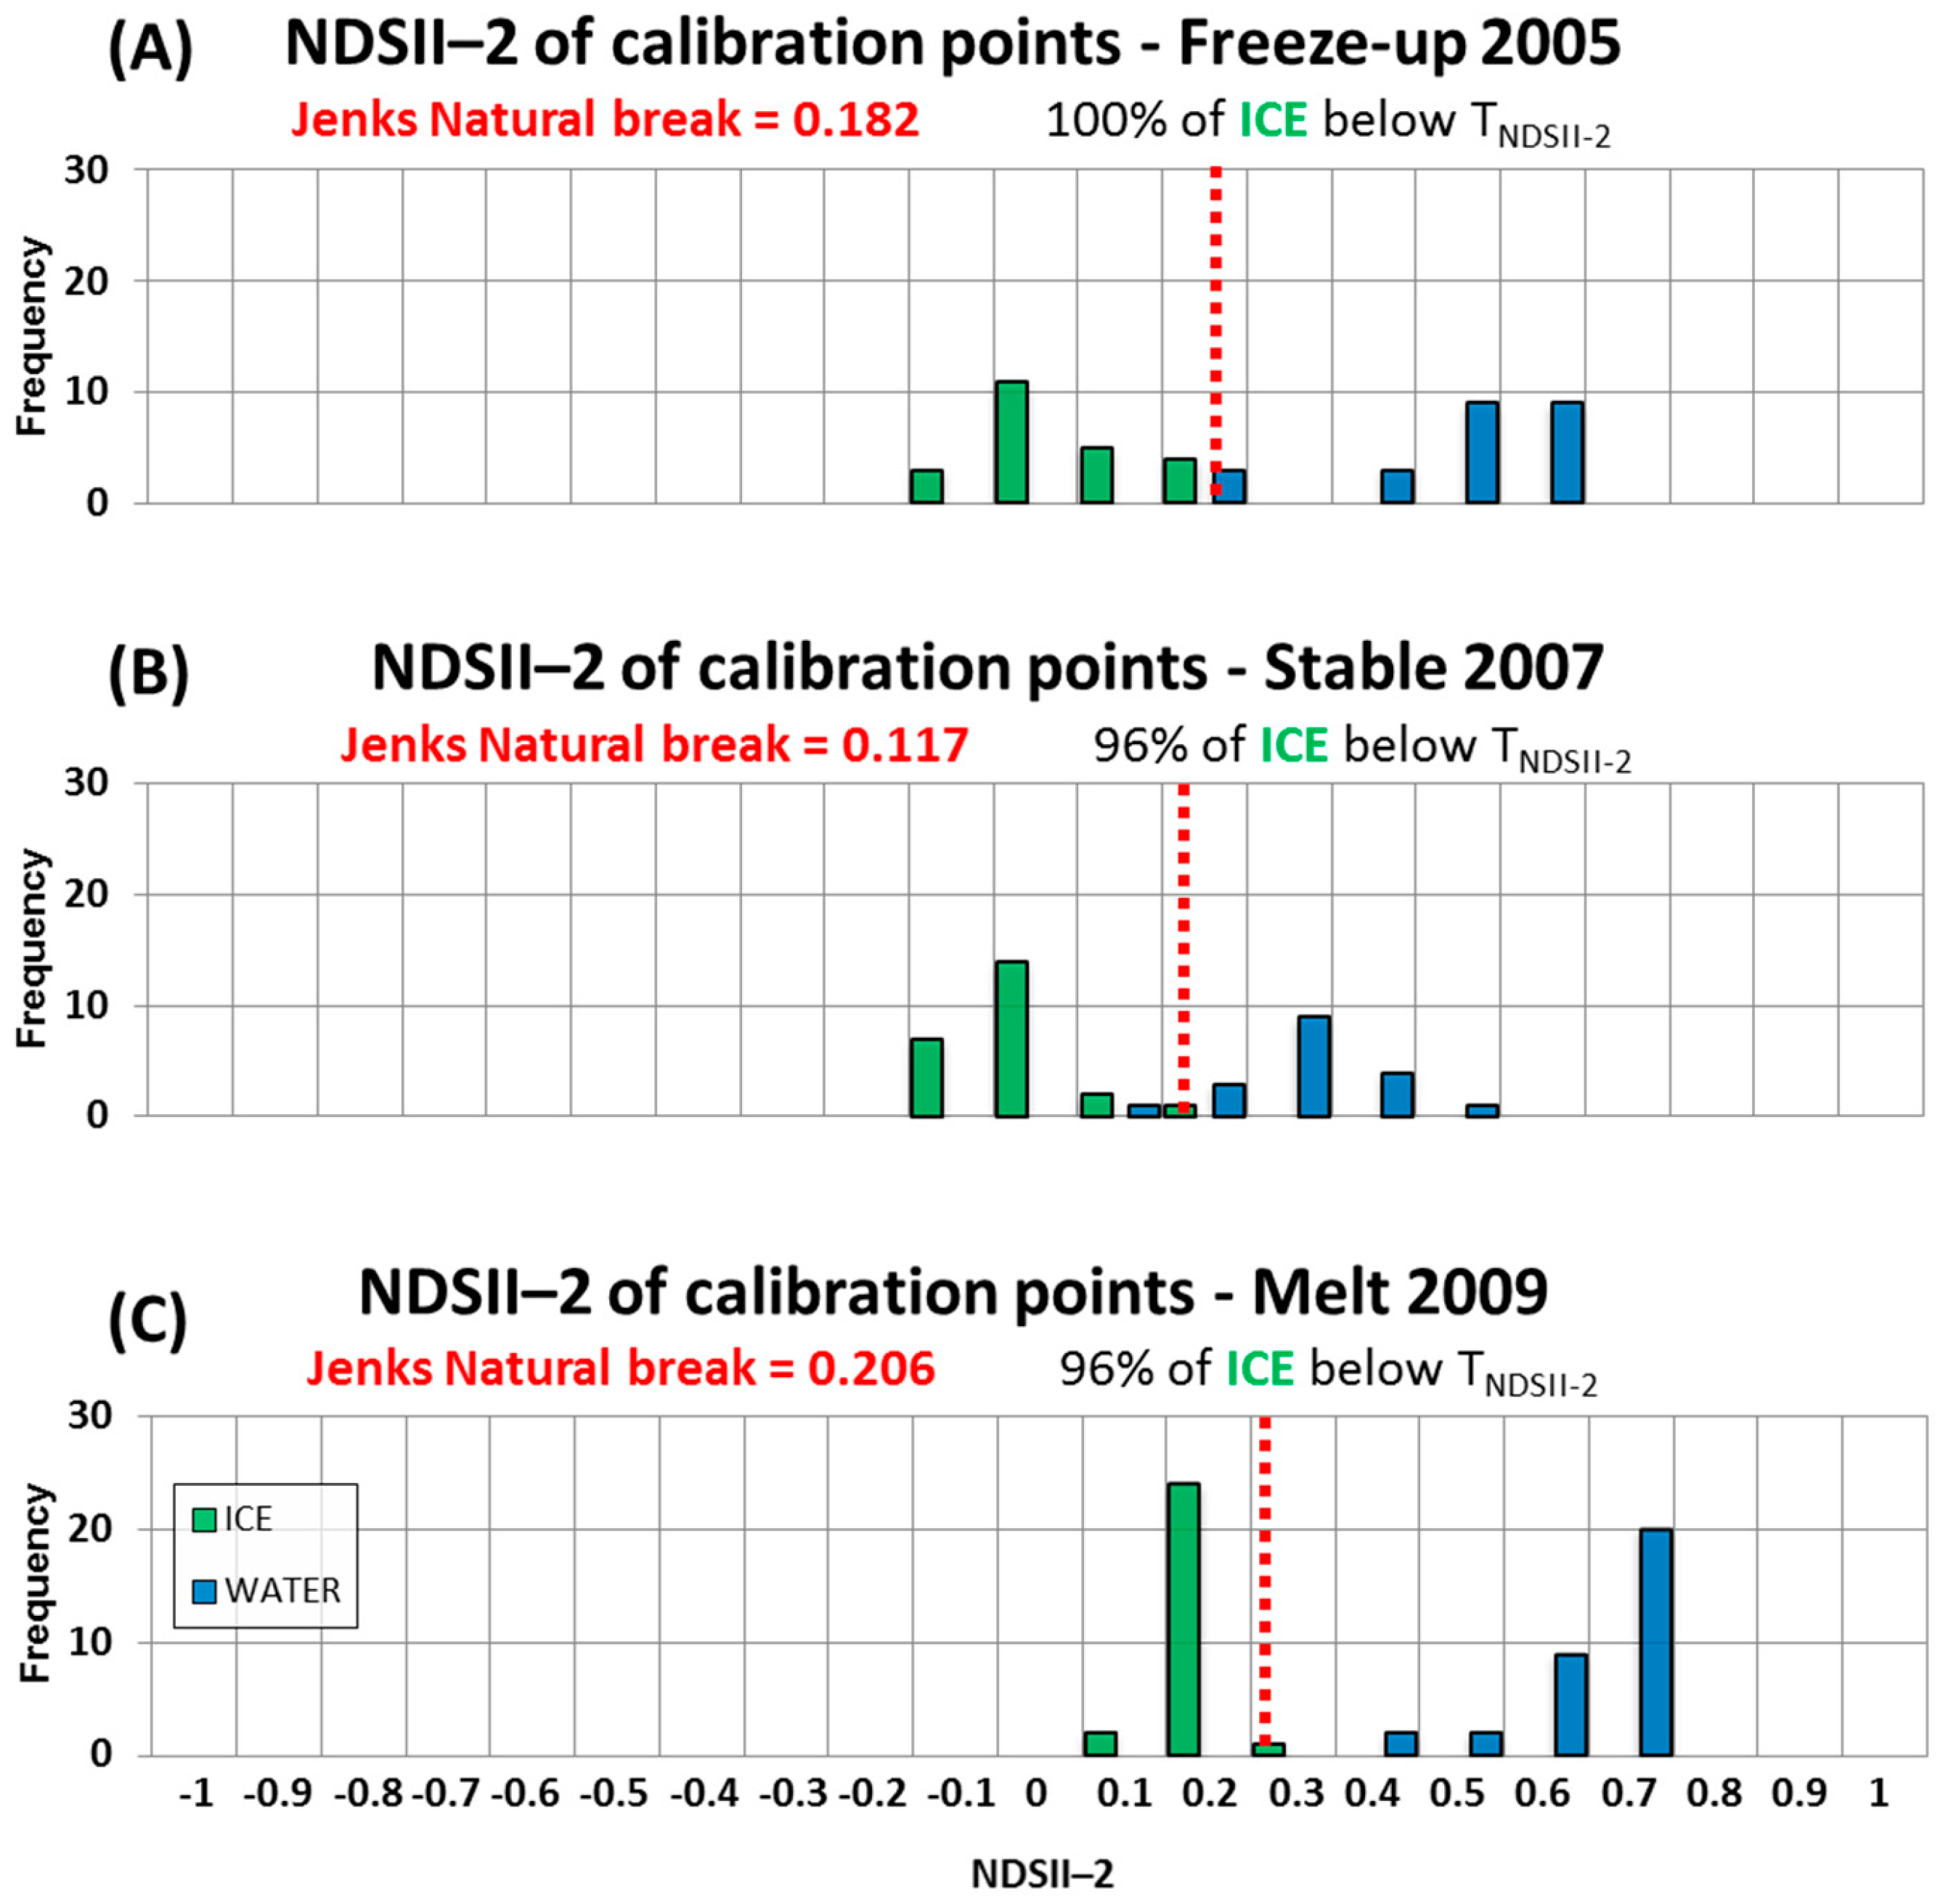
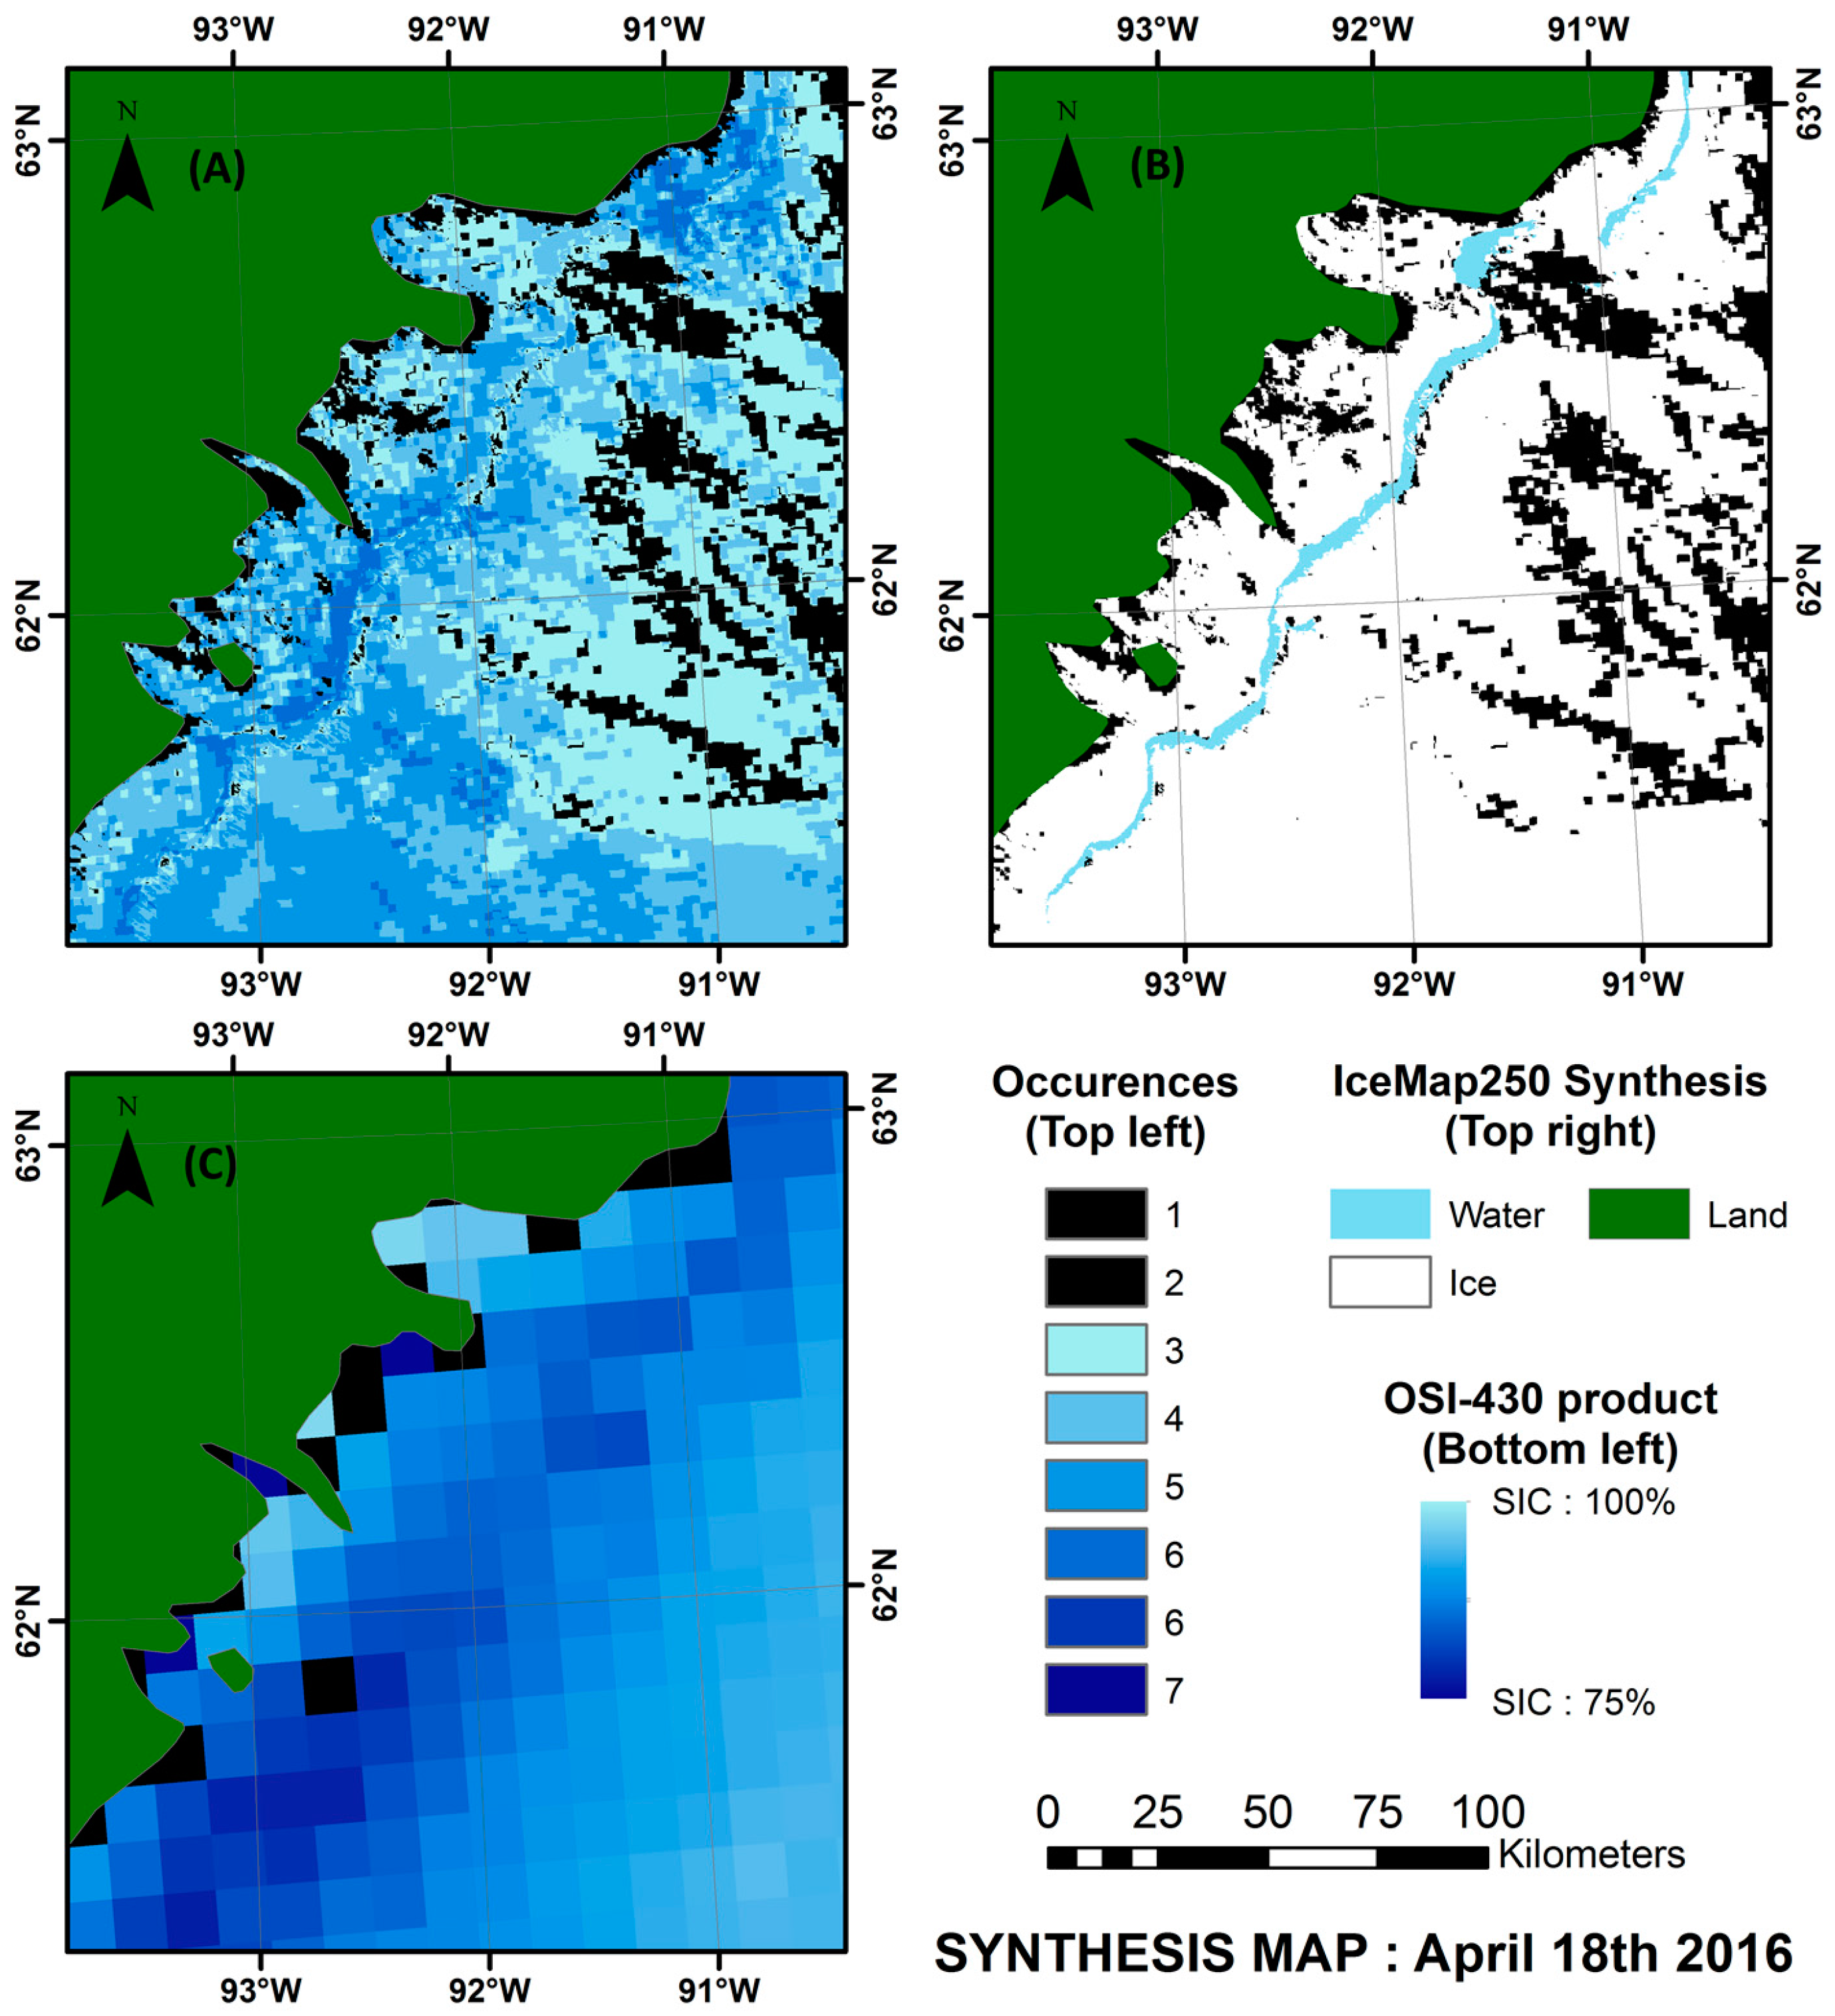
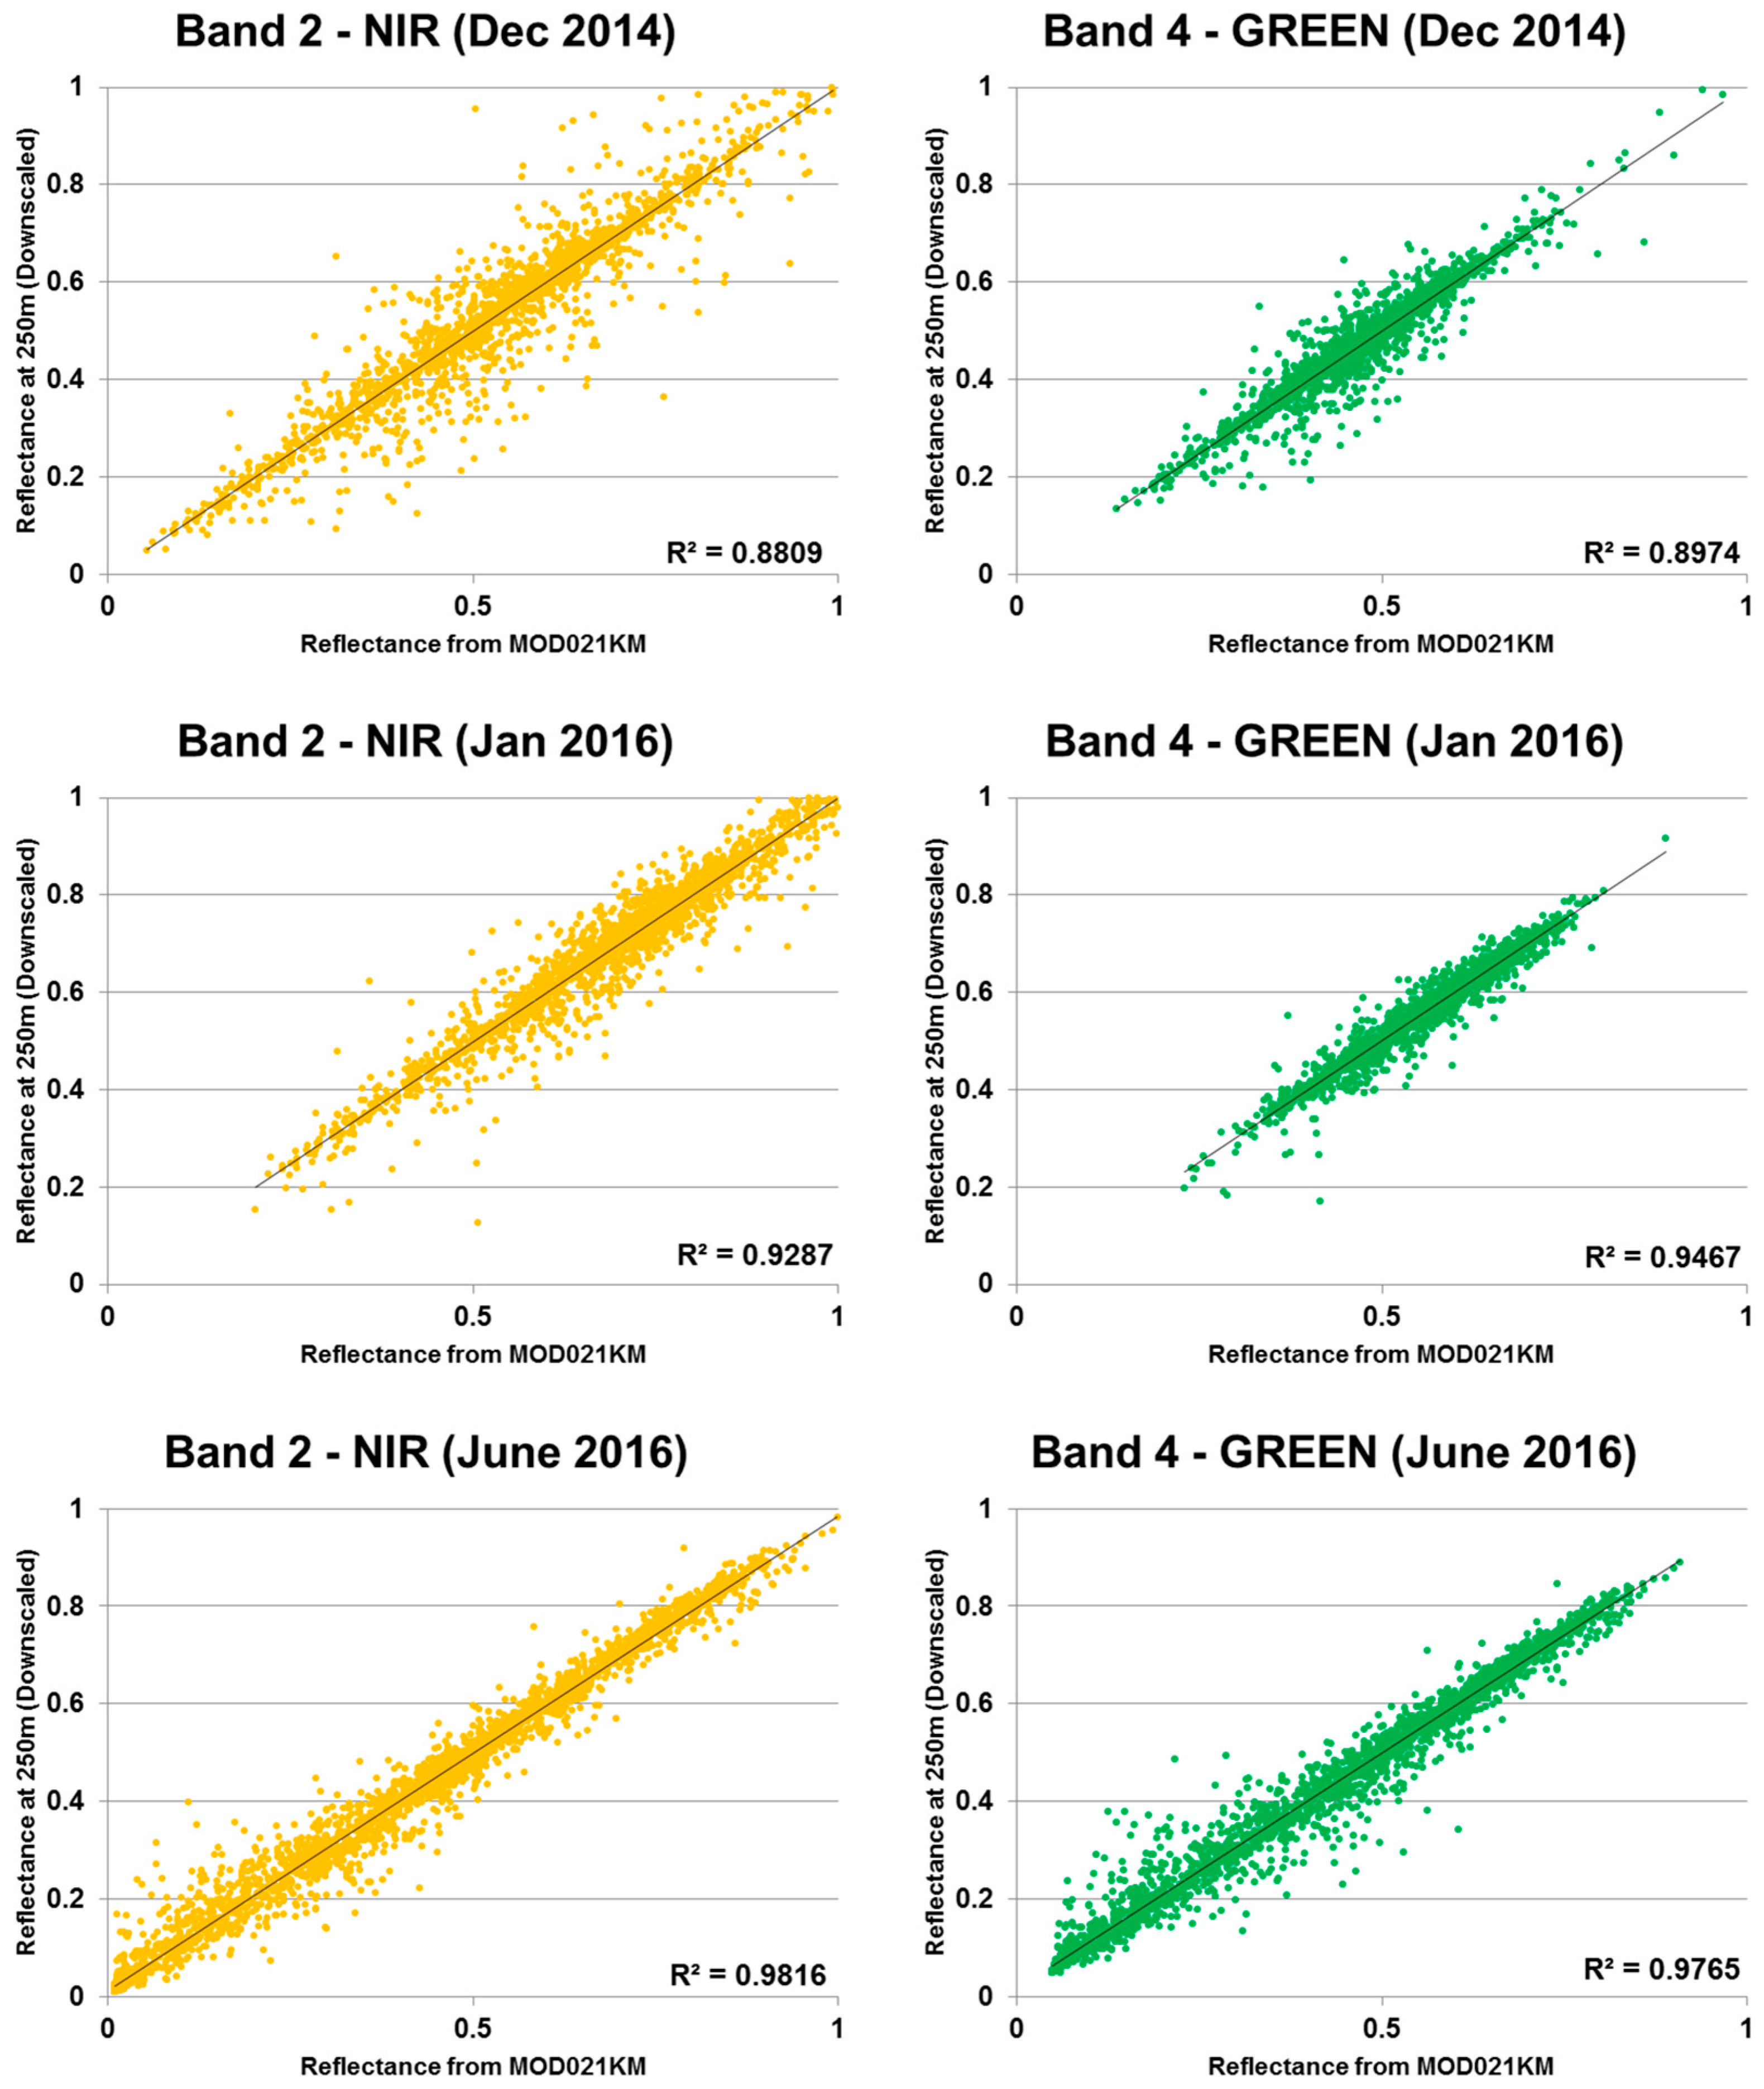
One source of error, mislabeling water as sea ice, may be linked to low tides when the intertidal area located at the outlets of rivers is exposed to the MODIS sensors. These areas are mistaken for ice as their reflectance is high at the 0.55 μm wavelength. They are adequately mapped by the original IceMap algorithm, explaining in part why the kappa score of the MOD29 product is higher than the 1 km IceMap250 products. One explanation for the improvement of the IceMap250 product at 250 m compared to its counterparts at 1 km is that the refinement brought by the downscaling makes the algorithm correct the errors in the intertidal areas since the measured TNDSII-2 threshold is computed using different reflectances at a finer grid resolution (16 pixels at 250 m are contained in 1 pixel at 1 km), increasing the impact of these pixels in the estimation of TNDSII-2 with the Jenks method. This situation is common in James Bay, the southernmost entity of the Hudson Bay Complex, where numerous rivers are known to bring large quantities of sediments.
Another source is the mislabeling of ice as water due to melt ponds, which, in most advanced cases, present a water-like NDSII—2 value. The 0.17 threshold used in Band 4 was shown to accurately discriminate sea ice with melt ponds from water, as about 15% of the validation points were gathered from areas with melt ponds. The slight improvement in the detection of water for the IceMap250 VIS map, compared to the 250 m MOD35 map can be explained by the difference in the extent masked by the MOD35 and the VIS masks and by the context of the melt period where water becomes more abundant. The impact on the algorithm is that the TNDSII-2 value differs for both products because the VIS mask covers more potential water areas (high NDSII—2 values) with the effect of pulling down TNDSII-2, resulting in more pixels failing the first test for ice detection.
The freeze-up period contingency table (
Table 6) shows that the main source of error during freeze-up is the mislabeling of water as sea ice, except for the MOD29 product. The freeze-up period is especially difficult to map, mostly because of the dense cloud cover that is frequently present. The changes in the algorithm have shown, in this period, to improve the kappa value by about 10%, according to the freeze-up period validation dataset.
In some cases, a cloud-covered area will be misclassified by the cloud-masking algorithm (MOD35) and will be considered cloud-free, leading to possible mislabeling of water as ice by the IceMap250 algorithm. The low clouds and water vapor that pass through the different filters of MOD35 have negative NDSII—2 values, sufficient to pass the TNDSII-2 threshold, and present with a high green reflectance classifying them as ice. At those same points, the NDSI values are slightly below 0.4, explaining why they do not appear as errors in the MOD29 product. Once again, the intertidal areas cause classification errors until we reach the period where the land fast ice is well established, meaning the shores display a stable ice cover.
Even though the validation data show excellent concordance with manually photo-interpreted data, it should not be taken for granted that IceMap250 will achieve such accuracy for every scene it classifies.
The validation is relative to the accuracy and consistency of the photo-interpretation, and the results could vary simply by using different validation dates. Nonetheless, given the results obtained from our extensive validation dataset, we contend that the IceMap250 classification process is reliable and generates high-quality results.
4.3. Validation of the Weekly Synthesis Maps: Comparison with Similar Products
One issue with the IceMap250 composite maps is the sparse and irregular distribution of coverage. To cope with this problem, weekly synthesis maps are generated for each of the 52 weeks of the year.
Quantitative validation is quite difficult for these synthesis maps since they are built from a collection of time-shifted datasets, but it is possible to compare them with existing synthesis products that provide a similar overview of ice presence, such as passive microwave (7 days average) and weekly maps from national ice services.
The latter products do not have the same spatial resolution as the IceMap250 synthesis map, but the comparison between these products and the IceMap250 product demonstrates the accuracy of the synthesis process used in the weekly IceMap250 maps. It is also a simple method to assess the consistency of the IceMap250 maps over time.
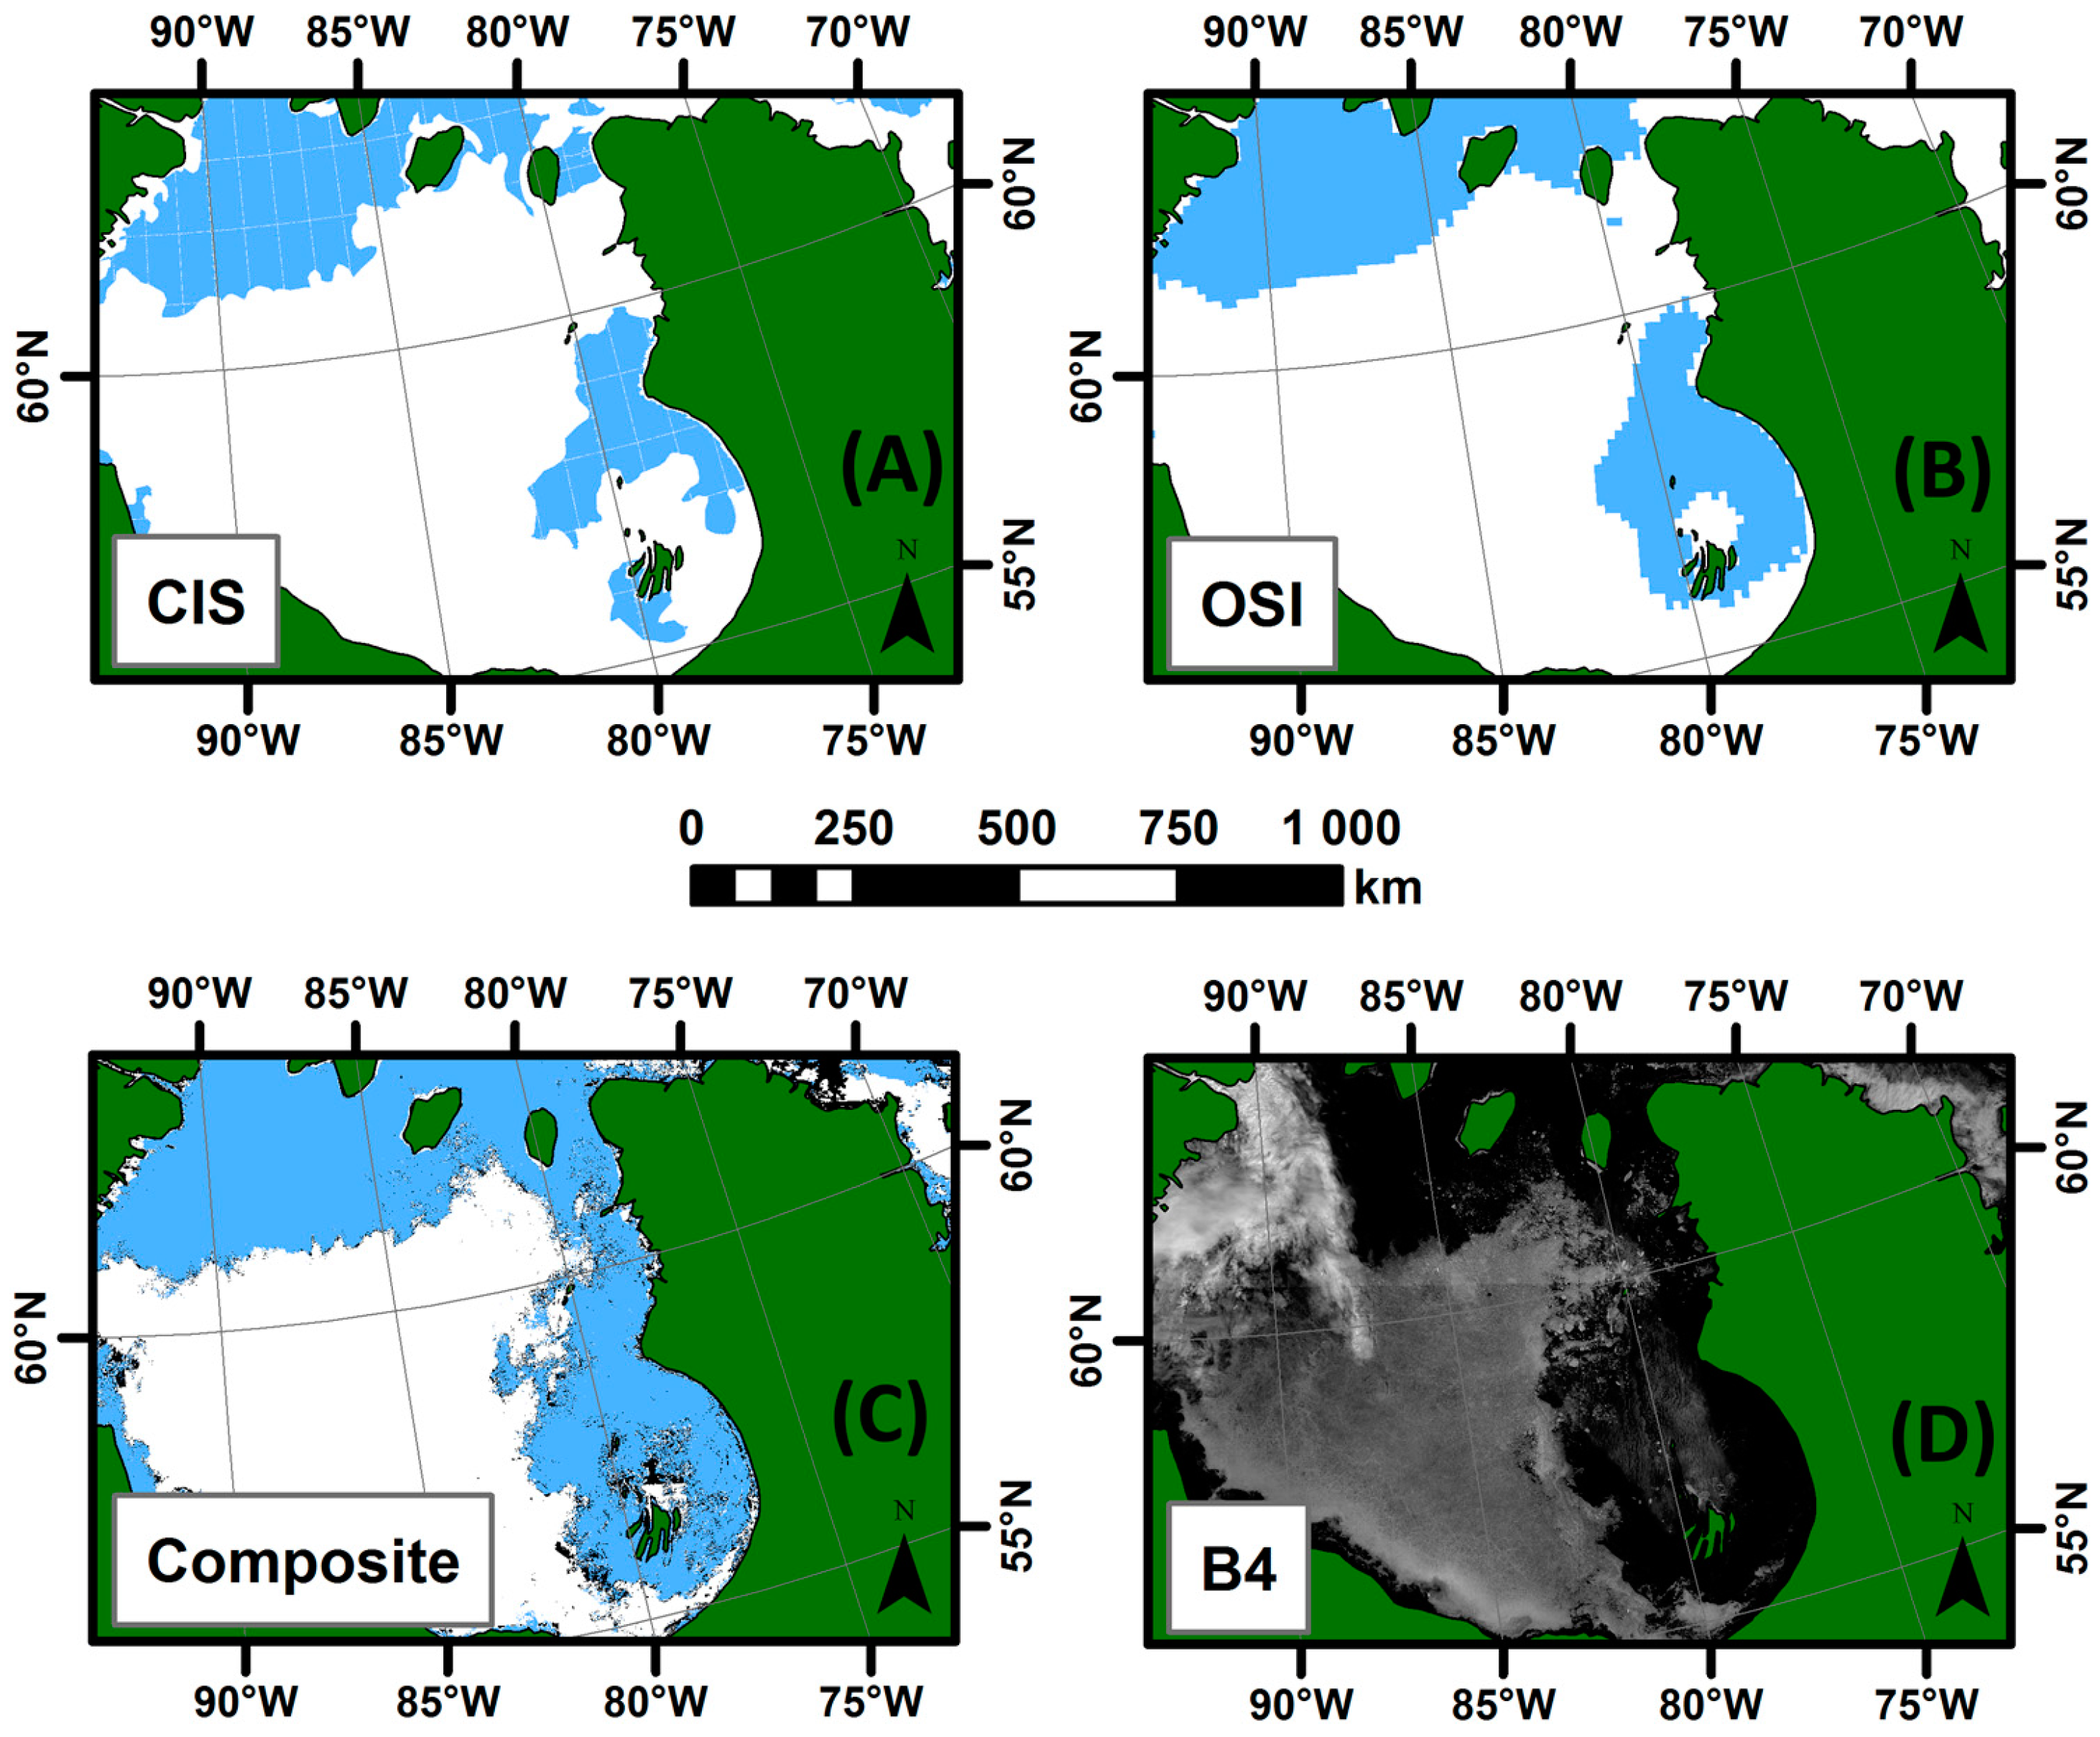
To evaluate their accuracy, the synthesis maps were then compared to the Canadian Ice Service weekly Hudson Bay regional ice charts, which are based on ScanSAR RADARSAT-1 imagery (50 or 100 m resolution), and to a 7 days average version of the OSI-409 or OSI-430 Reprocessed Sea Ice Product [
55], which is based on passive microwave data with a footprint size between 30 and 50 km, sampled at every 25 km and for which the product is provided at a 12.5 km resolution. Note that the ice charts compared are potentially based on data from different days since their respective production processes and input data are different. The periods compared include the last scene within the 7 days period. A total of nine comparisons were made—one per ice season (freeze-up, stable cover and melt) for three different years. The comparison of the output weekly maps from the analysis made at the Canadian Ice Service, the passive microwave-based OSI-409 or OSI-430 (depending on the date) product and the output weekly synthesis maps from the IceMap250 algorithm (
Figure 10) allow us to draw the following conclusions:
For all three seasons considered, the general pattern and the sea ice cover agrees between the products compared.
The IceMap250 product, contrary to the CIS maps of the OSI maps, based respectively on SAR and passive microwave data, does not map the entire area because of its vulnerability to the cloud cover.


