Article

The Spatiotemporal Pattern of Urban Expansion in China: A Comparison Study of Three Urban Megaregions

1
University of Chinese Academy of Sciences, No. 19A Yuquan Road, Beijing 100049, China
2
State Key Laboratory of Urban and Regional Ecology, Research Center for Eco-Environmental Sciences, Chinese Academy of Sciences, No. 18 Shuangqing Road, Beijing 100085, China
*
Author to whom correspondence should be addressed.
Remote Sens. 2017, 9(1), 45; https://doi.org/10.3390/rs9010045
Submission received: 10 November 2016 / Revised: 27 December 2016 / Accepted: 1 January 2017 / Published: 6 January 2017
(This article belongs to the Special Issue Remote Sensing of Urban Ecology)

Abstract

:
Urban megaregions have emerged as a new urbanized form. However, previous studies mostly focused on urban expansion at the city scale, particularly for large cities. Understanding urban expansion at the regional scale including cities having different sizes is important for extending current knowledge of urban growth and its environmental and ecological impacts. Here, we addressed two questions: (1) How do the extent, rate, and morphological model of urban expansion vary at both the regional and city scales? (2) How do factors, such as city size and expansion rate, influence urban expansion models? We focused on the three largest urban megaregions in China, Beijing-Tianjin-Hebei (BTH), Yangtze River Delta (YRD) and Pearl River Delta (PRD). We quantified and compared the spatiotemporal pattern of urban expansion during 2000–2010 at both the regional and city scales based on remote sensing data. We used correlation analysis and linear regressions to address our research questions. We found that (1) the three urban megaregions experienced rapid and massive urban growth, but the spatiotemporal pattern varied greatly. Urban expansion was dominated by edge-expansion in the BTH, edge-expansion and infilling in the YRD, and infilling in the PRD. Cities in the same megaregion tended to have similar expansion morphology; (2) geographical location influenced the model of urban expansion the most, followed by city size and by its expansion rate. Small-sized cities were more likely to develop in a leapfrogging model, while cities with relatively rapid expansion tended to grow in an edge-expansion model.

Graphical Abstract

1. Introduction

Urban expansion drives the conversion of landscapes and causes a massive of environmental and ecological impacts [1,2,3,4,5]. These impacts occur not only within the urban area itself but also well beyond the urban boundaries [1,2,3]. In fact, urbanization is increasingly becoming a major driving factor of landscape changes and environmental issues at the regional scale [6,7]. To better understand how regional urbanization affects the environment, the spatiotemporal pattern of urban expansion and its driving forces must be first quantified [8,9,10].
A considerable number of studies have been conducted to quantify spatiotemporal pattern of urban expansion. The focus of these studies includes: (1) the extent and speed of urban expansion [11,12]; (2) landscape pattern and changes along the resultant urban-rural gradients, frequently quantified by landscape metrics [13,14]; and (3) the morphology of urban expansion, such as urban sprawl versus compactness [15], models of urban expansion [16]. Recognizing the importance of urban morphology for environmental and ecological issues [17,18], there is an increasing interest in quantifying the models of urban expansion [17,19,20,21].
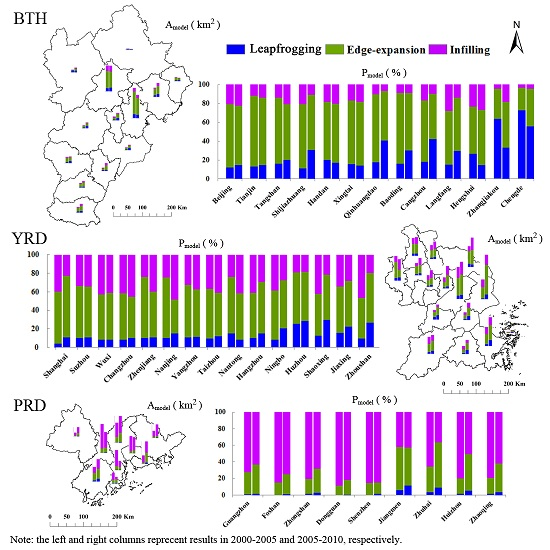
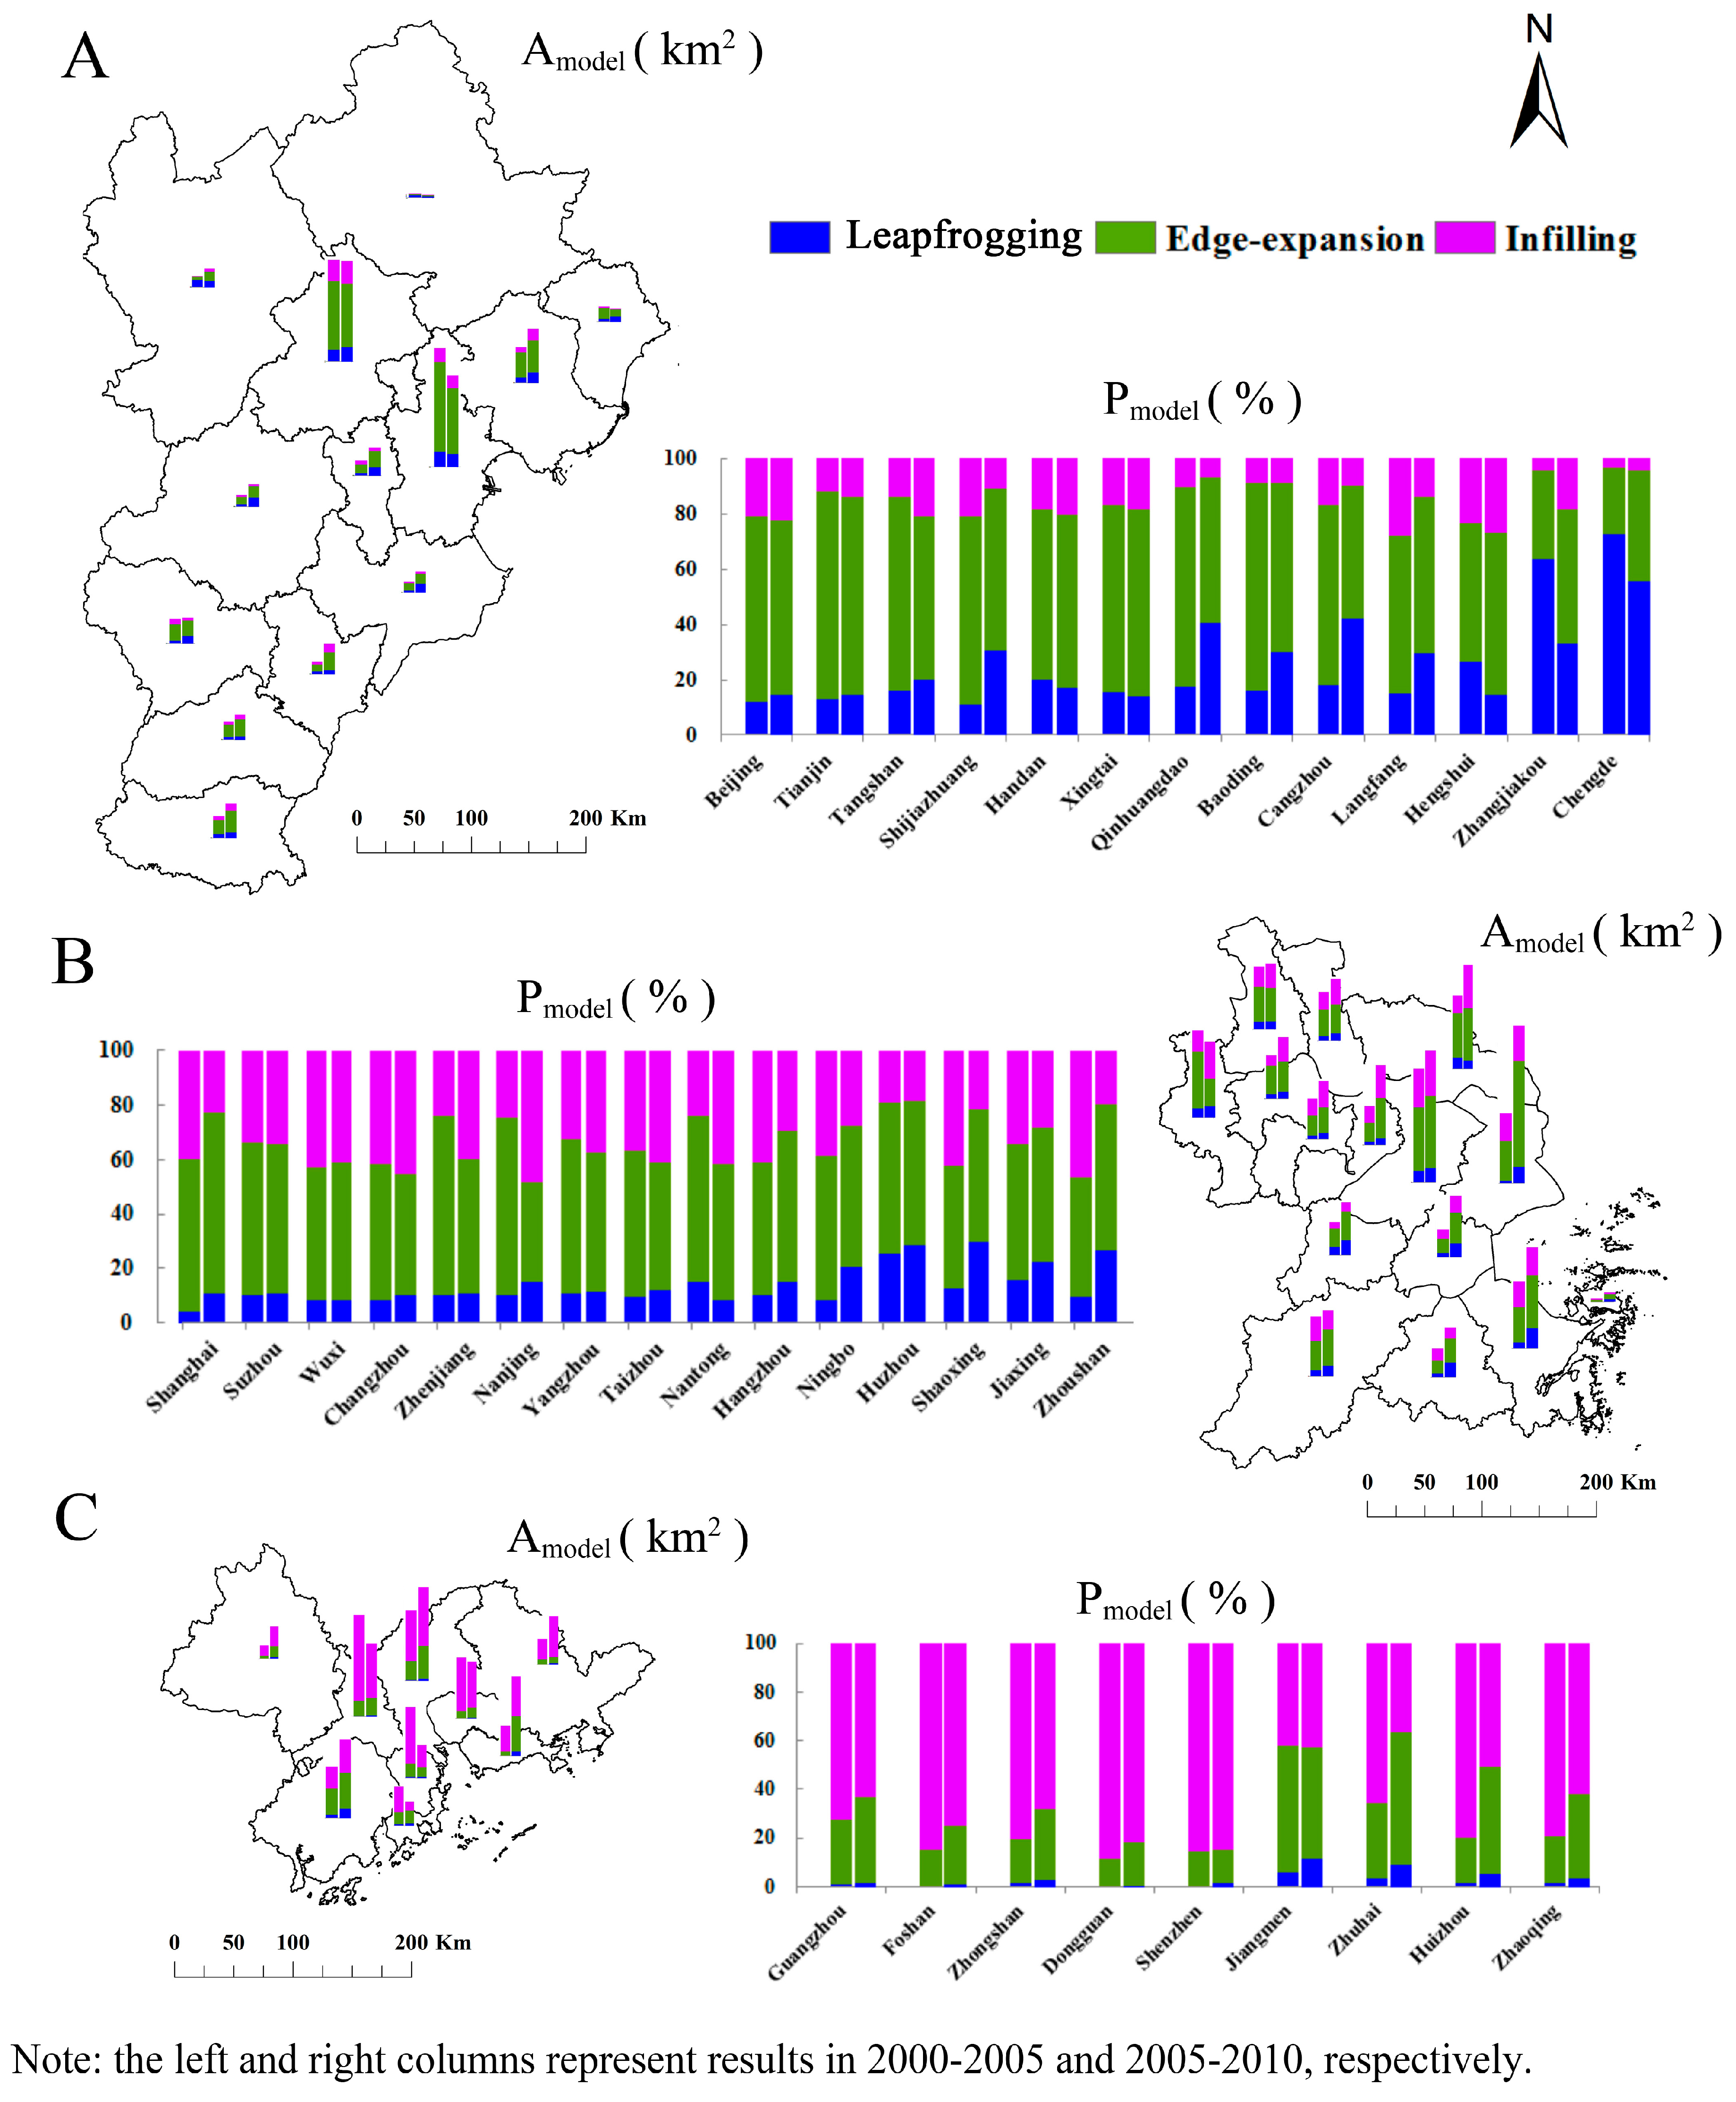
There are three types of models, namely, leapfrogging, edge-expansion, and infilling, which are widely recognized for portraying the morphology of urban expansion [16,19,20]. Specifically, leapfrogging refers to the model in which new patches of developed land are not adjacent to existing patches of developed land; edge-expansion represents the pattern in which new patches of developed land grow out of the fringe of existing patches of developed land; and infilling refers to the pattern in which new patches of developed land are surrounded by existing patches of developed land [16]. Based on the pattern of expansion models, the city develop can be summarized as a process that shifts from one of diffusion to one of coalescence [17,20].
Remote sensing data have been widely used for urban expansion studies, as these data provide both spatial detail and temporal frequency for urban morphology and change. Particularly, the historical information revealed by multi-temporal remote sensing data is important for quantifying the process of urban development [22,23]. Among the numerous available remote sensing data, the Landsat image, including MSS, TM/ETM+ and OLI, is one of the most widely used data for urban expansion [24,25]. Integrating remote sensing data with landscape urban analysis is particularly useful for understanding the spatiotemporal patterns of urban expansion [26,27].
Numerous studies have been conducted to investigate the spatiotemporal pattern of urban expansion for cities such as Nanjing [19], Lianyungang [28] and other major cities [12,29,30] from China, Phoenix and Las Vegas from the USA [26], and 25 global cities [15]. These studies that focused on the spatiotemporal pattern of urban expansion have been largely conducted in a single city [19,28] or in several cities for comparison purposes [12,15,26,29,30]. In addition, most of these studies have focused on large cities. Few studies, however, have been conducted at the regional scale that include cities of different sizes [20]. Globally, urban megaregions have emerged as a new form of urbanization [18,31,32]. Urban megaregions physically cover not only the spatially proximal urban areas with different scales but also the intervening suburban and exurban regions, which are linked by social processes, including population migration, development policy initiatives and lifestyle changes [31,33,34]. Therefore, taking urban megaregions as examples, understanding urban expansion at the regional scale that includes cities of various sizes is important for extending current knowledge of urban growth, and therefore, its environmental and ecological impacts.
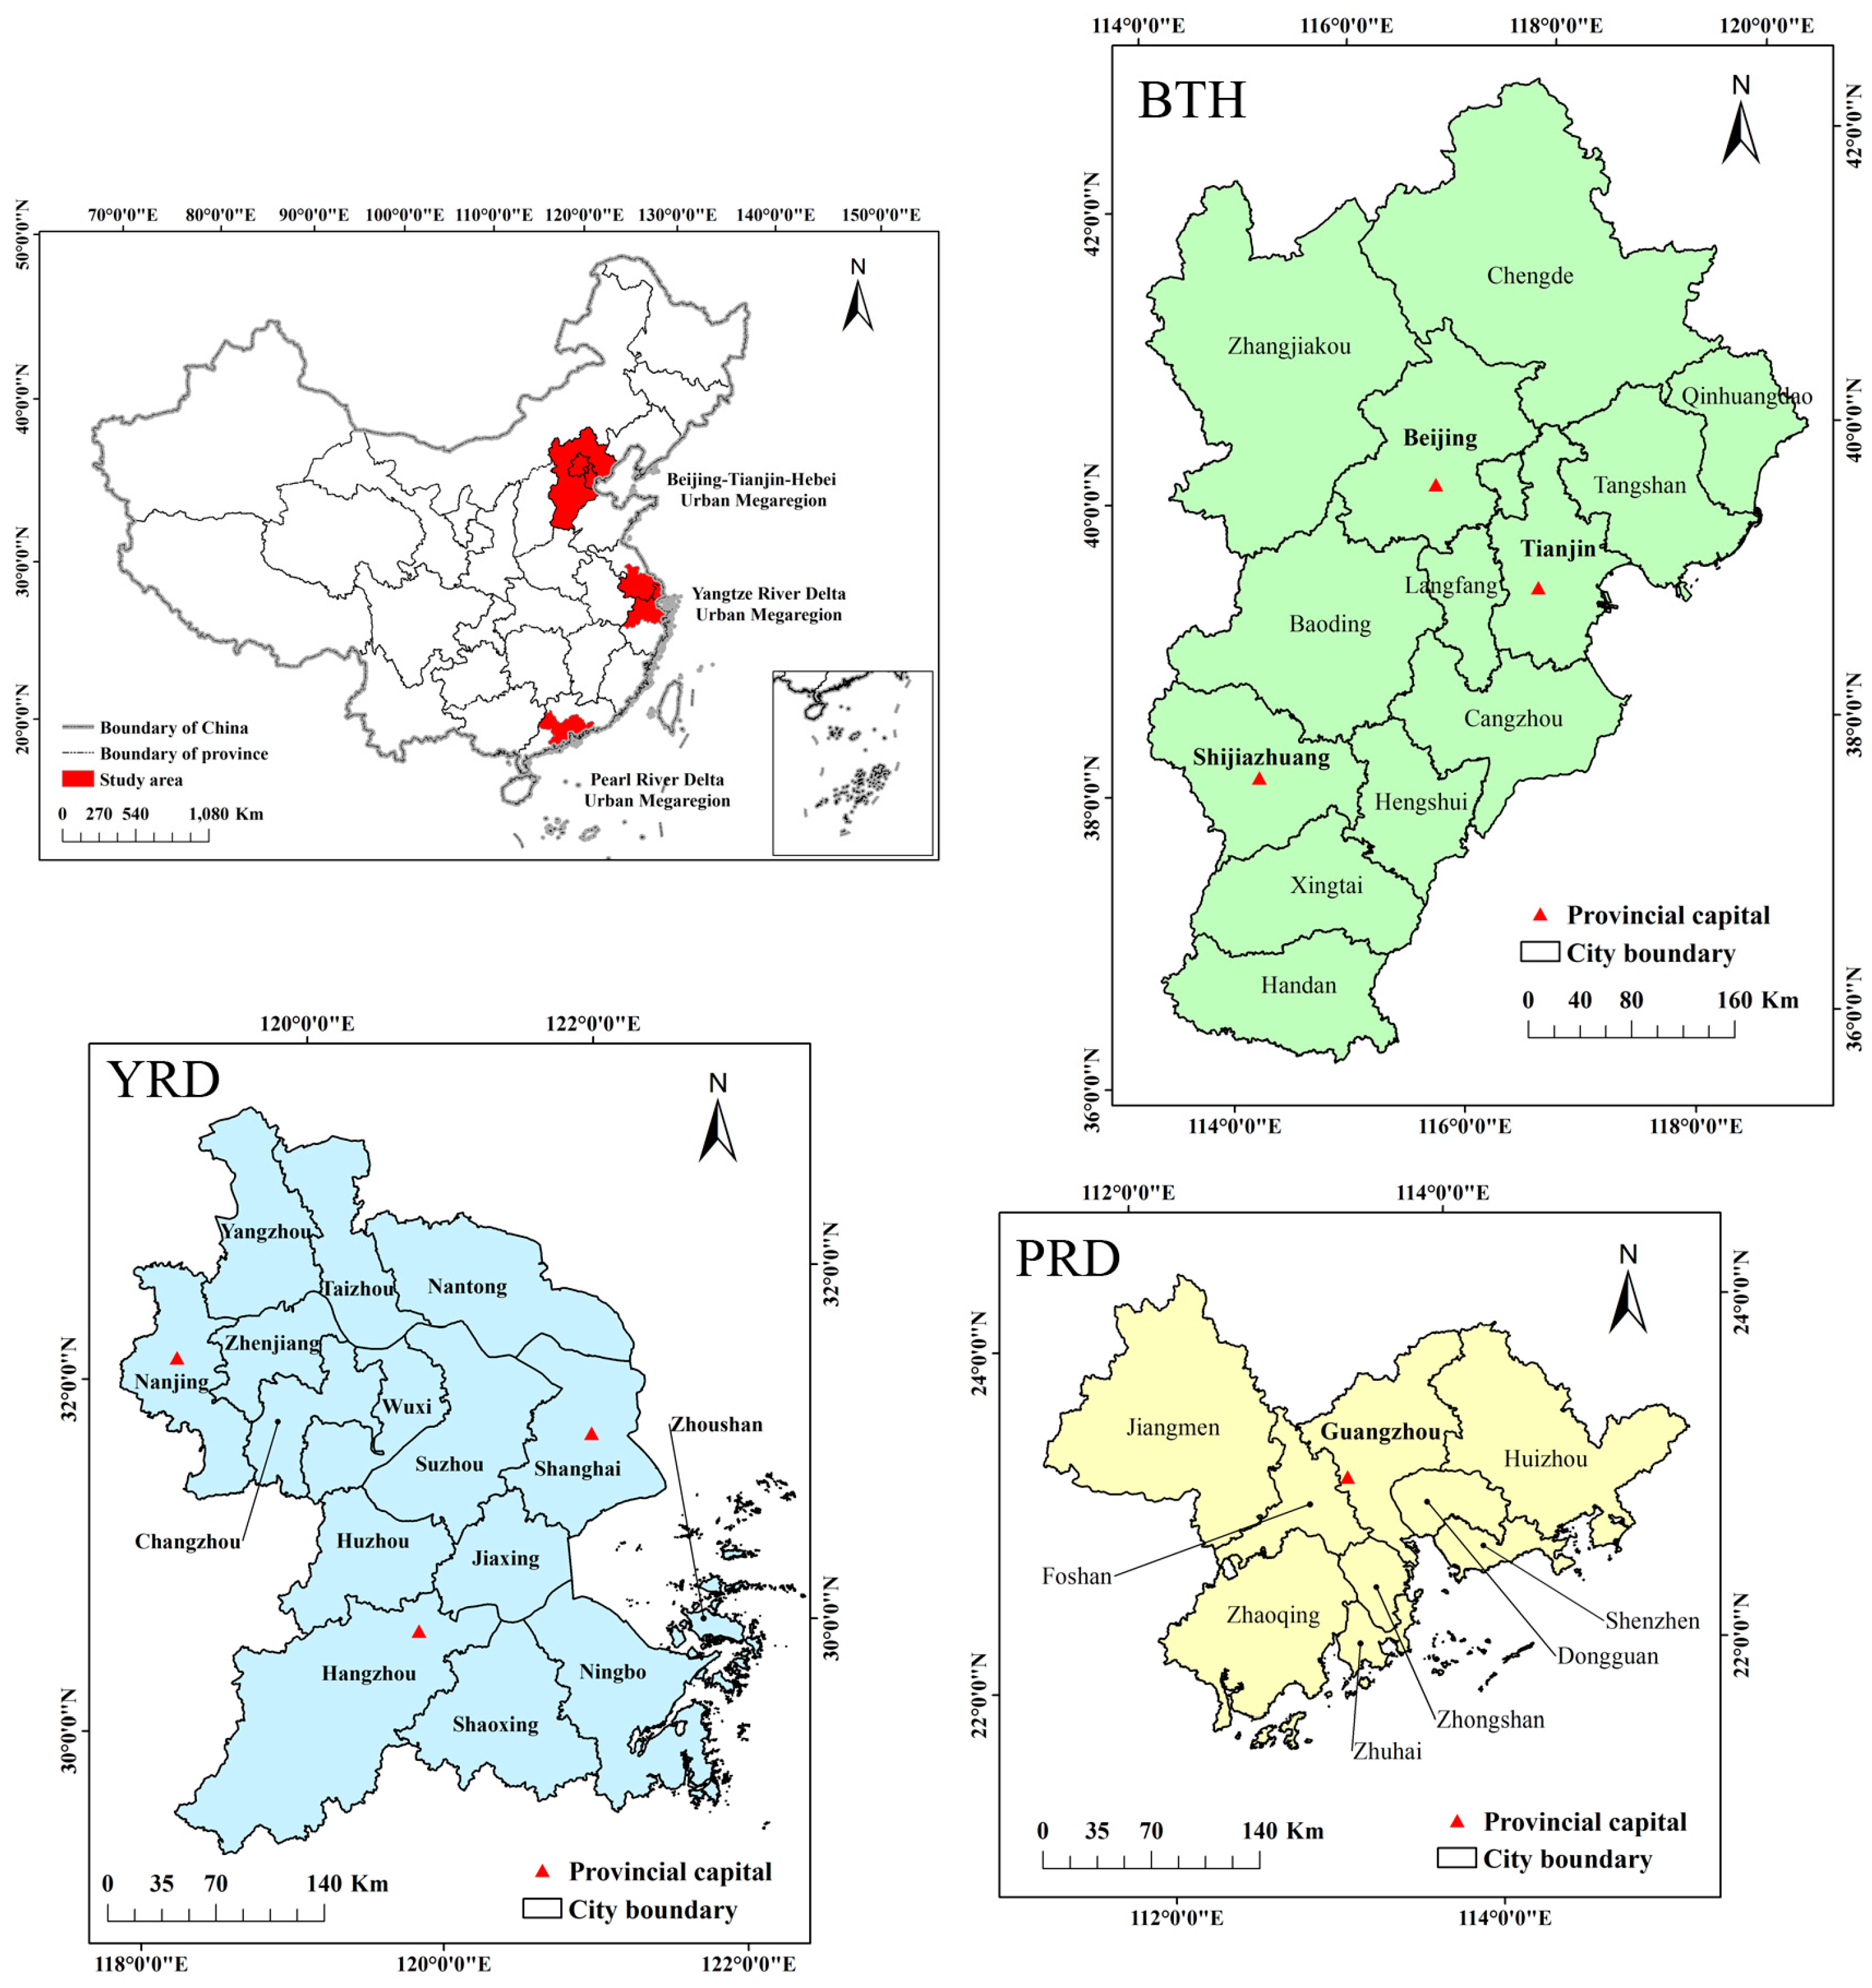
Here, we chose the three largest urban megaregions in China, the Beijing-Tianjin-Hebei (BTH), Yangtze River Delta (YRD), and Pearl River Delta (PRD), as our study areas. We addressed the following two questions: (1) What are the spatiotemporal patterns of the extent, rate, and morphological model of urban expansion at both the regional and city scales in the three urban megaregions; and (2) How do factors such as geographical locations, the size of the city and its expansion rate influence the model of urban expansion? We first quantified and compared the spatiotemporal patterns of urban expansion from 2000–2010 at both the regional and city scales based on remote sensing data. We then examined how factors such as the size of the city and its expansion rate influenced the model of urban expansion using correlation analysis and linear regressions.

2. Materials and Methods

2.1. Study Area

The Beijing-Tianjin-Hebei (hereinafter refereed to the BTH), the Yangtze River Delta (YRD) and the Pearl River Delta (PRD) are the three biggest urban megaregions in China. The three megaregions are located in the eastern coastal region, the most densely populated area in China, and are distributed from north to south. In our study, the BTH urban megaregion includes Beijing and Tianjin, two municipalities directly under the Central Government, and the Hebei province. The YRD urban megaregion contains the municipality of Shanghai, southern Jiangsu Province and northern Zhejiang Province. The PRD includes nine cities of Guangdong Province (Figure 1).
The BTH encompasses approximately 215,800 km2, with a total population of 110.53 million in 2014 (approximately 8.08% of the total population of China), and the gross domestic product (GDP) of 6647.90 billion Yuan, accounted for 10.45% of the GDP in China (National Bureau of Statistics of the People’s Republic of China, 2014). The terrain in the BTH is high in the northwest but low in the southeast, with the Taihang and Yan mountains to the northwest and the Northern China Plain in the southeast. The elevation of BTH ranges from 50 m to 2832 m. The YRD urban megaregion covers an area of 103,960 km2. At the end of 2014, the total population in this region was 98.38 million and the GDP was 7523.05 billion Yuan, accounting for 7.19% of the total population and 11.87% of the total GDP in China, respectively (National Bureau of Statistic of China, 2014). The geomorphology in this region characterized by the Yangtze River alluvial plain in the northern part and rolling hills in the southern part, resulting in a generally low terrain. The PRD covers nearly 54,000 km2, with the total population of 57.63 million in 2014 (approximately 4.21% of the total population of China), and the GDP of 5765.00 billion Yuan (about 9.09% of the total GDP in China; Guangdong Provincial Bureau of Statistics, 2014). In the PRD, the undulating hills and the confluence of three large rivers are the defining geomorphological features of this delta region.

2.2. Data

The spatiotemporal patterns of urban expansion were quantified based on land use and land cover (LULC) classification maps of 2000, 2005 and 2010. Six types of land cover were included: forest, grass, water, farmland, developed land and barren. The class forest includes deciduous forests, evergreen forests, mixed forests and shrubs. The class grass includes areas dominated by grassland and herbaceous vegetation. Water includes rivers, lakes, reservoirs and ponds. Farmland consists of paddy fields and dry lands. Developed land includes urban and rural residential, commercial, industrial and transportation lands. Barren includes bare soil and sand. The classifications were derived from Landsat TM imagery with 30 m spatial resolution, using an object-based backdating approach [35]. The LULC map of 2010 was first generated by an object-based image analysis method, using Landsat TM imagery collected in 2010. The 2010 LULC map was then used as a reference map to generate the maps of 2005 and 2000, using an object-based backdating approach [
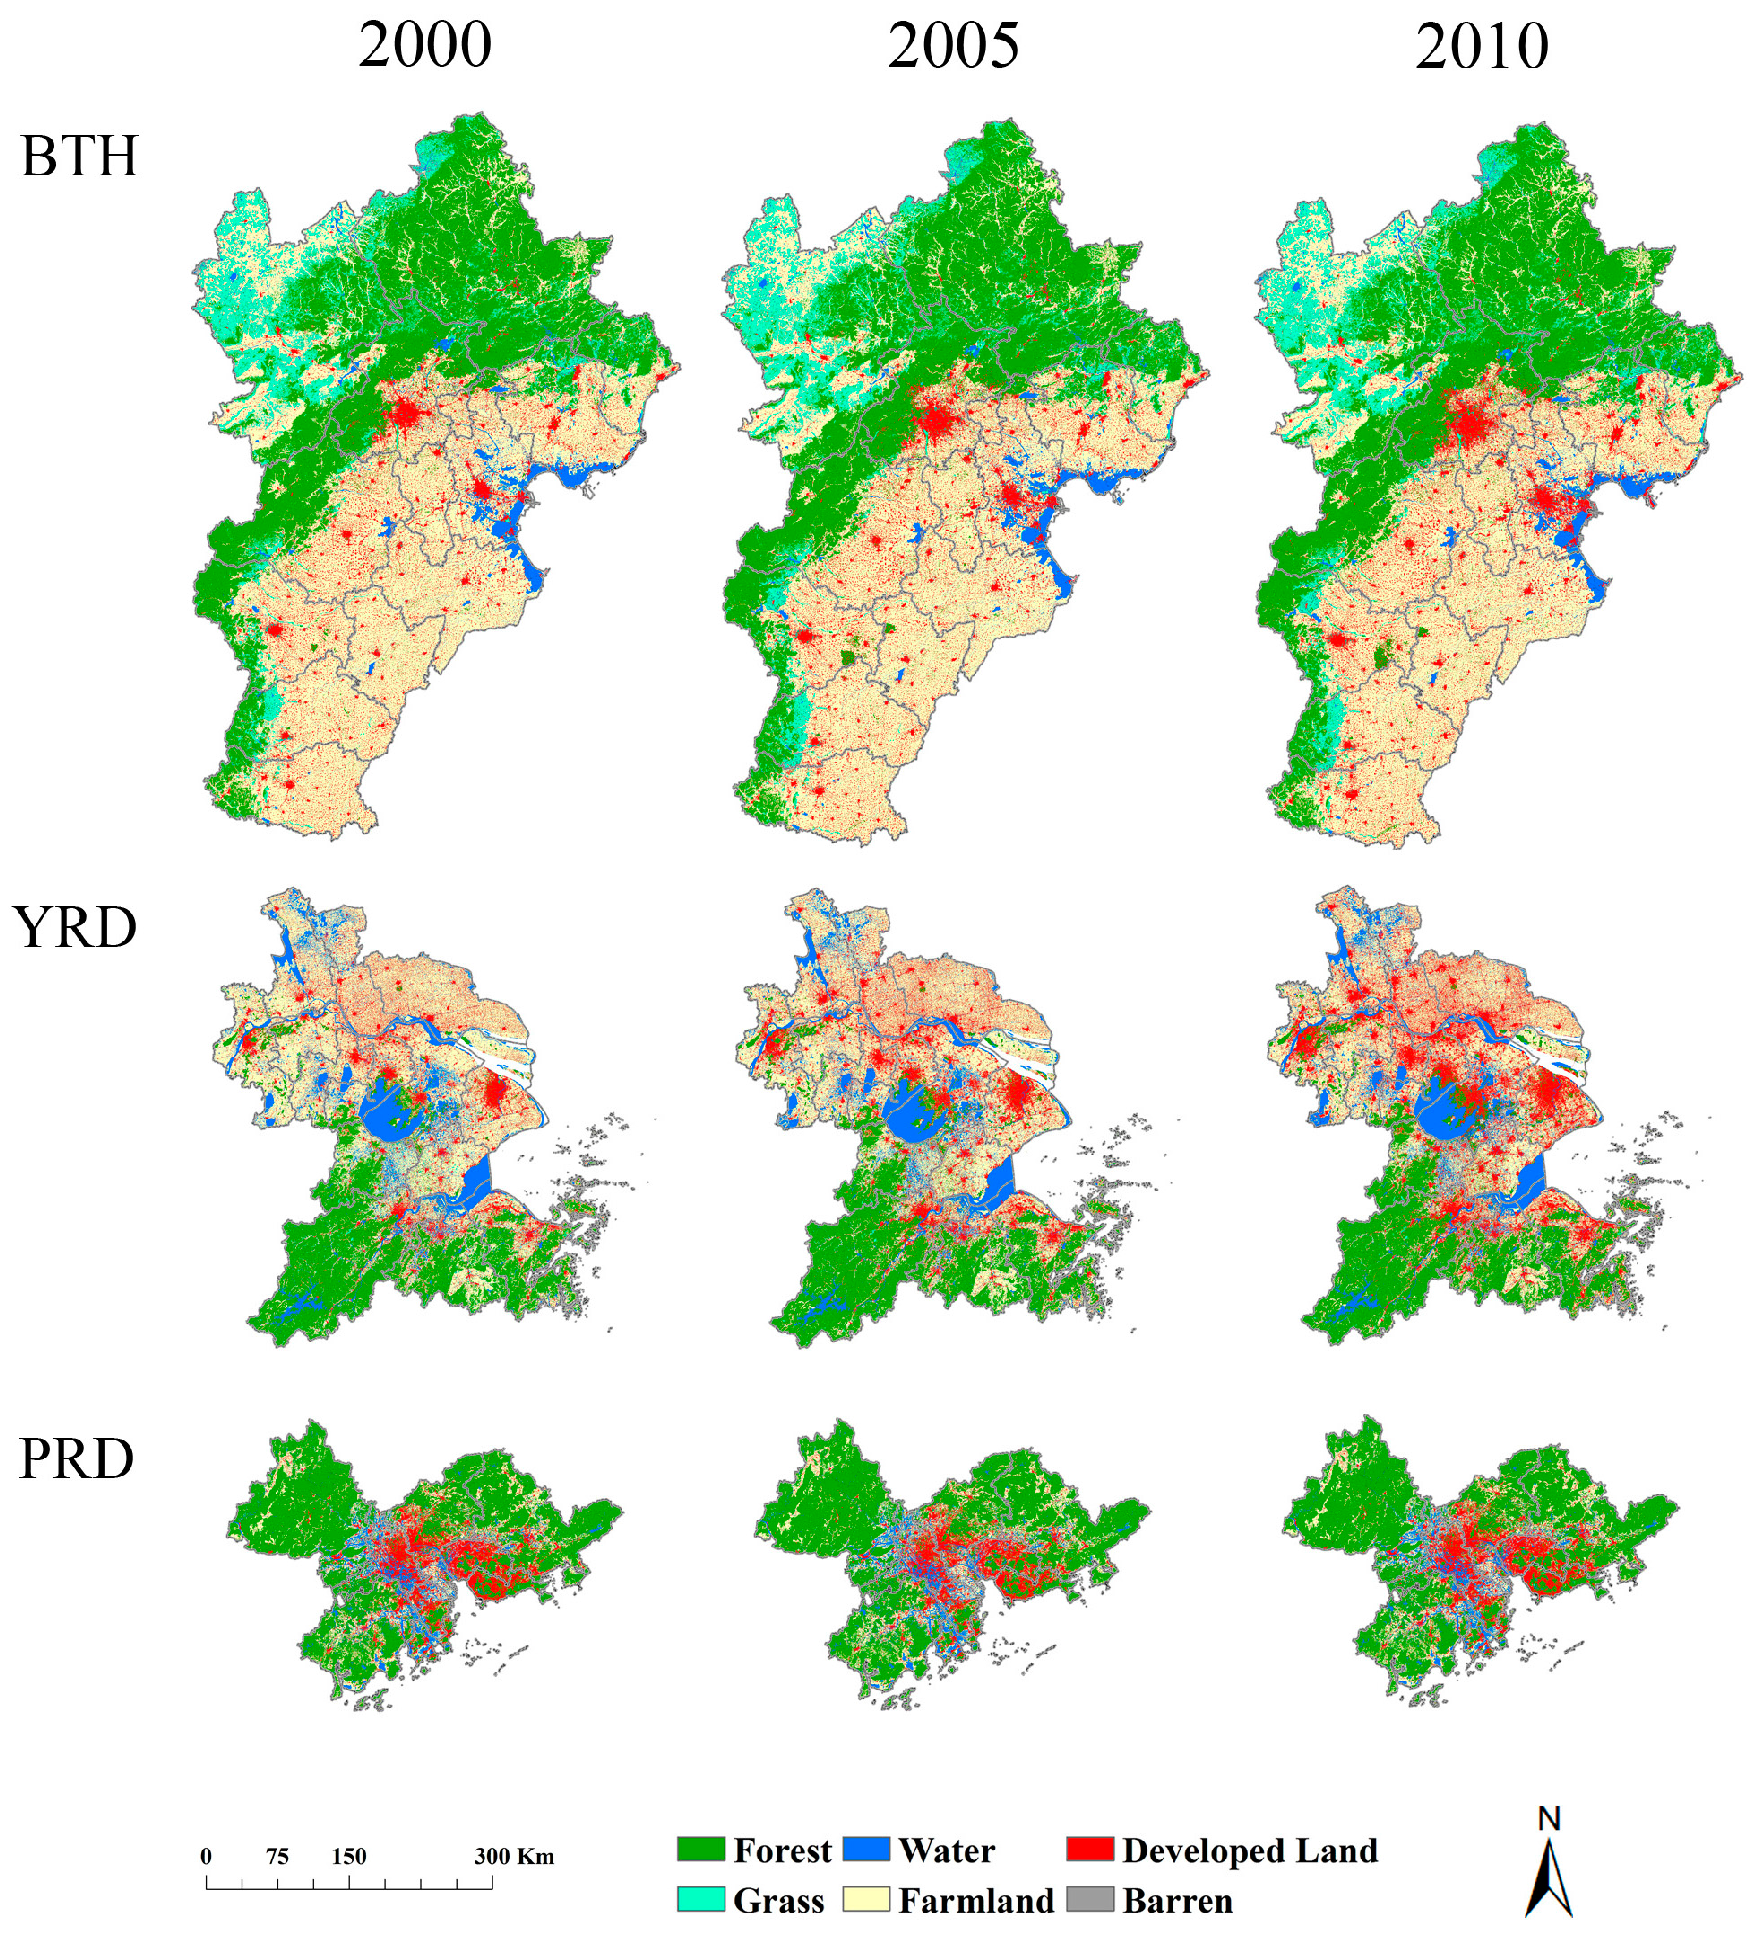
35]. Taking 2005 as an example, the objects with change were first extracted by change vector analysis, and the land cover types of these objects in 2005 were then identified. The objects with no change were backdated as the land cover type of 2010. The LULC classification map of 2000 was also generated by the same procedure (Figure 2). In addition, extensive manual editing was performed to refine the classifications by visually referencing to very high-resolution imagery, including 2.4 m QuickBird and 2.5 m SPOT 5 imagery. The overall accuracy of these three LULC classification maps was over 96%. More details about the classification approach can be found in Yu et al. (2016) [35].

2.3. Typological Quantification for Urban Expansion

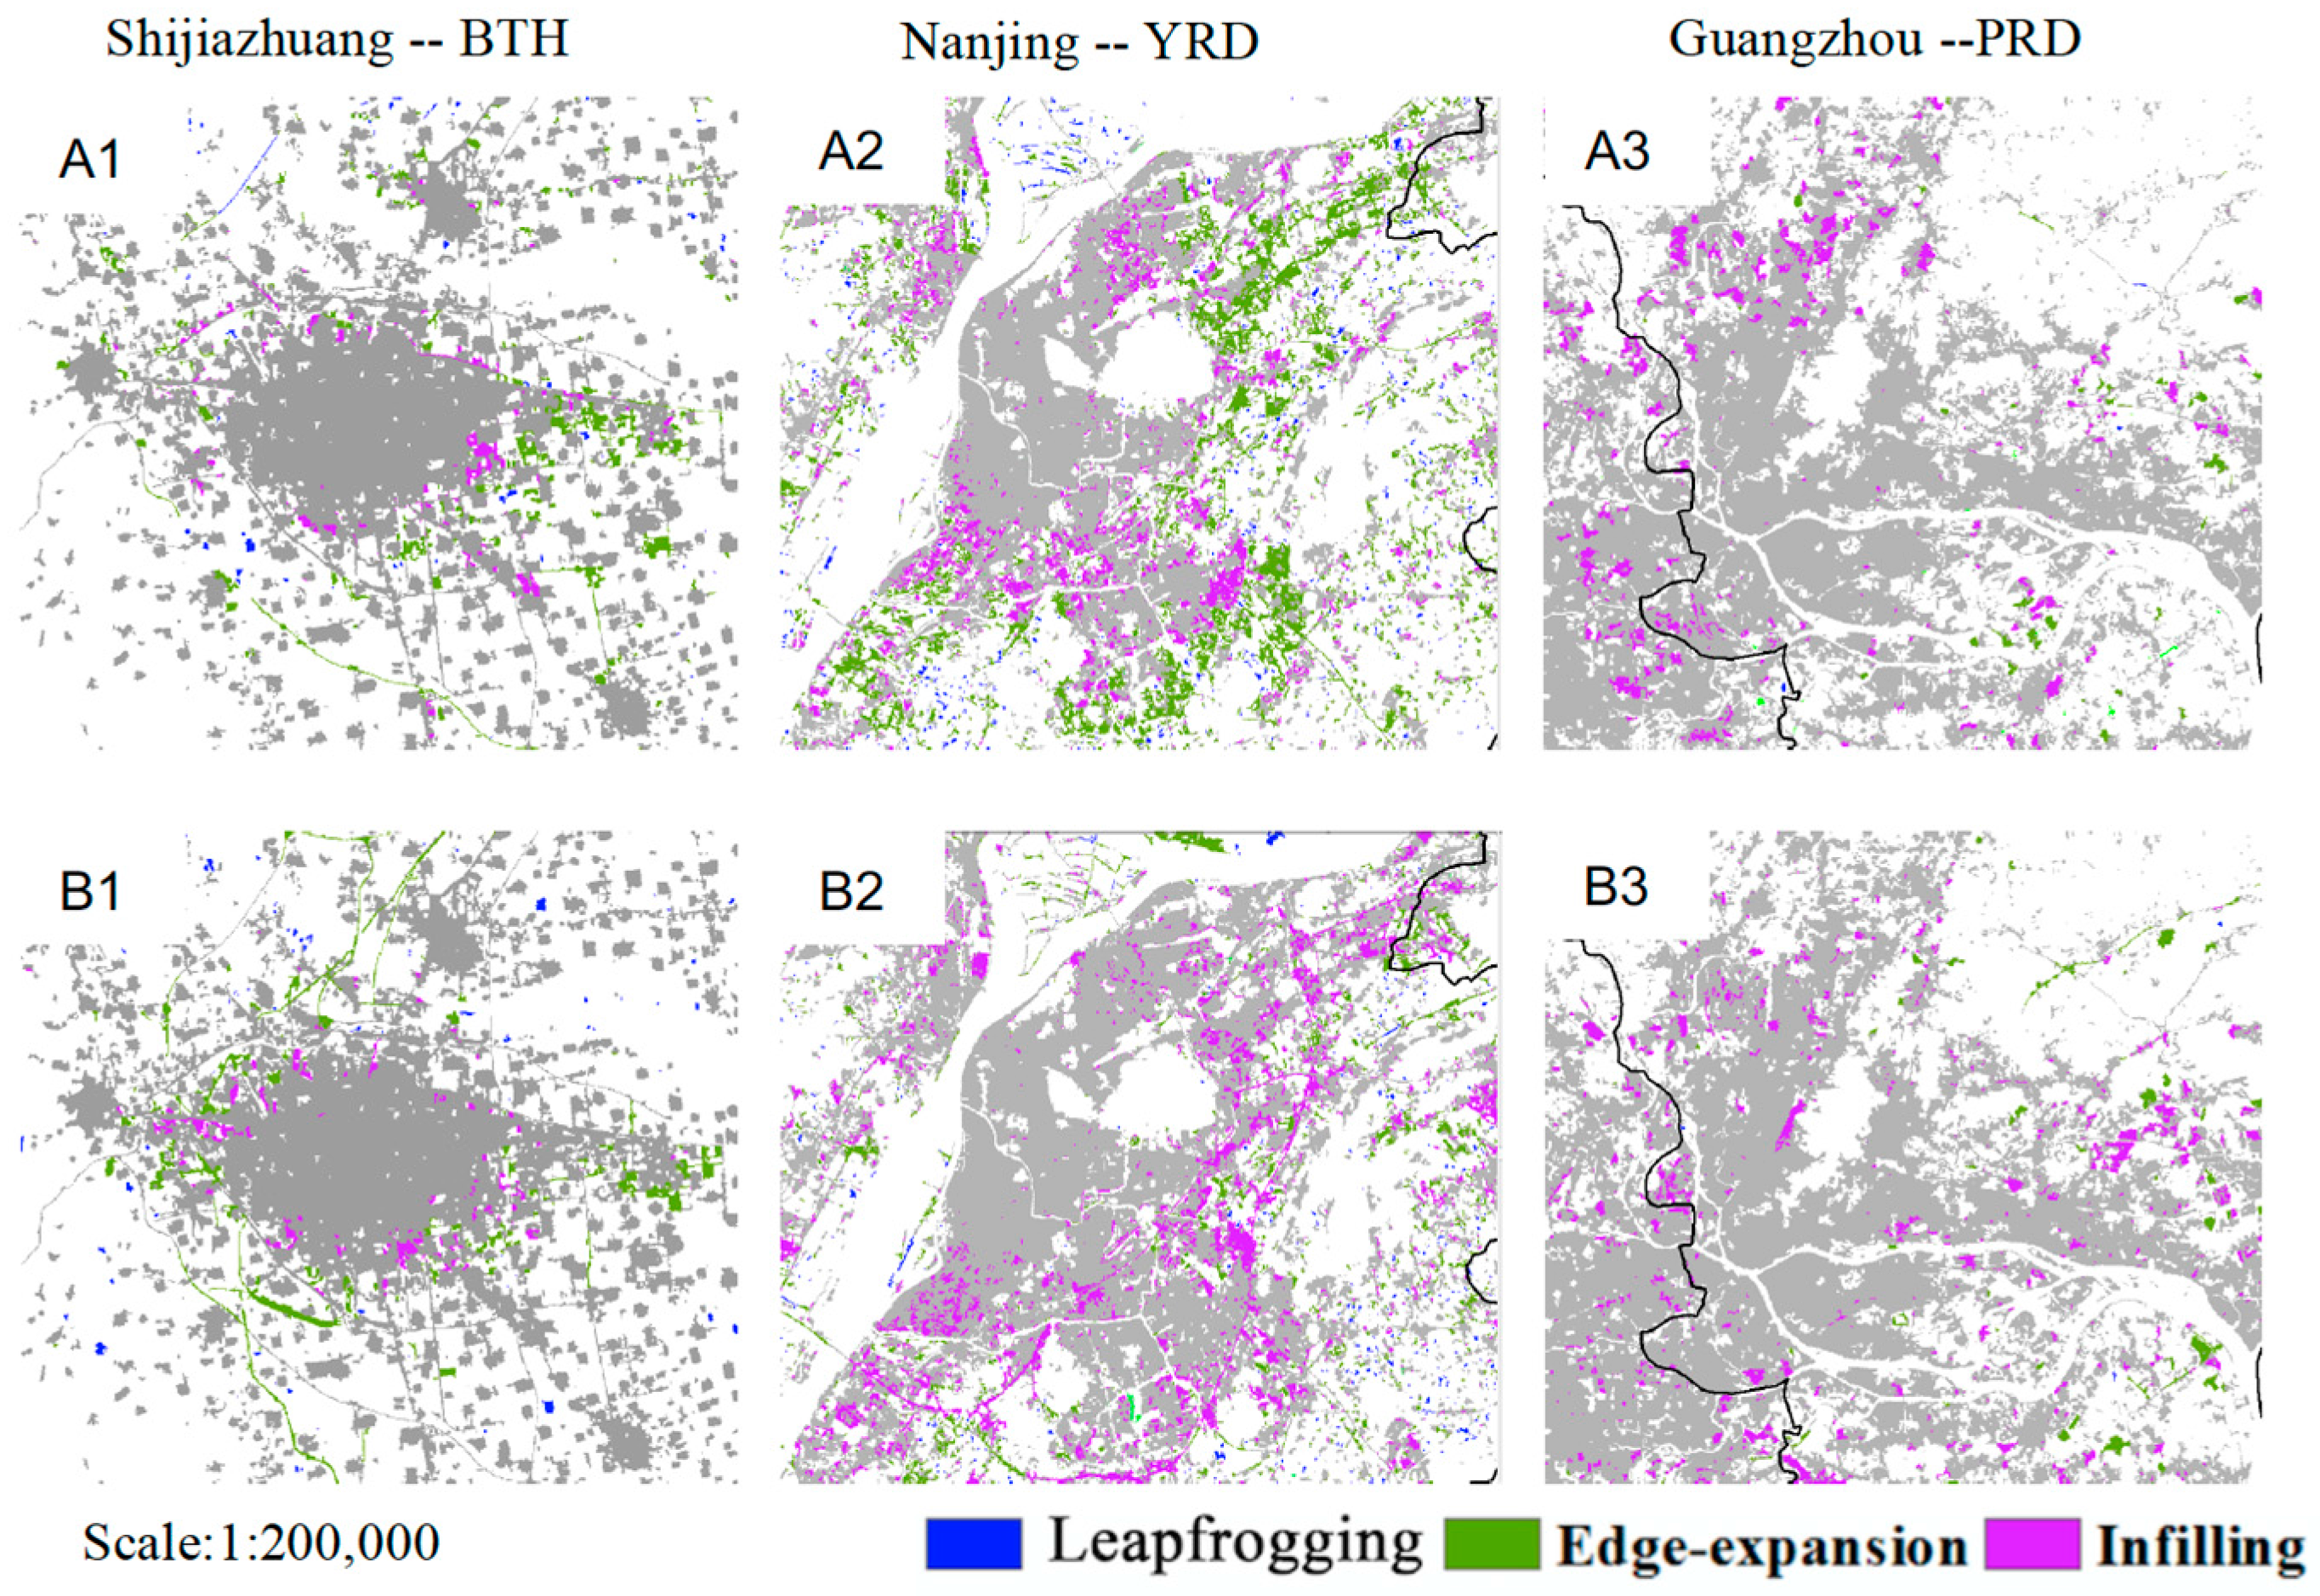
Based on the LULC classification maps, we identified the newly developed land during the two-time periods, that is, 2000–2005 and 2005–2010. This was done by overlapping analysis using LULC classification maps from two years. We further classified the newly developed land into three spatial expansion models—leapfrogging, edge-expansion, and infilling—by following the methods detailed in Xu et al. (2007) [19] and Li et al. (2013) [20]. Specifically, the equations below were used to classify patches of newly developed land:
S = L c / P
{ S = 0   L e a p f r o g g i n g 0 < S 0.5   E d g e E x p a n s i o n 0.5 < S 1   I n f i l l i n g
where Lc represents the shared boundary between a newly developed patch and the previously developed patch(es), and P is the perimeter of the newly developed patch. The spatial expansion models are classified based on the value of S, as specified above.
The LULC classification maps generated by the object-based backdating approach greatly reduce errors on the identification of expansion models. These included isolated patches that were assigned as leapfrogging, but in fact were generated by “salt and pepper” noises. In addition, errors that the sliver patches generated by imagery misregistration were typically classified as edge-expansion were largely reduced. Therefore, the LULC classification approach used in this study is crucial for the typological quantification of urban expansion.

2.4. Statistical Analyses

We used three indicators to quantify and compare the magnitude, relative speed and morphology of urban expansion at both the regional and city scales for the three urban megaregions (Equations (3)–(5)). Specifically, we calculated the area of newly developed land (Equation (3), Anew) to measure the magnitude of urban expansion. The ratio (Equation (4), Pnew), calculated by dividing the area of previously existing developed land by the total area of newly developed land, was used to measure the relative speed of urban expansion. Here, we used a ratio, the P
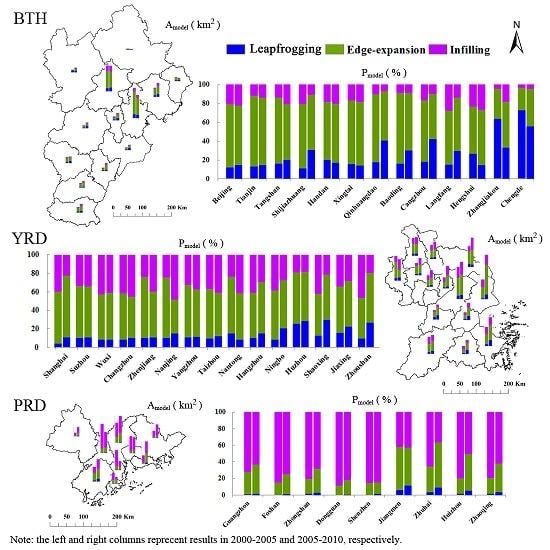
new, to measure the relative speed by accounting for the area of newly developed land relative to the size of the city. Therefore, we could compare the urban expansion speed across cities with different sizes. For the expansion morphology, we calculated the total area, percentage (Equation (5), Pmodel) and patch size distribution for each of the three expansion models.
A new = A t 2 A t 1
P new = ( A new / A starting ) × 100 %
P model = ( A model / A new ) × 100 %
where At1 and At2 represent the total areas of developed land at the prior year (t1) and posterior year (t2), respectively. Astaring represents the area of previously existing developed land and A
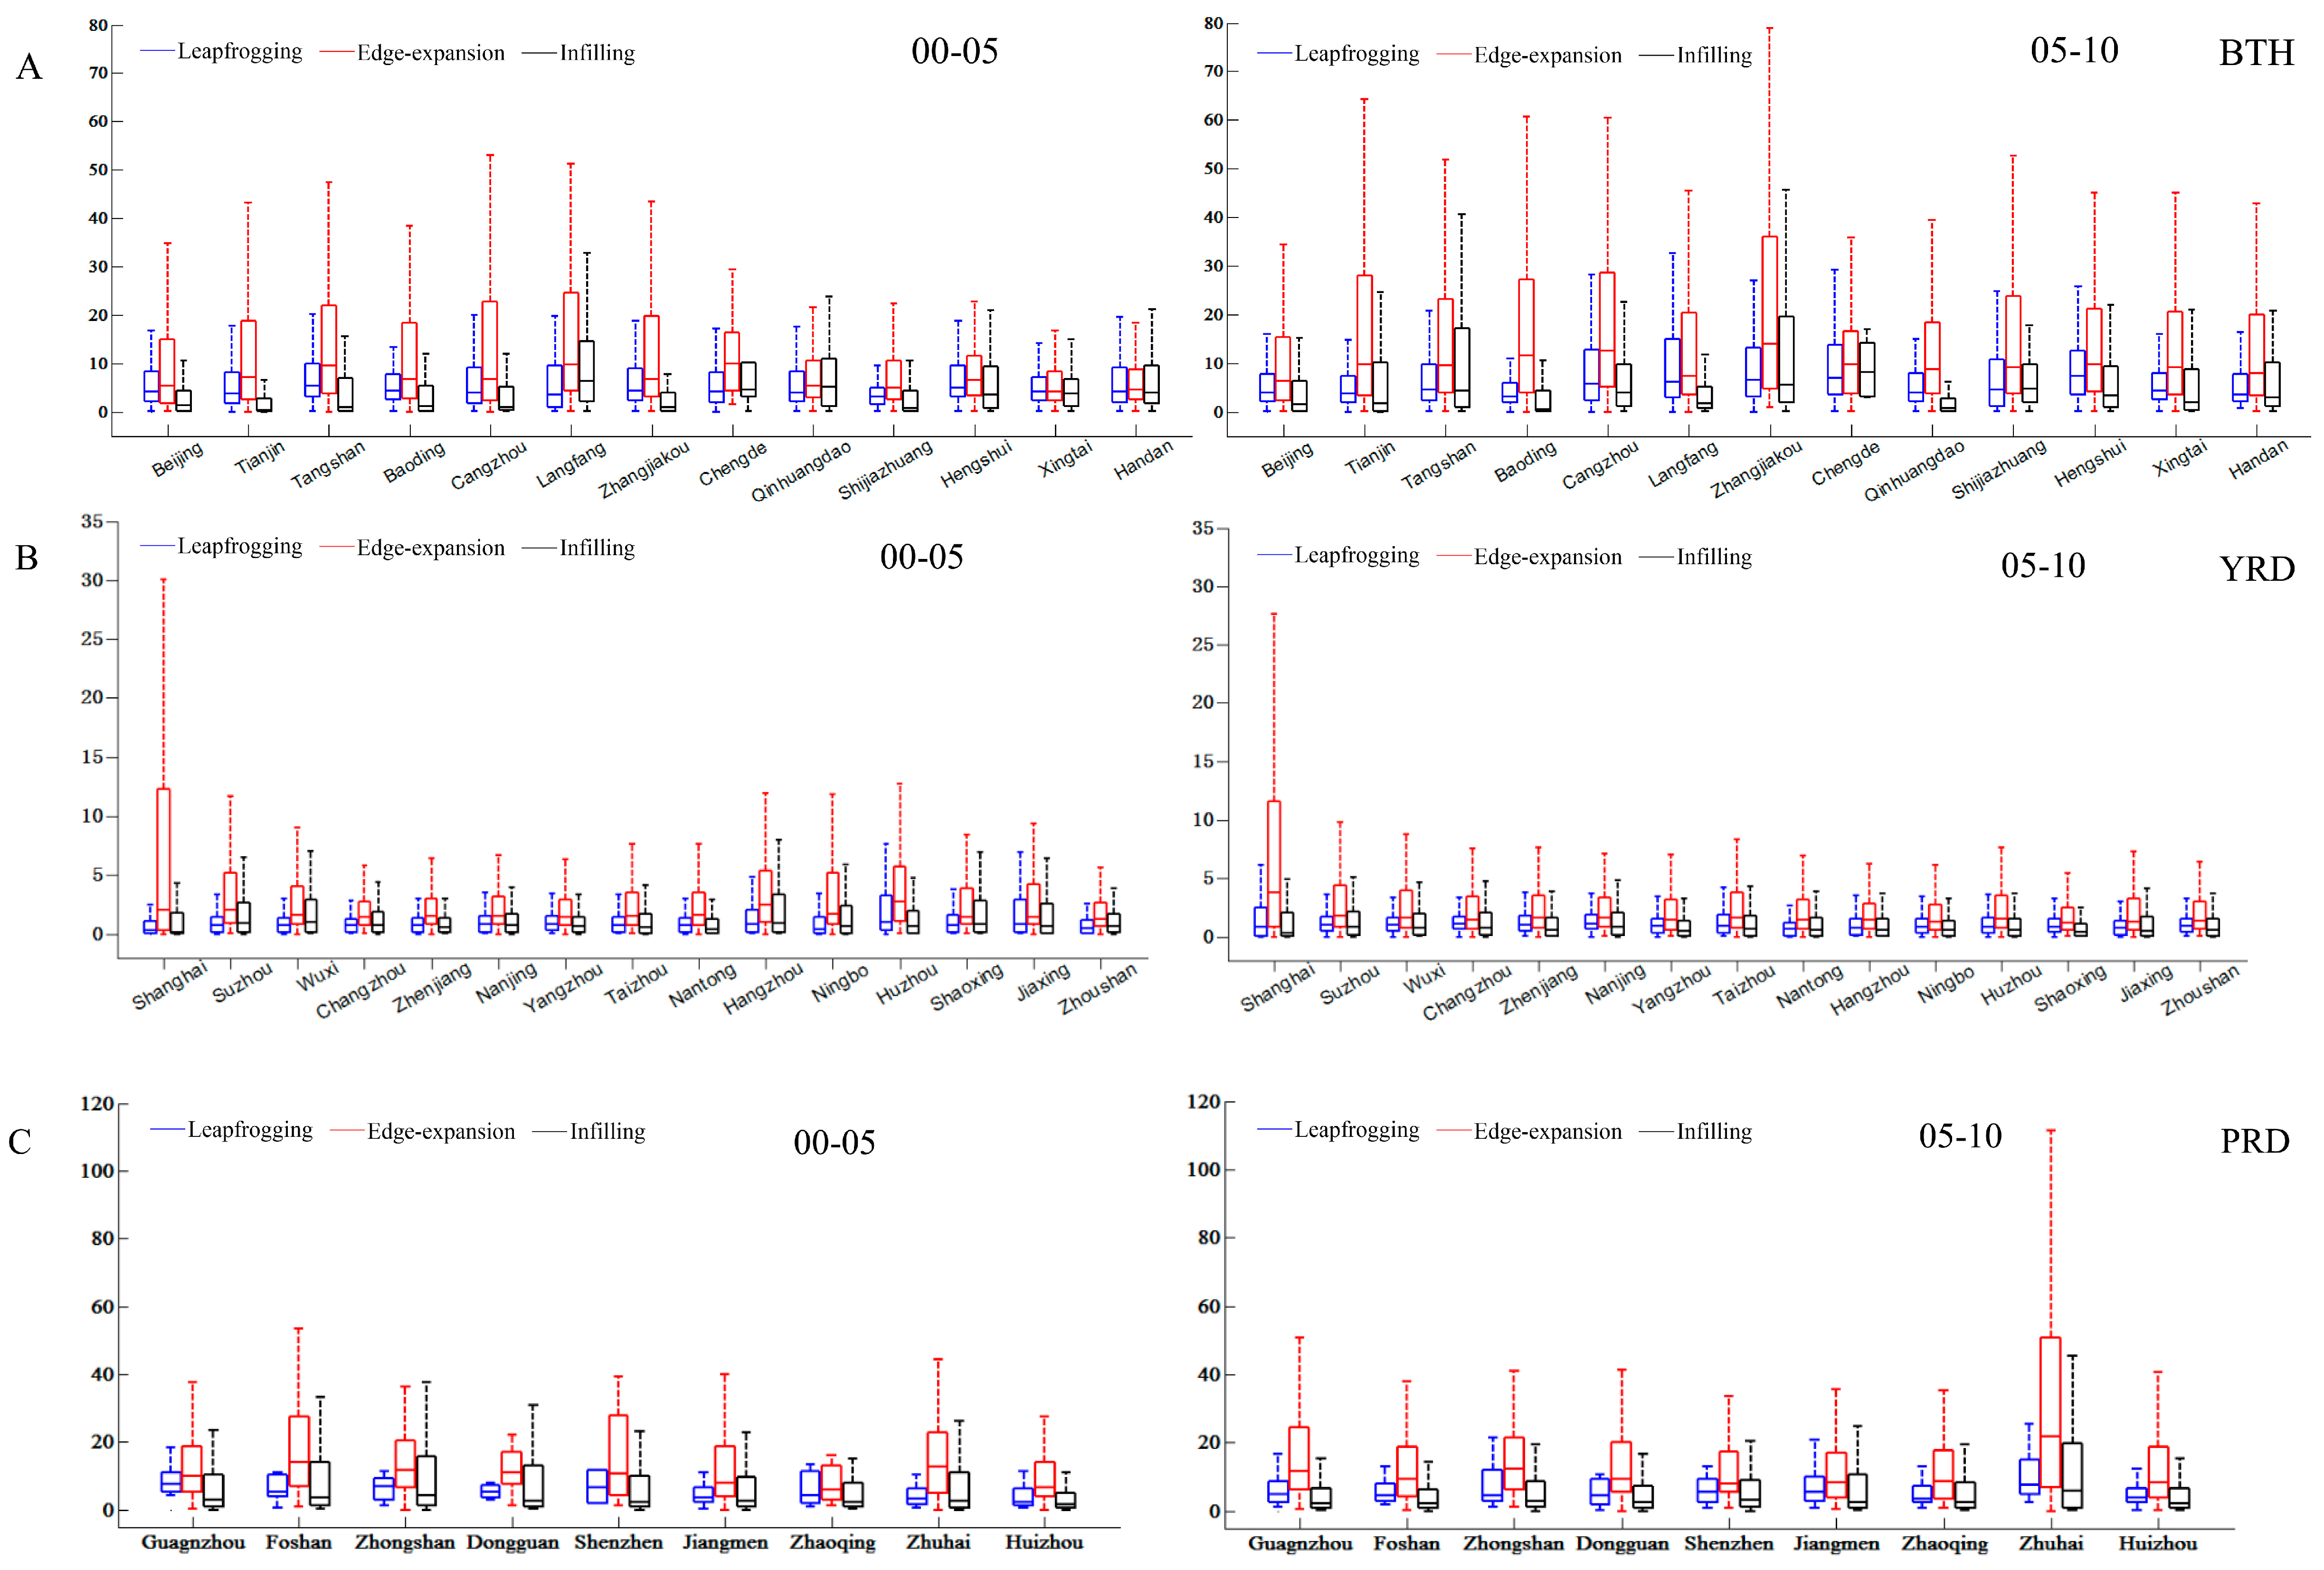
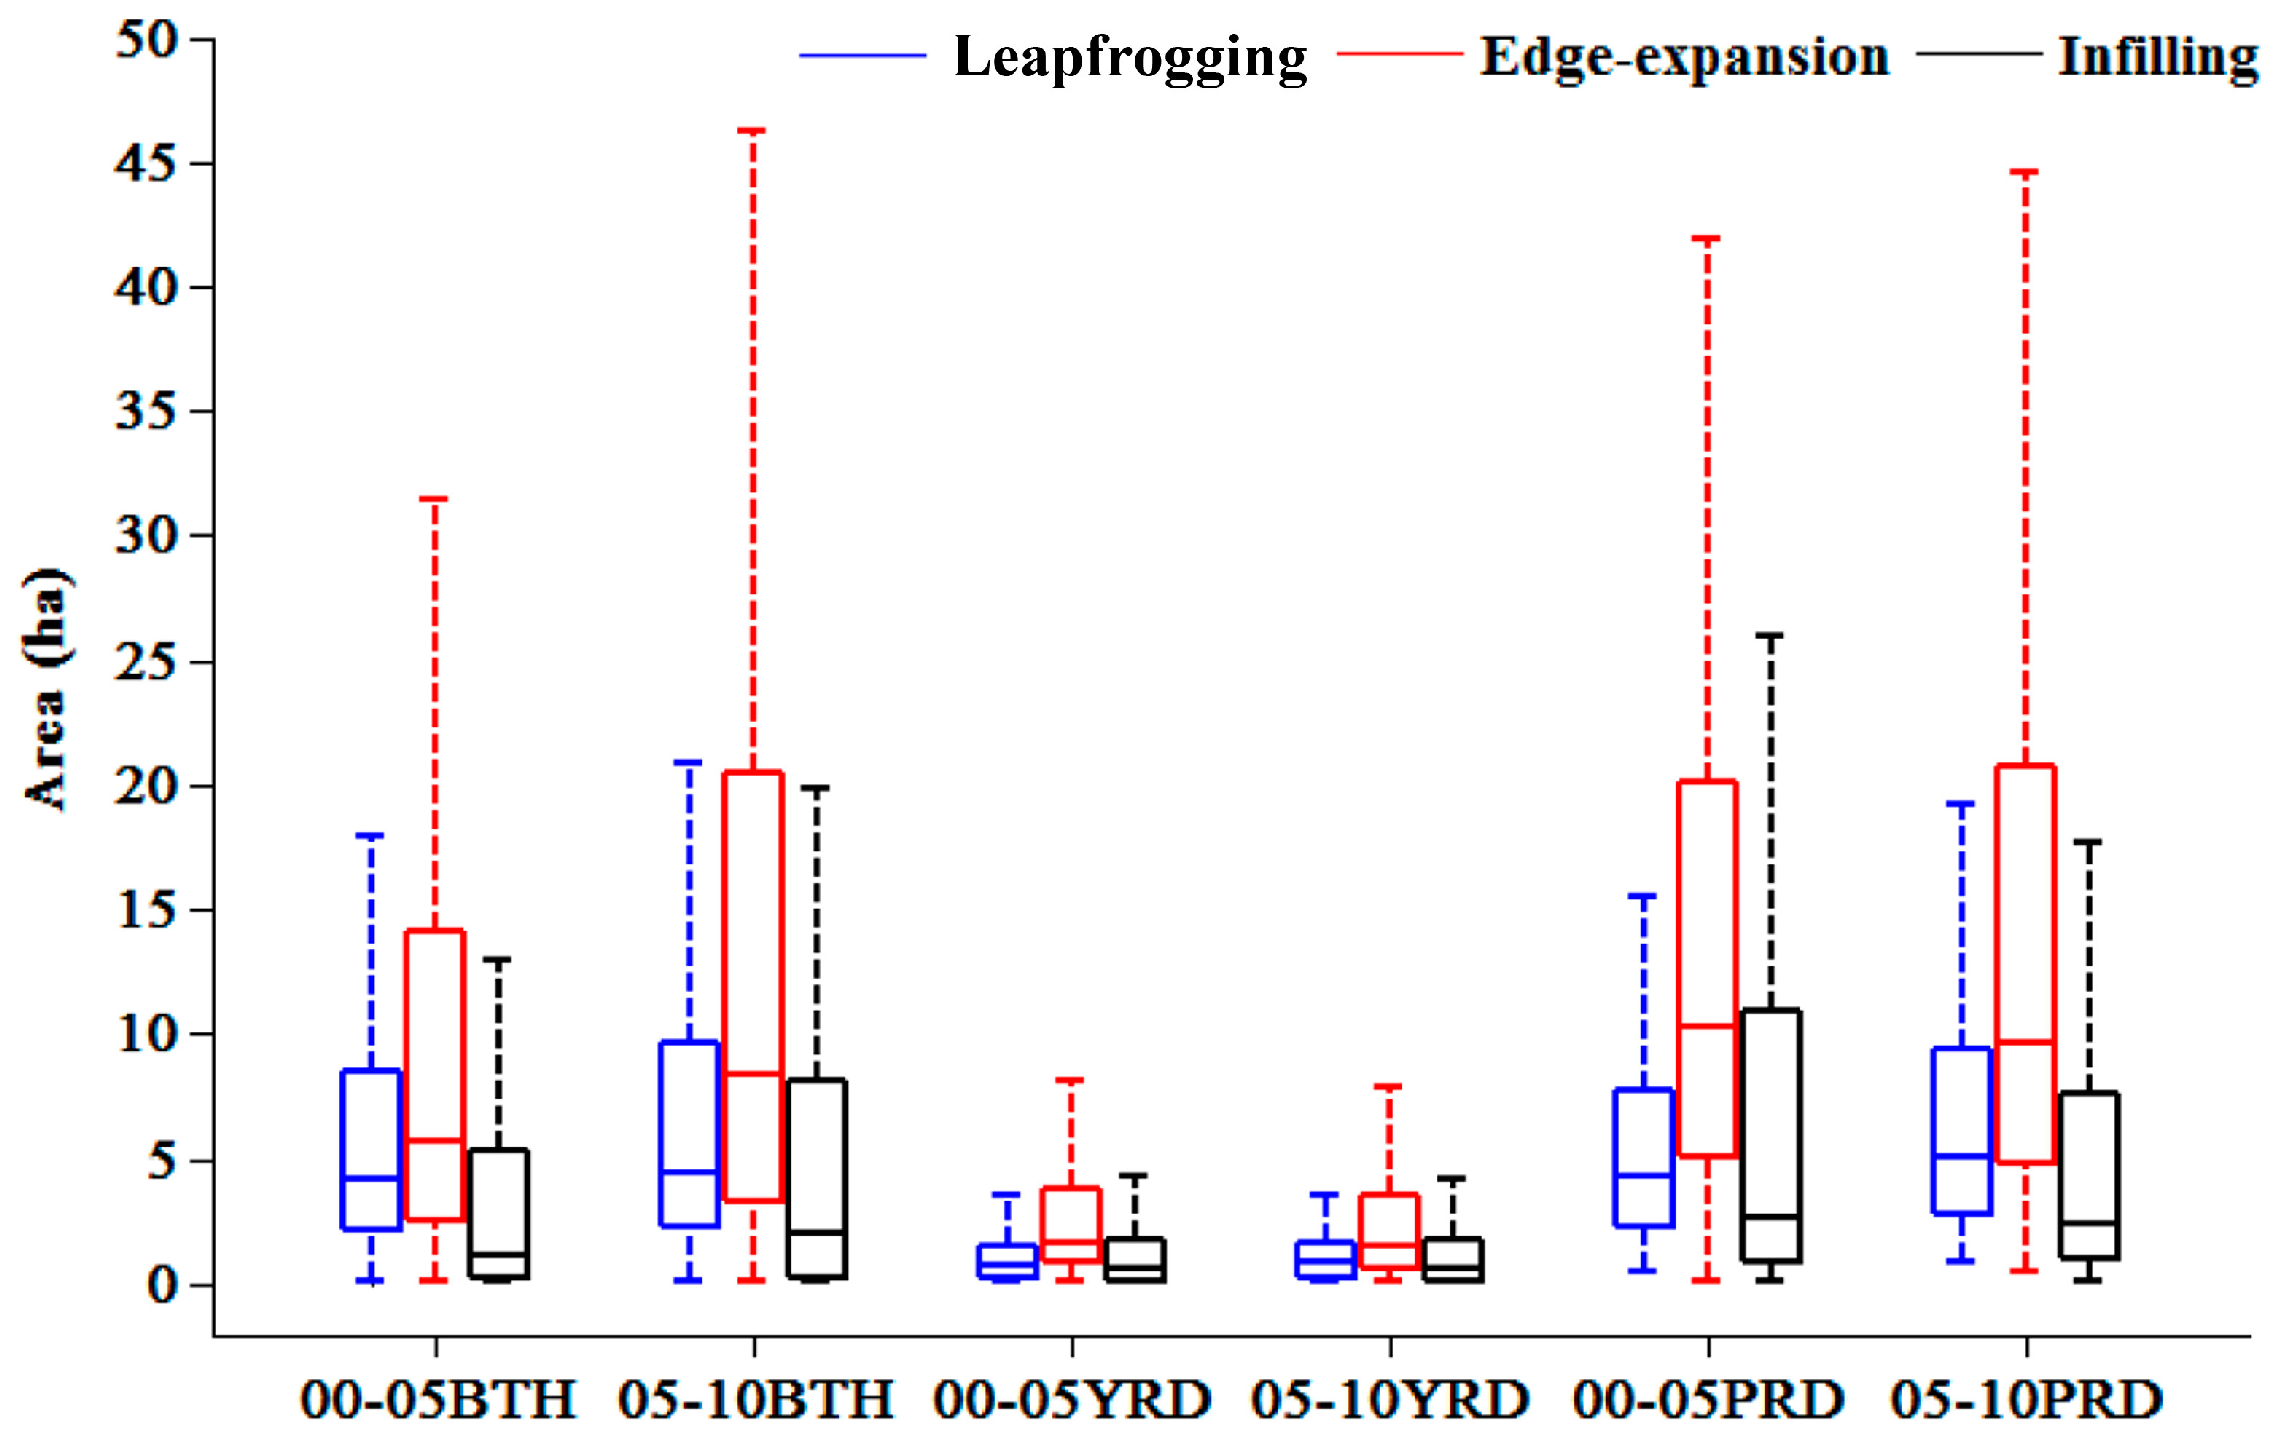
model is the area for each of the three expansion types. Boxplots were used to investigate the size distribution of patches with different types of urban expansion models.
We furthermore examined the effects of city’s characteristics on urban expansion models by a linear-regression method. We chose five typical characteristics as predictors, including city’s location in a particular megaregion, size of city, relative speed of urban expansion, permanent residential population and the percentage of GDP of the tertiary industry or service economy to the total GDP (Table 1). These predictors were selected based on results from previous studies [36,37,38]. As geographical location is a categorical variable, we set the BTH as the reference (i.e., dummy variable), and used nominal variable to distinguish the city location in the YRD and PRD.
Before running the linear-regressions, we examined the strength of bivariate associations between the variables using the Pearson correlation matrix. Results showed that the variables of population and the size of city had a high value of the correlation coefficient, 0.830 and 0.824, in 2000–2005 and 2005–2010, respectively. In addition, the population also had Pearson correlation with the GDP percentage of the tertiary industry, with the value of 0.453 and 0.462. Therefore, the variable of population was not included in the regression model (Table 2).

3. Results

3.1. Spatiotemporal Pattern of Urban Expansion at the Urban Megaregion Scale

The YRD urban megaregion had the most rapid urban expansion in terms of both magnitude (Anew) and relative speed (Pnew) from 2000–2005, and 2005–2010. The BTH had much larger values of Anew than the PRD. However, the values of Pnew in the BTH were smaller than those in the PRD in both the 2000–2005 and 2005–2010 periods (Table 3). While the total areas of newly developed land (i.e., Anew) continued to increase in the three urban megaregions from the first period (i.e., 2000–2005) to the second one (i.e., 2005–2010), the relative speed (Pnew) did not. The values of Pnew kept increasing in the BTH and YRD megaregions, but not in the PRD (Table 3).
As for the alternative urban expansion models, the BTH was dominated by edge-expansion, followed by leapfrogging and infilling. The YRD was also dominated by edge-expansion, but followed by infilling and leapfrogging. In contrast, the PRD was dominated by the infilling model, followed by edge-expansion and leapfrogging (Table 4). From 2000 to 2010, the percentage of leapfrogging increased in all the three urban megaregions. Changes in the proportions of the other two models were similar: the BTH and YRD had a decreased proportion for edge-expansion and an increased value for infilling, while the PRD had opposite results.
The patch size distribution revealed by boxplots showed that the sizes of newly developed patches and their changes varied in different urban megaregions (Figure 3 and Figure 4). The average patch sizes of all the three models in the YRD were much smaller than that in the BTH and PRD. In all the urban megaregions, patches of the edge-expansion models were larger than that of the leapfrogging and infilling in both study periods, whereas patch sizes of the other two types showed different patterns. That is, in the BTH, the leapfrogging patches were consistently larger than the infilling patches, and patch sizes of both models became larger. In contrast, the leapfrogging patches were smaller than the infilling patches in the YRD. In the PRD, the sizes of infilling patches were much larger than the sizes of leapfrogging patches in 2000–2005, but became smaller in 2005–2010.

3.2. Spatiotemporal Pattern of Urban Expansion at the City Scale

The magnitude of urban expansion varied greatly by cities in the BTH urban megaregion (Figure 5A, Table 5). In the two cities of BTH exhibiting the greatest increase in developed land, the increased amounted to 426.97 km2 and 507.84 km2 from 2000–2005, and 423.25 km2 and 390.27 km2 from 2005–2010 in Beijing and Tianjin, respectively. However, in the cities of BTH showing the least growth of developed land, the increased only amount to 51.00 km2 and 14.82 km2 from 2000–2005, and 85.90 km2 and 9.90 km2 from 2005–2010 in Zhangjiakou and Chengde, respectively. In fact, the newly developed land in the BTH urban megaregion clustered around the three large cities, Beijing, Tianjin, and Tangshan. In contrast, much less variation occurred among cities in the YRD and PRD urban megaregions, particularly in the YRD (Figure 5B,C, Table 5). In the BTH, the difference in expansion rate between large cities and small cities became greater from 2000 - 2010. For example, the relative expansion rate of Beijing and Tianjin were 18.20% and 27.87% in 2000–2005, and 14.79% and 18.03% in 2005–2010, respectively, but that of Baoding and Chengde were only 2.56% and 2.24% in 2000–2005, and 5.11% and 1.98% in 2005–2010. Comparatively, the variation of expansion rates of the cities in the YRD and PRD became smaller in 2005–2010 (Table 5).
All the cities, except for Zhangjiakou and Chengde in the BTH urban megaregion were dominated by edge-expansion model in both study periods (Figure 5A). For example, more than 60% of the new patches of developed land were classified as edge-expansion in Beijing. Comparatively, the YRD was dominated by edge-expansion and infilling from 2000–2010. The area percentage of these two models of urban expansion was more than 70%. However, the changes in the expansion model varied greatly from cities in the north to those in south in the YRD. Infilling became more dominant in the northern cities (e.g., Zhenjiang, Nanjing and Taizhou), but in the opposite in the southern cities, such as Hangzhou, Ningbo and Shaoxing (Figure 5B). In the PRD, except for Jiangmen and Zhuhai, the cities were dominated by infilling in both 2000–2005 and 2005–2010. Cities such as Foshan, Zhongshan, and Shenzhen had the area percentage of infilling patches of more than 80% (Figure 5C).
As shown in the boxplot, the edge-expansion patches were larger than patches of the other two types in 2000–2010. Moreover, the patch size tended to be similar for the cities within the same urban megaregion (Figure 6). From 2000–2005, the patch size was larger in the cities close to Beijing and Tianjin than in cities distant from these two major cities. From 2005–2010, difference in patch sizes among the cities in the BTH megaregion became smaller (Figure 6A). In the YRD, the size of newly developed patches for all the three models was smaller in the northern cities than in the southern cities from 2000–2005. However, the difference in size became smaller from 2005–2010 (Figure 6B). Similarly, except for Zhuhai, variations in patch size among the cities in the PRD were large from 2000–2005, but became smaller in 2005–2010 (Figure 6C).

3.3. The Effects of City’s Characteristics on Urban Expansion Models

Results from the linear regression analysis showed that the identity of the megaregion, represented statistically by the variable “geographic location”, was the most significant factor affecting the models of urban expansion of a city. In other words, whether cities were within the same megaregion was the most important factor that influenced the model of urban expansion (Table 6). Specifically, the megaregions that the cities represent had a strong negative effect on the leapfrogging and edge-expansion models, but positive effects on the infilling model. This suggested that the newly developed land patches were more likely to be classified as infilling, but not leapfrogging or edge-expansion in cities located in the YRD and PRD megaregions. Additionally, the coefficient value of CL1 increased with leapfrogging and edge-expansion, but decreased with infilling, indicating the probability of the leapfrogging and edge-expansion for newly developed land patches increased and that of the infilling model decreased in the YRD. CL2, relevant to the PRD, was not a significant predictor for leapfrogging from 2005–2010, and nor edge-expansion from 2000–2005.
The size of city had a significantly negative effect on the leapfrogging model, with the coefficient of −0.012 and −0.011, but no significant effect on the edge-expansion and infilling models from 2000–2010. This indicated that the proportional cover of newly developed patches in a leapfrogging model decreased with the increase of city size. In other words, small-sized cities may be more likely to develop in a leapfrogging model.
The relative speed of urban expansion had a significantly positive effect on the edge-expansion model, with the coefficients of 0.412 and 0.732, but no significant effect on the other two types. These results indicated that the proportional cover of newly developed patches in an edge-expansion model increased with the increase of expansion rate. In other words, cities with relatively rapid expansion tended to grow in an edge-expansion model. TI had no significant effect on all the expansion models, suggesting the percentage of GDP of the tertiary industry to the total GDP did not affect the morphological types of urban expansion (Table 6).

4. Discussion

Our results showed that the extent, rate and morphological model of urban expansion varied greatly by urban megaregions and cities. We found larger cities tended to have more newly developed land and develop at a relatively rapid rate, which is consistent with findings from previous studies [12,25]. We also found that in the YRD megaregion, the smaller cities had larger annual rates of urban expansion, which is similar to some Asian cities that had small size but experienced more rapid urbanization [39,40,41]. Similar to the results at the city scale, at the regional scale, the two urban megaregions, YRD and PRD that had higher proportional cover of developed land in 2000, and expanded more rapidly than the BTH megaregion from 2000–2010 (Table 3). The difference in magnitude and speed of urban expansion at the regional scale are likely due to the regions being in different phases of urban growth, in combination with the different terrain and geomorphology of the three urban megaregions [37,42,43].
Population and the size of city had strong positive correlation revealed by the Pearson correlation analysis, suggesting the size of city increased with the growth of population in 2000–2010 (Table 2). Previous studies have showed that the residential population mostly had a significant increase trend at the city level from 2000–2010 across the nation [44,45], along with increase of developed land [46,47]. These correlations generally support some previous findings that urban expansion is largely driven by population growth [46,47].
As for morphological models of urban expansion, small-sized cities were more likely to develop in a leapfrogging model, while cities with relatively rapid expansion tended to grow in an edge-expansion model (Table 6). These results suggested that the expansion of the cities of the three urban megaregions also followed the “diffusion and coalescence” hypothesis [17,19,28]; that is, in the early stage of urban expansion, leapfrogging generally is the dominant model, while the edge-expansion model dominates in the rapid expansion stage, and infilling becomes the major mode of expansion in the stable stage. When a city is in its early stage, numerous new towns are built, resulting in a lot of leapfrogging patches. After that, the city is likely undergone rapid expansion, typically associated with a fast increasing of outward expansion from the previously created leapfrogging patches. Lately, these growing patches merge with the neighbor ones, and become larger edge-expansion patches. Consequently, following the expansion processes, the city size mostly had the negative effect on the leapfrogging model, and relative speed had positive effect of edge-expansion type (Table 6).
At the regional scale, the dominant type of morphological models of urban expansion were different among the three urban megaregions. The two relatively well-developed urban megaregions, YRD and PRD, were dominated by expansion of infilling, while the BTH was still dominated by edge-expansion. Therefore, similar to cities, expansion in entire urban megaregions also followed the “diffusion and coalescence” processes, even though the urban megaregions consisted of cities in different phases of individual-city diffusion/coalescence development. Additionally, the differences in the patch size of newly developed land among cities having different sizes in the same urban megaregion became smaller, indicating that urbanization at the regional scale tends to homogenize patch dynamics of the developed landscape (Figure 6A–C). These results, though at the regional scale, were consistent with findings from previous studies that were conducted at the city scale, showing that patch structure of the landscape becomes similar with urban megaregion development [12,48,49]. As previous studies have been mostly conducted at the city scale, our results can enhance understanding on how urbanization may lead to homogenization of urban landscapes at the regional scale.
Except for a few cities in the PRD urban megaregion, cities in the three urban megaregions were mostly dominated by growth of edge-expansion and leapfrogging, which may be linked with urban sprawl, or low land efficiency [15,50]. It is widely recognized that urban sprawl may lead to not only environmental and ecological issues (e.g., loss of open space and wildlife habitat, increased surface runoff and flooding, and air pollution) but also social problems and health issues (e.g., increased expenditure in public services and thus taxes, increasing traffic congestion and obesity [51,52,53,54]. Therefore, whether and how these different types of morphological models or urban growth affect the environmental and ecological quality warrants further research.
In this study, we only focus on the spatiotemporal pattern in 2000–2010 based on LULC maps of three time slices (i.e., 2000, 2005, and 2010). It would be interesting to have longer term observation on the developedment of urban megaregion. Additionally, the identification of urban expansion morphology will be affected by the interval of data collection/observation. The size and the expansion model of the newly developed land patches may change when uesing datasets with different time-interval. For example, a patch is identified as leapfrogging when using data from two adjecent year, but may be classified as edge-expansion if using data with five-year interval. Therefore, it would be interesting to explore the method for spatiotemporal pattern of urban expansion.

5. Conclusions

Urban megaregions have emerged as a new form of urbanization. However, previous studies have mostly focused on urban expansion at the city scale, particular large cities. Here, we focused on the three largest urban megaregions in China, Beijing-Tianjin-Hebei (BTH), the Yangtze River Delta (YRD) and the Pearl River Delta (PRD), and investigated how the extent, rate, and morphological model of urban expansion varied at both the regional and city scales. Furthermore, we indicated how factors such as the locations, the size of the city and its expansion rate influenced the model of urban expansion.
We found that (1) the three urban megaregions experienced very rapid and massive urban growth but the spatiotemporal pattern of urban expansion varied greatly. The most well-developed megaregion, the PRD, had the highest proportion of infilling type of urban expansion. The PRD was dominated by peri-urban infilling and edge-expansion distributed across the towns close to the cities, representing an intermediate development model. The BTH, especially the Beijing-Tianjin corridor, however, had lots of big new towns mostly resulted in leapfrogging development, representing the initial expansion stage. The patch structure of the landscape of the cities having different size in the same urban megaregion tend to be homogenized along with the regional urbanization; (2) The size of a city and its expansion rate also affected the model of urban expansion. Small-sized cities were more likely to develop in a leapfrogging model, while cities with relatively rapid expansion tended to grow in an edge-expansion model.
The findings from our study reveal the urban growth process in urban megaregion. It provides not only the reference for those regions that have potential to be urban megaregions, but also supports for urban megaregion planning and management. As urban morphology closely relates to some environmental and ecological issues, we also recommend future research to investigate whether and how these different types of morphological models of urban growth affect land use efficiency, and environmental and ecological quality.

Acknowledgments

This research was funded by the National Natural Science Foundation of China (Grant No. 41590841), the project “Developing key technologies for establishing ecological security patterns at the Beijing-Tianjin-Hebei urban megaregion” of the National Key Research and Development Program (2016YFC0503004), Key Research Program of Frontier Sciences, CAS (QYZDB-SSW-DQC034) and One Hundred Talents Program of the Chinese Academy of Sciences. We would like to thank Steward T.A. Pickett, who works in Carry Institute of Ecosystem Studies, for the comments and the language improvement. We also want to thank the three anonymous reviewers for their suggestions that helped us to improve the manuscript.

Author Contributions

Wenjuan Yu and Weiqi Zhou designed and performed this research. In addition, Wenjuan Yu and Weiqi Zhou analyzed the data and wrote the paper together.

Conflicts of Interest

The authors declare that there is no conflict of interest.

References

  1. Grimm, N.B.; Faeth, S.H.; Golubiewski, N.E.; Redman, C.L.; Wu, J.G.; Bai, X.M.; Briggs, J.M. Global change and the ecology of cities. Science 2008, 319, 756–760. [Google Scholar] [CrossRef] [PubMed]
  2. Wu, J.G. Urban sustainability: An inevitable goal of landscape research. Landsc. Ecol. 2010, 25, 1–4. [Google Scholar] [CrossRef]
  3. Pickett, S.T.A.; Cadenasso, M.L.; Grove, J.M.; Boone, C.G.; Groffman, P.M.; Irwin, E.; Kaushal, S.S.; Marshall, V.; McGrath, B.P.; Nilon, C.H.; et al. Urban ecological systems: Scientific foundations and a decade of progress. J. Environ. Manag. 2011, 92, 331–362. [Google Scholar] [CrossRef] [PubMed]
  4. Forman, R.T.T.; Wu, J. Where to put the next billion people. Nature 2016, 537, 608–611. [Google Scholar] [CrossRef] [PubMed]
  5. Zhou, W.Q.; Qian, Y.G.; Li, X.M.; Li, W.F.; Han, L.J. Relationships between land cover and surface urban heat island: Seasonal variability and effects of spatial and thematic resolution of land cover data on predicting land surface temperature. Landsc. Ecol. 2014, 29, 153–167. [Google Scholar] [CrossRef]
  6. Grimm, N.B.; Foster, D.; Groffman, P.; Grove, J.M.; Hopkinson, C.S.; Nadelhoffer, K.J.; Pataki, D.E.; Peters, D.P.C. The changing landscape: Ecosystem responses to urbanization and pollution across climatic and societal gradients. Front. Ecol. Environ. 2008, 6, 264–272. [Google Scholar] [CrossRef]
  7. Han, L.J.; Zhou, W.Q.; Li, W.F. Increasing impact of urban fine particles (pm2.5) on areas surrounding Chinese cities. Sci. Rep. 2015. [Google Scholar] [CrossRef] [PubMed]
  8. Turner, M.G.; Gardner, R.H.; O’Neill, R.V. Landscape Ecology in Theory and Practice: Pattern and Process; Springer: New York, NY, USA, 2001. [Google Scholar]
  9. Wu, J.G.; Hobbs, R. Key issues and research priorities in landscape ecology: An idiosyncratic synthesis. Landsc. Ecol. 2002, 17, 355–365. [Google Scholar] [CrossRef]
  10. Zhou, W.Q.; Pickett, S.T.A.; Cadenasso, M.L. Shifting concepts of urban spatial heterogeneity and their implications for sustainability. Landsc. Ecol. 2016. [Google Scholar] [CrossRef]
  11. Kuang, W.H.; Chi, W.F.; Lu, D.S.; Dou, Y.Y. A comparative analysis of megacity expansions in china and the U.S.: Patterns, rates and driving forces. Landsc. Urban Plan. 2014, 132, 121–135. [Google Scholar] [CrossRef]
  12. Zhao, S.; Zhou, D.; Zhu, C.; Qu, W.; Zhao, J.; Sun, Y.; Huang, D.; Wu, W.; Liu, S. Rates and patterns of urban expansion in china’s 32 major cities over the past three decades. Landsc. Ecol. 2015, 30, 1541–1559. [Google Scholar] [CrossRef]
  13. Weng, Y.C. Spatiotemporal changes of landscape pattern in response to urbanization. Landsc. Urban Plan. 2007, 81, 341–353. [Google Scholar] [CrossRef]
  14. Luck, M.; Wu, J.G. A gradient analysis of urban landscape pattern: A case study from the phoenix metropolitan region, Arizona, USA. Landsc. Ecol. 2002, 17, 327–339. [Google Scholar] [CrossRef]
  15. Schneider, A.; Woodcock, C.E. Compact, dispersed, fragmented, extensive? A comparison of urban growth in twenty-five global cities using remotely sensed data, pattern metrics and census information. Urban Stud. 2008, 45, 659–692. [Google Scholar] [CrossRef]
  16. Forman, R.T.T. Land Mosaics: The Ecology of Landscape and Region; Cambridge University Press: Cambridge, UK, 1995. [Google Scholar]
  17. Dietzel, C.; Herold, M.; Hemphill, J.J.; Clarke, K.C. Spatio-temporal dynamics in California’s central valley: Empirical links to urban theory. Int. J. Geogr. Inf. Sci. 2005, 19, 175–195. [Google Scholar] [CrossRef]
  18. Forman, R.T.T. Urban Ecology: Science of Cities; Cambridge University Press: Cambridge, NY, USA, 2014. [Google Scholar]
  19. Xu, C.; Liu, M.S.; Zhang, C.; An, S.Q.; Yu, W.; Chen, J.M. The spatiotemporal dynamics of rapid urban growth in the Nanjing metropolitan region of china. Landsc. Ecol. 2007, 22, 925–937. [Google Scholar] [CrossRef]
  20. Li, C.; Li, J.X.; Wu, J.G. Quantifying the speed, growth modes, and landscape pattern changes of urbanization: A hierarchical patch dynamics approach. Landsc. Ecol. 2013, 28, 1875–1888. [Google Scholar] [CrossRef]
  21. Sun, C.; Wu, Z.F.; Lv, Z.Q.; Yao, N.; Wei, J.B. Quantifying different types of urban growth and the change dynamic in guangzhou using multi-temporal remote sensing data. Int. J. Appl. Earth Observ. Geoinform. 2013, 21, 409–417. [Google Scholar] [CrossRef]
  22. Deng, J.S.; Wang, K.; Hong, Y.; Qi, J.G. Spatio-temporal dynamics and evolution of land use change and landscape pattern in response to rapid urbanization. Landsc. Urban Plan. 2009, 92, 187–198. [Google Scholar] [CrossRef]
  23. Jensen, J.R.; Cowen, D.C. Remote sensing of urban/suburban infrastructure and socio-economic attributes. Photogramm. Eng. Remote Sens. 1999, 65, 611–622. [Google Scholar]
  24. Yin, J.; Yin, Z.E.; Zhong, H.D.; Xu, S.Y.; Hu, X.M.; Wang, J.; Wu, J.P. Monitoring urban expansion and land use/land cover changes of shanghai metropolitan area during the transitional economy (1979–2009) in China. Environ. Monit. Assess. 2011, 177, 609–621. [Google Scholar] [CrossRef] [PubMed]
  25. Schneider, A.; Mertes, C.M. Expansion and growth in Chinese cities, 1978–2010. Environ. Res. Lett. 2014, 9, 69–75. [Google Scholar] [CrossRef]
  26. Wu, J.; Jenerette, G.D.; Buyantuyev, A.; Redman, C.L. Quantifying spatiotemporal patterns of urbanization: The case of the two fastest growing metropolitan regions in the United States. Ecol. Complex 2011, 8, 1–8. [Google Scholar] [CrossRef]
  27. Jenerette, G.D.; Wu, J.G. Analysis and simulation of land-use change in the central Arizona-phoenix region, USA. Landsc. Ecol. 2001, 16, 611–626. [Google Scholar] [CrossRef]
  28. Shi, Y.Q.; Sun, X.; Zhu, X.D.; Li, Y.F.; Mei, L.Y. Characterizing growth types and analyzing growth density distribution in response to urban growth patterns in peri-urban areas of Lianyungang city. Landsc. Urban Plan. 2012, 105, 425–433. [Google Scholar] [CrossRef]
  29. Seto, K.C.; Fragkias, M. Quantifying spatiotemporal patterns of urban land-use change in four cities of china with time series landscape metrics. Landsc. Ecol. 2005, 20, 871–888. [Google Scholar] [CrossRef]
  30. Tian, G.J.; Jiang, J.; Yang, Z.F.; Zhang, Y.Q. The urban growth, size distribution and spatio-temporal dynamic pattern of the Yangtze River delta megalopolitan region, china. Ecol. Model. 2011, 222, 865–878. [Google Scholar] [CrossRef]
  31. Pickett, S.T.A.; Zhou, W. Global urbanization as a shifting context for applying ecological science toward the sustainable city. Ecosyst. Health Sustain. 2015, 1, 1–15. [Google Scholar] [CrossRef]
  32. Brugmans, G.; Buijs, S.; Tan, W.; Tunas, D. Megacities: Exploring a Sustainable Future; 010 Publishers: Rotterdam, The Netherlands, 2010. [Google Scholar]
  33. Seto, K.C.; Reenberg, A.; Boone, C.G.; Fragkias, M.; Haase, D.; Langanke, T.; Marcotullio, P.; Munroe, D.K.; Olah, B.; Simon, D. Urban land teleconnections and sustainability. Proc. Natl. Acad. Sci. USA 2012, 109, 7687–7692. [Google Scholar] [CrossRef] [PubMed]
  34. UN-HABITAT. State of the World’s Cities 2010/2011: Bridging the Urban Divide; Earthscan: London, UK, 2008. [Google Scholar]
  35. Yu, W.J.; Zhou, W.Q.; Qian, Y.G.; Yan, J.L. A new approach for land cover classification and change analysis: Integrating backdating and an object-based method. Remote Sens. Environ. 2016, 177, 37–47. [Google Scholar] [CrossRef]
  36. Seto, K.C.; Fragkias, M.; Guneralp, B.; Reilly, M.K. A meta-analysis of global urban land expansion. PLoS ONE 2011, 6, e23777. [Google Scholar] [CrossRef] [PubMed]
  37. Deng, X.; Huang, J.; Rozelle, S.; Uchida, E. Growth, population and industrialization, and urban land expansion of china. J. Urban Econ. 2008, 63, 96–115. [Google Scholar] [CrossRef]
  38. Li, X.; Zhou, W.; Ouyang, Z. Forty years of urban expansion in beijing: What is the relative importance of physical, socioeconomic, and neighborhood factors? Appl. Geogr. 2013, 38, 1–10. [Google Scholar]
  39. Ahmed, B.; Kamruzzaman, M.; Zhu, X.; Rahman, M.S.; Choi, K. Simulating land changes and their impacts on land surface temperature in Dhaka, Bangladesh. Remote Sens. 2013, 5, 5969–5998. [Google Scholar] [CrossRef] [Green Version]
  40. Rahman, M.T. Detection of land use/land cover changes and urban sprawl in Al-Khobar, Saudi Arabia: An analysis of multi-temporal remote sensing data. ISPRS Int. J. Geo-Inf. 2016, 5, 15. [Google Scholar] [CrossRef]
  41. Thapa, R.B.; Murayama, Y. Examining spatiotemporal urbanization patterns in Kathmandu Valley, Nepal: Remote sensing and spatial metrics approaches. Remote Sens. 2009, 1, 534–556. [Google Scholar] [CrossRef]
  42. Seto, K.C.; Woodcock, C.E.; Song, C.; Huang, X.; Lu, J.; Kaufmann, R.K. Monitoring land-use change in the pearl river delta using landsat tm. Int. J. Remote Sens. 2002, 23, 1985–2004. [Google Scholar] [CrossRef]
  43. Qi, Y.J.; Yang, Y.; Jin, F.J. China’s economic development stage and its patio-temporal evolution: A prefectural-level analysis. Acta Geogr. Sin. 2013, 68, 517–531. (In Chinese) [Google Scholar]
  44. Population Census Office under the State Council Department of Population and Employment Statistics National Bureau of Statistics. Tabulation on the 2000 Population Census of the People’s Republic of China by County; China Statistics Press: Beijing, China, 2000.
  45. Population Census Office under the State Council Department of Population and Employment Statistics National Bureau of Statistics. Tabulation on the 2010 Population Census of the People’s Republic of China by County; China Statistics Press: Beijing, China, 2010.
  46. Dewan, A.; Yamaguchi, Y. Land use and land cover change in greater Dhaka, Bangladesh: Using remote sensing to promote sustainable urbanization. Appl. Geogr. 2009, 29, 390–401. [Google Scholar] [CrossRef]
  47. Wu, K.; Zhang, H. Land use dynamics, built-up land expansion patterns and driving forces analysis of the fast-growth Hangzhou metropolitan area, eastern China (1978–2008). Appl. Geogr. 2012, 30, 137–145. [Google Scholar] [CrossRef]
  48. Jenerette, G.D.; Potere, D. Global analysis and simulation of land-use change associated with urbanization. Landsc. Ecol. 2010, 25, 657–670. [Google Scholar] [CrossRef]
  49. Jongman, R. Homogenisation and fragmentation of the european landscape: Ecological consequences and solutions. Landsc. Urban Plan. 2002, 58, 211–221. [Google Scholar] [CrossRef]
  50. Lv, Z.; Dai, F.; Sun, C. Evaluation of urban sprawl and urban landscape pattern in a rapidly developing region. Environ. Monit. Assess. 2012, 184, 6437–6448. [Google Scholar] [CrossRef] [PubMed]
  51. Brueckner, J.K. Urban sprawl: Diagnosis and remedies. Int. Reg. Sci. Rev. 2000, 23, 160–171. [Google Scholar] [CrossRef]
  52. Ewing, R.; Schmid, T.; Killingsworth, R.; Zlot, A.; Raudenbush, S. Relationship between urban sprawl and physical activity, obesity, and morbidity. Am. J. Health Promot. 2003, 18, 47–57. [Google Scholar] [CrossRef] [PubMed]
  53. Irwin, E.G.; Bockstael, N.E. The evolution of urban sprawl: Evidence of spatial heterogeneity and increasing land fragmentation. Proc. Natl. Acad. Sci. USA 2007, 104, 20672–20677. [Google Scholar] [CrossRef] [PubMed]
  54. Frumkin, H. Urban sprawl and public health. Public Health Rep. 2002, 117, 201. [Google Scholar] [CrossRef]
Figure 1. The spatial distribution of the three urban megaregions. The Beijing-Tianjin-Hebei (BTH) urban megaregion is located in northern China, the Yangtze River Delta (YRD) urban megaregion is in the central part, and the Pearl River Delta (PRD) urban megaregion is in southern China.
Remotesensing 09 00045 g001
Figure 2. LULC classification maps of the Beijing-Tianjin-Hebei (BTH), Yangtze River Delta (YRD) and Pearl River Delta (PRD) urban megaregions in 2000, 2005 and 2010.
Remotesensing 09 00045 g002
Figure 3. Examples of the different morphological models of urban expansion in cities of the three urban megaregions. (A1A3) were results in 2000–2005, (B1B3) were results in 2005–2010.
Remotesensing 09 00045 g003
Figure 4. Size distribution for patches of the three expansion models in the BTH, YRD and PRD urban megaregions during 2000–2005 and 2005–2010.
Remotesensing 09 00045 g004
Figure 5. The area and proportion of the three expansion models for the cities located in the BTH (A); YRD (B) and PRD (C) urban megaregions.
Remotesensing 09 00045 g005
Figure 6. Size distribution for patches of the three expansion models for different cities of the three urban megaregions in two time periods, 2000–2005 and 2005–2010.
Remotesensing 09 00045 g006
Table 1. Description of the predictor variables used in the statistical analysis.
VariableData TypeDescription
SizeMetric variableThe area of developed land in a city in the starting time
SpeedMetric variableThe proportion of new developed land areas account for the developed land area in the starting area
PopMetric variableThe number of permanent resident population
TIMetric variableThe percentage of the tertiary industry
CL1Nominal variableThe city located in the YRD urban megaregion
CL2Nominal variableThe city located in the PRD urban megaregion
Table 2. Pearson correlation coefficients between the variables.
2000–20052005–2010
LeapfroggingEdge-ExpansionInfillingSizeSpeedPopTILeapfroggingEdge-ExpansionInfillingSizeSpeedPopTI
Leapfrogging10.083−0.654 **0.035−0.258−0.147−0.09010.339 *−0.811 **−0.014−0.263−0.147−0.199
Edge-expansion 1−0.809 **0.535 **0.1310.338 *−0.031 1−0.826 **0.471 **0.1330.310−0.114
Infilling 1−0.427 **0.052−0.1700.077 1−0.2850.075−0.1050.190
Size 1−0.2410.830 **0.118 1−0.1790.824 **0.153
Speed 1−0.1270.095 1−0.123−0.029
Pop 10.453 ** 10.462 **
TI 1 1
* Correlation is significant at the 0.05 level (two-tailed); ** Correlation is significant at the 0.01 level (two-tailed).
Table 3. The total area and proportional cover of developed land, and area of newly developed land (Anew) and its ratio to the previously existing developed land (Pnew) in three urban megaregions.
BTHYRDPRD
Area (km2)Percentage (%)Anew (km2)Pnew (%)Area (km2)Percentage (%)Anew (km2)Pnew (%)Area (km2)Percentage (%)Anew (km2)Pnew (%)
200017,858.108.2713,391.9113.265863.4510.86
200519,522.999.0517,089.8816.926702.3512.42
201021,634.8610.0222,335.5422.117669.5314.21
2000–200517649.88374127.9377513.22
2005–2010208510.68530431.0487313.03
Table 4. The area and proportion of three expansion models in the BTH, YRD and PRD urban megaregions during 2000–2005 and 2005–2010.
BTHYRDPRD
2000–20052000–20052000–20052000–20052000–20052000–2005
Amodel (km2)Pmodel (%)Amodel (km2)Pmodel (%)Amodel (km2)Pmodel (%)Amodel (km2)Pmodel (%)Amodel (km2)Pmodel (%)Amodel (km2)Pmodel (%)
Leapfrogging28716.2743720.9540410.8074314.00121.56394.41
Edge-expansion119467.70128761.71209355.95276852.1917122.0528632.80
Infilling28316.0336217.34124433.25179333.8159276.3954862.79
Table 5. The area of newly developed land (Anew) and its ratio to the previously existing developed land (Pnew) of the cities in the three urban megaregions.
BTHYRDPRD
2000–20052005–2010 2000–20052005–2010 2000–20052005–2010
Anew (km2)Pnew (%)Anew (km2)Pnew (%) Anew (km2)Pnew (%)Anew (km2)Pnew (%) Anew (km2)Pnew (%)Anew (km2)Pnew (%)
Beijing426.9718.20423.2514.79Shanghai295.9817.90666.4435.28Guangzhou110.729.72147.6512.04
Tianjin507.8427.87390.2718.03Suzhou542.7851.23630.7739.62Foshan160.5616.67115.5211.04
Tangshan159.658.59243.6317.51Wuxi196.3824.13399.5038.69Zhongshan121.1733.8456.3712.91
Shijiazhuang107.316.65112.886.43Changzhou208.3828.71300.1732.62Dongguan108.8511.99101.2310.47
Handan97.976.70153.489.62Zhenjiang201.2240.28288.3040.21Shenzhen53.128.7885.0813.10
Xingtai87.866.23121.618.71Nanjing397.5147.17345.9328.98Jiangmen74.5817.76113.8421.99
Qinhuangdao73.2912.9063.2110.00Yangzhou297.5234.82311.8027.28Zhuhai72.0539.4344.1418.44
Baoding66.712.56129.805.11Taizhou231.9421.01293.8822.18Huizhou45.579.39141.5423.21
Cangzhou52.863.0399.995.90Nantong381.4421.14539.8225.10Zhaoqing25.478.6161.9217.98
Langfang60.396.10114.5511.31Hangzhou276.2826.82306.0323.62
Hengshui56.414.67135.9413.14Ningbo280.7321.52422.2228.10
Zhangjiakou51.004.8585.907.62Huzhou164.1545.27263.5649.13
Chengde14.822.249.901.98Shaoxing128.5516.14219.6624.14
Jiaxing120.0418.74267.5035.78
Zhoushan14.73−2.6640.0031.49
Table 6. Summary for the linear-regression results.
2000–20052005–2010
LeapfroggingSize−0.012 ** (−0.439)−0.011 ** (−0.516)
Speed−0.092 (−0.087)−0.403 (−0.373)
TI0.082 (0.041)0.101 (0.069)
CL1−30.903 ** (−0.904)−29.251 ** (−1.004)
CL2−17.331 ** (−0.581)−6.38 (−0.251)
Edge-expansionSize0.010 * (0.270)0.005 (0.219)
Speed0.412 * (0.301)0.732 ** ( 0.652)
TI−0.039 (−0.015)−0.051 (−0.033)
CL1−34.027 ** (−0.775)−24.866 ** (−0.822)
CL2−9.498 (−0.247)−21.035 ** (−0.795)
InfillingSize0.003 (0.054)0.006 (0.173)
Speed−0.319 * (−0.178)−0.329 (−0.183)
TI−0.043 (−0.198)−0.050 (−0.224)
CL164.934 ** (1.123)54.118 ** (1.113)
CL226.834 ** (0.531)27.419 ** (0.645)
* Coefficient is significant at the 0.05 level; ** Coefficient is significant at the 0.01 level; Both the unstandardized coefficients and standardized coefficients (included in the parentheses) were included in the table.

