1. Background
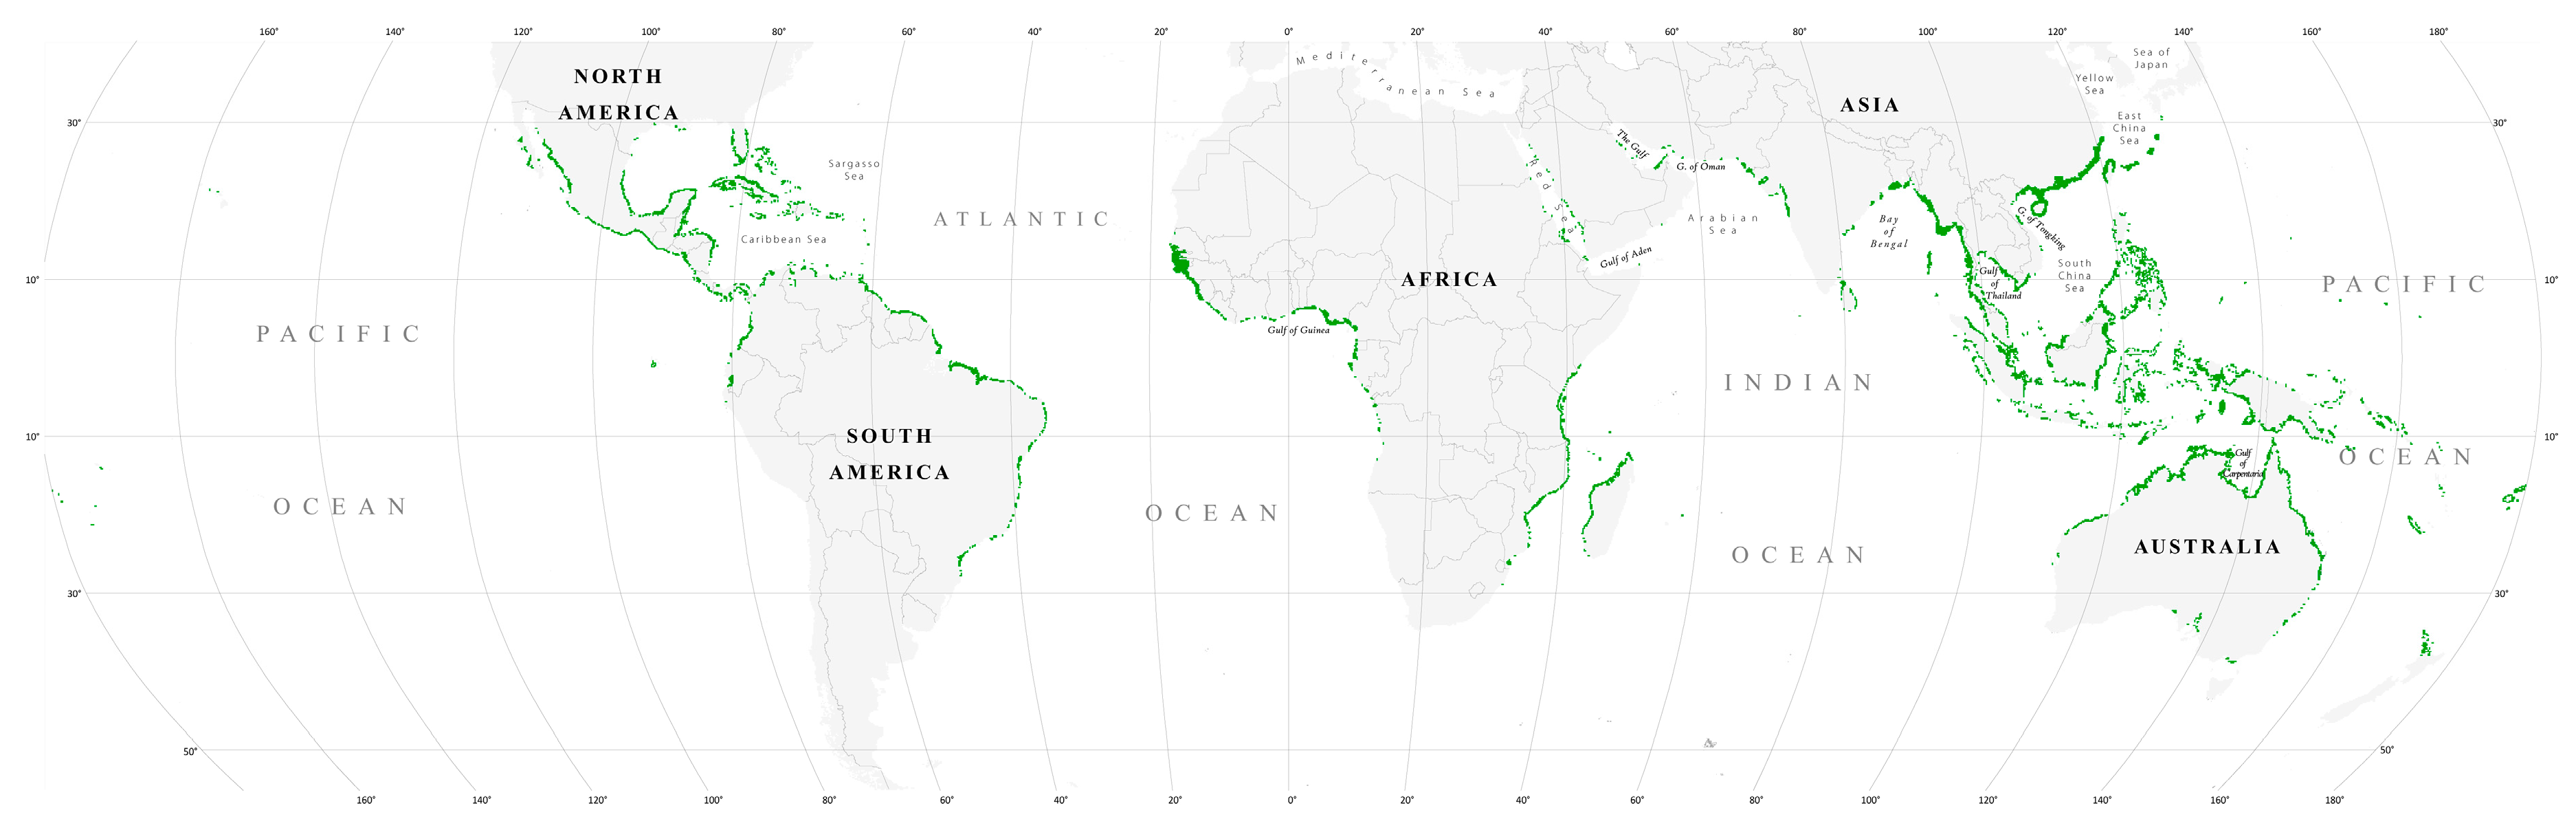
Mangrove forests are distributed in the inter-tidal region between the sea and the land in the tropical and subtropical regions of the world largely between 30°N and 30°S latitude. The total mangrove forest area of the world in the year 2000 was 137,760 km
2 in 118 countries and territories, accounting for less than 1% of total tropical forests of the world (
Figure 1) [
1]. Prior to this study, accurate, up-to-date, and reliable information on mangrove distribution was not available. The estimates of world mangroves varied from ~110,000 to 240,000 km
2 [
1].
Mangrove forests provide important ecosystem goods and services for human well-being. They are one of the most productive and biologically complex ecosystems in the world [
2]. The economic value of global mangrove forests ranges approximately from US $475 to $11,675 per ha per year depending on the valuation approach and market conditions [
3]. Recent findings suggest that mangroves annually sequester two to four times more carbon compared to mature tropical forests, and store three to four times more carbon per equivalent area than tropic forests [
4].
The protective role of mangrove forests from natural disasters is well recognized. Mangrove forests received special attention after the Asian Tsunami of 2004 and recent natural disasters such as hurricanes and cyclones. Several authors have highlighted that mangrove forests provided protection during the Asian Tsunami [
5,
6]. However, others reported an opposite view, stating that the mangrove forests did not act as protection during the Asian Tsunami [
7]. The general consensus seems to be that the level of protection is dependent on the size of the tsunami. If the intensity of a tsunami is small to moderate, mangroves provide protection; however, if it is very high (e.g., 30 m high or higher), mangroves may not provide any protection.
Mangroves are in a constant flux due to both natural and anthropogenic forces. About 35% of mangroves were lost from 1980 to 2005 [
8], and the forests have been declining at a faster rate than inland tropical forests and coral reefs [
9]. Anthropogenic causes are responsible for mangrove destruction at present, but relative sea-level rise could be the greatest threat to mangroves in the future [
10]. The continued decline of the forests is caused by conversion to agriculture, aquaculture, tourism, urban development, and overexploitation [
11]. Predictions suggest that 30%–40% of coastal wetlands and 100% of mangrove forest functionality could be lost in the next 100 years if the present rate of loss continues [
9]. As a consequence, important ecosystem goods and services (e.g., natural barrier, carbon sequestration, biodiversity) provided by mangrove forests will be diminished or lost.
Despite the importance of mangrove forests, reliable, accurate, and timely information on mangrove forests of the world is not available. A mangrove database is being created from national to global scales primarily due to scientific curiosity, interest from space agencies, and country need. To increase understanding of the distribution and dynamics of mangrove forests, scientists are employing new and novel image interpretation and classification techniques. Space agencies such as the National Aeronautics and Space Agency (NASA), the European Space Agency (ESA), Indian Remote Sensing (IRS), and the Japan Aerospace Exploration Agency (JAXTA) are interested in how the remote sensing technologies are being utilized and their impact on solving complex environmental problems. Country-specific needs include the availability and accessibility of a timely and accurate database of mangrove changes, needed for resources planning, management, and reporting to international treaty and conventions. In some cases, data generation at sub-regional (e.g., Mekong region), national, or sub-national levels is facilitated by donor agencies such as USAID, and NORAD. However, the available data sets are inconsistent over time and scale.
Mangroves possess a very distinct spectral signature in remotely sensed data, particularly in the spectral range corresponding visible red, near infrared, and mid infrared, thus making it easier to classify compared to other land cover types. The spectral range roughly corresponds to Landsat 7 bands 3 (0.63–0.69 μm), 4 (0.77–0.90 μm), 5 (1.55–1.75 μm), and 7 (2.09–2.35 μm). Advancement in remote sensing with the availability of higher spatial, spectral, and temporal resolution and availability of historical remote sensing data provides an opportunity to better characterize, map, and monitor mangrove forests. These data can be used in combination with other high temporal imagery (1−2 day observations) to provide information documenting mangrove phenology.
Recent advancement in remote sensing data availability, image-processing methodologies, computing and information technology, and human resources development have provided an opportunity to observe and monitor mangroves from local to global scales on a consistent and regular basis. Spectral and spatial resolution of remote sensing data and their availability has improved, making it possible to observe and monitor mangroves with unprecedented spatial and thematic detail. Novel remote sensing platforms, such as unmanned aerial vehicles, and emerging sensors, such as Fourier transform infrared spectroscopy and LiDAR, can now be used for mangrove monitoring. Furthermore, it is now possible to store and analyze large volume of data using cloud computing.
This issue, consisting of nine papers, is dedicated to mangrove mapping and monitoring, broadly covering the application of earth observation satellite data.
4. Paradigm Shift in Remote Sensing Data Processing
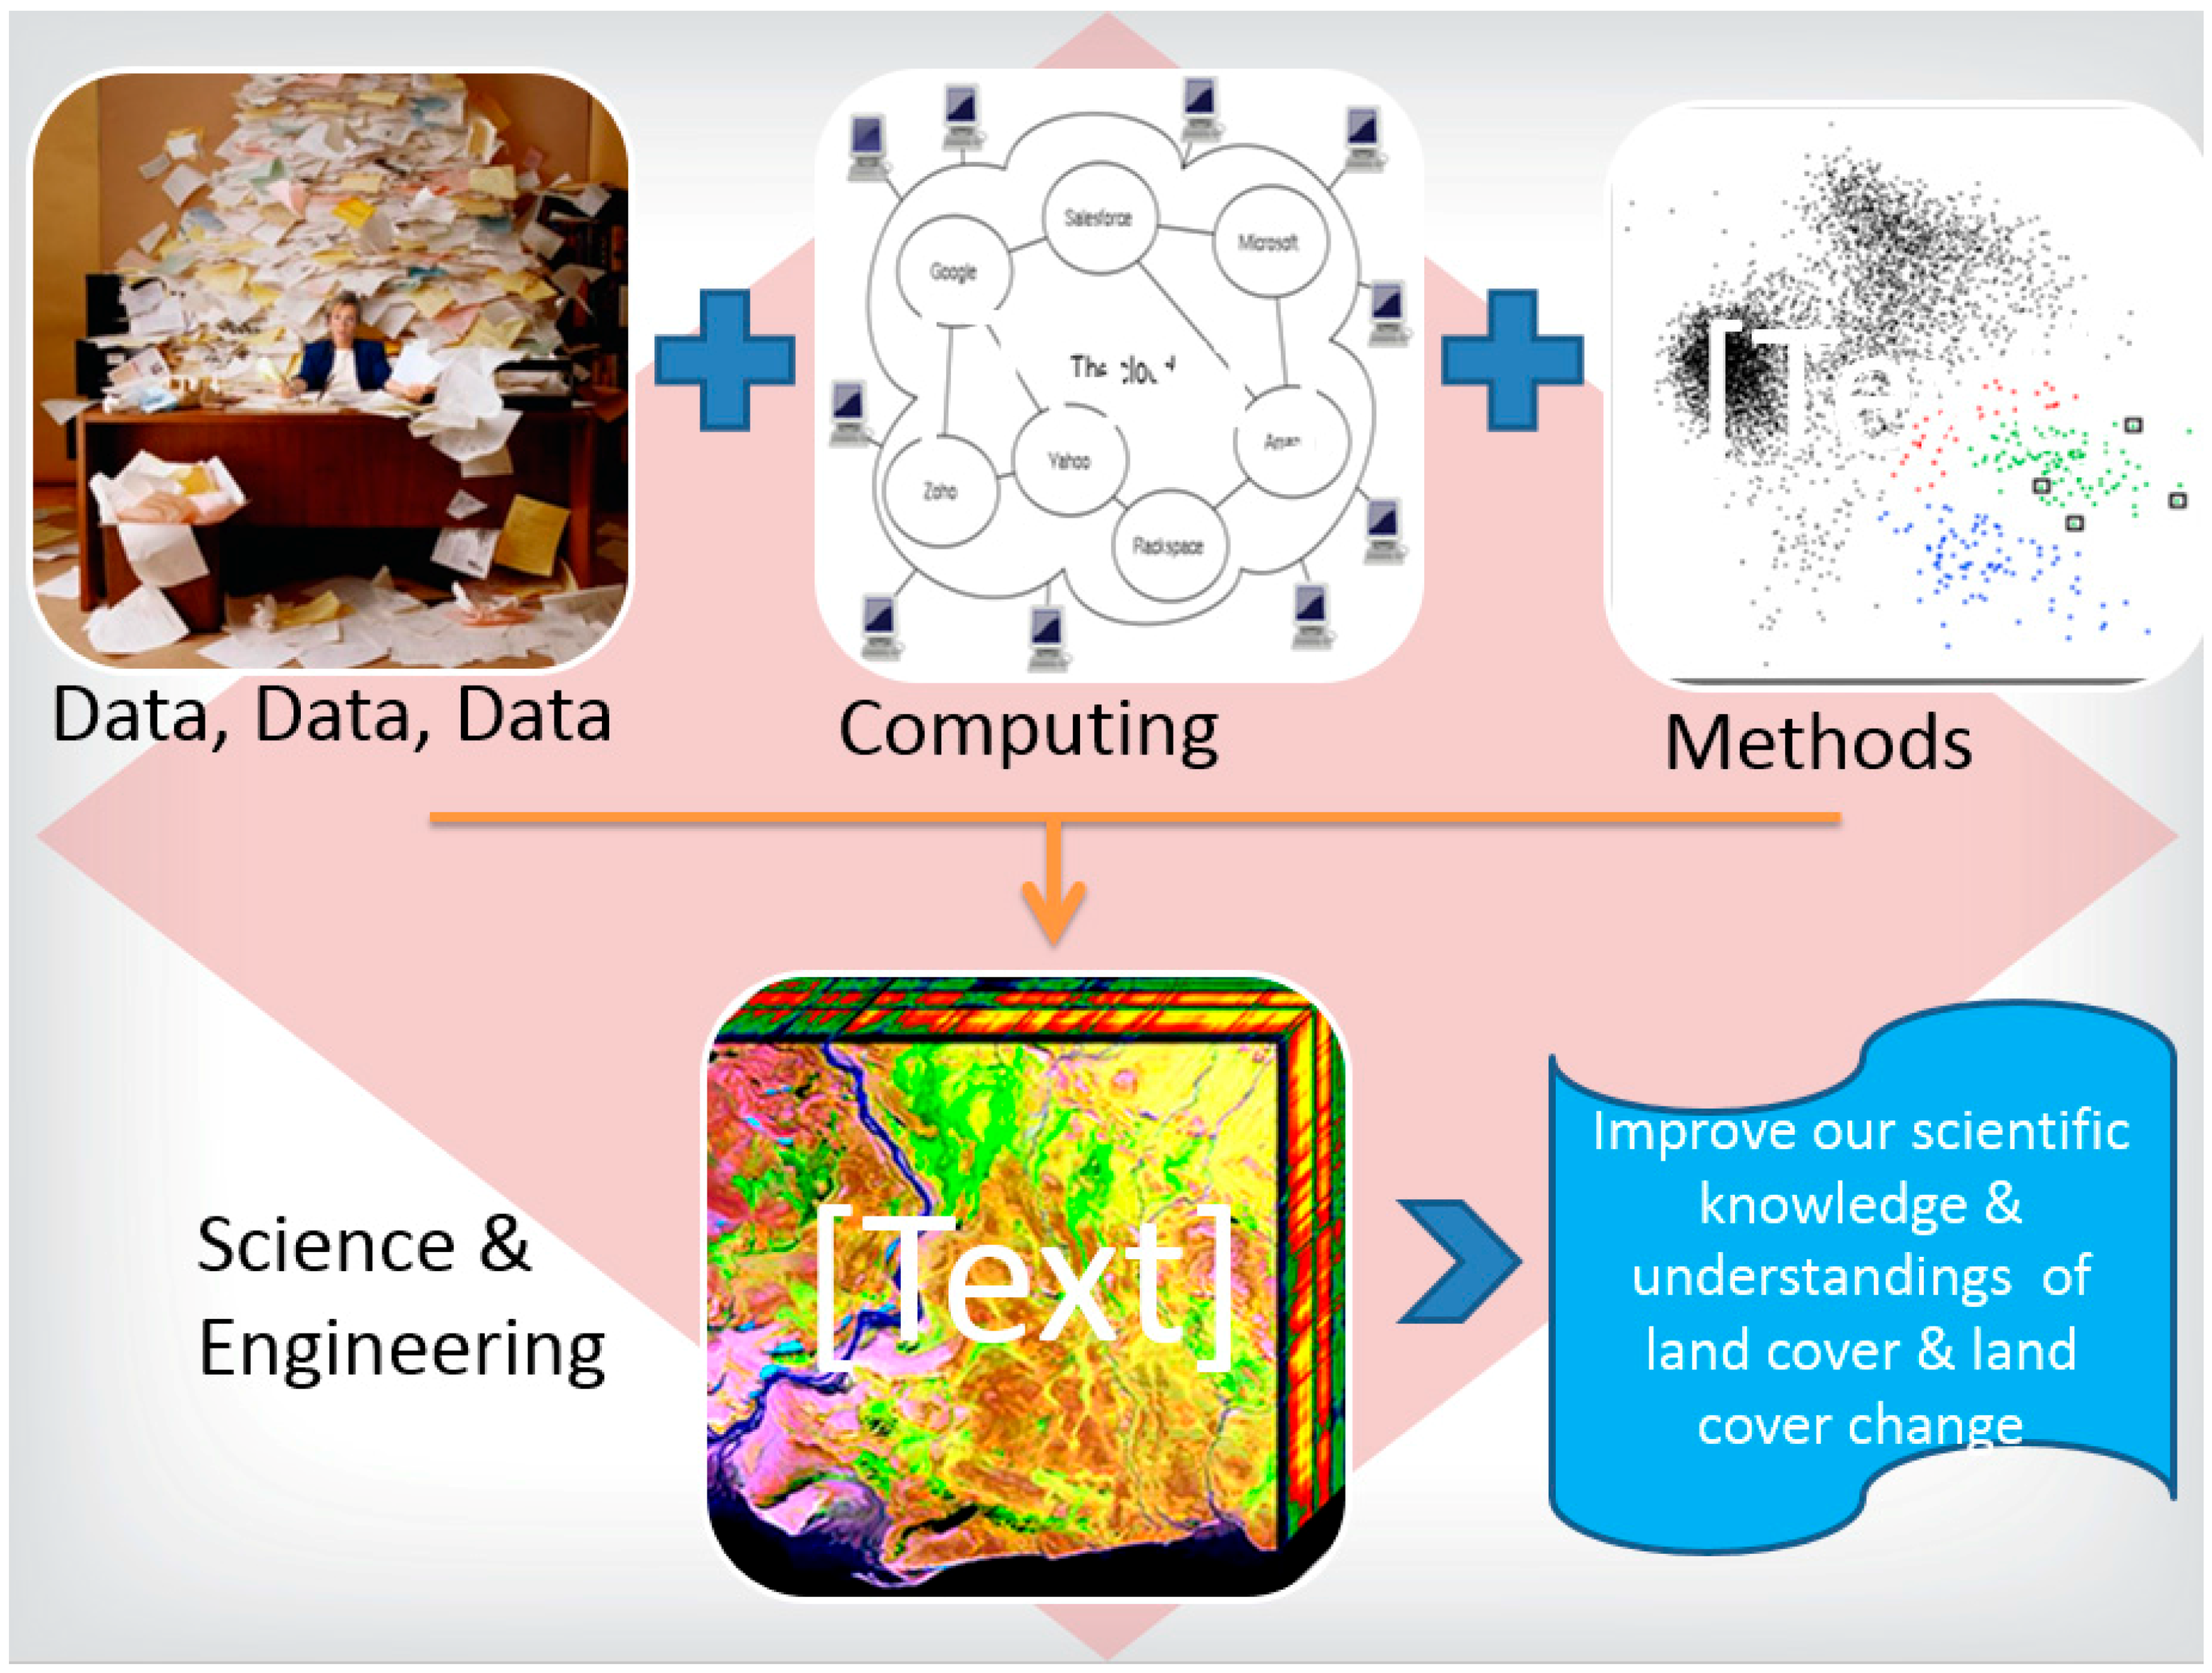
In the last decade or so, significant improvement has been achieved in terms of remote sensing data availability, classification methodologies, computing infrastructure, and availability of expertise. We now have a large amount of data in need of the integration to answer critical science questions. To accomplish this requires the implementation of automated image pre-processing and classification approaches (
Figure 2). At present, not everything can be automated, but many steps including pre-processing that normally constitute 50%–60% of project time can be automated.
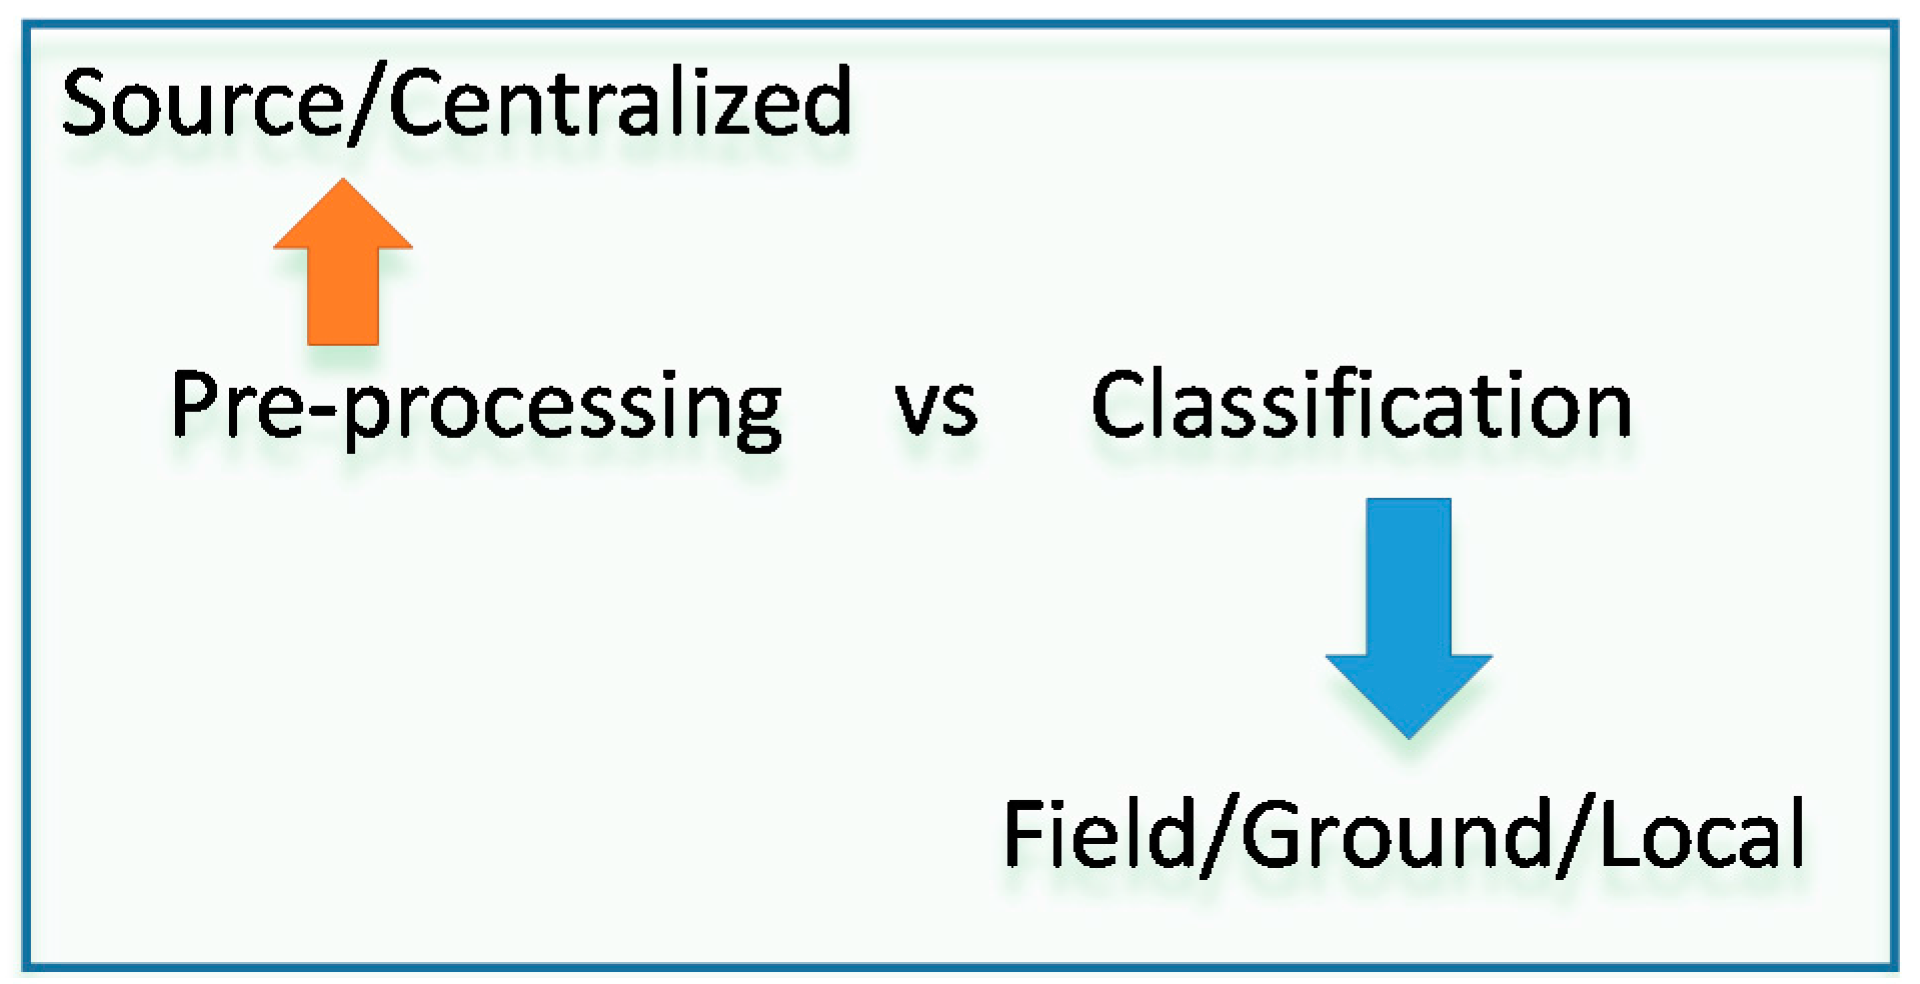
Pre-processing of satellite data should be centralized, whereas classification and image interpretation can be decentralized (
Figure 3). However, there should be an inflow of information from centralized to local levels and vice versa.
Recent trend has been to perform image processing using cloud computing such as Google Earth Engine (GEE) and Amazon Web Services (AWS). The advantages of cloud computing include the availability of a large volume of satellite data already stored in the cloud. This will avoid the need of an external hard disk and facilitate easy data access. For example, many of the data such as the entire Landsat archive are already available in GEE and AWS. Using parallel computing, users will have unlimited computer processing capabilities. Moreover, code and classification algorithms can be shared and discussed in the shared platform. The few disadvantages include a lack of full control of the cloud-computing platform, cost, and the fact that documents are not available or fully explained in some cases.
6. Synopsis of Research Papers
A brief summary of the nine papers published in this special issue are presented below. These papers use optical, radar, and LiDAR remotely sensed data with a special resolution ranging from less than 1 m to 30 m. Various classification approaches such as maximum likelihood classification (MLC), support vector machine (SVM), and an object-based approach were examined. Time series satellite data were used to quantify mangrove cover changes over time.
Kamal et al. [
13] explored and evaluated an object-based approach to understand the breadth and depth of mangrove information that can be derived from various satellite data such as Landsat TM, ALOS AVNIR-2, WorldView-2, and LiDAR. Their study was conducted in the Moreton Bay site in Australia to develop the classification rule sets to map mangroves and non-mangroves, species zonation, tree canopy crowns, and species communities. The method developed in Australia was tested in Karimunjawa Island in Indonesia. They concluded that the selected images with varying spatial and spectral resolution and mapping techniques to map mangrove features play a critical role and provide guidance for how to do this effectively through multi-scale mangrove composition mapping. The study showed the complexity of applying methods developed in different locations (i.e., Indonesia), is not straightforward.
In a paper by Zhu et al. [
14], a back-propagation artificial-neural-network (BP ANN)-based model is developed for the accurate estimation of uneven-aged and dense mangrove forest biomass. The contributions of the input variables are further quantified using a “Weights” method based on the BP ANN model. Two types of mangrove species,
Sonneratia apetala and
Kandelia candel, are examined in this study. Results show that the species type information is the most important variable for above-ground biomass (AGB) estimation, and the red edge band and the associated vegetation indices from WorldView-2 images are more sensitive to mangrove AGB than other bands and vegetation indices. The root mean squared error (RMSE) of biomass estimation with the incorporation of species as a dummy variable is 19.17% lower than that of the mixed species level. The results demonstrate that species type information obtained from the WorldView-2 images can significantly improve the accuracy of the biomass estimation.
When dealing with the complex problems associated with discriminating among species, classifier performance could be enhanced through the adoption of more intrinsic features, such as textural and differential spectral features. The effectiveness of textural and differential spectral features in mapping mangrove inter-species obtained from WorldView-3 high-spatial-resolution imagery for mangrove species in Hong Kong is explored in [
15]. Due to the different arrangement of leaves, the branch density, and the average height and size of plants, they found that the differential spectral features could aid in reducing inner-species variability and increasing intra-species separation. Using a combination of textural and differential spectral features thus represents a promising tool for discriminating among mangrove species. Experimental results suggest that combining these features can greatly improve mapping accuracy, thereby providing more reliable mapping results.
Jones et al. [
16] used Giri et al. [
1] and Giri’s and Muhlhausen’s [
17] data to calculate nation-wide dynamics for Madagascar’s mangroves from 1990 to 2010 and examined changes more closely by partitioning the national distribution into primary (i.e., >1000 ha) ecosystems, with a focus on four areas of interest (AOIs): Ambaro-Ambanja Bay (AAB), Mahajamba Bay (MHJ), Tsiribihina Manombolo Delta (TMD), and Bay des Assassins (BdA). Results indicate a nationwide net loss of 21% (i.e., 57,359 ha) from 1990 to 2010, with dynamics varying considerably among primary mangrove ecosystems. These contemporary, AOI-specific maps provide improved detail and accuracy over the USGS national-level maps and are being applied to conservation and restoration initiatives through the Blue Ventures’ Blue Forests programme and the WWF Madagascar West Indian Ocean Programme Office’s work in the region.
Kanniah et al. [
18] used Landsat satellite images to analyze the changes over a period of 25 years of mangrove areas in Iskandar Malaysia (IM), the fastest growing national special economic region located in Southern Johor, Malaysia. They tested the use of two widely used digital classification techniques to classify mangrove areas: maximum likelihood classification (MLC) and support vector machine (SVM). The MLC provided significantly higher user, producer, and overall accuracies and less “salt and pepper effects” compared to the SVM classifier. Results showed that IM lost 6740 ha and gained 710 ha for a net loss of 6030 ha or 330% of mangrove areas from 1989 to 2014. The loss of about 241 ha per year of mangroves was associated with a steady increase in urban land uses.
Shapiro et al. [
19] used Landsat imagery from 1994, 2000, and 2013 to identify mangrove cover change. The total mangrove area in 2013 was 37,034 ha, which was a net increase of 3723 ha from 1994 to 2013. The land cover change assessment was also used to provide a perspective on ecosystem carbon stocks, showing that the Zambezi Delta mangrove ecosystem in Mozambique acts as a large carbon sink. Our findings reinforce the importance of conducting land cover change assessments using coherent data and analytical models, coupled with field validation.
Pastor-Guzman et al. [
20] tested the performance of selected hyperspectral and broad band indices to predict chlorophyll concentration (CC) on mangrove leaves in Mexico. Their results showed the potential of Landsat 8 for estimation of mangrove CC at the landscape level. Relative leaf CC and leaf spectral response were measured at 12 Elementary Sampling Units (ESU) distributed along the northwest coast of the Yucatan Peninsula, Mexico. Linear regression models and coefficients of determination were computed to measure the association between CC and spectral response. At leaf level, the narrow band indices with the largest correlation with CC were Vogelmann indices and the MTCI (
R2 > 0.5). Indices with spectral bands around the red edge (705–753 nm) were more sensitive to mangrove leaf CC. At the ESU level, Landsat 8 NDVI green, which uses the green band in its formulation, explained most of the variation in CC (
R2 > 0.8). Accuracy assessment between estimated CC and observed CC using the leave-one-out cross-validation (LOOCV) method yielded a root mean squared error (RMSE) = 15 mg·cm
−2, and
R2 = 0.703. CC maps showing the spatiotemporal variation of CC at landscape scale were created using the linear model. Their results indicate that Landsat 8 NDVI green can be employed to estimate CC in large mangrove areas where ground networks cannot be applied, and mapping techniques based on satellite data are necessary. Furthermore, using upcoming technologies that will include two bands around the red edge such as Sentinel 2 will improve mangrove monitoring at higher spatial and temporal resolutions.
Cougo et al. [
21] examined the relationship between radar backscattering (σ°, β°, and γ) of a multi-polarized Radarsat-2 C-band image with the structural attributes of regenerating mangrove vegetation located at the mouth of the Amazon River, Brazil. CBH (circumference at breast height), height and species data were collected to characterize vegetation structure and above-ground biomass (AGB) at 17 plots with a total of 3090 measured individuals. Significant relationships between the linear σ° in VH (vertical transmit, horizontal receive) cross-polarization produced R
2 values of 0.63 for the average height, 0.53 for the DBH, 0.46 for the basal area (BA), and 0.52 for the AGB. Using co-polarized HH (horizontal transmit, horizontal receive) and VV (vertical transmit, vertical receive),
r2 values increased to 0.81, 0.79, 0.67, and 0.79, respectively. Vegetation attribute maps of average canopy height, DBH, and AGB were generated for the study area. The study concluded that multi-polarized Radarsat-2 images were adequate for characterization of vegetation attributes in areas of mangrove regeneration.
Brown et al. [
22] investigated the potential of polarimetric target decomposition for mangrove forest monitoring and analysis in Rufiji Delta, Tanzania. Using three ALOS PALSAR images, they showed that L-band polarimetry is capable of mapping mangrove dynamics and is sensitive to stand structure and the hydro-geomorphology of stands. Entropy-alpha-anisotropy and incoherent target decompositions provided valuable measures of scattering behavior related to forest structure. Little difference was found between Yamaguchi and Arii decompositions, despite the conceptual differences between these models. Using these models, we were able to differentiate the scattering behavior of the four main species found in the delta, though classification was impractical due to the lack of pure stands. Scattering differences related to season were attributed primarily to differences in ground moisture or inundation. Their results suggest that higher resolution L-band quad-polarized imagery, such as from PALSAR-2, may be a powerful tool for mangrove species mapping.
7. Conclusions
The nine papers published in this special issue use a wide variety of satellite data and classification approaches. The primary objective is to improve our scientific understanding on the distribution and dynamics of mangrove forests in different parts of the world. These studies use various remotely sensed data ranging from Landsat, WorldView, ALOS AVNIR-2, LiDAR, PALSAR, and Radarsat. They use various classification approaches including Maximum Likelihood Classification (MLC), support vector machine (SVM), and an artificial neural network (ANN). Radar data were analyzed using back-propagation ANN and linear regression models and coefficients. Information such as mangrove and non-mangrove areas, mangrove change, species zonation, vegetation indices, tree height, canopy closure, diameter at breast height (DBH), above ground biomass (AGB), and carbon stock were computed. Studies were conducted in various parts of the world such as Australia, China, Madagascar, Malaysia, Mozambique, Mexico, Tanzania, Hong Kong, and Brazil. These studies help advance our scientific understanding of how various types of remotely sensed data can be utilized with different types of classification approaches to derive meaningful mangrove data and information in support of furthering the science needed to support a global monitoring effort.

