
Affecting Factors and Recent Improvements of the Photochemical Reflectance Index (PRI) for Remotely Sensing Foliar, Canopy and Ecosystemic Radiation-Use Efficiencies


Abstract
:
1. Introduction
2. Affecting Factors
2.1. Daily Changes
2.1.1. Foliar Level
2.1.2. Canopy Level
2.2. Seasonal Changes
2.2.1. Foliar Level
2.2.2. Canopy Level
2.2.3. Ecosystemic Level
2.3. Other Factors
3. Application
3.1. Foliar Level
3.1.1. Diurnal Changes
3.1.2. Seasonal Changes
3.2. Canopy Level
3.2.1. Diurnal Changes
3.2.2. Seasonal Changes
3.3. Ecosystemic Level
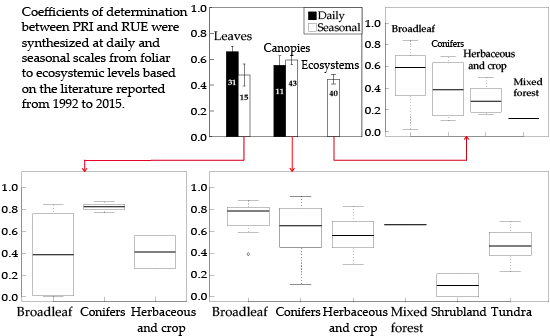
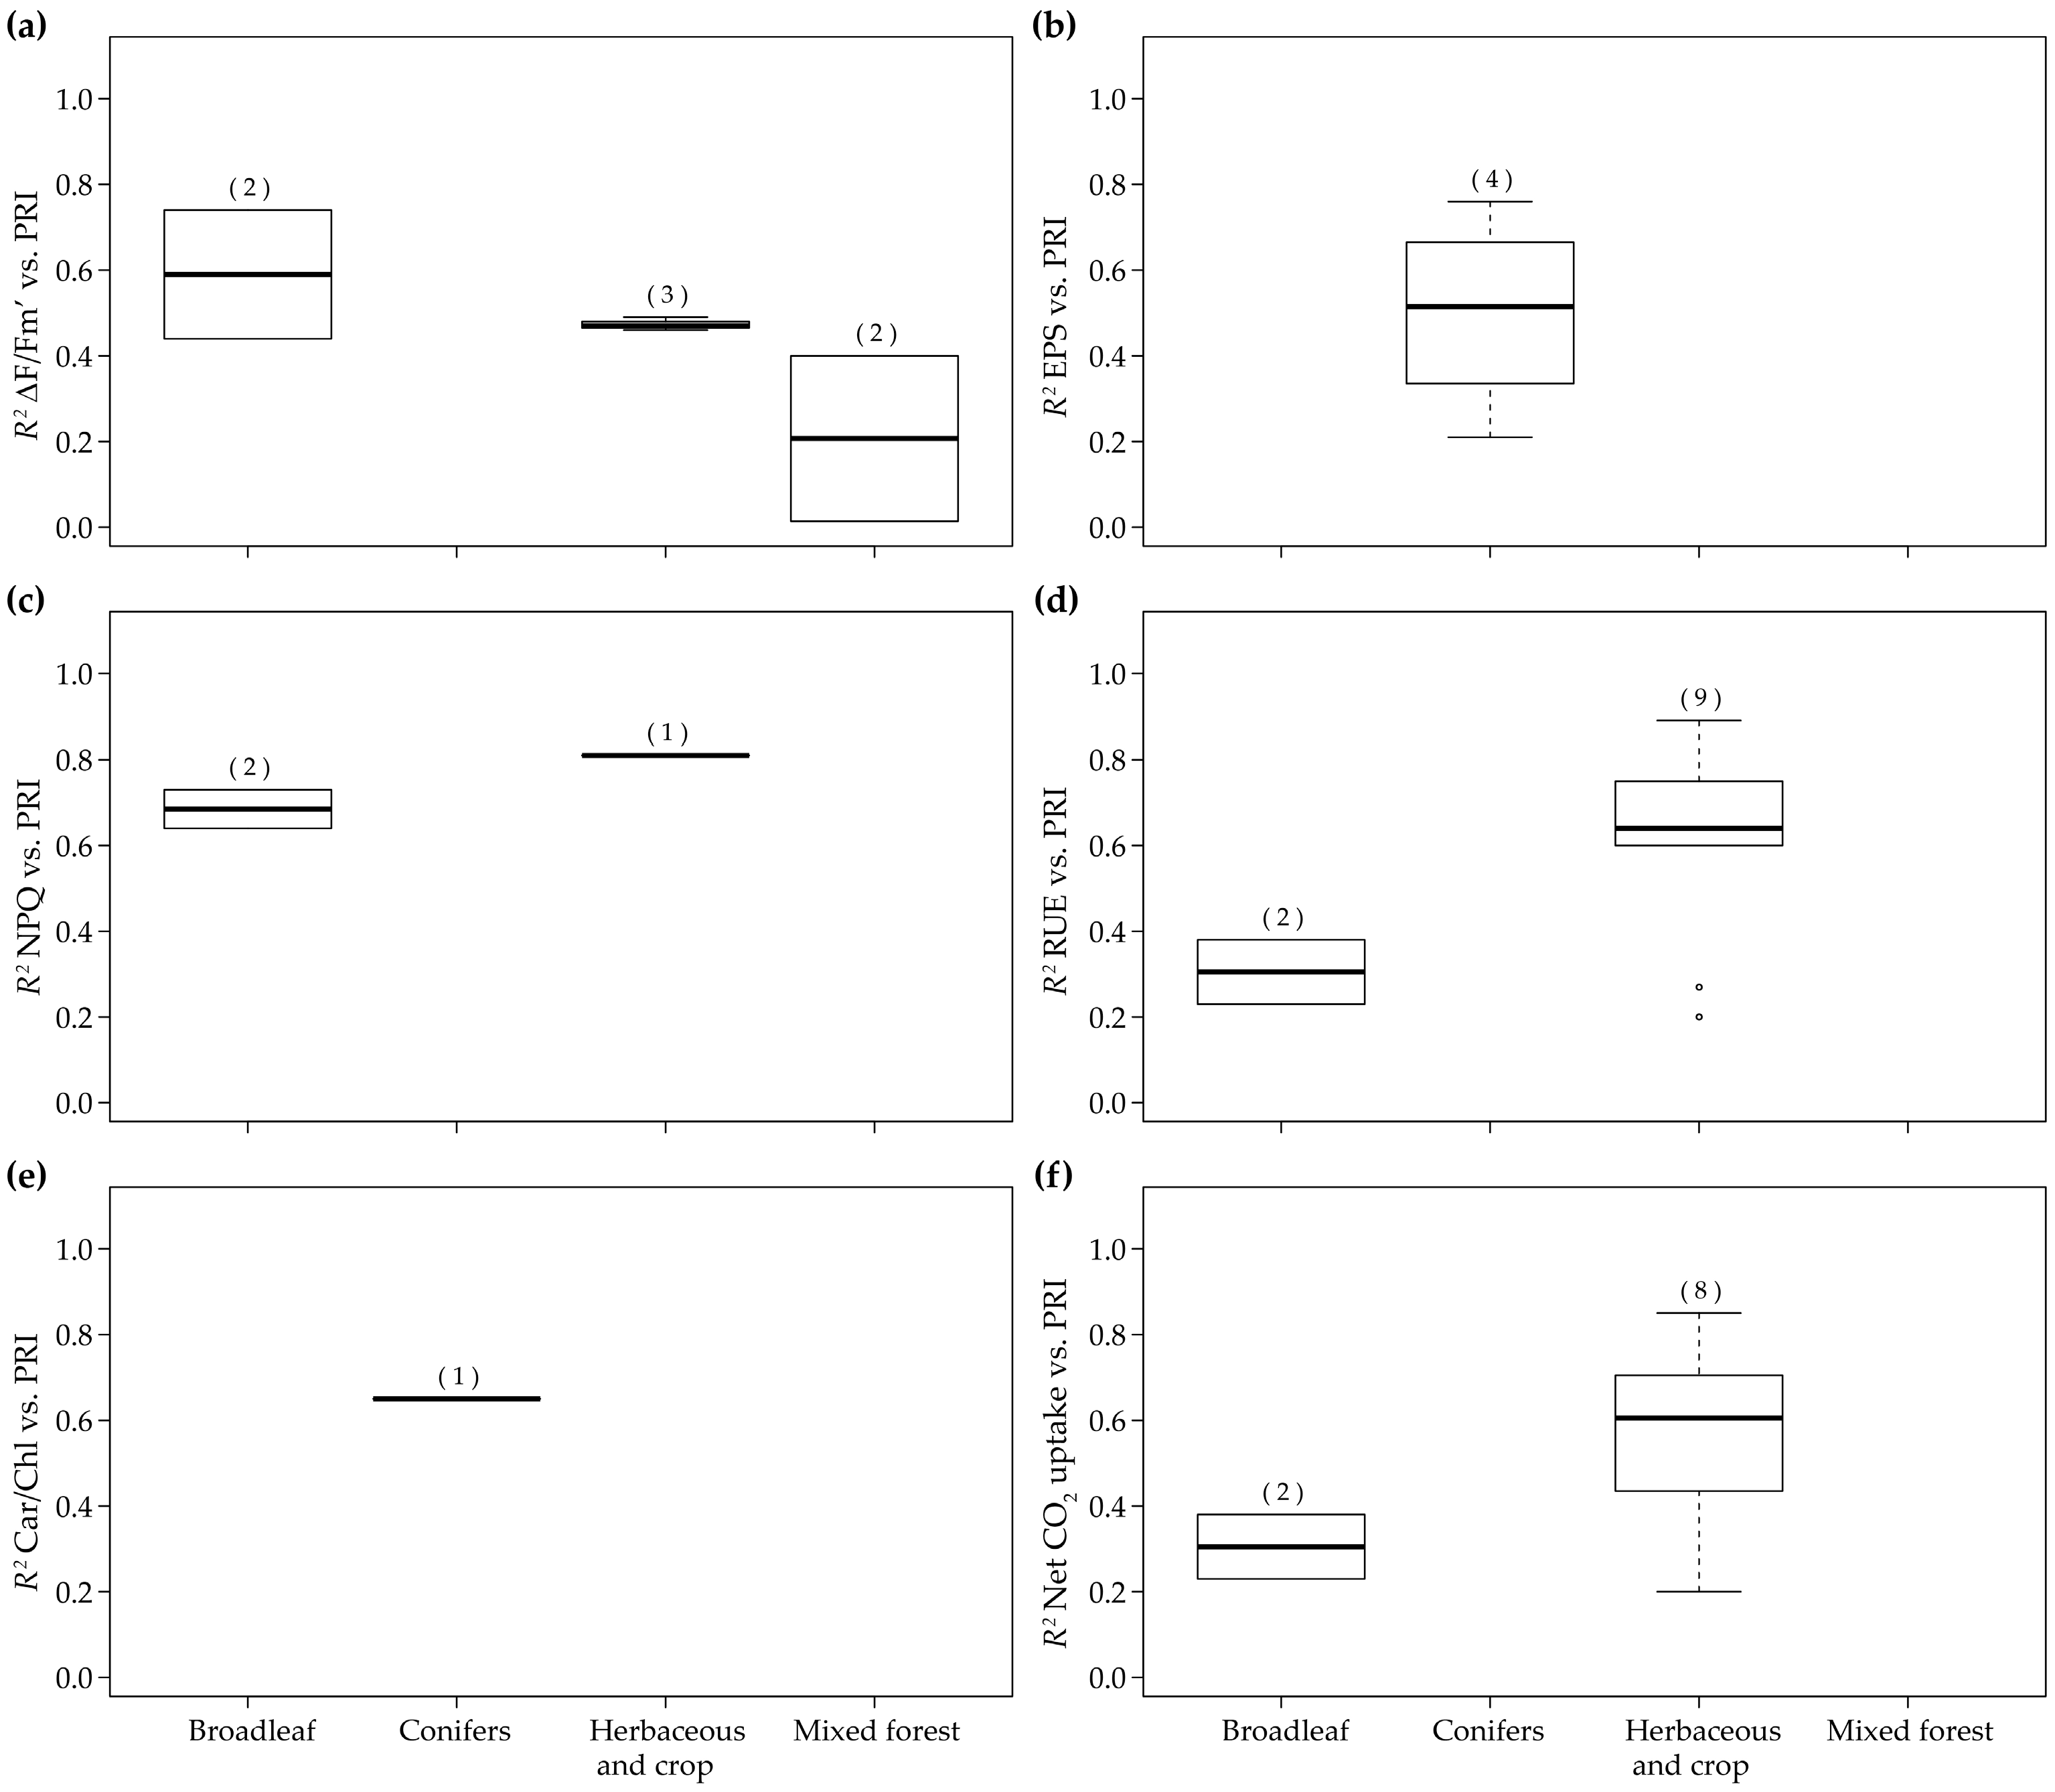
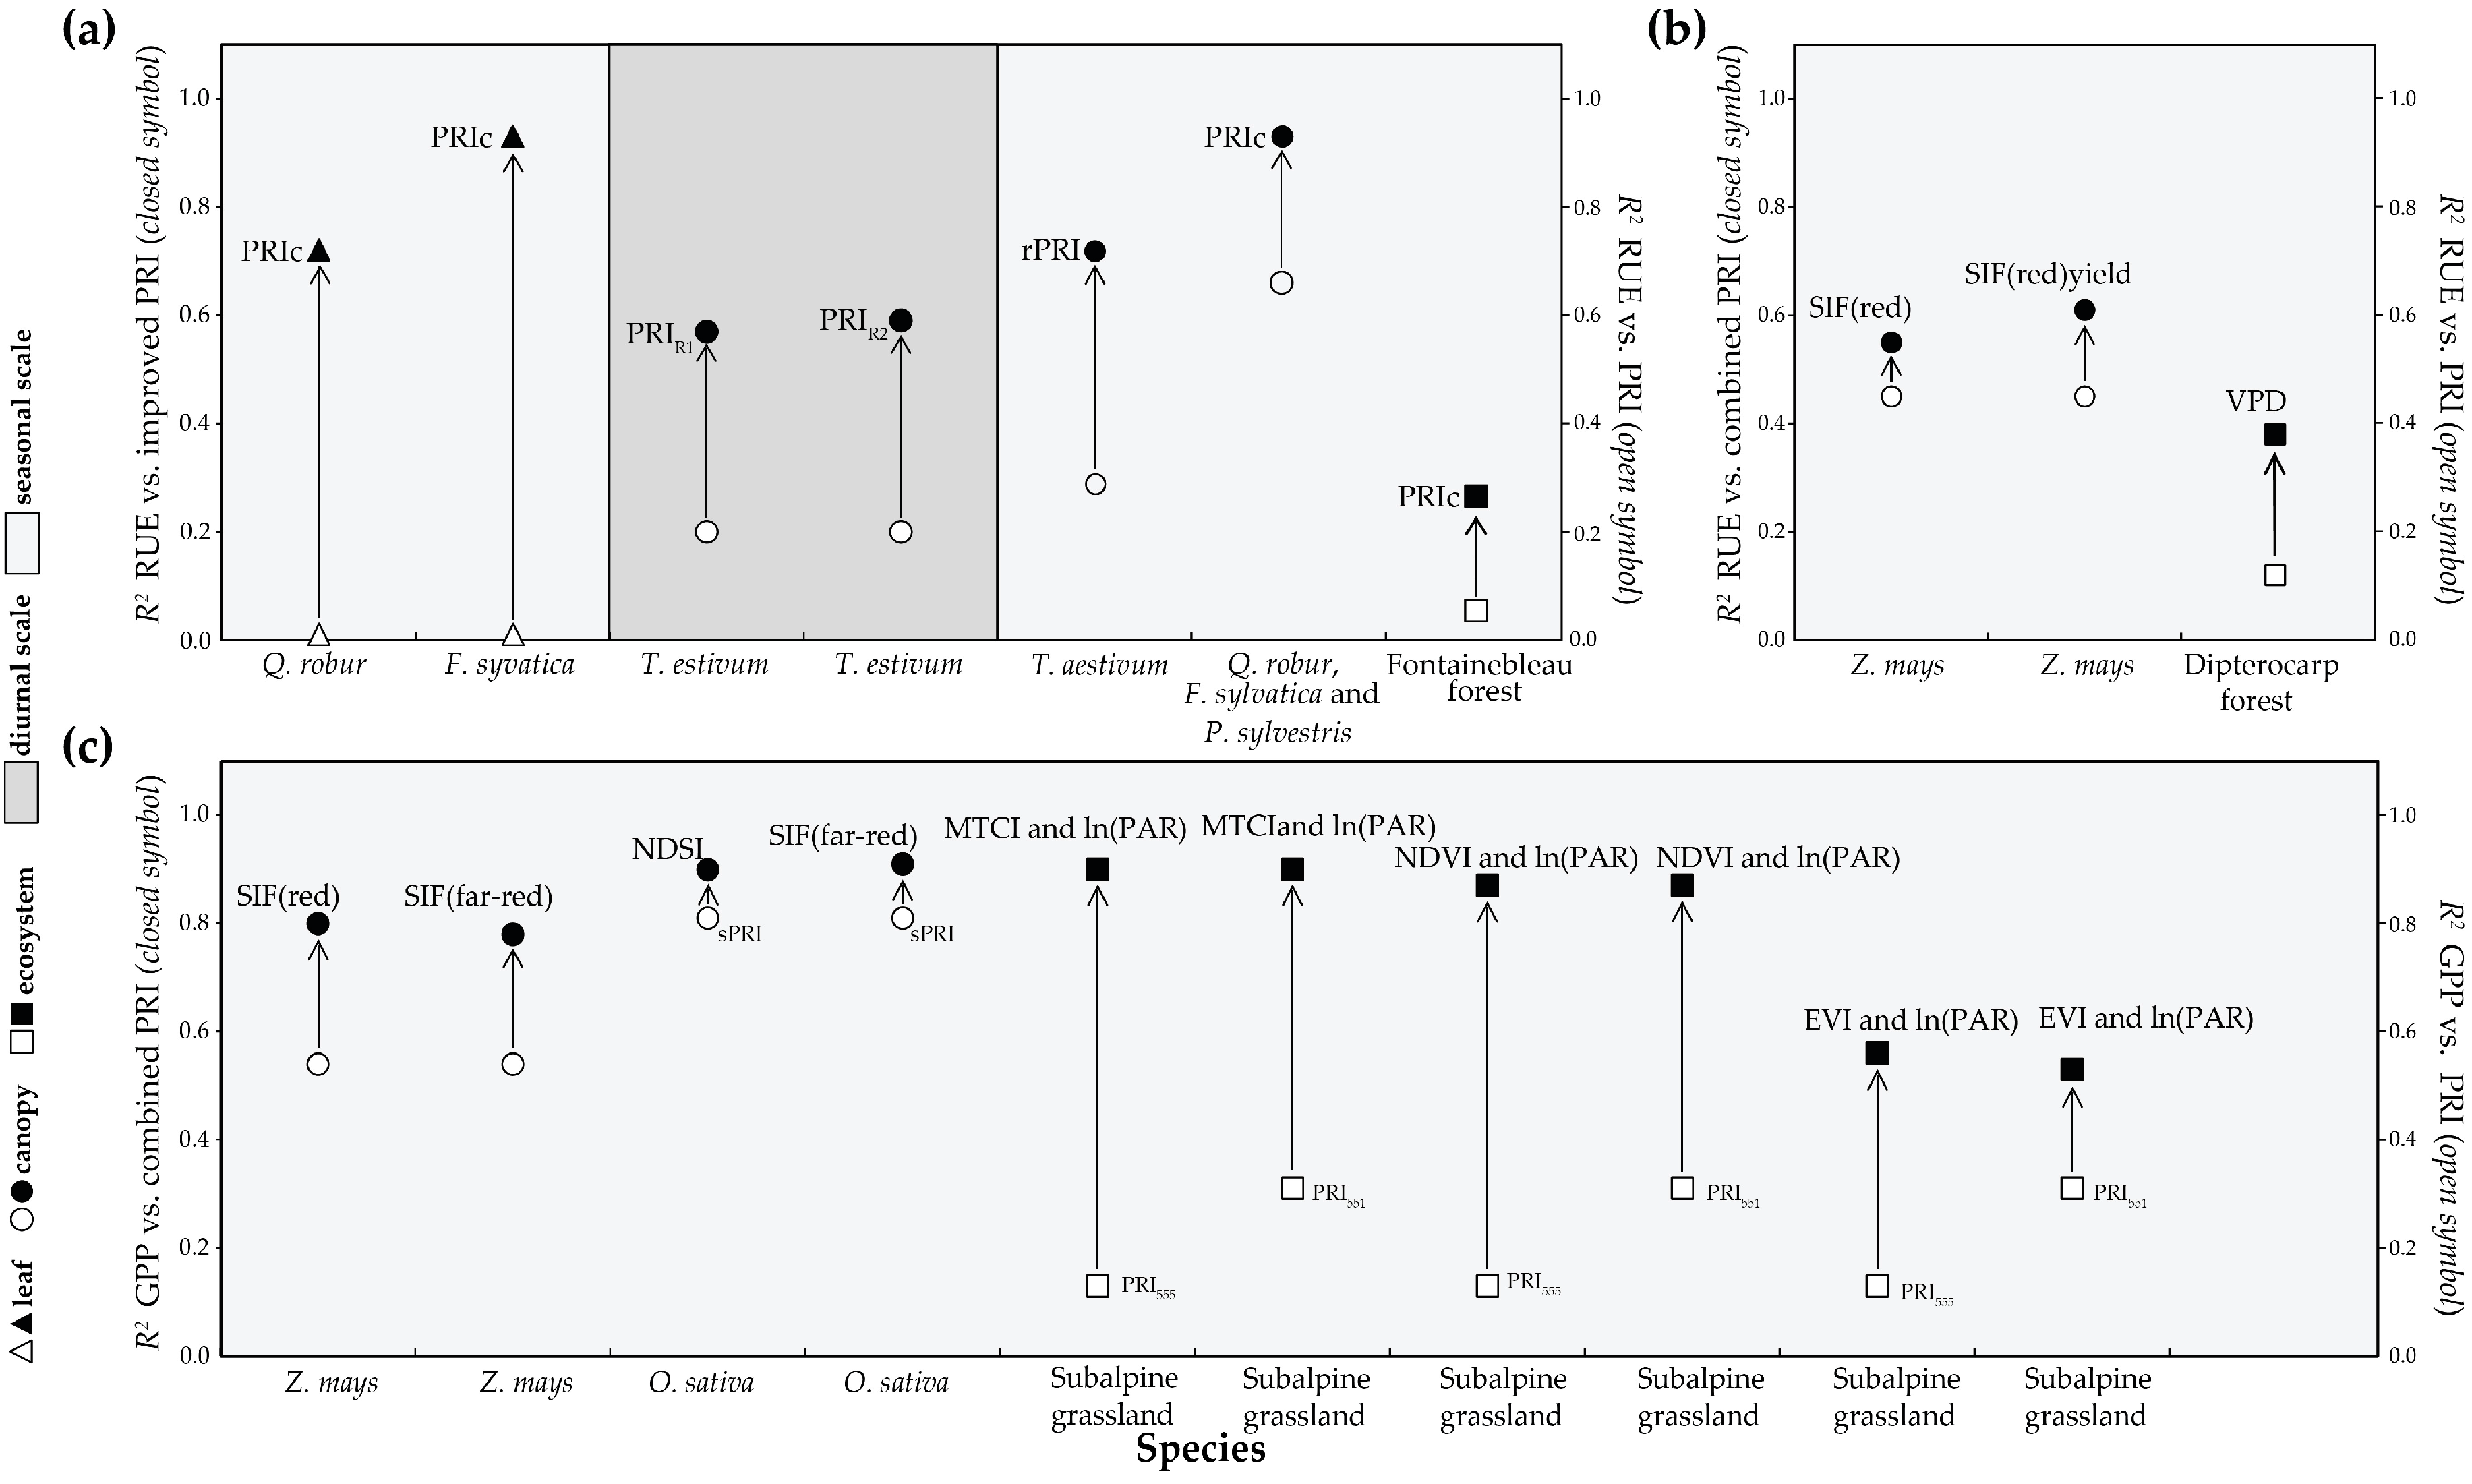
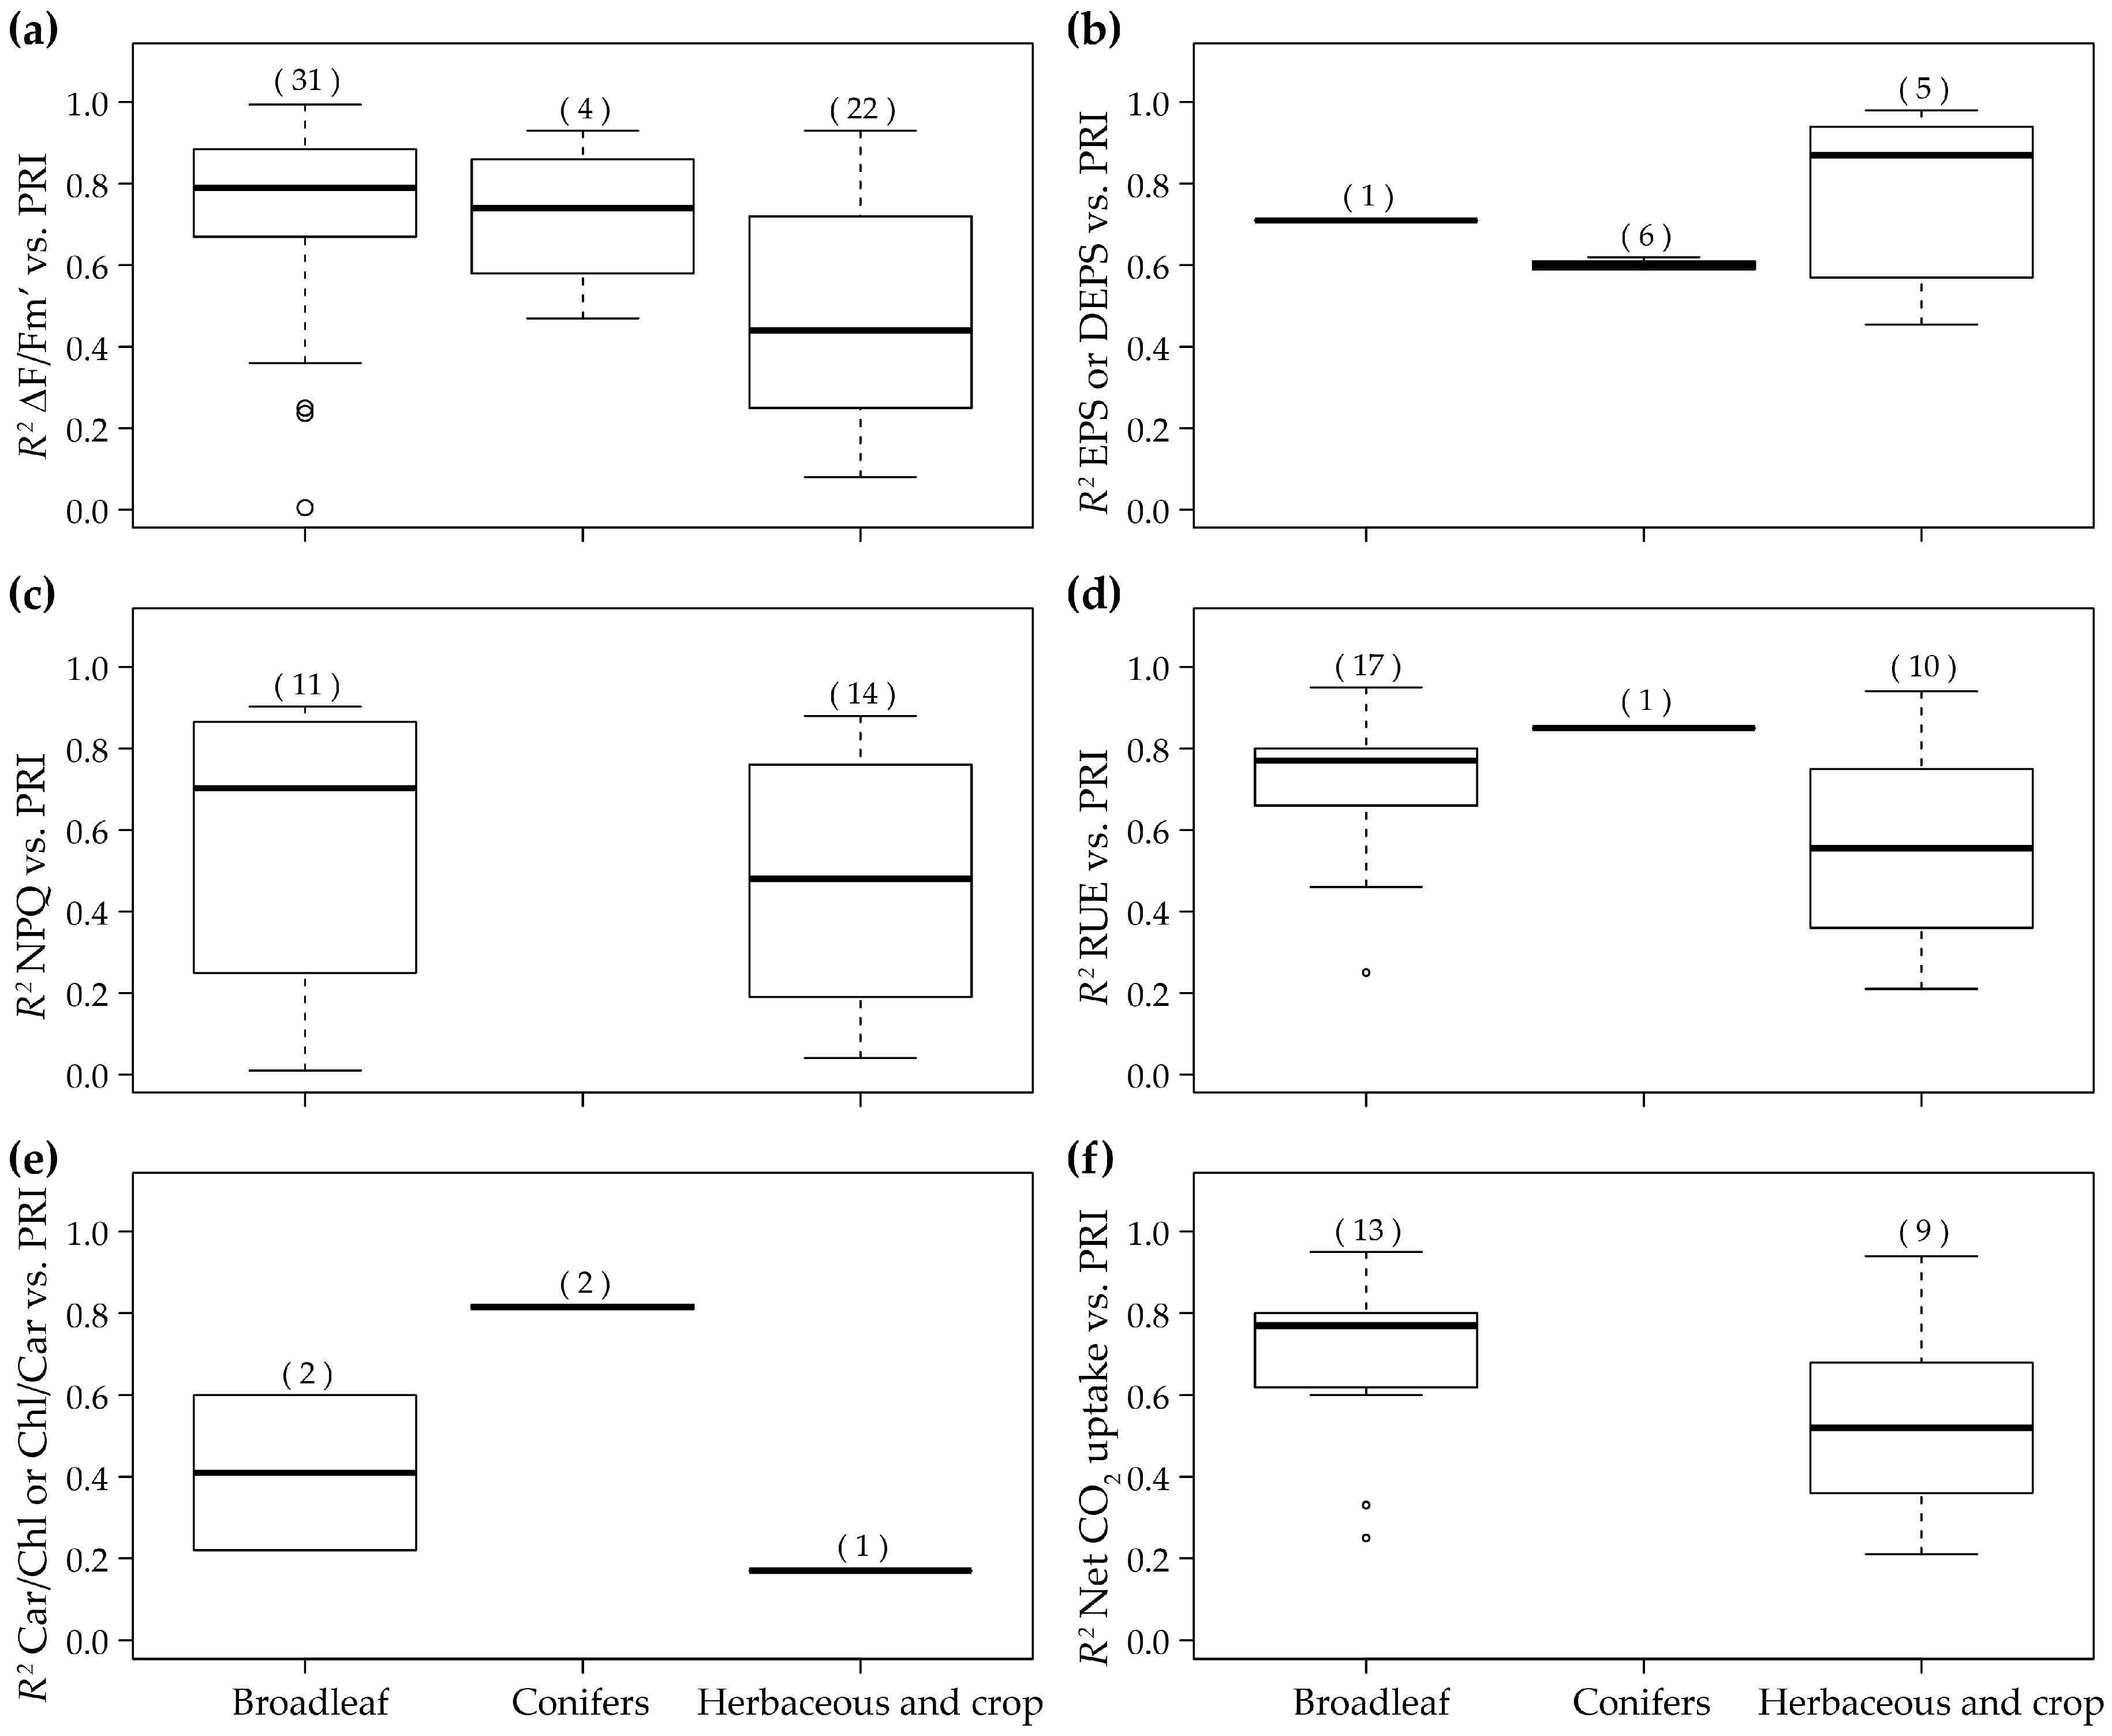
3.4. RUE-PRI Relationships Across Scales
4. Improvements in PRI Implementation
4.1. Instruments
4.2. Modeling
4.3. Different Formulations of PRI
4.4. Combining with Other Parameters to Evaluate Carbon Fixation
5. Discussion
6. Conclusions and Perspectives
Acknowledgments
Author Contributions
Conflicts of Interest
References
- Beer, C.; Reichstein, M.; Tomelleri, E.; Ciais, P.; Jung, M.; Carvalhais, N.; Rödenbeck, C.; Arain, M.A.; Baldocchi, D.; Bonan, G.B.; et al. Terrestrial gross carbon dioxide uptake: Global distribution and covariation with climate. Science 2010, 329, 834–838. [Google Scholar] [CrossRef] [PubMed]
- Schimel, D.; Pavlick, R.; Fisher, J.B.; Asner, G.P.; Saatchi, S.; Townsend, P.; Miller, C.; Frankenberg, C.; Hibbard, K.; Cox, P. Observing terrestrial ecosystems and the carbon cycle from space. Glob. Chang. Biol. 2015, 21, 1762–1776. [Google Scholar] [CrossRef] [PubMed]
- Guanter, L.; Zhang, Y.; Jung, M.; Joiner, J.; Voigt, M.; Berry, J.A.; Frankenberg, C.; Huete, A.R.; Zarco-Tejada, P.; Lee, J.-E.; et al. Global and time-resolved monitoring of crop photosynthesis with chlorophyll fluorescence. Proc. Natl. Acad. Sci. USA 2014, 111, E1327–E1333. [Google Scholar] [CrossRef] [PubMed]
- Hilker, T.; Hall, F.G.; Coops, N.C.; Lyapustin, A.; Wang, Y.; Nesic, Z.; Grant, N.; Black, T.A.; Wulder, M.A.; Kljun, N.; et al. Remote sensing of photosynthetic light-use efficiency across two forested biomes: Spatial scaling. Remote Sens. Environ. 2010, 114, 2863–2874. [Google Scholar] [CrossRef]
- Joiner, J.; Yoshida, Y.; Vasilkov, A.P.; Schaefer, K.; Jung, M.; Guanter, L.; Zhang, Y.; Garrity, S.; Middleton, E.M.; Huemmrich, K.F.; et al. The seasonal cycle of satellite chlorophyll fluorescence observations and its relationship to vegetation phenology and ecosystem atmosphere carbon exchange. Remote Sens. Environ. 2014, 152, 375–391. [Google Scholar] [CrossRef]
- Mäkelä, A.; Pulkkinen, M.; Kolari, P.; Lagergren, F.; Berbigier, P.; Lindroth, A.; Loustau, D.; Nikinmaa, E.; Vesala, T.; Hari, P. Developing an empirical model of stand GPP with the LUE approach: Analysis of eddy covariance data at five contrasting conifer sites in Europe. Glob. Chang. Biol. 2008, 14, 92–108. [Google Scholar] [CrossRef]
- Piao, S.; Sitch, S.; Ciais, P.; Friedlingstein, P.; Peylin, P.; Wang, X.; Ahlström, A.; Anav, A.; Canadell, J.G.; Cong, N.; et al. Evaluation of terrestrial carbon cycle models for their response to climate variability and to CO2 trends. Glob. Chang. Biol. 2013, 19, 2117–2132. [Google Scholar] [CrossRef] [PubMed]
- Gamon, J.A. Reviews and syntheses: Optical sampling of the flux tower footprint. Biogeosciences 2015, 12, 4509–4523. [Google Scholar] [CrossRef]
- Garbulsky, M.F.; Filella, I.; Verger, A.; Peñuelas, J. Photosynthetic light use efficiency from satellite sensors: From global to Mediterranean vegetation. Environ. Exp. Bot. 2014, 103, 3–11. [Google Scholar] [CrossRef]
- Hilker, T.; Coops, N.C.; Wulder, M.A.; Black, T.A.; Guy, R.D. The use of remote sensing in light use efficiency based models of gross primary production: A review of current status and future requirements. Sci. Total Environ. 2008, 404, 411–423. [Google Scholar] [CrossRef] [PubMed]
- Peñuelas, J.; Garbulsky, M.F.; Filella, I. Photochemical reflectance index (PRI) and remote sensing of plant CO2 uptake. New Phytol. 2011, 191, 596–599. [Google Scholar] [CrossRef] [PubMed]
- Monteith, J.L. Solar radition and productivity in tropical ecosystems. J. Appl. Ecol. 1972, 9, 747–766. [Google Scholar] [CrossRef]
- Monteith, J.L. Climate and the efficiency of crop production in Britain. Philos. Trans. R. Soc. London B Biol. Sci. 1977, 281, 277–294. [Google Scholar] [CrossRef]
- Balzarolo, M.; Vicca, S.; Nguy-Robertson, A.L.; Bonal, D.; Elbers, J.A.; Fu, Y.H.; Grünwald, T.; Horemans, J.A.; Papale, D.; Peñuelas, J.; et al. Matching the phenology of net ecosystem exchange and vegetation indices estimated with MODIS and FLUXNET in-situ observations. Remote Sens. Environ. 2016, 174, 290–300. [Google Scholar] [CrossRef]
- Baret, F.; Guyot, G. Potentials and limits of vegetation indices for LAI and APAR assessment. Remote Sens. Environ. 1991, 35, 161–173. [Google Scholar] [CrossRef]
- Rouse Jr, J.W.; Haas, R.H.; Schell, J.A.; Deering, D.W. Monitoring Vegetation Systems in the Great Plains with ERTS; Freden, S.C., Mercanti, E.P., Becker, M.A., Eds.; NASA: Washington, D.C., USA, 1974; Volume 1, pp. 309–317. [Google Scholar]
- Running, S.W.; Nemani, R.R.; Heinsch, F.A.; Zhao, M.; Reeves, M.; Hashimoto, H. A continuous satellite-derived measure of global terrestrial primary production. Bioscience 2004, 54, 547–560. [Google Scholar] [CrossRef]
- Gamon, J.A.; Peñuelas, J.; Field, C.B. A narrow-waveband spectral index that tracks diurnal changes in photosynthetic efficiency. Remote Sens. Environ. 1992, 44, 35–44. [Google Scholar] [CrossRef]
- Peñuelas, J.; Filella, I.; Gamon, J.A. Assessment of photosynthetic radiation-use efficiency with spectral reflectance. New Phytol. 1995, 131, 291–296. [Google Scholar] [CrossRef]
- Garbulsky, M.F.; Peñuelas, J.; Gamon, J.A.; Inoue, Y.; Filella, I. The photochemical reflectance index (PRI) and the remote sensing of leaf, canopy and ecosystem radiation use efficiencies: A review and meta-analysis. Remote Sens. Environ. 2011, 115, 281–297. [Google Scholar] [CrossRef]
- Gamon, J.A.; Field, C.B.; Bilger, W.; Björkman, O.; Fredeen, A.L.; Peñuelas, J. Remote sensing of the xanthophyll cycle and chlorophyll fluorescence in sunflower leaves and canopies. Oecologia 1990, 85, 1–7. [Google Scholar] [CrossRef]
- Filella, I.; Peñuelas, J.; Llorens, L.; Estiarte, M. Reflectance assessment of seasonal and annual changes in biomass and CO2 uptake of a Mediterranean shrubland submitted to experimental warming and drought. Remote Sens. Environ. 2004, 90, 308–318. [Google Scholar] [CrossRef]
- Filella, I.; Porcar-Castell, A.; Munné-Bosch, S.; Bäck, J.; Garbulsky, M.F.; Peñuelas, J. PRI assessment of long-term changes in carotenoids/chlorophyll ratio and short-term changes in de-epoxidation state of the xanthophyll cycle. Int. J. Remote Sens. 2009, 30, 4443–4455. [Google Scholar] [CrossRef]
- Coops, N.C.; Hilker, T.; Hall, F.G.; Nichol, C.J.; Drolet, G.G. Estimation of light-use efficiency of terrestrial ecosystems from space: A status report. Bioscience 2010, 60, 788–797. [Google Scholar] [CrossRef]
- Guarini, R.; Nichol, C.; Clement, R.; Loizzo, R.; Grace, J.; Borghetti, M. The utility of MODIS-sPRI for investigating the photosynthetic light-use efficiency in a Mediterranean deciduous forest. Int. J. Remote Sens. 2014, 35, 6157–6172. [Google Scholar] [CrossRef]
- Nichol, C.J.; Huemmrich, K.F.; Black, T.A.; Jarvis, P.G.; Walthall, C.L.; Grace, J.; Hall, F.G. Remote sensing of photosynthetic-light-use efficiency of boreal forest. Agric. For. Meteorol. 2000, 101, 131–142. [Google Scholar] [CrossRef]
- Peñuelas, J.; Inoue, Y. Reflectance assessment of canopy CO2 uptake. Int. J. Remote Sens. 2000, 21, 3353–3356. [Google Scholar]
- Garbulsky, M.F.; Peñuelas, J.; Ogaya, R.; Filella, I. Leaf and stand-level carbon uptake of a Mediterranean forest estimated using the satellite-derived reflectance indices EVI and PRI. Int. J. Remote Sens. 2013, 34, 1282–1296. [Google Scholar] [CrossRef]
- Garbulsky, M.F.; Peñuelas, J.; Papale, D.; Filella, I. Remote estimation of carbon dioxide uptake by a Mediterranean forest. Glob. Chang. Biol. 2008, 14, 2860–2867. [Google Scholar] [CrossRef]
- Ripullone, F.; Rivelli, A.R.; Baraldi, R.; Guarini, R.; Guerrieri, R.; Magnani, F.; Peñuelas, J.; Raddi, S.; Borghetti, M. Effectiveness of the photochemical reflectance index to track photosynthetic activity over a range of forest tree species and plant water statuses. Funct. Plant Biol. 2011, 38, 177–186. [Google Scholar] [CrossRef]
- Moreno, A.; Maselli, F.; Gilabert, M.A.; Chiesi, M.; Martínez, B.; Seufert, G. Assessment of MODIS imagery to track light-use efficiency in a water-limited Mediterranean pine forest. Remote Sens. Environ. 2012, 123, 359–367. [Google Scholar] [CrossRef]
- Evain, S.; Flexas, J.; Moya, I. A new instrument for passive remote sensing: 2. Measurement of leaf and canopy reflectance changes at 531 nm and their relationship with photosynthesis and chlorophyll fluorescence. Remote Sens. Environ. 2004, 91, 175–185. [Google Scholar] [CrossRef]
- Filella, I.; Amaro, T.; Araus, J.L.; Peñuelas, J. Relationship between photosynthetic radiation-use efficiency of barley canopies and the photochemical reflectance index (PRI). Physiol. Plant. 1996, 96, 211–216. [Google Scholar] [CrossRef]
- Gamon, J.A.; Serrano, L.; Surfus, J.S. The photochemical reflectance index: An optical indicator of photosynthetic radiation use efficiency across species, functional types, and nutrient levels. Oecologia 1997, 112, 492–501. [Google Scholar] [CrossRef]
- Guo, J.; Trotter, C.M. Estimating photosynthetic light-use efficiency using the photochemical reflectance index: Variations among species. Funct. Plant Biol. 2004, 31, 255–265. [Google Scholar] [CrossRef]
- Meroni, M.; Rossini, M.; Picchi, V.; Panigada, C.; Cogliati, S.; Nali, C.; Colombo, R. Assessing steady-state fluorescence and PRI from hyperspectral proximal sensing as early indicators of plant stress: The case of ozone exposure. Sensors 2008, 8, 1740–1754. [Google Scholar] [CrossRef]
- Meroni, M.; Picchi, V.; Rossini, M.; Cogliati, S.; Panigada, C.; Nali, C.; Lorenzini, G.; Colombo, R. Leaf level early assessment of ozone injuries by passive fluorescence and photochemical reflectance index. Int. J. Remote Sens. 2008, 29, 5409–5422. [Google Scholar] [CrossRef]
- Middleton, E.M.; Cheng, Y.B.; Hilker, T.; Black, T.A.; Krishnan, P.; Coops, N.C.; Huemmrich, K.F. Linking foliage spectral responses to canopy-level ecosystem photosynthetic light-use efficiency at a Douglas-fir forest in Canada. Can. J. Remote Sens. 2009, 35, 166–188. [Google Scholar] [CrossRef]
- Nakaji, T.; Ide, R.; Takagi, K.; Kosugi, Y.; Ohkubo, S.; Nasahara, K.N.; Saigusa, N.; Oguma, H. Utility of spectral vegetation indices for estimation of light conversion efficiency in coniferous forests in Japan. Agric. For. Meteorol. 2008, 148, 776–787. [Google Scholar] [CrossRef]
- Peguero-Pina, J.J.; Morales, F.; Flexas, J.; Gil-Pelegrín, E.; Moya, I. Photochemistry, remotely sensed physiological reflectance index and de-epoxidation state of the xanthophyll cycle in Quercus coccifera under intense drought. Oecologia 2008, 156, 1–11. [Google Scholar] [CrossRef] [PubMed]
- Peñuelas, J.; Llusia, J.; Pinol, J.; Filella, I. Photochemical reflectance index and leaf photosynthetic radiation-use-efficiency assessment in Mediterranean trees. Int. J. Remote Sens. 1997, 18, 2863–2868. [Google Scholar] [CrossRef]
- Sims, D.A.; Gamon, J.A. Relationship between leaf pigment content and spectral reflectance across a wide range species, leaf structures and development stages. Remote Sens. Environ. 2002, 81, 337–354. [Google Scholar] [CrossRef]
- Sims, D.A.; Luo, H.; Hastings, S.; Oechel, W.C.; Rahman, A.F.; Gamon, J.A. Parallel adjustments in vegetation greenness and ecosystem CO2 exchange in response to drought in a southern California chaparral ecosystem. Remote Sens. Environ. 2006, 103, 289–303. [Google Scholar] [CrossRef]
- Strachan, I.B.; Pattey, E.; Boisvert, J.B. Impact of nitrogen and environmental conditions on corn as detected by hyperspectral reflectance. Remote Sens. Environ. 2002, 80, 213–224. [Google Scholar] [CrossRef]
- Weng, J.H.; Jhaung, L.H.; Jiang, J.Y.; Lai, G.M.; Liao, T.S. Down-regulation of photosystem 2 efficiency and spectral reflectance in mango leaves under very low irradiance and varied chilling treatments. Photosynthetica 2006, 44, 248–254. [Google Scholar] [CrossRef]
- Weng, J.H.; Chen, Y.N.; Liao, T.S. Relationships between chlorophyll fluorescence parameters and photochemical reflectance index of tree species adapted to different temperature regimes. Funct. Plant Biol. 2006, 33, 241–246. [Google Scholar] [CrossRef]
- Peñuelas, J.; Filella, I.; Gamon, J.A.; Field, C.B. Assessing photosynthetic radiation-use efficiency of emergent aquatic vegetation from spectral reflectance. Aquat. Bot. 1997, 58, 307–315. [Google Scholar] [CrossRef]
- Lovelock, C.E.; Robinson, S.A. Surface reflectance properties of antarctic moss and their relationship to plant species, pigment composition and photosynthetic function. Plant Cell Environ. 2002, 25, 1239–1250. [Google Scholar] [CrossRef]
- Yamano, H.; Chen, J.; Zhang, Y.; Tamura, M. Relating photosynthesis of biological soil crusts with reflectance: Preliminary assessment based on a hydration experiment. Int. J. Remote Sens. 2006, 27, 5393–5399. [Google Scholar] [CrossRef]
- Van Gaalen, K.E.; Flanagan, L.B.; Peddle, D.R. Photosynthesis, chlorophyll fluorescence and spectral reflectance in Sphagnum moss at varying water contents. Oecologia 2007, 153, 19–28. [Google Scholar] [CrossRef] [PubMed]
- Jupa, R.; Hájek, J.; Hazdrová, J.; Barták, M. Interspecific differences in photosynthetic efficiency and spectral reflectance in two Umbilicaria species from Svalbard during controlled desiccation. Czech Polar Rep. 2012, 40, 31–41. [Google Scholar] [CrossRef]
- Louis, J.; Ounis, A.; Ducruet, J.M.; Evain, S.; Laurila, T.; Thum, T.; Aurela, M.; Wingsle, G.; Alonso, L.; Pedros, R.; et al. Remote sensing of sunlight-induced chlorophyll fluorescence and reflectance of Scots pine in the boreal forest during spring recovery. Remote Sens. Environ. 2005, 96, 37–48. [Google Scholar] [CrossRef]
- Nichol, C.J.; Lloyd, J.; Shibistova, O.; Arneth, A.; Röser, C.; Knohl, A.; Matsubara, S.; Grace, J. Remote sensing of photosynthetic-light-use efficiency of a Siberian boreal forest. Tellus B 2002, 54, 677–687. [Google Scholar] [CrossRef]
- Wong, C.Y.S.; Gamon, J.A. The photochemical reflectance index provides an optical indicator of spring photosynthetic activation in evergreen conifers. New Phytol. 2015, 206, 196–208. [Google Scholar] [CrossRef] [PubMed]
- Wong, C.Y.S.; Gamon, J.A. Three causes of variation in the photochemical reflectance index (PRI) in evergreen conifers. New Phytol. 2015, 206, 187–195. [Google Scholar] [CrossRef] [PubMed]
- Drolet, G.G.; Huemmrich, K.F.; Hall, F.G.; Middleton, E.M.; Black, T.A.; Barr, A.G.; Margolis, H.A. A MODIS-derived photochemical reflectance index to detect inter-annual variations in the photosynthetic light-use efficiency of a boreal deciduous forest. Remote Sens. Environ. 2005, 98, 212–224. [Google Scholar] [CrossRef]
- Goerner, A.; Reichstein, M.; Rambal, S. Tracking seasonal drought effects on ecosystem light use efficiency with satellite-based PRI in a Mediterranean forest. Remote Sens. Environ. 2009, 113, 1101–1111. [Google Scholar] [CrossRef]
- Rahman, A.F.; Cordova, V.D.; Gamon, J.A.; Schmid, H.P.; Sims, D.A. Potential of MODIS ocean bands for estimating CO2 flux from terrestrial vegetation: A novel approach. Geophys. Res. Lett. 2004, 31, 3–6. [Google Scholar] [CrossRef]
- Rahman, A.F.; Gamon, J.A.; Fuentes, D.A.; Roberts, D.A.; Prentiss, D. Modeling spatially distributed ecosystem flux of boreal forest using hyperspectral indices from AVIRIS imagery. J. Geophys. Res. 2001, 106, 33579–33591. [Google Scholar] [CrossRef]
- Stagakis, S.; Markos, N.; Sykioti, O.; Kyparissis, A. Tracking seasonal changes of leaf and canopy light use efficiency in a Phlomis fruticosa Mediterranean ecosystem using field measurements and multi-angular satellite hyperspectral imagery. ISPRS J. Photogramm. Remote Sens. 2014, 97, 138–151. [Google Scholar] [CrossRef]
- Gamon, J.A.; Field, C.B.; Goulden, M.L.; Griffin, K.L.; Hartley, A.E.; Joel, G.; Peñuelas, J.; Valentini, R. Relationships Between NDVI, canopy structure, and photosynthesis in three Californian vegetation types. Ecol. Appl. 1995, 21, 28–41. [Google Scholar] [CrossRef]
- Mänd, P.; Hallik, L.; Peñuelas, J.; Nilson, T.; Duce, P.; Emmett, B.A.; Beier, C.; Estiarte, M.; Garadnai, J.; Kalapos, T.; Schmidt, I.K.; Kovács-Láng, E.; Prieto, P.; Tietema, A.; Westerveld, J.W.; Kull, O. Responses of the reflectance indices PRI and NDVI to experimental warming and drought in European shrublands along a north-south climatic gradient. Remote Sens. Environ. 2010, 114, 626–636. [Google Scholar] [CrossRef]
- Stylinski, C.D.; Gamon, J.A.; Oechel, W.C. Seasonal patterns of reflectance indices, carotenoid pigments and photosynthesis of evergreen chaparral species. Oecologia 2002, 131, 366–374. [Google Scholar]
- Drolet, G.G.; Middleton, E.M.; Huemmrich, K.F.; Hall, F.G.; Amiro, B.D.; Barr, A.G.; Black, T.A.; McCaughey, J.H.; Margolis, H.A. Regional mapping of gross light-use efficiency using MODIS spectral indices. Remote Sens. Environ. 2008, 112, 3064–3078. [Google Scholar] [CrossRef]
- Peñuelas, J.; Bartrons, M.; Llusia, J.; Filella, I. Sensing the energetic status of plants and ecosystems. Trends Plant Sci. 2015, 20, 528–530. [Google Scholar] [CrossRef] [PubMed]
- Song, C.; Dannenberg, M.P.; Hwang, T. Optical remote sensing of terrestrial ecosystem primary productivity. Prog. Phys. Geogr. 2013, 37, 834–854. [Google Scholar] [CrossRef]
- Gamon, J.A.; Berry, J.A. Facultative and constitutive pigment effects on the Photochemical Reflectance Index (PRI) in sun and shade conifer needles. Isr. J. Plant Sci. 2012, 60, 85–95. [Google Scholar] [CrossRef]
- Hall, F.G.; Hilker, T.; Coops, N.C.; Lyapustin, A.; Huemmrich, K.F.; Middleton, E.; Margolis, H.; Drolet, G.; Black, T.A. Multi-angle remote sensing of forest light use efficiency by observing PRI variation with canopy shadow fraction. Remote Sens. Environ. 2008, 112, 3201–3211. [Google Scholar] [CrossRef]
- Hernández-Clemente, R.; Navarro-Cerrillo, R.M.; Suárez, L.; Morales, F.; Zarco-Tejada, P.J. Assessing structural effects on PRI for stress detection in conifer forests. Remote Sens. Environ. 2011, 115, 2360–2375. [Google Scholar] [CrossRef]
- Hilker, T.; Lyapustin, A.; Hall, F.G.; Wang, Y.; Coops, N.C.; Drolet, G.; Black, T.A. An assessment of photosynthetic light use efficiency from space: Modeling the atmospheric and directional impacts on PRI reflectance. Remote Sens. Environ. 2009, 113, 2463–2475. [Google Scholar] [CrossRef]
- Hilker, T.; Coops, N.C.; Hall, F.G.; Nichol, C.J.; Lyapustin, A.; Black, T.A.; Wulder, M.A.; Leuning, R.; Barr, A.; Hollinger, D.Y.; et al. Inferring terrestrial photosynthetic light use efficiency of temperate ecosystems from space. J. Geophys. Res. Biogeosciences 2011, 116, 1–11. [Google Scholar] [CrossRef]
- Porcar-Castell, A.; Garcia-Plazaola, J.I.; Nichol, C.J.; Kolari, P.; Olascoaga, B.; Kuusinen, N.; Fernández-Marín, B.; Pulkkinen, M.; Juurola, E.; Nikinmaa, E. Physiology of the seasonal relationship between the photochemical reflectance index and photosynthetic light use efficiency. Oecologia 2012, 170, 313–323. [Google Scholar] [CrossRef] [PubMed]
- Suáez, L.; Zarco-Tejada, P.J.; Sepulcre-Cantó, G.; Pérez-Priego, O.; Miller, J.R.; Jiménez-Muñoz, J.C.; Sobrino, J. Assessing canopy PRI for water stress detection with diurnal airborne imagery. Remote Sens. Environ. 2008, 112, 560–575. [Google Scholar]
- Suárez, L.; Zarco-Tejada, P.J.; Berni, J.A.J.; González-Dugo, V.; Fereres, E. Modelling PRI for water stress detection using radiative transfer models. Remote Sens. Environ. 2009, 113, 730–744. [Google Scholar] [CrossRef]
- Zarco-Tejada, P.J.; González-Dugo, V.; Williams, L.E.; Suárez, L.; Berni, J.A.J.; Goldhamer, D.; Fereres, E. A PRI-based water stress index combining structural and chlorophyll effects: Assessment using diurnal narrow-band airborne imagery and the CWSI thermal index. Remote Sens. Environ. 2013, 138, 38–50. [Google Scholar] [CrossRef]
- Gamon, J.A.; Kovalchuck, O.; Wong, C.Y.S.; Harris, A.; Garrity, S.R. Monitoring seasonal and diurnal changes in photosynthetic pigments with automated PRI and NDVI sensors. Biogeosciences 2015, 12, 4149–4159. [Google Scholar] [CrossRef]
- Nakaji, T.; Kosugi, Y.; Takanashi, S.; Niiyama, K.; Noguchi, S.; Tani, M.; Oguma, H.; Nik, A.R.; Kassim, A.R. Estimation of light-use efficiency through a combinational use of the photochemical reflectance index and vapor pressure deficit in an evergreen tropical rainforest at Pasoh, Peninsular Malaysia. Remote Sens. Environ. 2014, 150, 82–92. [Google Scholar] [CrossRef]
- Guo, J.M.; Trotter, C.M. Estimating photosynthetic light-use efficiency using the photochemical reflectance index: the effects of short-term exposure to elevated CO2 and low temperature. Int. J. Remote Sens. 2006, 27, 4677–4684. [Google Scholar] [CrossRef]
- Goerner, A.; Reichstein, M.; Tomelleri, E.; Hanan, N.; Rambal, S.; Papale, D.; Dragoni, D.; Schmullius, C. Remote sensing of ecosystem light use efficiency with MODIS-based PRI. Biogeosciences 2011, 8, 189–202. [Google Scholar] [CrossRef]
- Nakaji, T.; Oguma, H.; Fujinuma, Y. Seasonal changes in the relationship between photochemical reflectance index and photosynthetic light use efficiency of Japanese larch needles. Int. J. Remote Sens. 2006, 27, 493–509. [Google Scholar] [CrossRef]
- Cheng, Y.B.; Middleton, E.M.; Zhang, Q.; Huemmrich, K.F.; Campbell, P.K.E.; Corp, L.A.; Cook, B.D.; Kustas, W.P.; Daughtry, C.S. Integrating solar induced fluorescence and the photochemical reflectance index for estimating gross primary production in a cornfield. Remote Sens. 2013, 5, 6857–6879. [Google Scholar] [CrossRef]
- Cheng, Y.B.; Middleton, E.M.; Huemmrich, K.F.; Zhang, Q.; Campbell, P.K.E.; Corp, L.A.; Russ, A.L.; Kustas, W.P. Utilizing in situ directional hyperspectral measurements to validate bio-indicator simulations for a corn crop canopy. Ecol. Inform. 2010, 5, 330–338. [Google Scholar] [CrossRef]
- Cheng, Y.B.; Middleton, E.M.; Zhang, Q.; Corp, L.A.; Dandois, J.; Kustas, W.P. The photochemical reflectance index from directional cornfield reflectances: Observations and simulations. Remote Sens. Environ. 2012, 124, 444–453. [Google Scholar] [CrossRef]
- Gamon, J.A.; Bond, B. Effects of irradiance and photosynthetic downregulation on the photochemical reflectance index in Douglas-fir and ponderosa pine. Remote Sens. Environ. 2013, 135, 141–149. [Google Scholar] [CrossRef]
- Harris, A.; Gamon, J.A.; Pastorello, G.Z.; Wong, C.Y.S. Retrieval of the photochemical reflectance index for assessing xanthophyll cycle activity: A comparison of near-surface optical sensors. Biogeosciences 2014, 11, 6277–6292. [Google Scholar] [CrossRef]
- Hmimina, G.; Dufrêne, E.; Soudani, K. Relationship between photochemical reflectance index and leaf ecophysiological and biochemical parameters under two different water statuses: Towards a rapid and efficient correction method using real-time measurements. Plant Cell Environ. 2014, 37, 473–487. [Google Scholar] [CrossRef] [PubMed]
- Weng, J.H.; Jhaung, L.H.; Lin, R.J.; Chen, H.Y. Relationship between photochemical efficiency of photosystem II and the photochemical reflectance index of mango tree: Merging data from different illuminations, seasons and leaf colors. Tree Physiol. 2010, 30, 469–478. [Google Scholar] [CrossRef] [PubMed]
- Rahimzadeh-Bajgiran, P.; Munehiro, M.; Omasa, K. Relationships between the photochemical reflectance index (PRI) and chlorophyll fluorescence parameters and plant pigment indices at different leaf growth stages. Photosynth. Res. 2012, 113, 261–271. [Google Scholar] [CrossRef] [PubMed]
- Ibaraki, Y.; Gupta, S.D. Nondestructive evaluation of the photosynthetic properties of micropropagated plantlets by imaging photochemical reflectance index under low light intensity. In Vitro Cell. Dev. Biol. Plant 2010, 46, 530–536. [Google Scholar] [CrossRef]
- Sarlikioti, V.; Driever, S.M.; Marcelis, L.F.M. Photochemical reflectance index as a mean of monitoring early water stress. Ann. Appl. Biol. 2010, 157, 81–89. [Google Scholar] [CrossRef]
- Magney, T.S.; Eusden, S.A.; Eitel, J.U.H.; Logan, B.A.; Jiang, J.; Vierling, L.A. Assessing leaf photoprotective mechanisms using terrestrial LiDAR: Towards mapping canopy photosynthetic performance in three dimensions. New Phytol. 2014, 201, 344–356. [Google Scholar] [CrossRef] [PubMed]
- Kováč, D.; Malenovský, Z.; Urban, O.; Špunda, V.; Kalina, J.; Ač, A.; Kaplan, V.; Hanuš, J. Response of green reflectance continuum removal index to the xanthophyll de-epoxidation cycle in Norway spruce needles. J. Exp. Bot. 2013, 64, 1817–1827. [Google Scholar] [CrossRef] [PubMed]
- Osório, J.; Osório, M.L.; Romano, A. Reflectance indices as nondestructive indicators of the physiological status of Ceratonia siliqua seedlings under varying moisture and temperature regimes. Funct. Plant Biol. 2012, 39, 588–597. [Google Scholar] [CrossRef]
- Shrestha, S.; Brueck, H.; Asch, F. Chlorophyll index, photochemical reflectance index and chlorophyll fluorescence measurements of rice leaves supplied with different N levels. J. Photochem. Photobiol. B Biol. 2012, 113, 7–13. [Google Scholar] [CrossRef] [PubMed]
- Su, Y.; Zhang, Z.; Su, G.; Liu, J.; Liu, C.; Shi, G. Genotypic differences in spectral and photosynthetic response of peanut to iron deficiency. J. Plant Nutr. 2015, 38, 145–160. [Google Scholar] [CrossRef]
- Rajsnerová, P.; Klem, K.; Holub, P.; Novotná, K.; Večeřová, K.; Kozáčiková, M.; Rivas-Ubach, A.; Sardans, J.; Marek, M.V.; Peñuelas, J.; Urban, O. Morphological, biochemical and physiological traits of upper and lower canopy leaves of European beech tend to converge with increasing altitude. Tree Physiol. 2015, 35, 47–60. [Google Scholar] [CrossRef] [PubMed]
- Lv, Z.; Zhang, X.; Liu, L.; Guo, Y.; Fan, Y.; Yang, X.; Li, Y.; Zhang, W. Comparing intraspecific responses of 12 winter wheat cultivars to different doses of ultraviolet-B radiation. J. Photochem. Photobiol. B Biol. 2013, 119, 1–8. [Google Scholar] [CrossRef] [PubMed]
- Pallozzi, E.; Fortunati, A.; Marino, G.; Loreto, F.; Agati, G.; Centritto, M. BVOC emission from Populus × canadensis saplings in response to acute UV-A radiation. Physiol. Plant. 2013, 148, 51–61. [Google Scholar] [CrossRef] [PubMed]
- Ashourloo, D.; Mobasheri, M.R.; Huete, A. Evaluating the effect of different wheat rust disease symptoms on vegetation indices using hyperspectral measurements. Remote Sens. 2014, 6, 5107–5123. [Google Scholar] [CrossRef]
- Ashourloo, D.; Mobasheri, M.R.; Huete, A. Developing two spectral disease indices for detection of wheat leaf rust (Pucciniatriticina). Remote Sens. 2014, 6, 4723–4740. [Google Scholar] [CrossRef]
- Calderón, R.; Navas-Cortés, J.A.; Lucena, C.; Zarco-Tejada, P.J. High-resolution airborne hyperspectral and thermal imagery for early detection of Verticillium wilt of olive using fluorescence, temperature and narrow-band spectral indices. Remote Sens. Environ. 2013, 139, 231–245. [Google Scholar] [CrossRef]
- Elena, G.; Fernàndez-Martínez, J.; Zacchini, M.; Moret, A.; Fleck, I. Susceptibility to melampsora leaf rust of poplar clones from diverse genetic backgrounds: Effects on photochemistry and water relations. J. Plant Stud. 2014, 3, 1–12. [Google Scholar] [CrossRef]
- Xue, Z.; Gao, H.; Zhao, S. Effects of cadmium on the photosynthetic activity in mature and young leaves of soybean plants. Environ. Sci. Pollut. Res. 2014, 21, 4656–4664. [Google Scholar] [CrossRef] [PubMed]
- Mõttus, M.; Rautiainen, M. Scaling PRI between coniferous canopy structures. IEEE J. Sel. Top. Appl. Earth Obs. Remote Sens. 2013, 6, 708–714. [Google Scholar] [CrossRef]
- Garrity, S.R.; Eitel, J.U.H.; Vierling, L.A. Disentangling the relationships between plant pigments and the photochemical reflectance index reveals a new approach for remote estimation of carotenoid content. Remote Sens. Environ. 2011, 115, 628–635. [Google Scholar] [CrossRef]
- Cogliati, S.; Rossini, M.; Julitta, T.; Meroni, M.; Schickling, A.; Burkart, A.; Pinto, F.; Rascher, U.; Colombo, R. Continuous and long-term measurements of reflectance and sun-induced chlorophyll fluorescence by using novel automated field spectroscopy systems. Remote Sens. Environ. 2015, 164, 270–281. [Google Scholar] [CrossRef]
- Hmimina, G.; Merlier, E.; Dufrêne, E.; Soudani, K. Deconvolution of pigment and physiologically related photochemical reflectance index variability at the canopy scale over an entire growing season. Plant Cell Environ. 2015, 38, 1578–1590. [Google Scholar] [CrossRef] [PubMed]
- Damm, A.; Guanter, L.; Verhoef, W.; Schläpfer, D.; Garbari, S.; Schaepman, M.E. Impact of varying irradiance on vegetation indices and chlorophyll fluorescence derived from spectroscopy data. Remote Sens. Environ. 2015, 156, 202–215. [Google Scholar] [CrossRef]
- Wu, C.; Niu, Z.; Tang, Q.; Huang, W. Revised photochemical reflectance index (PRI) for predicting light use efficiency of wheat in a growth cycle: Validation and comparison. Int. J. Remote Sens. 2010, 31, 2911–2924. [Google Scholar] [CrossRef]
- Liu, L.; Zhang, Y.; Jiao, Q.; Peng, D. Assessing photosynthetic light-use efficiency using a solar-induced chlorophyll fluorescence and photochemical reflectance index. Int. J. Remote Sens. 2013, 34, 4264–4280. [Google Scholar] [CrossRef]
- Zinnert, J.C.; Nelson, J.D.; Hoffman, A.M. Effects of salinity on physiological responses and the photochemical reflectance index in two co-occurring coastal shrubs. Plant Soil 2012, 354, 45–55. [Google Scholar] [CrossRef]
- Harris, A.; Owen, S.M.; Sleep, D.; Pereira, M.D. Constitutive changes in pigment concentrations: implications for estimating isoprene emissions using the photochemical reflectance index. Physiol. Plant. 2016, 156, 190–200. [Google Scholar] [CrossRef] [PubMed]
- Weng, J.H.; Wong, S.L.; Lai, K.M.; Lin, R.J. Relationships between photosystem II efficiency and photochemical reflectance index under different levels of illumination: Comparison among species grown at high- and low elevations through different seasons. Trees-Struct. Funct. 2012, 26, 343–351. [Google Scholar] [CrossRef]
- Nyongesah, M.J.; Wang, Q.; Li, P. Effectiveness of photochemical reflectance index to trace vertical and seasonal chlorophyll a/b ratio in Haloxylon ammodendron. Acta Physiol. Plant. 2015, 37. [Google Scholar] [CrossRef]
- Ainsworth, E.A.; Serbin, S.P.; Skoneczka, J.A.; Townsend, P.A. Using leaf optical properties to detect ozone effects on foliar biochemistry. Photosynth. Res. 2014, 119, 65–76. [Google Scholar] [CrossRef] [PubMed]
- Ghulam, A.; Fishman, J.; Maimaitiyiming, M.; Wilkins, J.L.; Maimaitijiang, M.; Welsh, J.; Bira, B.; Grzovic, M. Characterizing crop responses to background ozone in open-air agricultural field by using reflectance spectroscopy. IEEE Geosci. Remote Sens. Lett. 2015, 12, 1307–1311. [Google Scholar] [CrossRef]
- Hernández-Clemente, R.; Navarro-Cerrillo, R.M.; Zarco-Tejada, P.J. Carotenoid content estimation in a heterogeneous conifer forest using narrow-band indices and PROSPECT + DART simulations. Remote Sens. Environ. 2012, 127, 298–315. [Google Scholar] [CrossRef]
- Barták, M.; Trnková, K.; Hansen, E.S.; Hazdrová, J.; Skácelová, K.; Hájek, J.; Forbelská, M. Effect of dehydration on spectral reflectance and photosynthetic efficiency in Umbilicaria arctica and U. hyperborea. Biol. Plant. 2015, 59, 357–365. [Google Scholar] [CrossRef]
- Sun, P.; Wahbi, S.; Tsonev, T.; Haworth, M.; Liu, S.; Centritto, M. On the use of leaf spectral indices to assess water status and photosynthetic limitations in Olea europaea L. during water-stress and recovery. PLoS ONE 2014, 9, e105165. [Google Scholar] [CrossRef] [PubMed]
- Zarco-Tejada, P.J.; González-Dugo, V.; Berni, J.A.J. Fluorescence, temperature and narrow-band indices acquired from a UAV platform for water stress detection using a micro-hyperspectral imager and a thermal camera. Remote Sens. Environ. 2012, 117, 322–337. [Google Scholar] [CrossRef]
- Tsonev, T.; Wahbi, S.; Sun, P.; Sorrentino, G.; Centritto, M. Gas exchange, water relations and their relationships with photochemical reflectance index in Quercus ilex plants during water stress and recovery. Int. J. Agric. Biol. 2014, 16, 335–341. [Google Scholar]
- Naumann, J.C.; Bissett, S.N.; Young, D.R.; Edwards, J.; Anderson, J.E. Diurnal patterns of photosynthesis, chlorophyll fluorescence, and PRI to evaluate water stress in the invasive species, Elaeagnus umbellata Thunb. Trees-Struct. Funct. 2010, 24, 237–245. [Google Scholar] [CrossRef]
- Soudani, K.; Hmimina, G.; Dufrêne, E.; Berveiller, D.; Delpierre, N.; Ourcival, J.M.; Rambal, S.; Joffre, R. Relationships between photochemical reflectance index and light-use efficiency in deciduous and evergreen broadleaf forests. Remote Sens. Environ. 2014, 144, 73–84. [Google Scholar] [CrossRef]
- Wu, C.; Huang, W.; Yang, Q.; Xie, Q. Improved estimation of light use efficiency by removal of canopy structural effect from the photochemical reflectance index (PRI). Agric. Ecosyst. Environ. 2015, 199, 333–338. [Google Scholar] [CrossRef]
- Marino, G.; Pallozzi, E.; Cocozza, C.; Tognetti, R.; Giovannelli, A.; Cantini, C.; Centritto, M. Assessing gas exchange, sap flow and water relations using tree canopy spectral reflectance indices in irrigated and rainfed Olea europaea L. Environ. Exp. Bot. 2014, 99, 43–52. [Google Scholar] [CrossRef]
- Stagakis, S.; González-Dugo, V.; Cid, P.; Guillén-Climent, M.L.; Zarco-Tejada, P.J. Monitoring water stress and fruit quality in an orange orchard under regulated deficit irrigation using narrow-band structural and physiological remote sensing indices. ISPRS J. Photogramm. Remote Sens. 2012, 71, 47–61. [Google Scholar] [CrossRef]
- Gray, S.B.; Dermody, O.; DeLucia, E.H. Spectral reflectance from a soybean canopy exposed to elevated CO2 and O3. J. Exp. Bot. 2010, 61, 4413–4422. [Google Scholar] [CrossRef] [PubMed]
- Suárez, L.; Zarco-Tejada, P.J.; Gonzáez-Dugo, V.; Berni, J.A.J.; Sagardoy, R.; Morales, F.; Fereres, E. Detecting water stress effects on fruit quality in orchards with time-series PRI airborne imagery. Remote Sens. Environ. 2010, 114, 286–298. [Google Scholar] [CrossRef]
- Rossini, M.; Meroni, M.; Migliavacca, M.; Manca, G.; Cogliati, S.; Busetto, L.; Picchi, V.; Cescatti, A.; Seufert, G.; Colombo, R. High resolution field spectroscopy measurements for estimating gross ecosystem production in a rice field. Agric. For. Meteorol. 2010, 150, 1283–1296. [Google Scholar] [CrossRef]
- Van Leeuwen, M.; Kremens, R.L.; van Aardt, J. Tracking diurnal variation in photosynthetic down-regulation using low cost spectroscopic instrumentation. Sensors 2015, 15, 10616–10630. [Google Scholar] [CrossRef] [PubMed]
- Middleton, E.M.; Huemmrich, K.F.; Cheng, Y.B.; Margolis, H.A. Spectral bioindicators of photosynthetic efficiency and vegetation stress. In Hyperspectral Remote Sensing of Vegetation; CRC Press: Boca Raton, FL, USA, 2011; pp. 265–288. [Google Scholar]
- Stagakis, S.; Markos, N.; Sykioti, O.; Kyparissis, A. Monitoring canopy biophysical and biochemical parameters in ecosystem scale using satellite hyperspectral imagery: An application on a Phlomis fruticosa Mediterranean ecosystem using multiangular CHRIS/PROBA observations. Remote Sens. Environ. 2010, 114, 977–994. [Google Scholar] [CrossRef]
- Galvão, L.S.; Breunig, F.M.; dos Santos, J.R.; de Moura, Y.M. View-illumination effects on hyperspectral vegetation indices in the Amazonian tropical forest. Int. J. Appl. Earth Obs. Geoinf. 2013, 21, 291–300. [Google Scholar] [CrossRef]
- Sims, D.A.; Rahman, A.F.; Vermote, E.F.; Jiang, Z. Seasonal and inter-annual variation in view angle effects on MODIS vegetation indices at three forest sites. Remote Sens. Environ. 2011, 115, 3112–3120. [Google Scholar] [CrossRef]
- Vicca, S.; Balzarolo, M.; Filella, I.; Granier, A.; Herbst, M.; Knohl, A.; Longdoz, B.; Mund, M.; Nagy, Z.; Pintér, K.; et al. Remotely-sensed detection of effects of extreme droughts on gross primary production. Sci. Rep. 2016, 6, 1–13. [Google Scholar] [CrossRef] [PubMed]
- Rossini, M.; Cogliati, S.; Meroni, M.; Migliavacca, M.; Galvagno, M.; Busetto, L.; Cremonese, E.; Julitta, T.; Siniscalco, C.; Morra Di Cella, U.; et al. Remote sensing-based estimation of gross primary production in a subalpine grassland. Biogeosciences 2012, 9, 2565–2584. [Google Scholar] [CrossRef] [Green Version]
- Drolet, G.; Wade, T.; Nichol, C.J.; MacLellan, C.; Levula, J.; Porcar-Castell, A.; Nikinmaa, E.; Vesala, T. A temperature-controlled spectrometer system for continuous and unattended measurements of canopy spectral radiance and reflectance. Int. J. Remote Sens. 2014, 35, 1769–1785. [Google Scholar] [CrossRef]
- Gamon, J.A.; Rahman, A.F.; Dungan, J.L.; Schildhauer, M.; Huemmrich, K.F. Spectral Network (SpecNet)—What is it and why do we need it? Remote Sens. Environ. 2006, 103, 227–235. [Google Scholar] [CrossRef]
- Pacheco-Labrador, J.; Martín, M.P. Nonlinear response in a field portable spectroradiometer: Characterization and effects on output reflectance. IEEE Trans. Geosci. Remote Sens. 2014, 52, 920–928. [Google Scholar] [CrossRef]
- Ibaraki, Y.; Matsumura, K.; Dutta Gupta, S. Low-cost photochemical reflectance index measurements of micropropagated plantlets using image analysis. Comput. Electron. Agric. 2010, 71, 170–175. [Google Scholar] [CrossRef]
- Peñuelas, J.; Marino, G.; Llusia, J.; Morfopoulos, C.; Farré-Armengol, G.; Filella, I. Photochemical reflectance index as an indirect estimator of foliar isoprenoid emissions at the ecosystem level. Nat. Commun. 2013, 4, 2604. [Google Scholar] [CrossRef] [PubMed]
- Stratoulias, D.; Balzter, H.; Zlinszky, A.; Tóth, V.R. Assessment of ecophysiology of lake shore reed vegetation based on chlorophyll fluorescence, field spectroscopy and hyperspectral airborne imagery. Remote Sens. Environ. 2015, 157, 72–84. [Google Scholar] [CrossRef] [Green Version]
- Sun, C.X.; Yuan, F.; Zhang, Y.L.; Cui, Z.B.; Chen, Z.H.; Chen, L.J.; Wu, Z.J. Unintended effects of genetic transformation on photosynthetic gas exchange, leaf reflectance and plant growth properties in barley (Hordeum vulgare L.). Photosynthetica 2013, 51, 22–32. [Google Scholar] [CrossRef]
- Yoshizumi, Y.; Li, M.S.; Akihiro, I. Assessment of photochemical reflectance index as a tool for evaluation of chlorophyll fluorescence parameters in cotton and peanut cultivars under water stress condition. Agric. Sci. China 2010, 9, 662–670. [Google Scholar]
- Šebela, D.; Quiñones, C.; Olejníčková, J.; Jagadish, K.S.V. Temporal chlorophyll fluorescence signals to track changes in optical properties of maturing rice panicles exposed to high night temperature. Field Crop. Res. 2015, 177, 75–85. [Google Scholar] [CrossRef]
- Delalieux, S.; Zarco-tejada, P.J.; Somers, B.; Delalieux, S.; Zarco-tejada, P.J.; Tits, L.; Ángel, M.; Bello, J.; Intrigliolo, D.S.; Somers, B. Unmixing-based fusion of hyperspatial and hyperspectral airborne imagery for early detection of vegetation stress. IEEE J. Sel. Top. Appl. Earth Obs. Remote Sens. 2014, 7, 2571–2582. [Google Scholar] [CrossRef]
- Rossini, M.; Panigada, C.; Cilia, C.; Meroni, M.; Busetto, L.; Cogliati, S.; Amaducci, S.; Colombo, R. Discriminating irrigated and rainfed maize with diurnal fluorescence and canopy temperature airborne maps. ISPRS Int. J. Geo-Inf. 2015, 4, 626–646. [Google Scholar] [CrossRef] [Green Version]
- Panigada, C.; Rossini, M.; Meroni, M.; Cilia, C.; Busetto, L.; Amaducci, S.; Boschetti, M.; Cogliati, S.; Picchi, V.; Pinto, F.; et al. Fluorescence, PRI and canopy temperature for water stress detection in cereal crops. Int. J. Appl. Earth Obs. Geoinf. 2014, 30, 167–178. [Google Scholar] [CrossRef]
- Zarco-Tejada, P.J.; Morales, A.; Testi, L.; Villalobos, F.J. Spatio-temporal patterns of chlorophyll fluorescence and physiological and structural indices acquired from hyperspectral imagery as compared with carbon fluxes measured with eddy covariance. Remote Sens. Environ. 2013, 133, 102–115. [Google Scholar] [CrossRef]
- Rossini, M.; Fava, F.; Cogliati, S.; Meroni, M.; Marchesi, A.; Panigada, C.; Giardino, C.; Busetto, L.; Migliavacca, M.; Amaducci, S.; et al. Assessing canopy PRI from airborne imagery to map water stress in maize. ISPRS J. Photogramm. Remote Sens. 2013, 86, 168–177. [Google Scholar] [CrossRef]
- Hall, F.G.; Hilker, T.; Coops, N.C. PHOTOSYNSAT, photosynthesis from space: Theoretical foundations of a satellite concept and validation from tower and spaceborne data. Remote Sens. Environ. 2011, 115, 1918–1925. [Google Scholar] [CrossRef]
- Kefauver, S.C.; Peñuelas, J.; Ustin, S. Using topographic and remotely sensed variables to assess ozone injury to conifers in the Sierra Nevada (USA) and Catalonia (Spain). Remote Sens. Environ. 2013, 139, 138–148. [Google Scholar] [CrossRef]
- Balzarolo, M.; Vescovo, L.; Hammerle, A.; Gianelle, D.; Papale, D.; Wohlfahrt, G. On the relationship between ecosystem-scale hyperspectral reflectance and CO2 exchange in European mountain grasslands. Biogeosci. Discuss. 2015, 11, 10323–10363. [Google Scholar] [CrossRef]
- Hilker, T.; Hall, F.G.; Tucker, C.J.; Coops, N.C.; Black, T.A.; Nichol, C.J.; Sellers, P.J.; Barr, A.; Hollinger, D.Y.; Munger, J.W. Data assimilation of photosynthetic light-use efficiency using multi-angular satellite data: II Model implementation and validation. Remote Sens. Environ. 2012, 121, 287–300. [Google Scholar] [CrossRef]
- Garrity, S.R.; Vierling, L.A.; Bickford, K. A simple filtered photodiode instrument for continuous measurement of narrowband NDVI and PRI over vegetated canopies. Agric. For. Meteorol. 2010, 150, 489–496. [Google Scholar] [CrossRef]
- Roujean, J.L.; Breon, F.M. Estimating PAR absorbed by vegetation from bidirectional reflectance measurements. Remote Sens. Environ. 1995, 51, 375–384. [Google Scholar] [CrossRef]
- Meroni, M.; Rossini, M.; Guanter, L.; Alonso, L.; Rascher, U.; Colombo, R.; Moreno, J. Remote sensing of solar-induced chlorophyll fluorescence: Review of methods and applications. Remote Sens. Environ. 2009, 113, 2037–2051. [Google Scholar] [CrossRef]
- Porcar-Castell, A.; Tyystjärvi, E.; Atherton, J.; Van Der Tol, C.; Flexas, J.; Pfündel, E.E.; Moreno, J.; Frankenberg, C.; Berry, J.A. Linking chlorophyll a fluorescence to photosynthesis for remote sensing applications: Mechanisms and challenges. J. Exp. Bot. 2014, 65, 4065–4095. [Google Scholar] [CrossRef] [PubMed]
- Brugnoli, E.; Björkman, O. Chloroplast movements in leaves: influence on chlorophyll fluorescence and measurements of light-induced absorbance changes related to ΔpH and zeaxanthin formation. Photosynth. Res. 1992, 32, 23–35. [Google Scholar] [CrossRef] [PubMed]
- Gago, J.; Douthe, C.; Coopman, R.E.; Gallego, P.P.; Ribas-Carbo, M.; Flexas, J.; Escalona, J.; Medrano, H. UAVs challenge to assess water stress for sustainable agriculture. Agric. Water Manag. 2015, 153, 9–19. [Google Scholar] [CrossRef]
- Sentinel Online—ESA. Available online: https://sentinel.esa.int/web/sentinel/home (accessed on 23 June 2016).
- EnMAP. Available online: www.enmap.org (accessed on 23 June 2016).
- WMO OSCAR—Space-Based Capabilities—Instruments: DESIS. Available online: https://www.wmo-sat.info/oscar/instruments/view/1082 (accessed on 23 June 2016).
- HyspIRI Mission Study Website. Available online: https://hyspiri.jpl.nasa.gov (accessed on 23 June 2016).
- Turtle, E.P.; McEwen, A.S.; Collins, G.C.; Fletcher, L.; Hansen, C.J.; Hayes, A.G.; Hurford, T.A.; Kirk, R.L.; Mlinar, A.C.B.; Nimmo, F.; et al. The europa imaging system (EIS): High-resolution imaging and topography to investigate Europa’s geology, ice shell, and potential for current activity. Lunar Planet. Sci. Conf. 2016, 47, 1626. [Google Scholar]
- Fluxnet. Available online: https://fluxnet.ornl.gov (accessed on 23 June 2016).


| Article Order by Published Date | Year | Reference | Scale | Variance Factor | Species/Vegetation Type | Vegetation Type | Sensor | Figure # | Ecophysiological Variable |
|---|---|---|---|---|---|---|---|---|---|
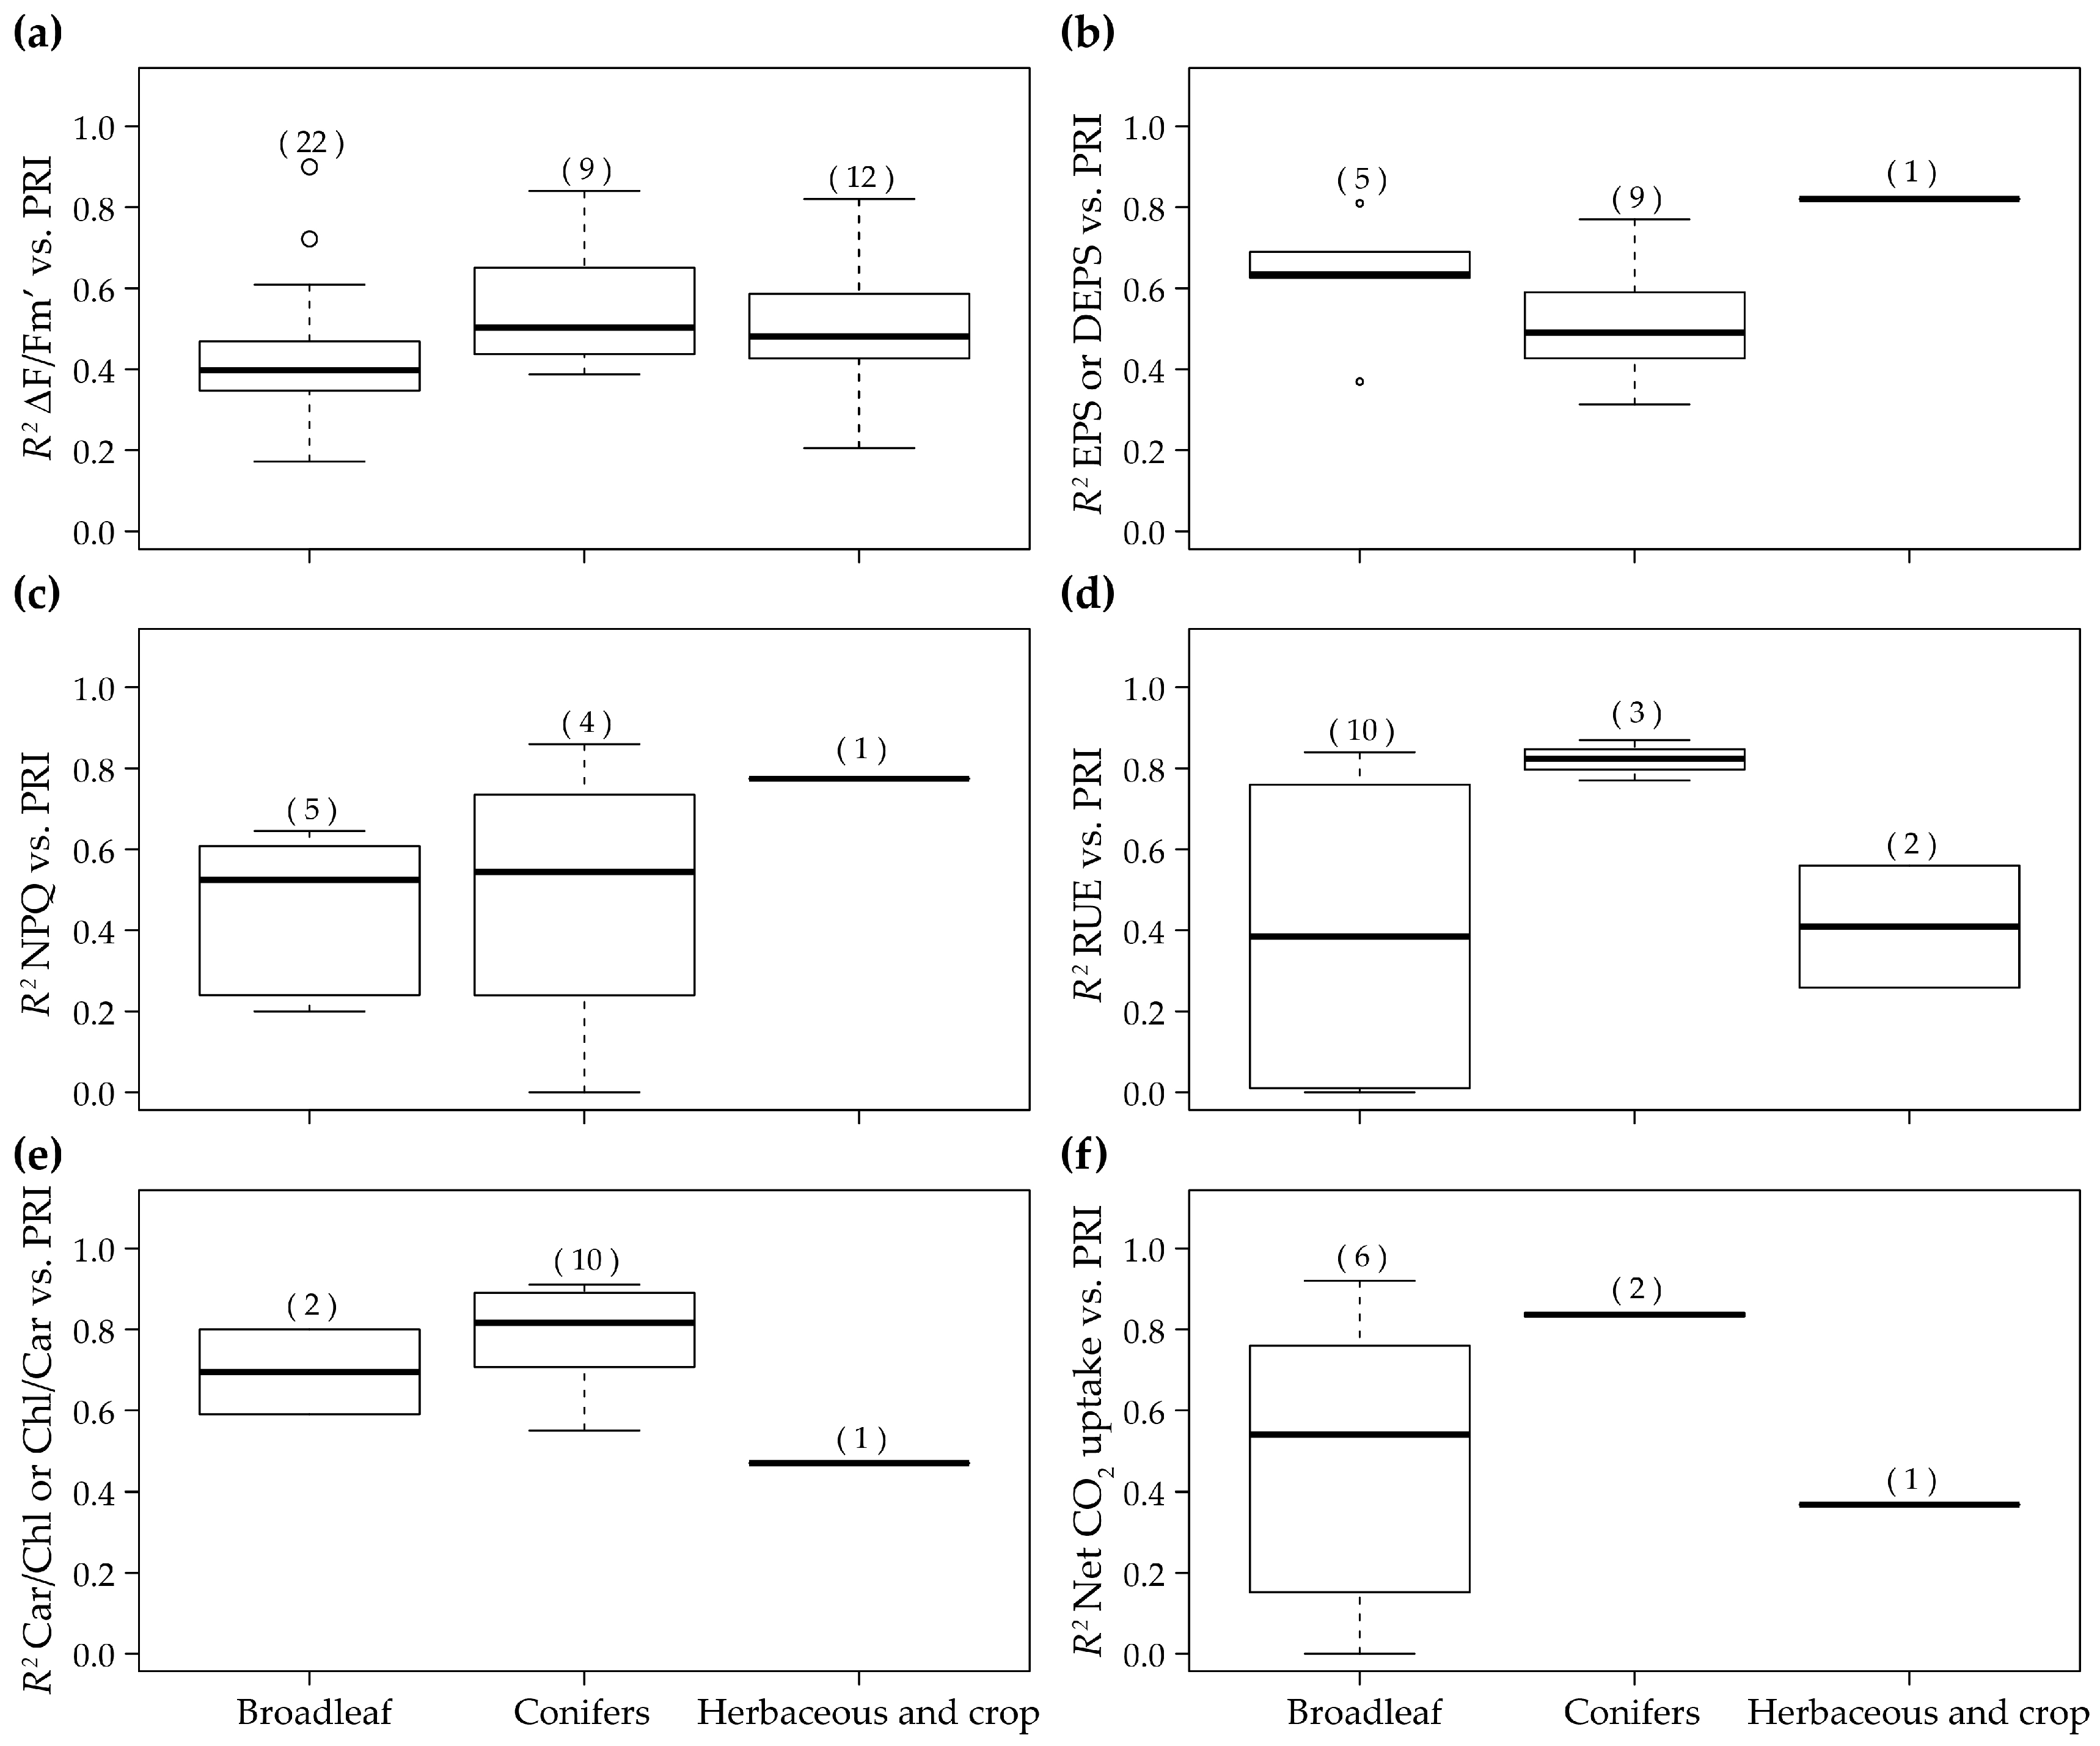
| 3 | 2010 | (Ibaraki et al. [140]) | Leaves | Diurnal | Strawberry, lettuce and potato | Herbaceous and crop | PRI imaging system | 1a | ΔF/Fm’ |
| 2 | 2010 | (Ibaraki and Gupta [89]) | Leaves | Diurnal | Potato | Herbaceous and crop | PRI imaging system | 2 | Fv/Fm |
| 35 | 2013 | (Kováč et al. [92]) | Leaves | Diurnal | Norway spruce (Picea abies) | Conifers | Spectrad | 1e | Chl/Car |
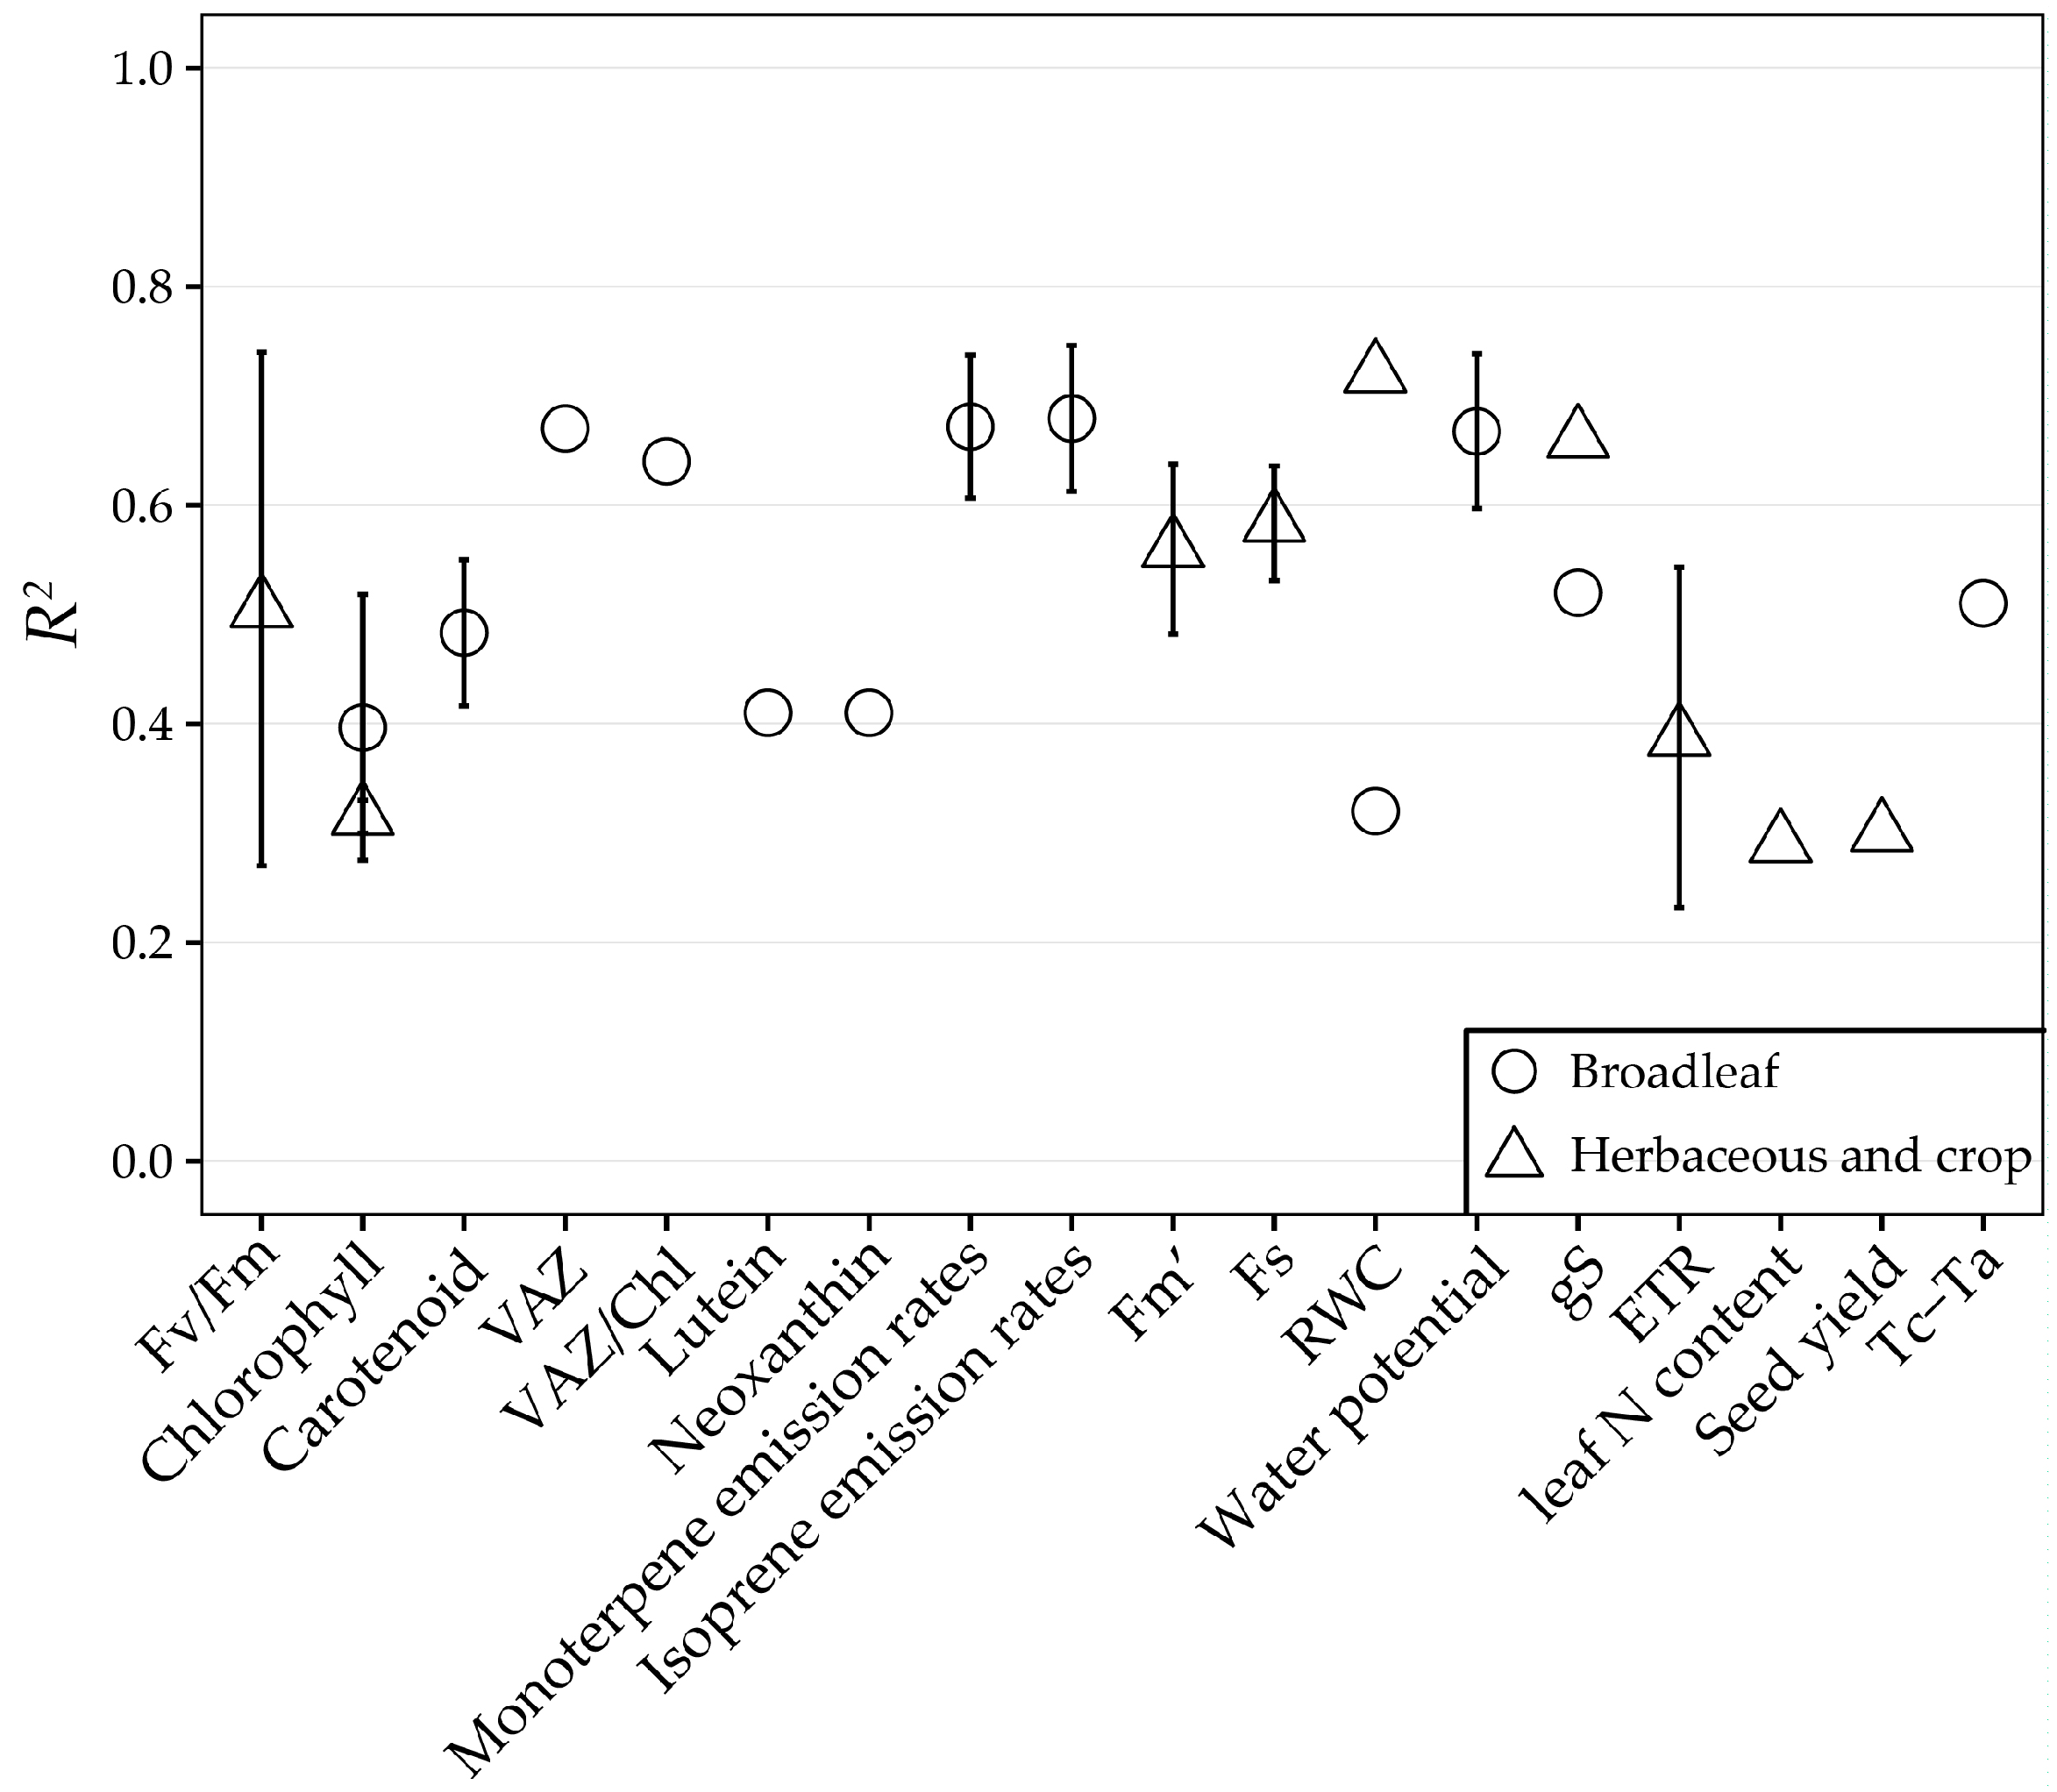
| 38 | 2013 | (Peñuelas et al. [141]) | Leaves | Diurnal | Populus nigra and Quercus ilex | Broadleaf | Spectrad | 2 | Monoterpene emission rates Isoprene emission rates |
| 48 | 2014 | (Magney et al. [91]) | Leaves | Diurnal | Sunflower, wheat, Quercus macrocarpa, Betula papyrifera, and Populus tremuloides | Herbaceous and crop and Broadleaf | Spectrad | 1c 1b | NPQ DEPS |
| 58 | 2016 | (Harris et al. [112]) | Leaves | Diurnal | Salix viminalis | Broadleaf | Specrad | 1d and 9 | RUE |
| 1f | Net CO2 uptake | ||||||||
| 1e | Car/Chl | ||||||||
| 2 | Isoprene emission rates VAZ Neoxanthin Lutein Chl Car VAZ/Chl | ||||||||
| 63 | 2015 | (Stratoulias et al. [142]) | Leaves | Diurnal | Shore reed | Herbaceous and crop | Specrad | 2 | Chl Fs Fm’ ETR |
| 43 | 2014 | (Ainsworth et al. [115]) | Leaves | Diurnal (Ozone) | Soybean | Herbaceous and crop | Specrad | 2 | Leaf N (%) Chl Seed Yield |
| 55 | 2014 | (Xue et al. [103]) | Leaves | Diurnal (Cd polution) | Soybean | Herbaceous and crop | Specrad | 1d and 9 | RUE |
| 1f | Net CO2 uptake | ||||||||
| 1a | ΔF/Fm’ | ||||||||
| 64 | 2015 | (Su et al. [95]) | Leaves | Diurnal (Fe deficiency) | Peanut | Herbaceous and crop | Specrad | 1d and 9 | RUE |
| 1f | Net CO2 uptake | ||||||||
| 40 | 2013 | (Sun et al. [143]) | Leaves | Diurnal (Genetic transformation) | Barley | Herbaceous and crop | Spectrad | 1d and 9 | RUE |
| 1f | Net CO2 uptake | ||||||||
| 21 | 2012 | (Osório et al. [93]) | Leaves | Diurnal (Moisture and temperature stress) | Ceratonia siliqua | Broadleaf | Spectrad | 1a | ΔF/Fm’ |
| 1c | NPQ | ||||||||
| 2 | RWC Water potential | ||||||||
| 25 | 2012 | (Shrestha et al. [94]) | leaves | Diurnal (N supply) | Rice | Herbaceous and crop | PlantPen PRI 200 | 1c | NPQ |
| 37 | 2013 | (Pallozzi et al. [98]) | Leaves | Diurnal (UVA stress) | Populus Canadensis | Broadleaf | Spectrad | 1d and 9 | RUE |
| 1f | Net CO2 uptake | ||||||||
| 1a | ΔF/Fm’ | ||||||||
| 30 | 2013 | (Calderón et al. [101]) | Leaves | Diurnal (Vericillium wilt) | Olive orchard | Broadleaf | PlantPen | 2 | Tc-Ta gS |
| 7 | 2010 | (Sarlikioti et al. [90]) | Leaves | Diurnal (Water stress) | Tomato | Herbaceous and crop | PlantPen PRI 200 | 1f | Net CO2 uptake |
| 2 | RWC gS | ||||||||
| 8 | 2010 | (Shahenshah et al. [144]) | Leaves | Diurnal (Water stress) | Cotton and Peanut | Herbaceous and crop | PMA-11 | 1a | ΔF/Fm’ |
| 1c | NPQ | ||||||||
| 13 | 2011 | (Garrity et al. [105]) | Leaves | Diurnal (Water stress) | Bur oak and 10 sugar maple | Broadleaf | Specrad | 1e | Car/Chl |
| 2 | Chl Car | ||||||||
| 18 | 2011 | (Ripullone et al. [30]) | Leaves | Diurnal (Water stress) | Arbutus unedo, Quercus ilex, Quercus pubescens, Quercus cerris, Quercus robur, Cannabis sativa, Fagus sylvatica and Populus euroamericana | Broadleaf | Specrad | 1d and 6 | RUE |
| 1f | Net CO2 uptake | ||||||||
| 1a | ΔF/Fm’ | ||||||||
| 1b | DEPS | ||||||||
| 2 | Water potential | ||||||||
| 27 | 2012 | (Weng et al. [113]) | Leaves | Diurnal/ Seasonal | Pinus taiwanensis, Stranvaesia niitakayamensis, two Miscanthus spp. and mango | Broadleaf, conifers and Herbaceous and crop | Spectrad | 1a and 3a | ΔF/Fm’ |
| 4 | Fv/Fm | ||||||||
| 23 | 2012 | (Rahimzadeh-Bajgira et al. [88]) | Leaves | Diurnal/ Seasonal | Solanum melongena | Herbaceous and crop | Spectrad | 1c | NPQ |
| 4a | ΔF/Fm’ | ||||||||
| 2 and 4 | ETR | ||||||||
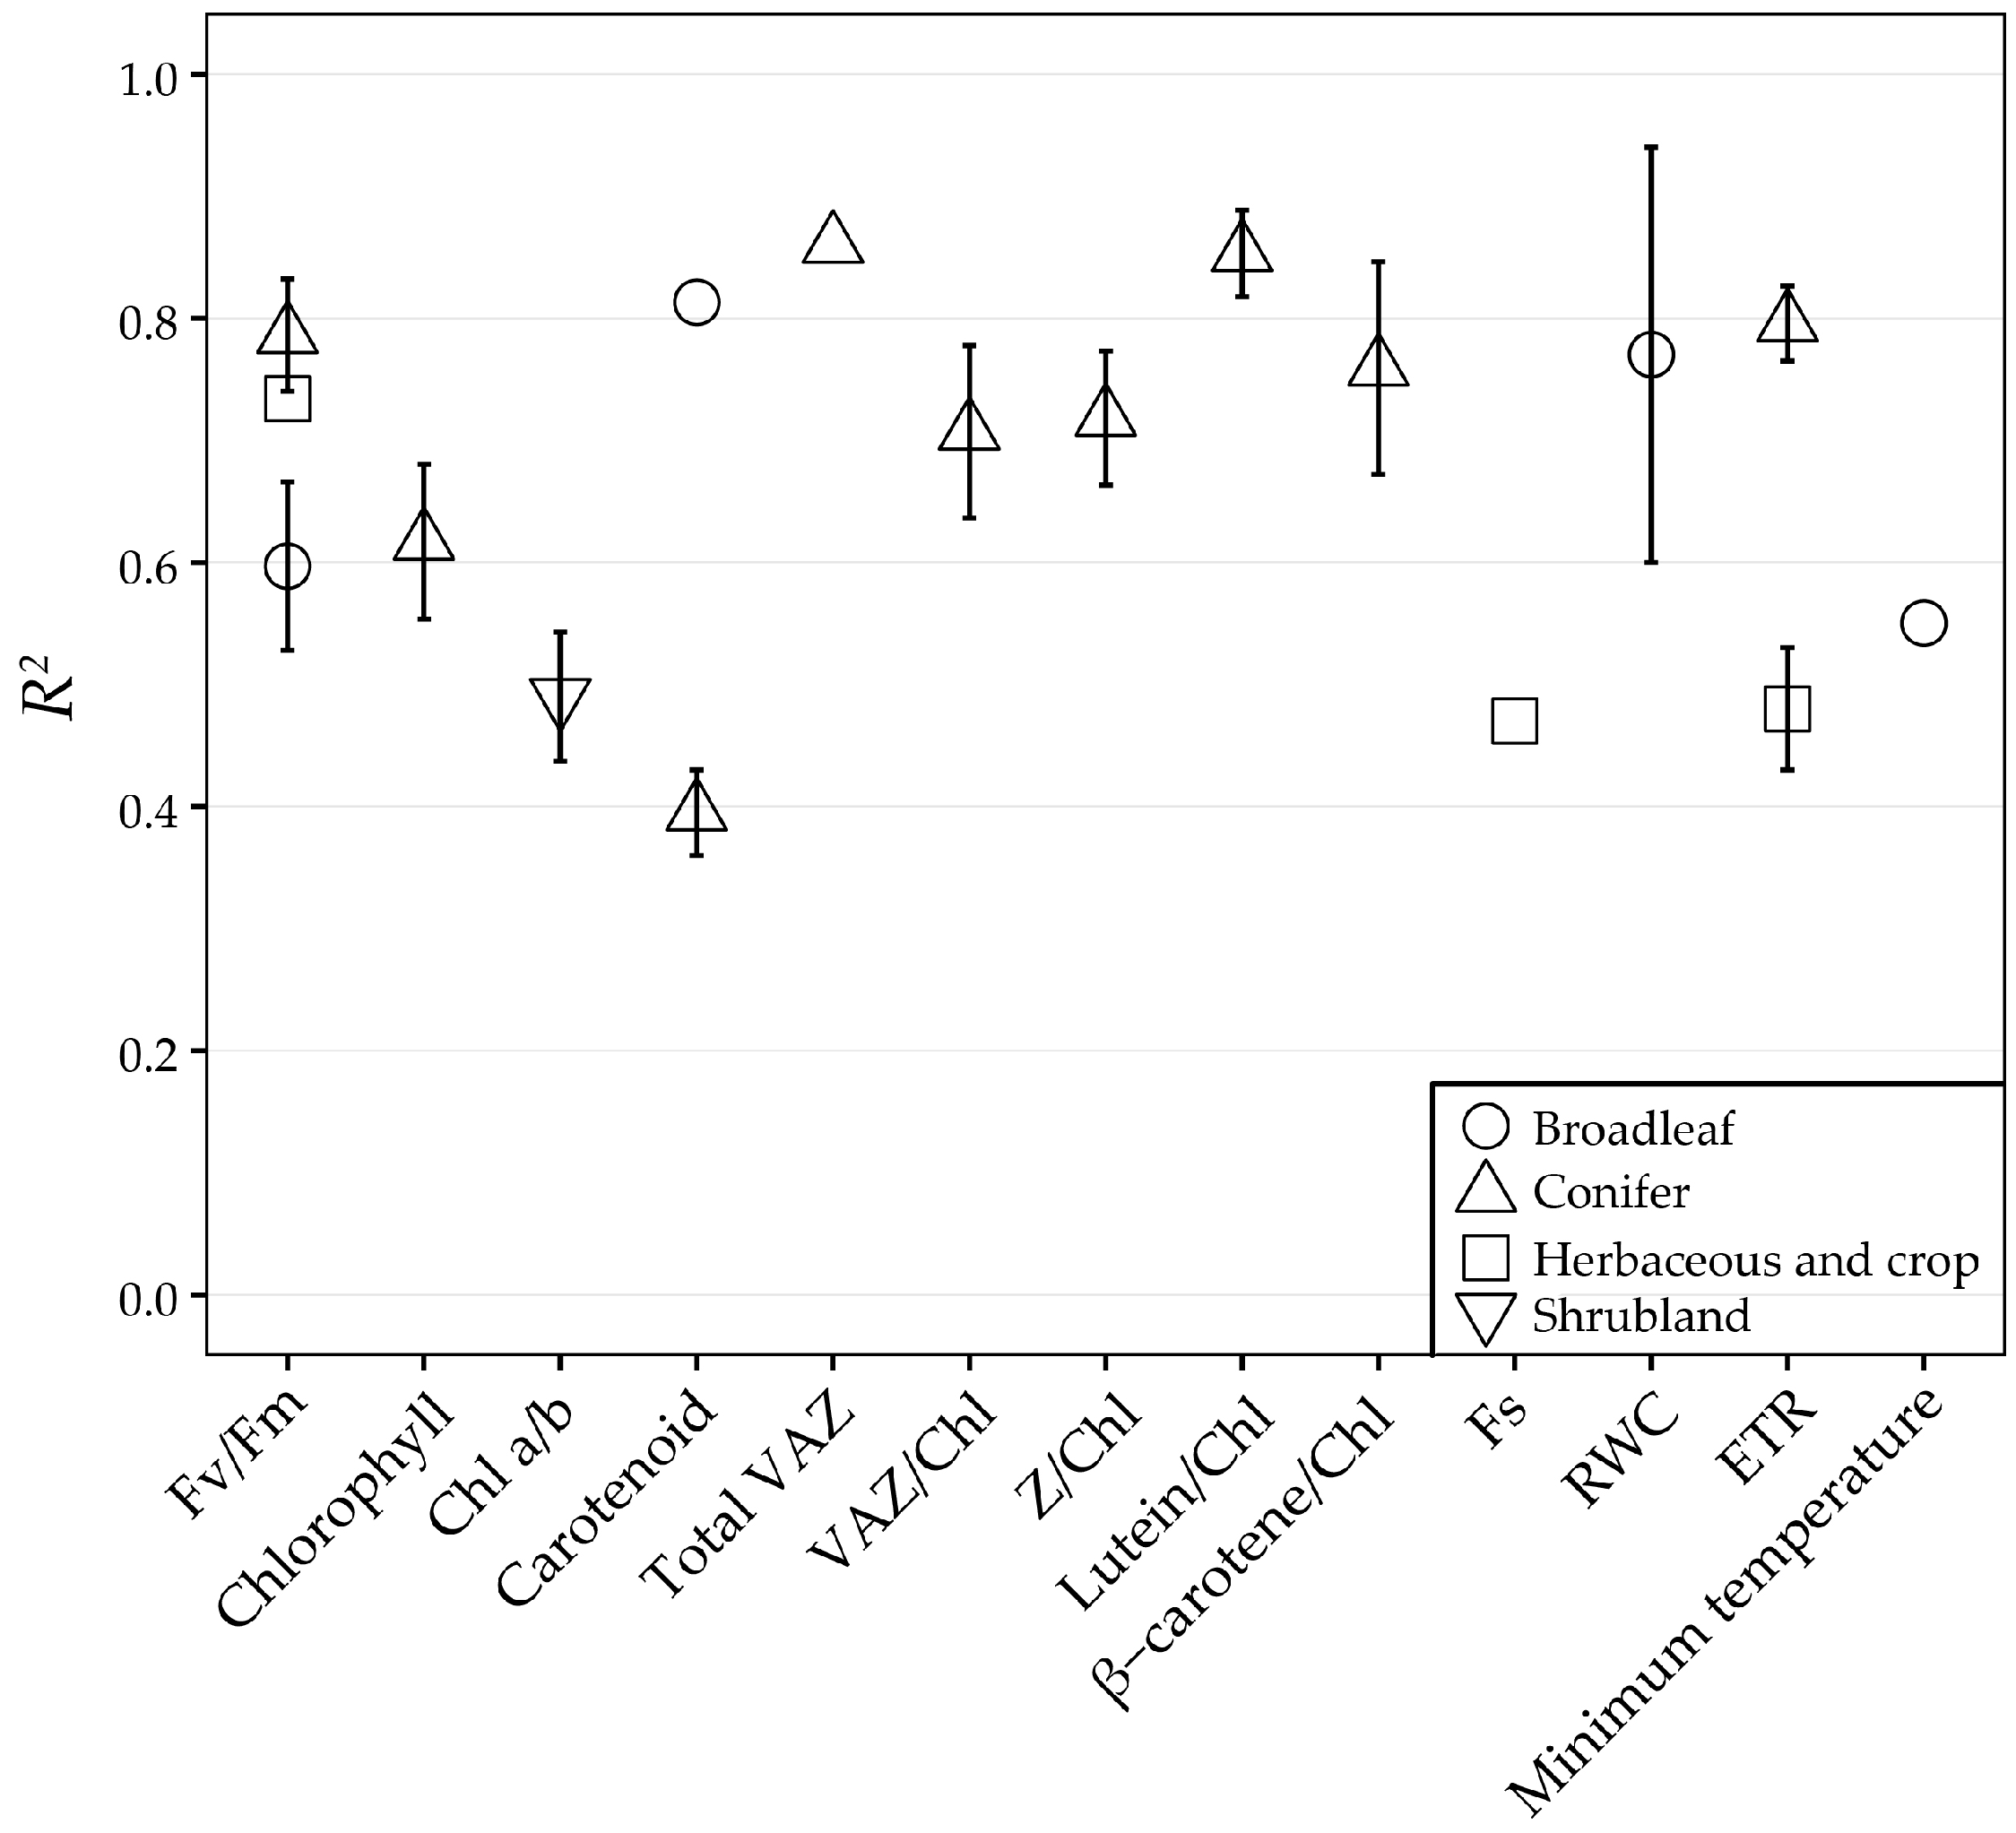
| 67 | 2015 | (Wong and Gamon, [55]) | Leaves | Diurnal/ Seasonal/ Internnual | Pinus contorta and Pinus ponderosa | Conifers | Specrad | 3e | Car/Chl |
| 3b | EPS | ||||||||
| 11 | 2010 | (Weng et al. [87]) | Leaves | Diurnal/ Seasonal | Mango | Broadleaf | Specrad | 1a and 3a | ΔF/Fm’ |
| 3b | EPS | ||||||||
| 4 | Fv/Fm Minimum temperature | ||||||||
| 46 | 2014 | (Harris et al. [85]) | Leaves/ Canopy | Diurnal | Pinus contorta | Conifers | Specrad | 1b and 5b | EPS |
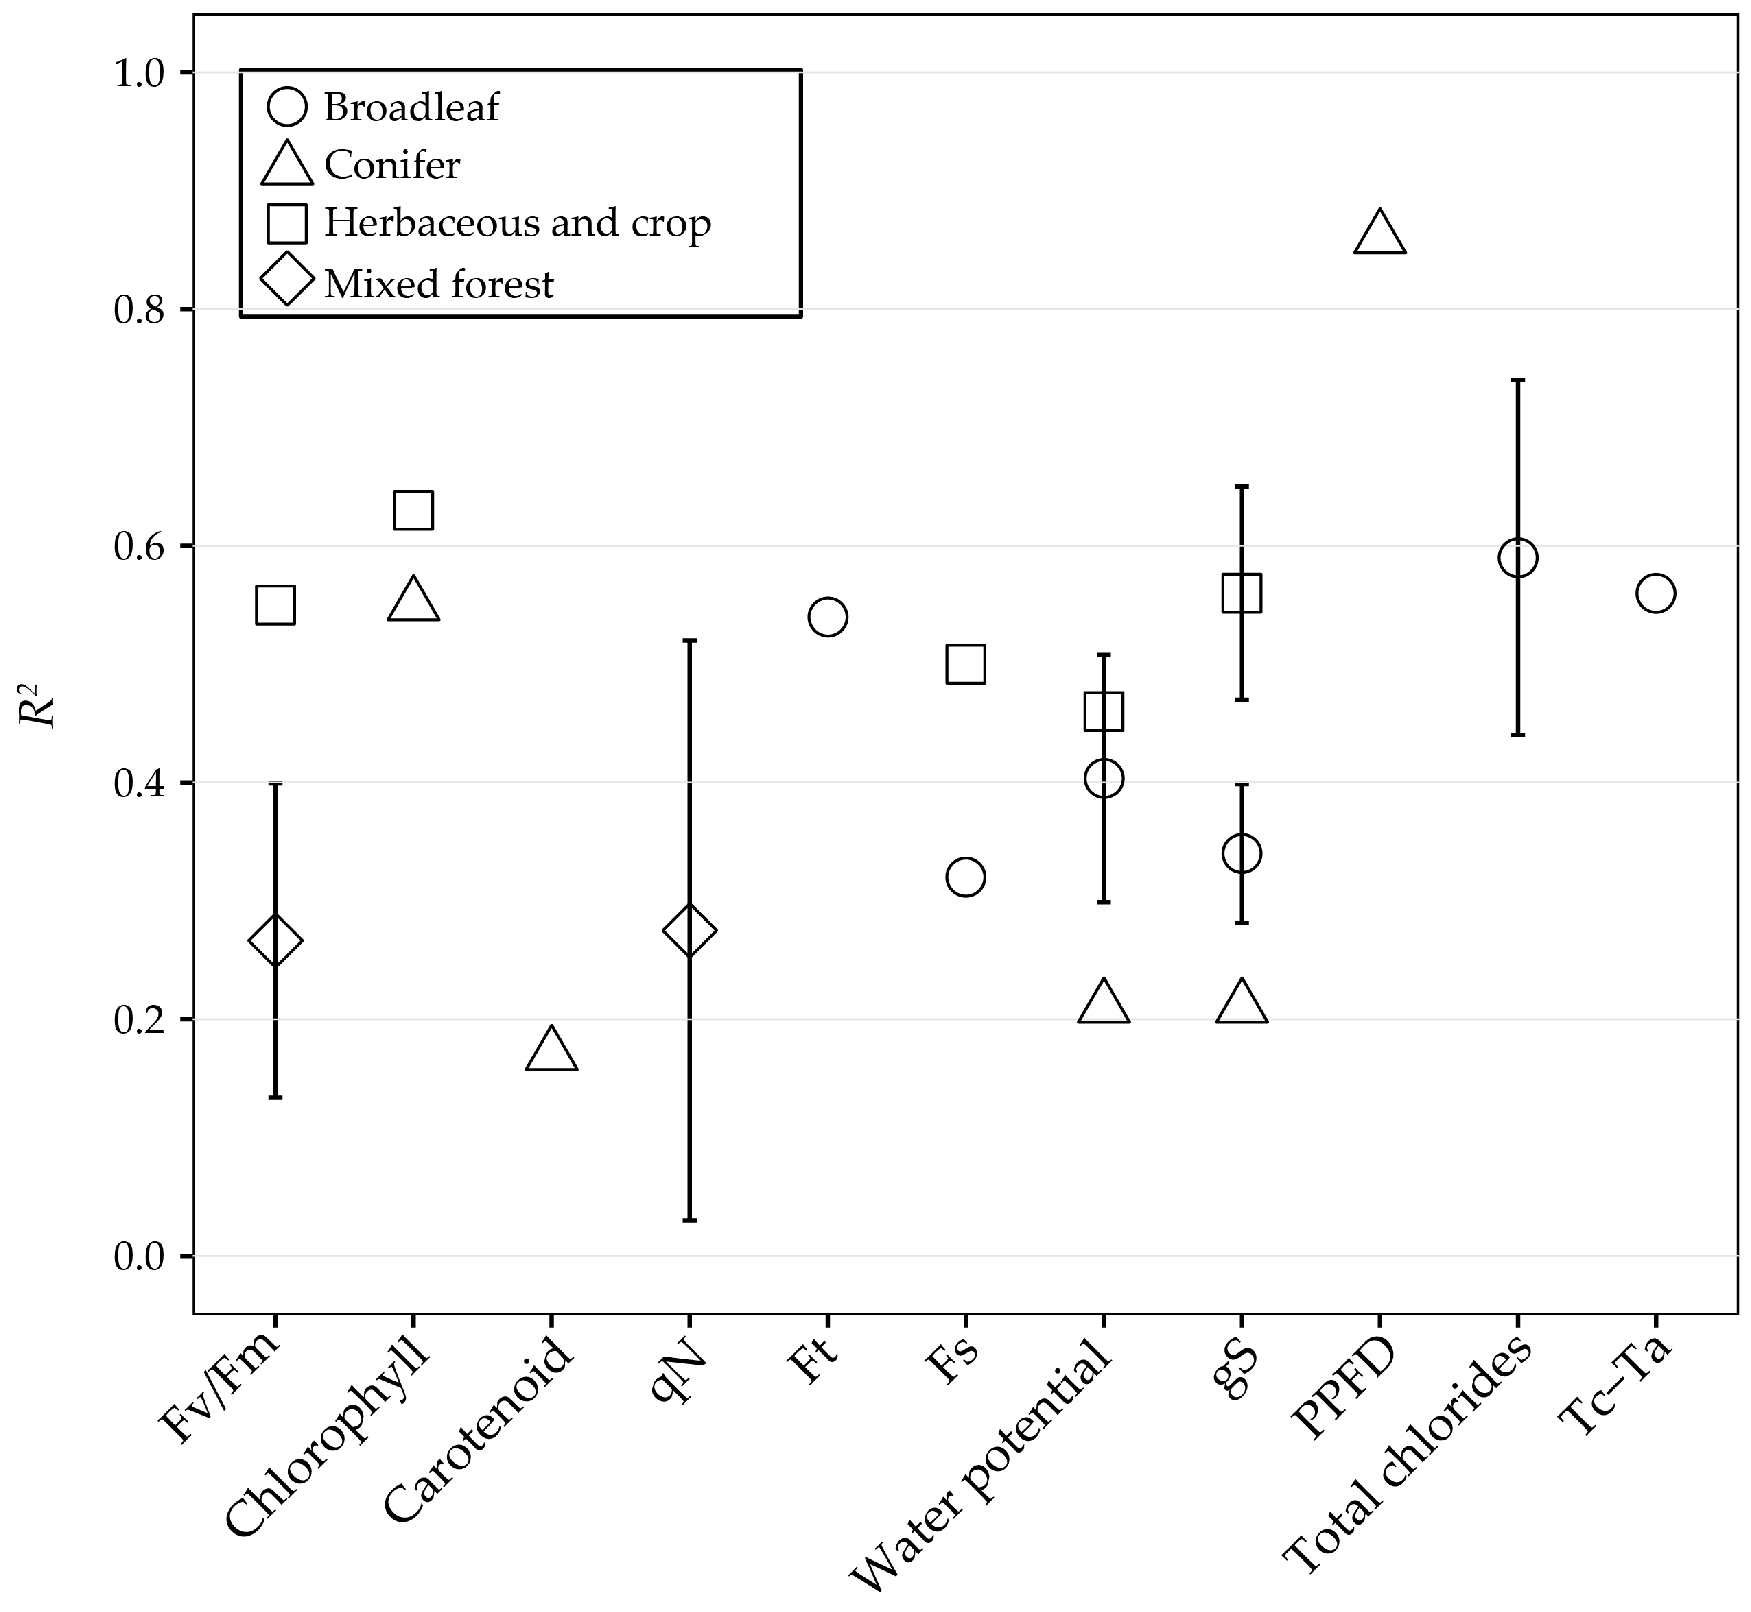
| 32 | 2013 | (Gamon and Bond [84]) | Leaves/ Canopy | Diurnal | Douglas-fir and ponderosa pine | Conifers | Spectrad | 6 | PPFD |
| 16 | 2011 | (Hernández-Clemente et al. [69]) | Leaves/ Canopy | Diurnal (Water stress) | Pinus sylvestris and Pinus nigra | Conifers | Specrad AHS airborne | 1b and 5b | EPS |
| 6 | gS Water potential | ||||||||
| 22 | 2012 | (Porcar-Castell et al. [72]) | Leaves | Seasonal | Pinus sylvestris | Conifers | Spectrad | 3d and 9 | RUE |
| 3c | NPQ | ||||||||
| 3a | ΔF/Fm’ | ||||||||
| 3e | Car/Chl | ||||||||
| 3b | DEPS | ||||||||
| 4 | Fv/Fm Car Chl VAZ VAZ/Chl | ||||||||
| 47 | 2014 | (Hmimina et al. [86]) | Leaves | Seasonal | Quercus robur and Fagus sylvatica | Broadleaf | Specrad | 3d, 9 and 10a | RUE |
| 3a | ΔF/Fm’ | ||||||||
| 60 | 2015 | (Nyongesah et al. [114]) | Leaves | Seasonal | Haloxylon ammodendron | Shrubland | Specrad | 4 | Chl a/b |
| 62 | 2015 | (Šebela et al. [145]) | Leaves | Seasonal (High night temperature) | Rice | Herbaceous and crop | Specrad | 3a | ΔF/Fm’ |
| 4 | Fs | ||||||||
| 53 | 2014 | (Sun et al. [119]) | Leaves | Seasonal (Interannual) | Olive | Broadleaf | Specrad | 3d and 9 | RUE |
| 3f | Net CO2 uptake | ||||||||
| 3e | Car/Chl | ||||||||
| 4 | Car RWC | ||||||||
| 54 | 2014 | (Tsonev et al. [121]) | Leaves | Seasonal (Water stress) | Quercus ilex | Broadleaf | Specrad | 3d and 9 | RUE |
| 3f | Net CO2 uptake | ||||||||
| 4 | RWC | ||||||||
| 10 | 2010 | (Suárez et al. [128]) | Leaves/ Canopy | Seasonal | Peach, nectarine and orange | Broadleaf | Specrad Airborne | 3b and 7b | EPS |
| 19 | 2012 | (Hernández-Clemente et al. [117]) | Leaves/ Canopy | Seasonal | Pinus sylvestris | Conifers | Camera | 3e | Car/Chl |
| 4 | Car Chl | ||||||||
| 66 | 2015 | (Wong and Gamon [54]) | Leaves/ Canopy | Seasonal | Pinus contorta, Pinus ponderosa and Picea glauca | Conifers | Specrad | 3f | Net CO2 uptake |
| 3b | EPS | ||||||||
| 3a | ΔF/Fm’ | ||||||||
| 3e | Car/Chl | ||||||||
| 4 | ETR Z/Chl L/Chl β-carotene/Chl VAZ/Chl | ||||||||
| 36 | 2013 | (Liu et al. [110]) | Canopy | Diurnal | Maize and winter wheat | Herbaceous and crop | Spectrad | 5d and 9 | RUE |
| 5f | Net CO2 uptake | ||||||||
| 5c | NPQ | ||||||||
| 29 | 2012 | (Zinnert et al. [111]) | Canopy | Diurnal (Salinity stress) | Baccharis Halimifolia and Myrica cerifera | Broadleaf | Spectrad | 5d and 9 | RUE |
| 5f | Net CO2 uptake | ||||||||
| 5a | ΔF/Fm’ | ||||||||
| 5c | NPQ | ||||||||
| 6 | gS Water potential Total chlorides | ||||||||
| 44 | 2014 | (Delalieux et al. [146]) | Canopy | Diurnal (Water stress) | Citrus orchard | Herbaceous and crop | APEX | 6 | Water potential |
| 57 | 2015 | (Gamon et al. [76]) | Canopy | Diurnal/ Seasonal | Pinus contorta | Conifers | SRS sensor | 5b | EPS |
| 7c | Chl/Car | ||||||||
| 4 | 2010 | (Mänd et al. [62]) | Canopy | Diurnal | Calluna vulgaris, Vaccinium myrtillus, Empetrum nigrum, Populus alba, Erica multiflora, Globularia alypum, Cistus monspeliensis and Pistacia lentiscus | Mixture | Specrad | 5a | ΔF/Fm’ |
| 6 | Fv/Fm qN | ||||||||
| 12 | 2010 | (Wu et al. [109]) | Canopy | Diurnal | Wheat | Herbaceous and crop | Specrad | 5d, 9 and 10a | RUE |
| 5f | Net CO2 uptake | ||||||||
| 61 | 2015 | (Rossini et al. [147]) | Canopy | Diurnal | Maize | Herbaceous and crop | Airborne | 5a | ΔF/Fm’ |
| 6 | gS | ||||||||
| 28 | 2012 | (Zarco-Tejada et al. [120]) | Canopy | Diurnal (Water stress) | Orange and mandarin | Broadleaf | PlantPen SKR 1800 camera | 6 | gS Water potential |
| 41 | 2013 | (Zarco-Tejada et al. [75]) | Canopy | Diurnal (Water stress) | Vineyard | Herbaceous and crop | Airborne | 6 | gS Water potential |
| 50 | 2014 | (Panigada et al. [148]) | Canopy | Diurnal (Water stress) | Maize and sorghum | Herbaceous and crop | AISA Eagle | 5a | ΔF/Fm’ |
| 26 | 2012 | (Stagakis et al. [126]) | Canopy | Diurnal/ Seasonal (Water stress) | Orange | Broadleaf | Camera | 6 | Water potential |
| 5 | 2010 | (Naumann et al. [122]) | Canopy | Seasonal | Elaeagnus umbellata | Broadleaf | Specrad | 7a | ΔF/Fm’ |
| 42 | 2013 | (Zarco-Tejada et al. [149]) | Canopy | Seasonal | Olive orchard | Broadleaf | Airborne | 7e | Net CO2 uptake |
| 59 | 2015 | (Hmimina et al. [107]) | Canopy | Seasonal | Quercus robur, Fagus sylvatica and Pinus sylvestris | Mixture | Specrad | 7d, 9 and 10a | RUE |
| 65 | 2015 | (van Leeuwen et al. [130]) | Canopy | Seasonal | Douglas-fir | Conifers | PRiAnalyze | 7d and 9 | RUE |
| 6 | 2010 | (Rossini et al. [129]) | Canopy | Seasonal | Rice | Herbaceous and crop | Specrad | 7d and 9 | RUE |
| 7e and 10c | Net CO2 uptake | ||||||||
| 39 | 2013 | (Rossini et al. [150]) | Canopy | Seasonal (Water stress) | Maize | Herbaceous and crop | Airborne | 7a | ΔF/Fm’ RWC Tl-Tair |
| 1 | 2010 | (Hilker et al. [4]) | Canopy | Seasonal (Interannual) | Douglas-fir and Aspen | Broadleaf and Conifers | Specrad | 7d and 9 | RUE |
| αs | |||||||||
| 15 | 2011 | (Hall et al. [151]) | Canopy | Seasonal (Interannual) | Douglas-fir and Aspen | Broadleaf and Conifers | CHRIS/ PROBA | RUE | |
| 31 | 2013 | (Cheng et al. [81]) | Canopy | Seasonal (Interannual) | Corn | Herbaceous and crop | Spectrad | 7d, 9 and 10b | RUE |
| 7e and 10c | Net CO2 uptake | ||||||||
| 68 | 2015 | (Wu et al. [124]) | Canopy | Seasonal (Interannual) | Wheat | Herbaceous and crop | Specrad | 7d, 9 and 10a | RUE |
| 52 | 2014 | (Stagakis et al. [60]) | Leaves/ Ecosystem | Seasonal | Phlomis fruticosa forest | Broadleaf | Specrad CHRIS/ PROBA | 3d, 8a and 9 | RUE |
| 34 | 2013 | (Kefauver et al. [152]) | Ecosystem | Ozone | Pinus ponderosa, Pinus jeffreyi and Pinus uncinata | Conifers | AVIRIS and CASI | O3 | |
| 56 | 2015 | (Balzarolo et al. [153]) | Ecosystem | Seasonal | grassland | Herbaceous and crop | Specrad | 8a and 9 | RUE |
| 8b | Net CO2 uptake | ||||||||
| 24 | 2012 | (Rossini et al. [136]) | Ecosystem | Seasonal | Subalpine grassland | Herbaceous and crop | HIS | 8a and 9 | RUE |
| 8b and 10c | Net CO2 uptake | ||||||||
| Chl fIPARg | |||||||||
| 9 | 2010 | (Stagakis et al. [132]) | Ecosystem | Seasonal (Interannual) | Phlomis fruticosa forest | Broadleaf | CHRIS/ PROBA | Chl Chl a Car Water potential | |
| 45 | 2014 | (Guarini et al. [25]) | Ecosystem | Seasonal | Quercus cerris forest | Broadleaf | MODIS | 8a and 9 | RUE |
| 14 | 2011 | (Goerner et al. [79]) | Ecosystem | Seasonal (Interannual) | Savanna (Combretum apiculatum, Sclerocarya birrea and Acacia nigrescens), Pinus ponderosa forest, deciduous broad-leaved forest and Quercus ilex forest | Broadleaf and Conifers | MODIS | 8a and 9 | RUE |
| fAPAR | |||||||||
| 20 | 2012 | (Moreno et al. [31]) | Ecosystem | Seasonal (Interannual) | Mediterranean Pinus pinaster forests | Conifers | MODIS | 8a and 9 | RUE |
| 17 | 2011 | (Hilker et al. [71]) | Ecosystem | Seasonal (Interannual) | Pseudotsuga Menziesii, Thuja plicata, Tsuga heterophylla, Quercus rubra, Acer rubrum, Betula lenta, Pinus strobes, Tsuga Canadensis, Pinus banksiana, Picea rubens, Picea mariana, Pinus banksiana, Eucalyptus delegatensis and Eucalyptus dalrympleana | Mixture | CHRIS/ PROBA | αs | |
| 49 | 2014 | (Nakaji et al. [77]) | Ecosystem | Seasonal (Interannual) | Dipterocarp forest (many species) | Mixture | Specrad | 8a, 9 and 10b | RUE |
| 51 | 2014 | (Soudani et al. [123]) | Ecosystem | Seasonal (Interannual) | Deciduous forest (Quercus robur and Quercus petraea) and Mediterranean evergreen forest (Quercus ilex) | Broadleaf | SKR 1800 | 8a, 9 and 10a | RUE |
| 8b | Net CO2 uptake | ||||||||
| aPAR VPD | |||||||||
| 33 | 2013 | (Garbulsky et al. [28]) | Ecosystem | Seasonal/ Interannual | Quercus ilex | Broadleaf | MODIS | 8a and 9 | RUE |
| 8b | Net CO2 uptake | ||||||||
| Diametric-increment |
| Formulation | References | |
|---|---|---|
| Original | PRI = (R531 − R570)/(R531 + R570) | Gamon et al. [18] Peñuelas et al. [19] |
| Different bands | PRI586 = (R531 − R586)/(R531 + R586) | Panigada et al. [148] |
| PRI515 = (R531 − R515)/(R531 + R515) PRI512 = (R531 − R512)/(R531 + R512) | Calderón et al. [101] Hernández-Clemente et al. [69,117] Rossini et al. [136,150] Stagakis et al. [126] Zarco-Tejada et al. [120] | |
| PRI = (R525 − R570)/(R525 + R570) PRI = (R539 − R570)/(R539 + R570) PRI = (R545 − R570)/(R545 + R570) PRI = (R532 − R701)/(R532 + R701) | Stagakis et al. [60,132] Porcar-Castell et al. [72] | |
| PRI551 = (R531 − R551)/(R531 + R551) PRI555 = (R531 − R555)/(R531 + R555) PRI645 = (R531 − R645)/(R531 + R645) PRI667 = (R531 − R667)/(R531 + R667) | Rossini et al. [136] (simulated MODIS bands) | |
| PRI = (Band11 − Band1)/(Band11 + Band1) PRI = (Band11 − Band12)/(Band11 + Band12) PRI = (Band11 − Band13)/(Band11 + Band13) | Garbulsky et al. [28] (MODIS) Guarini et al. [25] (MODIS) Moreno et al. [31] (MODIS) Sims et al. [134] (MODIS) Vicca et al. [135] (MODIS) | |
| PRI600 = (R531 − R602)/(R531 + R602) PRI670 = (R531 − R668)/(R531 + R668) | Rossini et al. [150] | |
| Different formulations | ΔPRI = cPRI − PRI (cPRI is dark-state PRI) | Gamon and Berry [67] |
| PRIc = PRI − PRI0 | Soudani et al. [123] Hmimina et al. [86,107] | |
| PRIs = (PRI + 1)/2 | Ainsworth et al. [115] Guarini et al. [25] Rossini et al. [129] Wu et al. [109] | |
| ΔPRI = PRImidday − PRIpre-dawn | Ripullone et al. [30] | |
| ΔPRI = PRI − PRIRef (PRIRef is the minimum PRI near midday) | Liu et al. [110] | |
| Combination with other indices | PRInorm = PRI/(RDVI × R700/R670) | Zarco-Tejada et al. [75] |
| Chlorophyll index (NDVI, NDSI, MTCI, NDI and CI) | Garrity et al. [105] Rossini et al. [129,136] Hernández-Clemente et al. [117] | |
| ΔPRIΔαs−1 | Hall et al. [151] Hilker et al. [4,71] | |
| CPRI = PRI − (0.645 × ln(mNDVI705) + 0.0688) | Rahimzadeh-Bajgiran et al. [88] | |
| PRIR1 = (R550 − R531)/(R550 − R570) PRIR2 = (R531 − R570)/(2R550 − R531 − R570) | Wu et al. [109] | |
| sPRI = 0.15 × (1 − exp (−0.5 × LAI)) − 0.2 rPRI = PRI − sPRI | Wu et al. [124] | |
| SIF | Cheng et al. [81] Rossini et al. [129] | |
| VPD | Nakaji et al. [77] | |
| fAPAR estimated as MTCI | Rossini et al. [136] (MODIS) | |
| PRIn = PRI − PRI0 sPRIn = (1 + PRIn)/2 | Vicca et al. [135] (MODIS) |
© 2016 by the authors; licensee MDPI, Basel, Switzerland. This article is an open access article distributed under the terms and conditions of the Creative Commons Attribution (CC-BY) license (http://creativecommons.org/licenses/by/4.0/).
Share and Cite
Zhang, C.; Filella, I.; Garbulsky, M.F.; Peñuelas, J. Affecting Factors and Recent Improvements of the Photochemical Reflectance Index (PRI) for Remotely Sensing Foliar, Canopy and Ecosystemic Radiation-Use Efficiencies. Remote Sens. 2016, 8, 677. https://doi.org/10.3390/rs8090677
Zhang C, Filella I, Garbulsky MF, Peñuelas J. Affecting Factors and Recent Improvements of the Photochemical Reflectance Index (PRI) for Remotely Sensing Foliar, Canopy and Ecosystemic Radiation-Use Efficiencies. Remote Sensing. 2016; 8(9):677. https://doi.org/10.3390/rs8090677
Chicago/Turabian StyleZhang, Chao, Iolanda Filella, Martín F. Garbulsky, and Josep Peñuelas. 2016. "Affecting Factors and Recent Improvements of the Photochemical Reflectance Index (PRI) for Remotely Sensing Foliar, Canopy and Ecosystemic Radiation-Use Efficiencies" Remote Sensing 8, no. 9: 677. https://doi.org/10.3390/rs8090677