1. Introduction
Gebhardt et al. [
1] published an article in remote sensing that describes the Monitoring Activity Data for the Mexican REDD+ program (MAD-MEX), an automatic wall-to-wall land cover monitoring system for the Mexican Deforestation and Degradation plus (REDD+) Monitoring, Reporting and Verification (MRV) program. To create their seven land cover maps (for years 1993, 1995, 2000, 2002, 2005, 2008) at a scale 1:100,000, the authors utilized existing land use/land cover cartography from the National Institute of Statistics and Geography (INEGI, the Mexican mapping agency) and Landsat imagery, while they used existing field inventory data for classification accuracy assessment. The land cover maps were produced using a classification scheme with two hierarchical levels that consist of nine (Level 1 with two forest categories) and 12 categories (Level 2 with five forest categories), respectively. The authors reported overall thematic accuracy up to 76%, and class accuracy up to 78% and 82% for tropical and temperate forests, respectively.
In the methodology applied by Gebhardt et al., all available Landsat images were gathered, preprocessed (surface reflectance computing, cloud masking) and used to calculate spectral metrics based on vegetation indices and tasseled cap components. Image segmentation was then carried out on the multi-temporal NDVI metrics. Principal components analysis was applied on the extracted object features to reduce the feature space, and information from a digital elevation model was added to each object. Objects were classified by a supervised non-parametric decision tree algorithm. Persistent polygons (those that had the same label on the INEGI land use/land cover maps from three different dates) were used as training areas after performing an outlier elimination. Accuracy assessment was carried out using existing validation points from different field inventories. In their paper, the authors claim that “the land cover products calculated by MAD-MEX serve as the principal products in Activity Data Monitoring in the Mexican REDD-MRV activities. They source not only the baseline estimation but will also be processed for future annual monitoring. MAD-MEX produces a map with standardized thematic scheme and reported classification accuracies within a few days.”
The work presented by the authors is undoubtedly a significant development in the search for an automatic wall-to-wall land use/land cover monitoring system in Mexico, particularly given the current needs to develop a sound Monitoring, Reporting and Verification (MRV) system under the international reduced emissions from the REDD+ program, which is currently being developed in Mexico. However, we find three important limitations as regards the methodology developed by Gebhardt et al., which we explain in this response. The first and main limitation relates to the accuracy assessment of MAD-MEX land cover maps, which is optimistically biased; the second issue concerns the inability of MAD-MEX to accurately monitor land cover change, including deforestation and forest degradation; and the third problem we see is the utilization of a completely automatic classification strategy, which is highly problematic in the case of a large and highly diverse country, such as Mexico. In addition to explaining the three aforementioned problems, we briefly discuss some key limitations of the approach as regards the use of MAD-MEX land cover maps to construct the historical baseline or reference emissions level required for REDD+ programs, as well as the use of such maps in future forest cover monitoring as part of a REDD+ MRV system.
2. Bias in Accuracy Assessment
Gebhardt et al. [
1] claim that the MAD-MEX accuracy assessment procedure follows the protocol described by Olofsson et al. [
2] using a random area-weighted stratified sampling. However, they selected validation data from a reference dataset, which is not randomly distributed within the different categories of the MAD-MEX maps. The reference dataset the authors used was obtained from field work carried out during different campaigns that were independent of their study and not from sites selected using the MAD-MEX maps. As a result, the MAD-MEX validation data fail to identify commission errors, and the equations used to calculate the confidence intervals are not appropriate. Most obviously, the validation dataset used for the accuracy assessment is not based on a probabilistic sample as recommended by Stehman [
3] and Stehman and Czaplewski [
4], which is the essential prerequisite in the protocol suggested by Olofsson et al. [
2,
5].
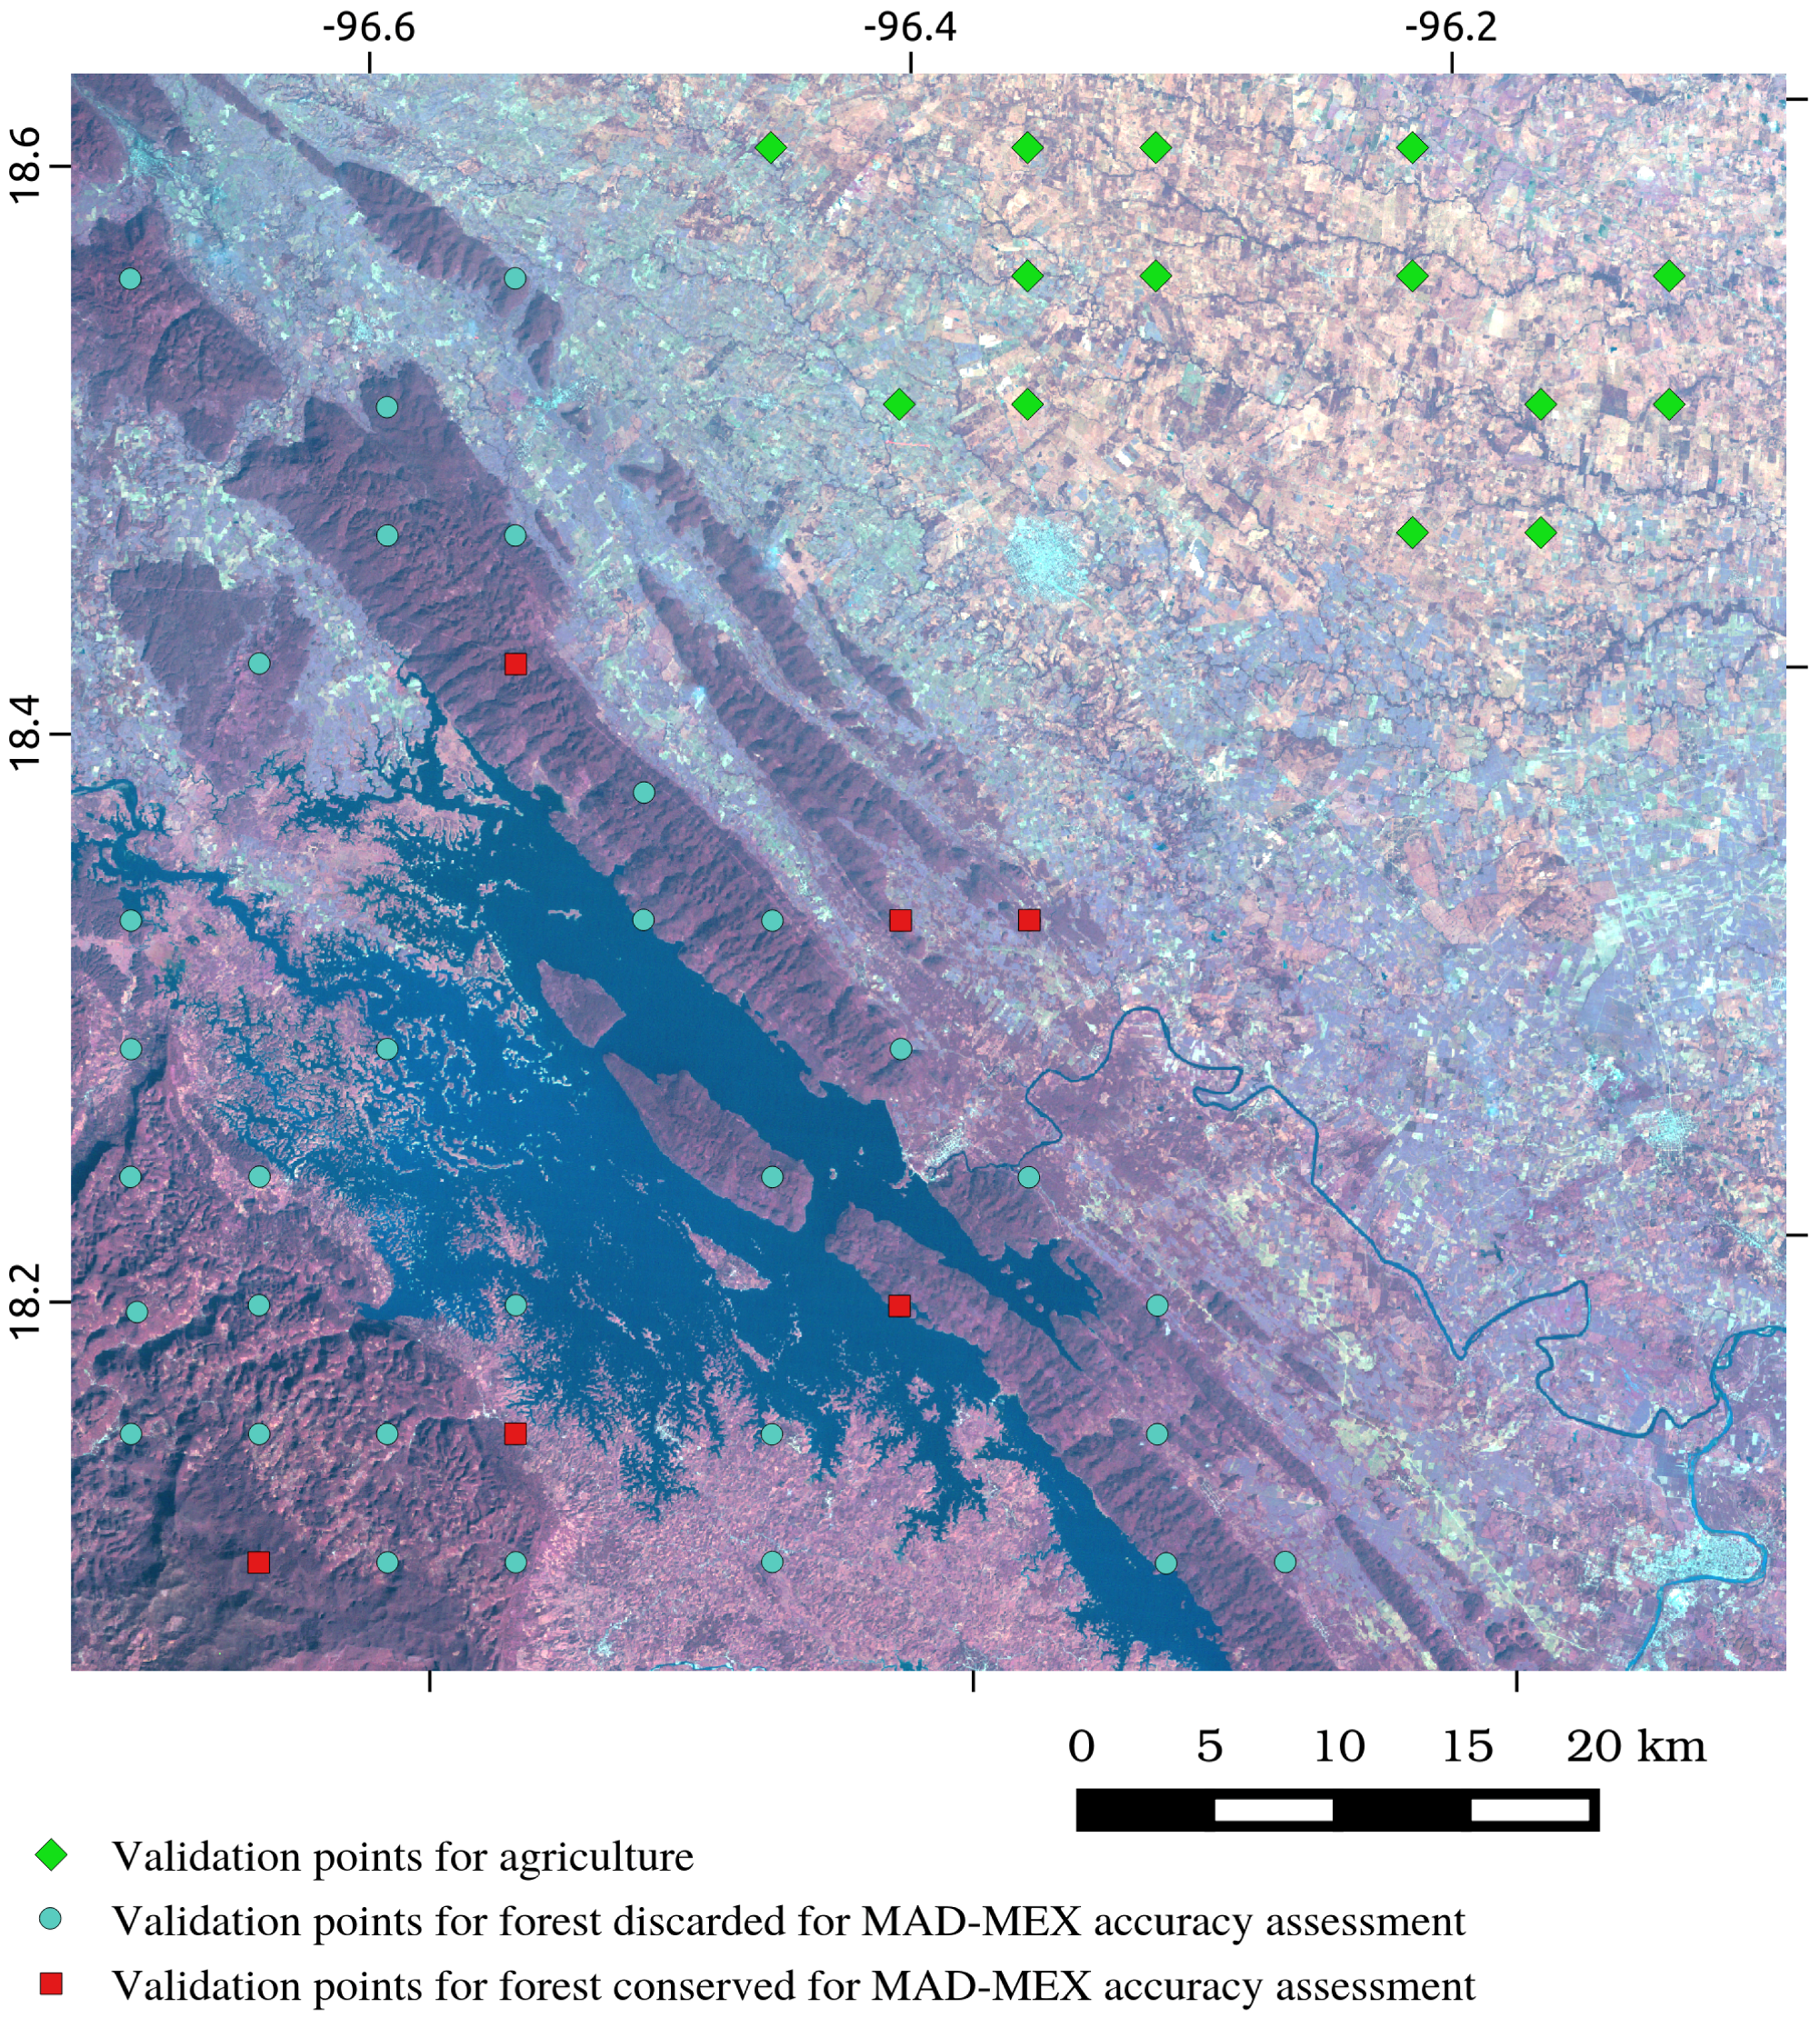
A preliminary inspection of the MAD-MEX validation dataset suggests that these data are not representative of the entire Mexican territory, nor do they reflect its heterogeneity and complexity. This inspection suggests in fact a strong bias towards assessing accuracy over homogeneous areas. For example, validation points for agriculture show a cluster pattern and seem to be biased towards large areas devoted to permanent agriculture. This was confirmed by overlaying a map of the irrigation districts from the Secretariat of Environment and Natural Resourcesthe (SEMARNAT, the Environmental Agency of Mexico), the validation points and the MAD-MEX map: 16.9% of agriculture validation points fall in irrigated areas, while only 1.6% of the area mapped corresponds to irrigated areas.
Figure 1 illustrates an example, in which we can observe that the validation points for agriculture (green diamonds) are located on a flat plain covered almost completely by agriculture. There are no validation points in other agricultural areas with more complex terrain. We detect the same issue in many other areas. In addition, there is a consistent lack of representation of rain-fed smallholder agriculture in the validation dataset used for agriculture. According to INEGI land use/land cover cartography [
6], 67,000 km
2 of forest are significantly affected by shifting agriculture, particularly in the Yucatan Peninsula. However, there are only two agriculture validation points in this region, both located in the large irrigation district “Valle de Yohaltún”. Thus, the MAD-MEX accuracy assessment approach appears to exclude a large and dynamic portion of the territory that has considerable significance in terms of REDD+ in Mexico.
We have also detected problems regarding the validation of MAD-MEX forest classes. The field data used to retrieve validation points were obtained from the National Forest and Soil Inventory (INFyS) dataset, which is based on systematic sampling inside areas mapped as forest, according to the INEGI 1993 land use/land cover map. Each INFyS plot is composed of four sub-plots of 400 m
2. Heterogeneous INFyS plots (i.e., plots whose four sub-plots did not have the same label) were discarded, which means that an important number of fragmented or transitional forest plots was excluded from the MAD-MEX validation, leading to a bias towards homogeneous areas. This fact is also illustrated in
Figure 1, where blue circles represent forest validation points that were discarded due to the heterogeneity of the INFyS plots. Red circles correspond to the actual forest validation points used, which appear to be concentrated in homogenous conserved forest areas. Furthermore, only non-change areas (“persistent” polygons from land use/land cover INEGI maps) are used as training sets, which means that the classification is likely to be poorly adapted to heterogeneous scenarios. This is hardly reflected in the accuracy figures, since the verification scheme tends to rule out heterogeneous sites.
Besides the preliminary analysis described above, we analyzed the validation dataset used for the first iteration (“run”) of the MAD-MEX land cover 2000 map because this is described in detail in the paper. Specifically, we evaluated whether the validation dataset used in MAD-MEX is significantly different from a validation dataset selected following a rigorously-probabilistic sampling design (stratified random sampling). In order to assess whether the validation points were biased towards homogeneous areas, we computed the number of land cover categories around the validation sites in the MAD-MEX map using a window of 300 m × 300 m (i.e., the minimum mapping area of MAD-MEX maps) and carried out the same procedure around validation sites selected from a stratified random sampling. Then, we compared the difference in the values obtained in the two datasets using a Welch two-sample
t-test, an adaptation of Student’s
t-test aimed at dealing with two samples that have possibly unequal variances. Results show that the landscape around MAD-MEX validation sites is significantly more homogeneous than around the randomly-selected validation sites for five out of the 12 land cover categories, including temperate coniferous and temperate deciduous forests (
Table 1).
We followed a similar procedure using a slope map obtained from a digital elevation model and found that the MAD-MEX validation sites are significantly biased towards gentle slopes for eight out of the 12 categories, including all of the forest categories except temperate deciduous forest (
Table 2).
To assess the potential consequences of both biases (landscape homogeneity and relief), we compared the average accuracy (% correctly classified) for each category of the samples located in homogeneous versus heterogeneous areas and on gentle versus steeper slopes. For this purpose, we split the validation dataset, thresholding the metric (number of neighboring categories and slope) in order to obtain two subsets with approximately the same number of validation samples. Results show that the accuracy is significantly higher in homogeneous landscapes and on gentle slopes (
Table 3 and
Table 4). Both biases in the validation dataset used to assess the MAD-MEX maps are therefore likely to have produced optimistically-biased accuracy indices.
In addition to the optimistic bias due to the validation sampling design, there is a lack of independence between the INEGI land use/land cover maps used to retrieve training data and the forest validation dataset from the INFyS, because INFyS plots were selected from a stratified sample based on the INEGI 1993 land use/land cover map, and we believe that the INFyS dataset was used in the INEGI Series IV land use/land cover cartography production process [
7,
8], as was the case for Series V [
9].
We acknowledge that accuracy assessment of land cover maps covering large and heterogeneous areas, such as the entire Mexican territory, is complex and that it is practical to use existing reference datasets even though such sampling strategies may be inadequate from a “statistical” point of view. However, the biases affecting the accuracy assessment should be evaluated, documented and corrected if possible. We also acknowledge that accuracy assessment in fragmented and dynamic landscapes may lead to very low accuracy values, which do not necessarily reflect the real quality of the map. In many cases, taking into account the scale and ambiguity in assigning a label to areas, various land cover categories may be acceptable for the same area [
10]. Nevertheless, landscape heterogeneity and label ambiguity cannot be avoided by discarding the “problematic” validation samples, as has been done in the MAD-MEX validation approach.
In light of all of the biases shown in our assessment, we strongly recommend the adoption of a flexible, fuzzy-based, standard methodology for the accuracy assessment of the MAD-MEX products, such as those described by Gopal and Woodcock [
10], Laba et al. [
11] and Couturier et al. [
12], and the use of different tolerance levels (see [
13]) when comparing map and validation sites. Such a fuzzy-based design would guarantee transparency in reporting accuracy, which is a key feature for “complying with guidelines on standardization and transparency of methods” of REDD+-MRV, as noted by the authors in the abstract.
3. Inconsistency in Monitoring Land Cover Change
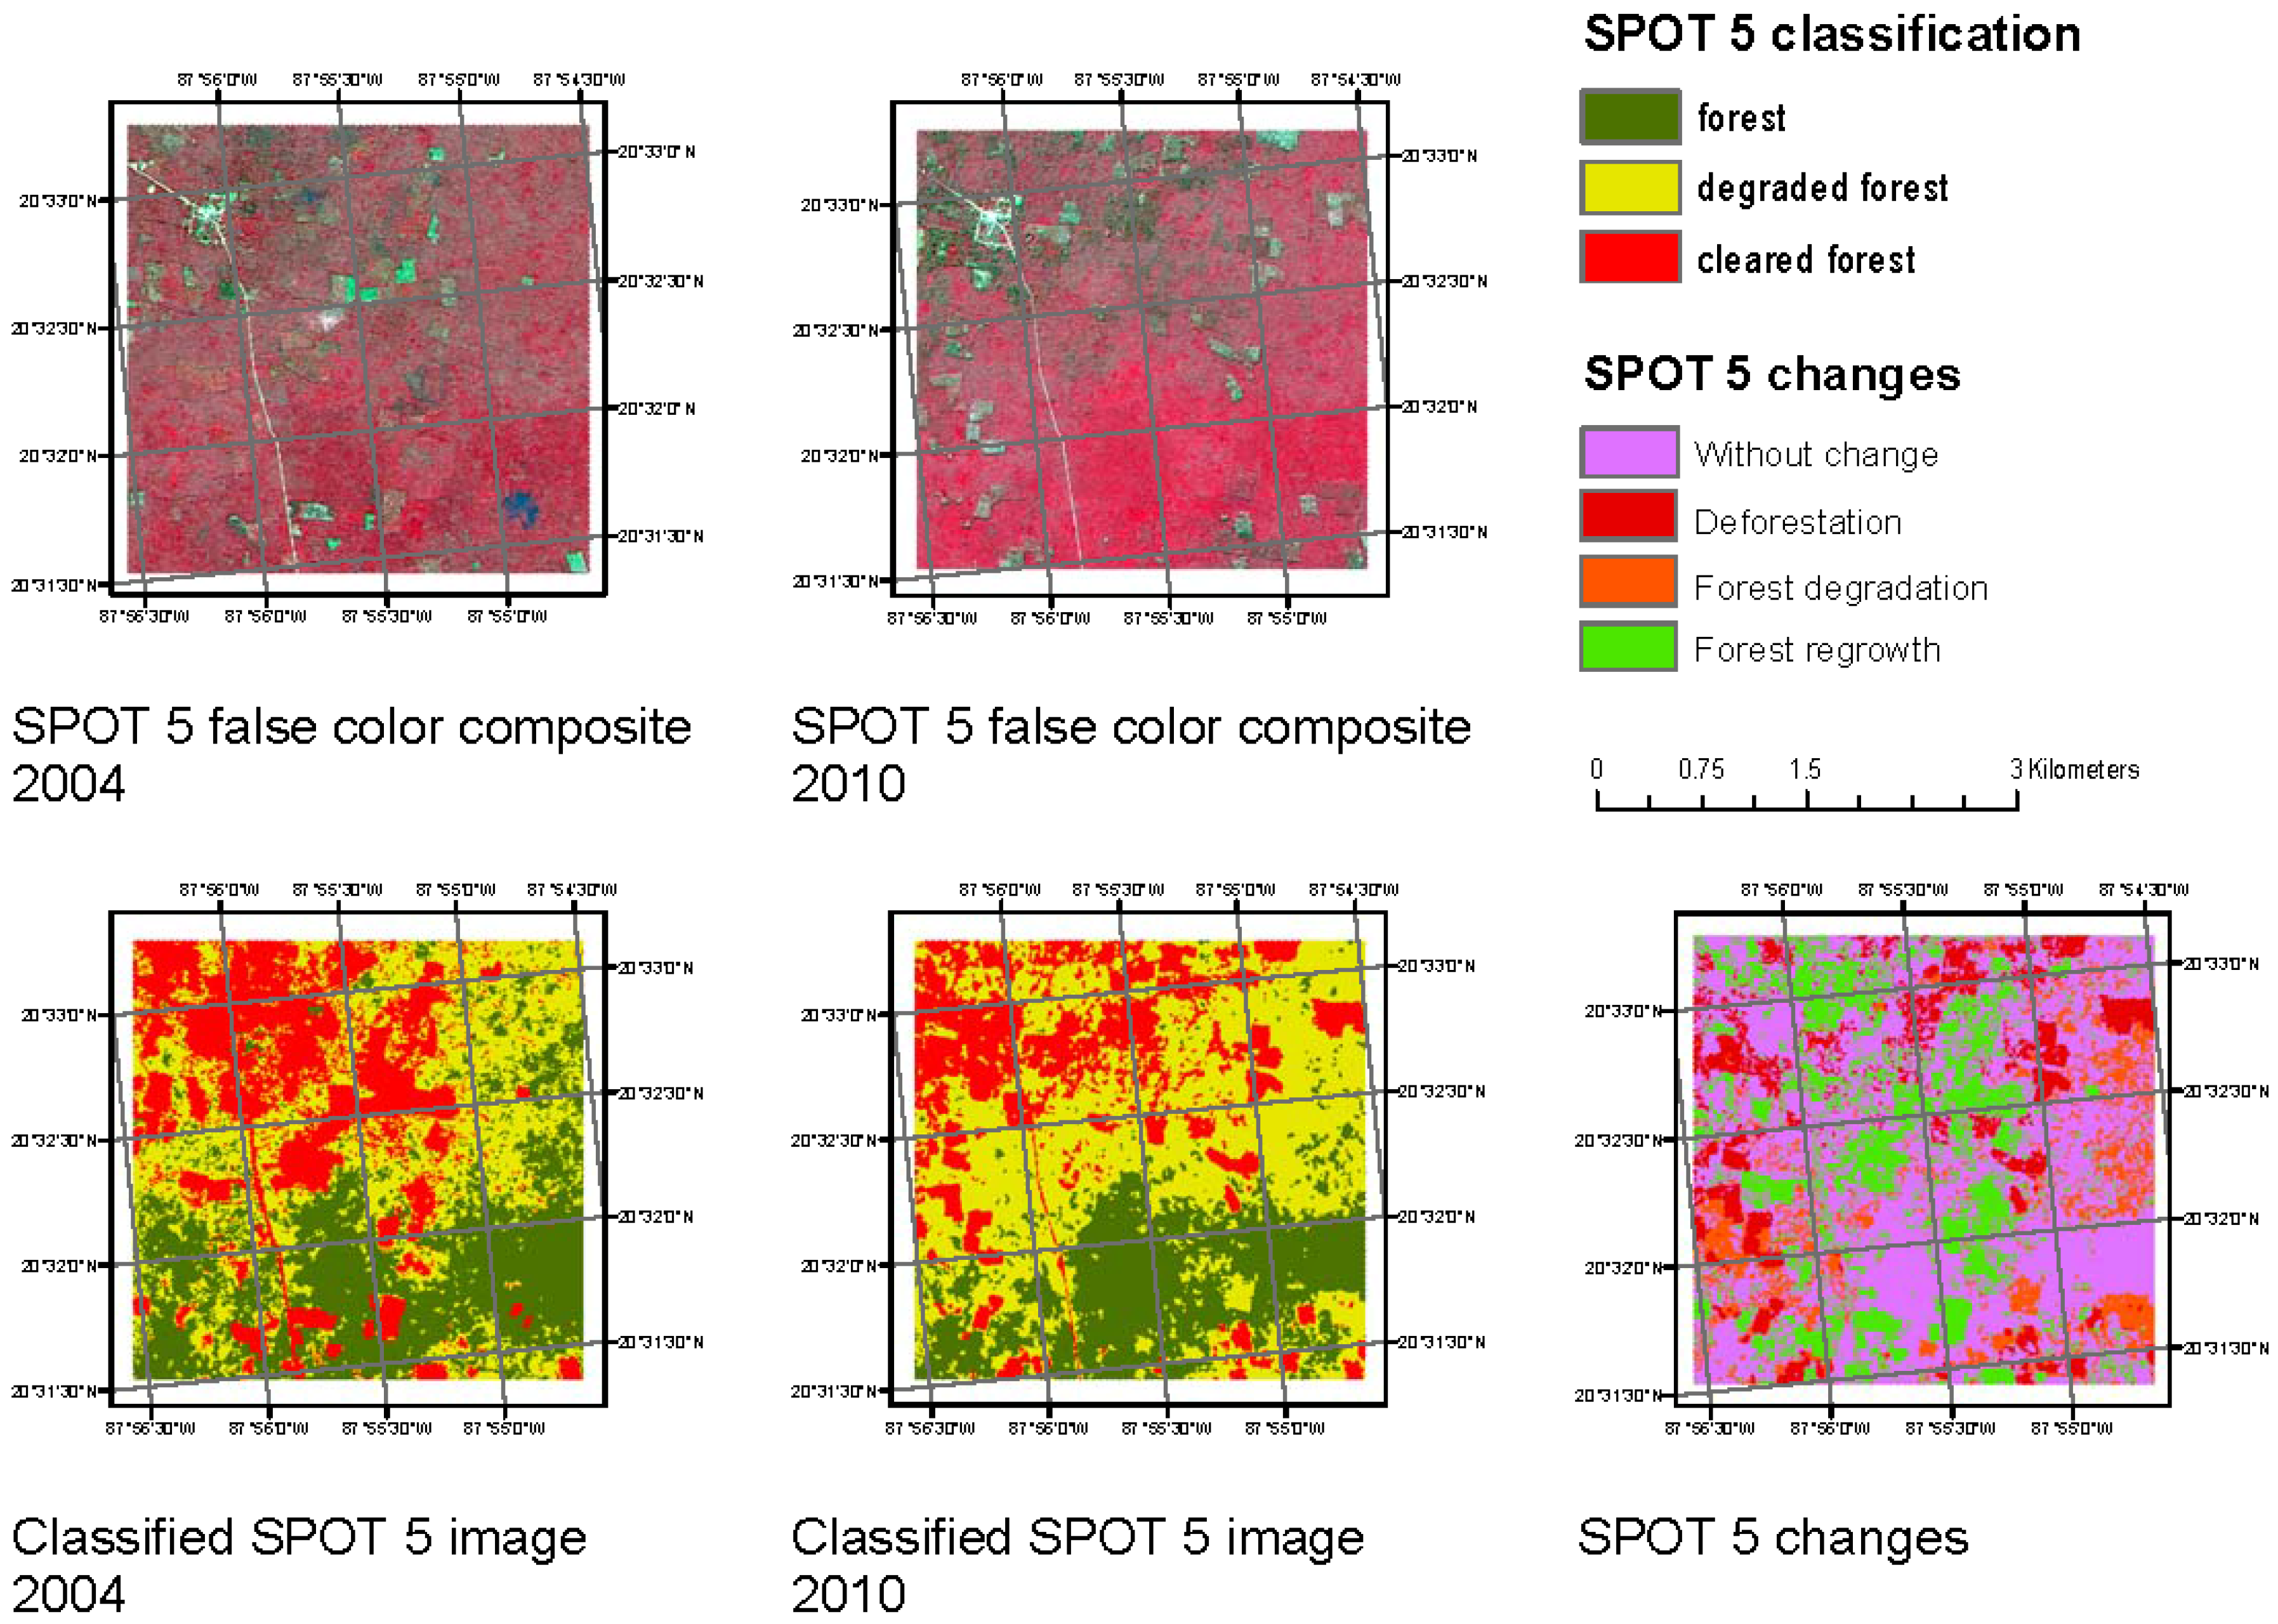
According to the accuracy assessment, tropical evergreen forest was very accurately classified (accuracy > 75%); moderate results were obtained for tropical deciduous forest (accuracy around 70%); and temperate forest categories were classified poorly (accuracy indices ranging from 50% to 60%). However, as we show above, these accuracy figures are likely to be optimistic. Due to the low accuracy of maps, land cover change monitoring based on the comparison of two maps of different dates greatly overestimates changes (
Table 5 and
Figure 2). The amount of land cover change should be related to time (more changes are expected over longer periods), but as shown in
Table 5, this is not what MAD-MEX produces. The change from 1993 to 2008 (18 years) for the entire Mexican territory is 40%, while over periods of three years (2002–2005 and 2005–2008), there are changes of 43%. This is simply not plausible and suggests that the results are mainly spurious changes, which relate to frequent classification errors. These spurious errors are still present when the classification scheme is simplified to a forest/no forest level (
Table 6). The authors themselves recognize that MAD-MEX cannot be used as a land cover change monitoring system without further processing (p. 3939). However, it is unclear which post-processing procedures would enable users to obtain accurate figures of land cover change and deforestation from MAD-MEX data. Our conclusion is that the MAD-MEX land cover monitoring system cannot be used to assess the areas and rates of past deforestation. Neither can it be used to monitor forest losses in Mexico in the future with its existing problems; therefore, in its present form, MAD-MEX cannot be considered as an operational REDD+ MRV system for Mexico.
In addition, because the MAD-MEX classification scheme does not take into account the degradation level of forest covers, this monitoring system is not seen to be appropriate to assess either the area or the rate of forest degradation, nor can it be used to monitor degradation in Mexico over time. Although we acknowledge the considerable difficulty of degradation detection using available remote sensing historical datasets, this key limitation was not discussed by Gebhardt et al. [
1]. Indeed, detecting degradation is one of the most pressing problems as regards building the necessary baselines and MRV systems for REDD+ [
14,
15]. In our opinion, it is not possible to accurately detect forest degradation in systems that make use only of relatively coarse optical data (Landsat) and which rely on digital processing only.
Version 4.2 of MAD-MEX, which was produced after the publication of Gebhardt et al. [
1], is based on a classification scheme of 32 categories, including temperate and tropical forest with secondary vegetation. These maps present an improvement of temporal congruency, but have also a large amount of “no data” area and still present a high level of error, which brings into doubt the computed rates of change (see
Table 7).
4. Limitations of a Fully-Automated Digital Classification Approach
In Mexico, national land use/land cover cartography at the regional scale (1:250,000) (the INEGI maps and the National Forest Inventory (INFyS) maps for 1994 and 2000 [
16,
17]) has been done using visual interpretation of color composites of satellite images. This approach has been criticized as being subjective and time consuming [
18]. Although we tend to agree with this as a general statement, we are highly conscious of the fact that many difficulties arise with the automatic classification of forest covers, particularly those characterized by highly variable physiognomies throughout transitional climate zones and relief gradients. The same applies to highly dynamic agricultural landscapes. In these cases, a visual classification component may adjust for errors that are inevitable in an automated approach. Indeed, visual interpretation enables map producers to include much more information in the classification process (e.g., texture, shape, pattern, size of the object and proximity between objects, interpreter’s knowledge, etc.) than the automatic approach [
19]. Visual interpretation has been shown to have the potential to achieve more accurate image classification results, particularly in complex and dynamic landscapes [
20,
21,
22,
23]. Visual interpretation, often computer-aided, has been widely used to elaborate the database of land use/land cover over large areas, such as Europe (CORINE Land Cover; see [
24]), Africa (AFRICOVER; see [
25]) and China [
26]. In addition, when visual interpretation is used to update existing cartography (e.g., following the interdependent classification method described by FAO [
27]), processes of land use/land cover change are extracted more accurately [
19,
26]. Using this procedure, an updated cartography of Mexico (slightly over two million km
2) at a scale of 1:250,000 was obtained in less than one year by a team of 60 people, including image collecting, geometric correction, image enhancement, visual interpretation, cartographic products elaboration and accuracy assessment [
28]. In the update of China’s land use/land cover database, an interpreter was able to update ca. 1800 km
2 per day (Xiao Wang, personal communication). INEGI uses a similar approach to update its land use/land cover cartography every five years approximately.
In contrast, the MAD-MEX system adopted an approach based on a fully-automatic sequence, from training data selection to classification based on spectral and elevation data. Due to spectral confusion, the MAD-MEX land cover maps present many errors that could have been avoided by visual interpretation, for instance between agriculture and urban areas. Moreover, as Landsat imagery from different years was classified fully independently, the maps present significant incongruence over time, as shown in the previous section (see
Table 5,
Table 6 and
Table 7 and
Figure 2).
Finally, the automated approach does not take full advantage of the previous experience of land use/land cover mapping in Mexico over the last few decades, in particular the work of INEGI. INEGI employs a large number of mapping experts throughout the country, who use the same national mapping protocol, but are responsible for predefined regions [
29]. Hence, these experts can incorporate their knowledge of the areas for which they are responsible, leading to greater map accuracies. The MAD-MEX system on the other hand is centralized in Mexico City and operated by a small team of experts with little regional expertise.
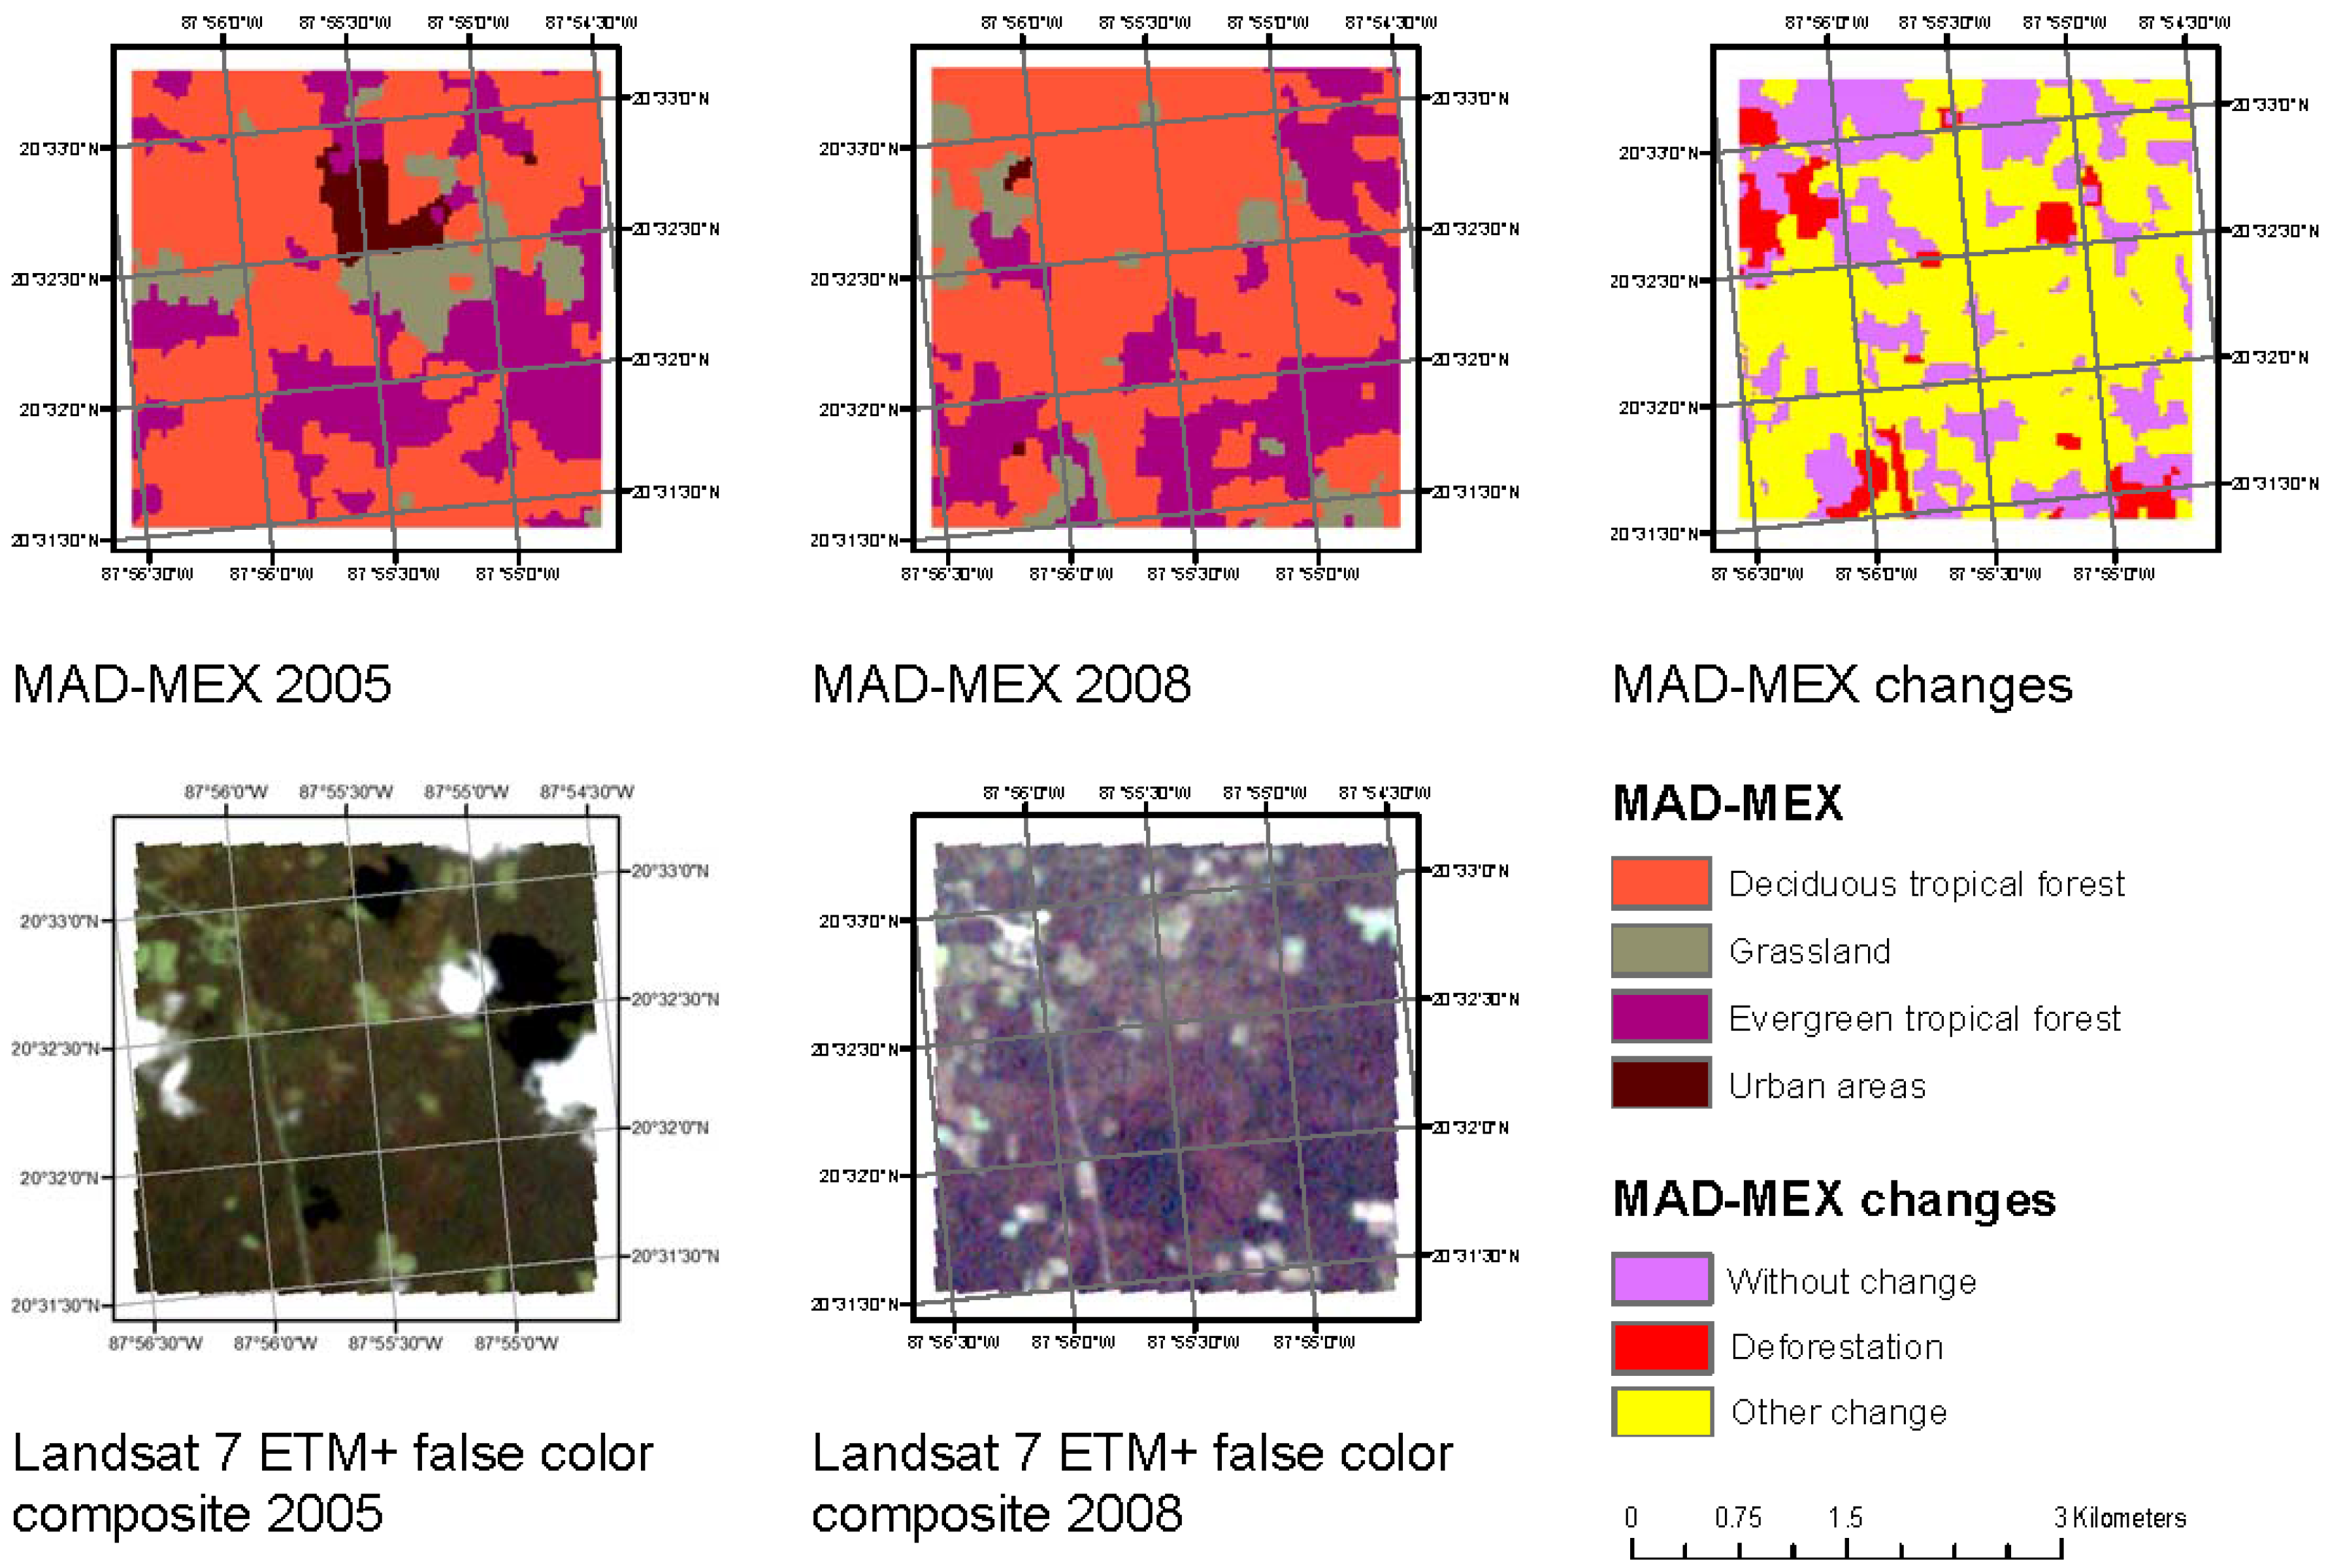
Given these problems, we propose a hybrid approach, which takes advantage of digital processing (for example, image segmentation), but which leaves an important place for human expertise (including local knowledge). In
Figure 3, we show how a hybrid approach can easily result in far greater accuracy than a fully-automatic one. For instance, we believe that an approach adapted from Radoux and Defourny [
30] could produce detailed and accurate maps in a reasonable time period. In this approach, images are segmented and objects are labeled according to the attributes of an outdated map. The spectral response of the object labeled as belonging to a given category is analyzed through a density function to identify outlier objects (i.e., those with a spectral response that contradicts their label). These are then classified and visually verified to minimize segmentation errors. This approach enables map producers to avoid the laborious and time-consuming task of delimiting small land use/land cover areas, and it would allow them to concentrate visual interpretation in those places where digital classification indicates a land use/land cover different from the previous map (i.e., both areas erroneously labeled or areas of real land use/land cover change).
5. Implications of Using MAD-MEX for Activity Data Monitoring in a REDD+ MRV System in Mexico and Elsewhere in the Tropics
In our view, the limitations of MAD-MEX as it is currently designed are significant, and therefore, we suggest that it should not be recommended for use in the assessment of historical land use/land cover transitions. Accurate information on these transitions is essential for quantifying past deforestation rates, as input to the construction of a national emissions reference level for REDD+. By the same token, it cannot be used for predicting or monitoring future changes in forest cover for the purposes of assessing REDD+ performance in terms of reducing deforestation. Additionally, because MAD-MEX is based on optical imagery and does not include specific techniques to attempt to detect forest degradation, it is clear that it cannot entirely meet the requirements of a fully-operational REDD+ MRV program. It is worth noting that there are already remote sensing techniques that can give estimations of degradation from optical data, such as Landsat [
31,
32], even if they are not able to account for all of the processes that cause anthropogenic forest degradation-, which may therefore be appropriate for the first wave of REDD+ MRV systems [
33]. In countries like Mexico, the greater share of emissions from the land use, land use change and forestry sector may well stem from degradation, since so many forests are informally used by rural populations for grazing and for shifting cultivation, activities that result in lowered carbon levels, but not in long-run loss of forest cover. The reality is that much of Mexico’s forest area is in the form of a mosaic, reflecting mixtures of small-scale human uses over space, which also means that individual patches are in a continuous state of flux between being CO
sources and sinks, as the locations of the human uses shift over time [
34].
Tropical countries, such as Mexico, urgently need forest cover monitoring systems that are able to go beyond the assessment of historical deforestation rates and which can also make estimates of past degradation and sequestration rates, as well as monitor how they change when REDD+ interventions and activities are adopted. This will require not only technologies that can accurately assess changes in canopy cover, but ideally also technologies that can see below the canopy cover, since at least some degradation and recuperation may be at the ground level. Satellite imagery, even at very high spatial resolution (e.g., IKONOS, RapidEye, QuickBird), may not be the best solution for this task. LiDAR systems, whether terrestrial or aerial, are becoming increasingly popular in this context [
35], though their price remains a serious constraint. However, alternatives are rapidly developing in the form of community-based forest inventory supported by web-based applications [
36], and there is great potential in community-based forest monitoring assisted by traditional photographic equipment mounted on drones [
37]. There is increasing evidence that indicates the high accuracy of local community monitoring at the ground level [
38] in comparison to remote sensing [
39]. Such approaches will never offer total national coverage, since they are intrinsically linked to local areas in which people and organizations are motivated to monitor, but nevertheless, they are likely to generate much more precise and accurate data, which could feed into more generalized national systems with a view toward raising overall accuracy in the long run [
40].
It is partly with this in mind that we have doubts concerning the heavy centralization of the MAD-MEX land cover monitoring system. We argue that such an approach does not favor a transparent, democratic REDD+ MRV system for use by an array of sub-national level administrations; nor does it allow for the potential integration of forest monitoring data, which may eventually be gathered at the level of communities engaged in REDD+ activities.
6. Concluding Remarks
MAD-MEX represents a significant contribution in developing an automatic wall-to-wall land cover monitoring system in Mexico, aimed at developing a sound Monitoring, Reporting and Verification (MRV) system under the international Reduced Emissions from Deforestation and Degradation plus (REDD+) program.
However, we have assessed the methods and results of the MAD-MEX system and find that it has at least three major limitations. First, as a purely automatic spectral-based classification approach, it cannot recognize sufficiently well the highly diverse and complex land cover situation of Mexico. Secondly, its accuracy assessment is optimistically biased, and therefore, its overall and class accuracies are lower (and much lower for some classes, particularly for some forest classes and for small-scale and shifting agriculture), than those presented in the article. Finally, land cover change as assessed by MAD-MEX is highly erratic over time, and we suggest therefore that this system is not well-suited to track deforestation, which is essential in any REDD+ MRV system. Moreover, MAD-MEX has not been designed to detect degradation, which is another requirement of MRV systems.
Based on our assessment of these limitations, we argue that MAD-MEX cannot be regarded as a fully-operational land cover monitoring system yet. Rather, we see MAD-MEX as a pilot effort toward the development of an operational land cover monitoring system for Mexico. Furthermore, we do not see MAD-MEX as a model for other tropical countries, although we certainly agree with the authors that the results could stimulate further investigation on the definition of a national land cover legend, using feature- and validation-driven class separability analysis.
Finally, we strongly suggest that the automatic analytical protocol must be complemented and strengthened with visual interpretation in a decentralized way so that the land cover maps can be appropriately improved by means of using local expert knowledge (such INEGI mapping personnel and researchers and technicians working in other government institutions, academia and NGOs), who could reduce the classification errors. In conclusion, we suggest that the MAD-MEX system should be carefully revised and improved before it is used in Mexico, and advise caution before recommending its use in other countries that are building their own REDD+ MRV systems.


 ,
, 

