Letter

Analysis of Aerosol Radiative Forcing over Beijing under Different Air Quality Conditions Using Ground-Based Sun-Photometers between 2013 and 2015

1
School of Geoscience and Surveying Engineering, China University of Mining and Technology, Beijing 100083, China
2
Beijing Key Lab of Spatial Information Integration and Its Applications, Peking University, Beijing 100871, China
3
State Key Laboratory of Remote Sensing Science, Beijing Normal University, Beijing 100875, China
*
Authors to whom correspondence should be addressed.
Remote Sens. 2016, 8(6), 510; https://doi.org/10.3390/rs8060510
Submission received: 30 April 2016 / Revised: 3 June 2016 / Accepted: 11 June 2016 / Published: 17 June 2016

Abstract

:
Aerosol particles can strongly affect both air quality and the radiation budget of the atmosphere. Above Beijing, the capital city of China, large amounts of aerosols within the atmospheric column have caused the deterioration of local air quality and have influenced radiative forcings at both the top and the bottom of the atmosphere (BOA and TOA). Observations of aerosol radiative forcing and its efficiency have been made using two sun-photometers in urban Beijing between 2013 and 2015, and have been analyzed alongside two air quality monitoring stations’ data by dividing air quality conditions into unpolluted, moderately polluted, and heavily polluted days. Daily average PM2.5 concentrations varied greatly in urban Beijing (5.5–485.0 µg/m3) and more than one-third of the analyzed period is classified as being polluted according to the national ambient air quality standards of China. The heavily polluted days had the largest bottom of atmosphere (BOA) and top of atmosphere (TOA) radiative forcings, but the smallest radiative forcing efficiencies, while the unpolluted days showed the opposite characteristics. On heavily polluted days, the averaged BOA aerosol radiative forcing occasionally exceeded −150 W/m2, which represents a value about three-times greater than that for unpolluted days. BOA aerosol radiative forcing was around two-to-three times as large as TOA aerosol radiative forcing under various air quality conditions, although both were mostly negative, suggesting that aerosols had different magnitudes of cooling effects at both the surface and the top of the atmosphere. Unpolluted days had the largest average values of aerosol radiative forcing efficiencies at BOA (and TOA) levels, which exceeded −190 W/m2 (−70 W/m2), compared with the lowest average values in heavily polluted days of around −120 W/m2 (−55 W/m2). These results suggest that the high concentrations of particulate matter pollution in the urban Beijing area had a strong cooling effect at both BOA and TOA levels.

Graphical Abstract

1. Introduction

Aerosols can strongly influence the earth’s energy budget by scattering and absorbing solar radiation [1,2]. Aerosol particles within an atmospheric column may alter the radiative balance at its top, middle, and base, thus altering the heating rate and stability of the atmospheric environment at various altitudes and inducing hazardous climatic effects [3,4,5]. Aerosols can additionally impact the radiative balance of the atmosphere by influencing the microphysical properties of clouds [6]. Besides aerosol optic depths, variations in the microphysical properties of these particles (e.g., size distribution, single scattering albedo, and refractive indices) may also play important roles in radiative forcing.
Ground-based aerosol observation networks such as the Aerosol Robotic Network (AERONET) can provide detailed information about the optical and microphysical properties of aerosols, as well as radiative forcing through utilizing the direct and scattering measurements [7,8,9]. Although satellite observation could provide simultaneous measurements of aerosol optic depths over a wide area, the weak backscattering signal reflected by the atmosphere is easily masked by stronger surface reflectance, thus limiting the accuracy of results obtained using this technique [10]. As such, inversions of data obtained from ground-based aerosol observation networks—especially AERONET—provide a unique and reliable data source that can be used to examine the effects of radiative forcing under different aerosol loading conditions [11,12].
Beijing (40°N, 116°E), the capital city of the People’s Republic of China, has over 20 million inhabitants within an area of just 16,800 km2, and has experienced fast economic growth over the previous three decades [13]. During this period of rapid development, air quality has become a significant issue for residents [14]. High aerosol loading can cause decreases in visibility [15], solar radiation [16], and air quality [14,17]. In Beijing, frequent haze-fog episodes represent serious environmental hazards, especially in the late autumn and winter seasons [18,19,20,21,22]. Since January 2013, China has adopted new national ambient air quality standards by making data obtained via real-time hourly monitoring of PM2.5, PM10, O3, SO2, NO2, and CO concentrations publicly available on the official website [23] for the Ministry of Environmental Protection [14]. These air quality data, which present detailed information about real-time concentrations of particulate matter (PM2.5 and PM10), are crucial for the evaluation of pollution in Beijing.
In this study, we document aerosol radiative forcing data collected from two AERONET stations in Beijing from 2013 to 2015. Detailed concentrations of PM2.5 measured by two air quality monitoring stations nearest to these AERONET stations were collected every hour in order to independently evaluate the air quality situations. Due to different aerosol loading conditions across the region, the radiative forcings and efficiencies monitored at each station were different. The high concentrations of PM2.5 suggested that there was high dry aerosol loading, scattering and absorbing more incident light, while low concentrations of PM2.5 suggested that there are fewer aerosol particles in the atmosphere to interact with incident and scattering light. Through dividing the air quality conditions into different groups, we were able to investigate the aerosol radiative forcing and efficiency in great detail. The major objectives of this study were to (1) investigate the variation of PM2.5 concentrations in Beijing’s urban areas over this period and to (2) analyze radiative forcings and efficiencies under different air quality conditions (i.e., unpolluted, moderately polluted, and heavily polluted).

2. Materials and Methods

2.1. Sun-Photometer Data

Ground-based sun-photometers that can measure direct-sun and sky radiances at the earth’s surface are highly useful tools for analyzing atmospheric properties such as aerosol optic depth (AOD), aerosol size distribution, and single scattering albedo (SSA) [24]. The AERONET includes over 500 ground-based observation sites worldwide. Due to the accuracy of aerosol properties retrieved by this system, AERONET measurements are regarded as an important benchmark for the validation of various satellite aerosol retrievals [25], and thus are commonly used to calculate radiative forcing [26]. Sun-photometer measurement of direct solar radiance at several bands (typically, 340 nm, 380 nm, 440 nm, 500 nm, 670 nm, 870 nm, and 1020 nm) allowed the aerosol optic depth to be obtained with a high degree of accuracy (0.01–0.02) [27]. Other variables such as single scattering albedo, size distribution, and complex refractive index, were retrieved by fitting sky radiance in almucantar plane in four bands (440 nm, 670 nm, 870 nm, and 1020 nm). Compared with directly retrieved AOD, the inversion products of AERONET have relatively low accuracies. For example, the uncertainty of single scattering albedo ranged between 0.03 and 0.07. For size distribution, the retrieval accuracy depends on the size of aerosol particles, ranging from 10% to 35% when aerosol particles varied from 0.1 μm to 7 μm. For aerosol particle size outside of this range, the retrieval error may increase to 35%–100% [28]. The radiative forcing and efficiency, therefore, are calculated using the DIScrete Ordinates Radiative Transfer (DISORT) model by using the retrieved AOD, size distribution, complex refractive index, particle shape, surface albedo, and other parameters. The retrieved radiative forcing at the surface and the top of the atmosphere are expected to have an accuracy of less than 10% or better [8].
Although ground-based sun-photometers only provide a spatially restricted range of data in comparison with satellite observations, thus inhibiting global-scale investigations, AERONET observations from stations with long-term and high temporal-resolution retrieval are a key tool with which to investigate aerosol properties and their radiative forcing effects at a local scale. There are five stations that have been deployed in the region in or around Beiing: the Beijing site, the Beijing CAMS site, the PKU_PEK site, the Xianghe site, and the Yufa_PEK site. In order to cover the period 2013–2015 and have an air quality station close enough, two sites with sufficient retrievals were selected: Beijing site and Beijing-CAMS site. Although Level 2.0 data has the highest quality, the strict quality checks have screened large amounts of data to ensure the quality. In order to cover the whole research period, Level-1.5 (cloud-screened) data were utilized in our study.

2.2. Air Quality Monitoring Data

Alongside AERONET observations, hourly air-quality monitoring data were also collected in this study in order to distinguish unpolluted days (daily average PM2.5 concentrations less than 75 µg/m3) from moderately polluted days (daily average PM2.5 concentrations in the range 75–150 µg/m3) and heavily polluted days (daily average PM2.5 concentrations greater than 150 µg/m3). Since 2013, the Ministry of Environmental Protection of China has made real-time monitoring data for six pollutants (PM2.5, PM10, O3, SO2, NO2, and CO) available to the public through a national web-platform [23]. This database contains information from 12 state-controlled real-time monitoring stations in Beijing and more than 1400 monitoring stations situated elsewhere in China. PM2.5 concentrations are measured by either micro oscillating balance method (TEOM 1405F from Rupprecht & Patashnick Co., Inc., Albany, NY, USA) or the β absorption method (BAM 1020 from Met One Instrument Inc., Grants Pass, OR, USA or Tianhong Co., Wuhan, China, or Xianhe Co., Shijiazhuang, China) [29]. Through linear regression with data obtained by the reference method [30], the slope between measured data and validated data is (1 ± 0.1) and intercept is (0 ± 0.5 µg/m3). The correlation between measured data and validated data must be larger than 0.93 [31]. The municipal government has publicized real-time monitoring data for all six pollutants in Beijing collected every hour at the aforementioned 12 state-controlled stations and another 23 municipal stations, with the latter data released via a municipal website [13]. These 35 stations can be divided into four groups according to their geographical locations: urban stations, suburban stations, background stations, and traffic stations. These 35 stations are unevenly and sparsely distributed across the city (Figure 1).

2.3. Data Selection and Analytical Methods

Air quality monitoring data and AERONET observations represent two ways to describe the aerosol properties of the atmospheric environment. PM2.5 concentrations monitored by air quality stations were used to distinguish between unpolluted days, moderately polluted days, and heavily polluted days. As reported in previous studies, the 35 stations in Beijing are unevenly distributed across the city, and record different pollution patterns [14]; therefore, it is inadvisable to simply average the pollutants’ concentrations recorded by all 35 stations, as distinct differences occur between northern and southern stations (the latter commonly have much higher pollutant concentrations than the former) [32]. Consequently, the air quality station closest to each AERONET station was selected as a reference with which to determine the air quality situation of data recorded by the AERONET stations. Data from both the Olympic Sports Center air quality station and the West Park Officials air quality station were correlated with AERONET data. A web-based downloading program was utilized to obtain real-time air quality monitoring data in Beijing from January 2013 to December 2015, which provided sufficient resolution to calculate the air quality in the proximity of each AERONET station. Daily radiative forcings calculated by AERONET under different scenarios (no pollution, moderate pollution, and heavy pollution) were calculated and compared with one another in order to investigate the role that heavy particulate matter plays in radiative forcing above Beijing.

3. Results

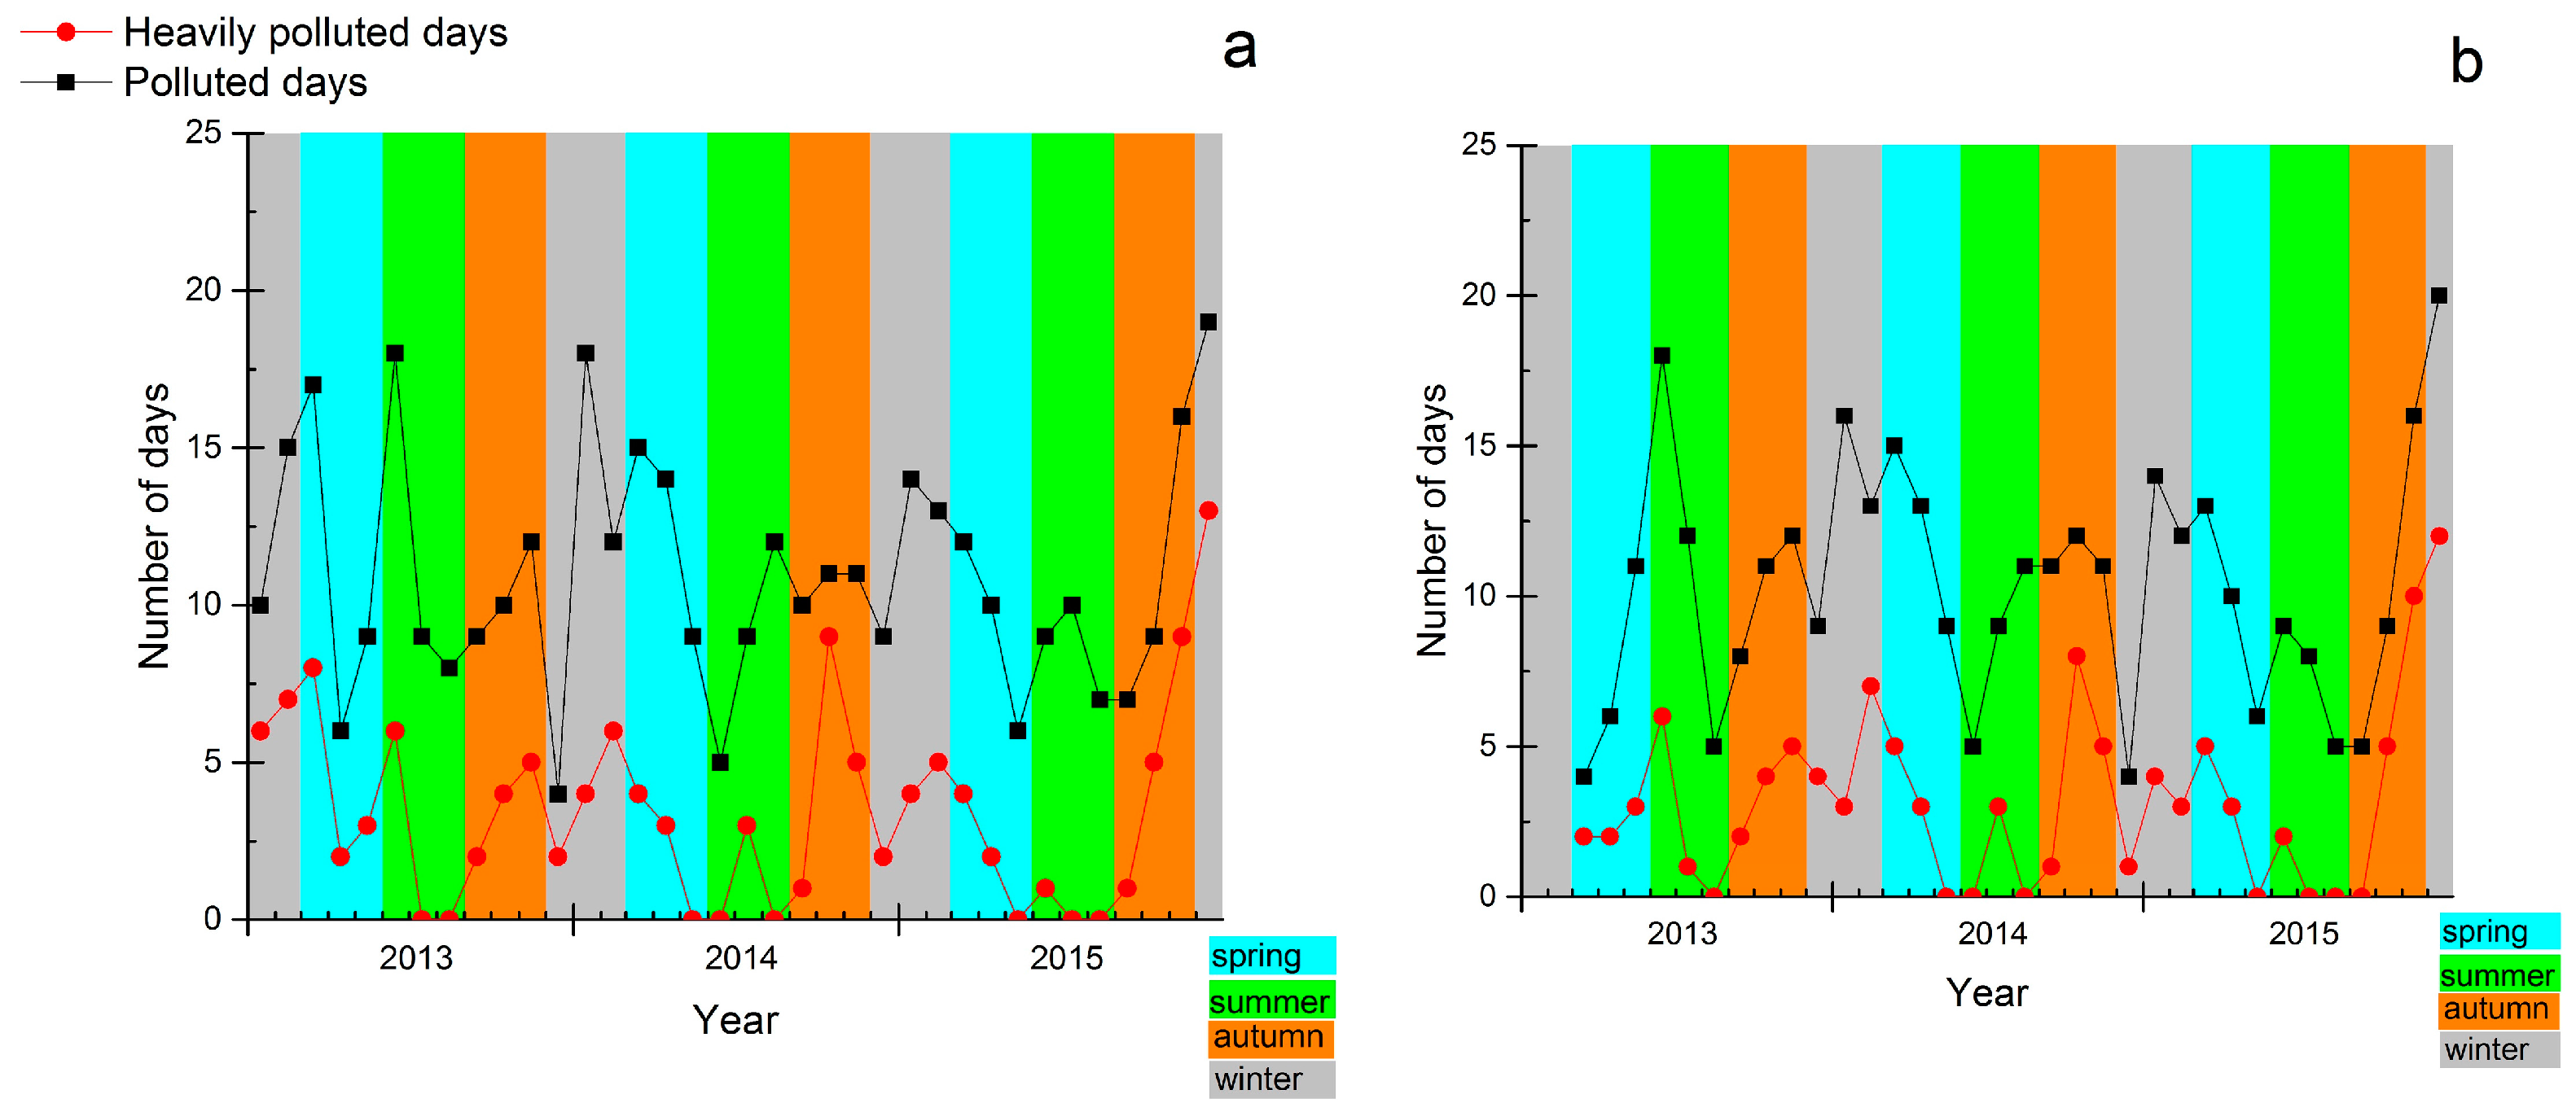
3.1. Variations in Particulate Matter Concentrations

Figure 2 shows daily average PM2.5 concentrations collected in this study, where it can be seen that large variations occur on different timescales. Data from the West Park Officials station were collected from 18 January 2013, and those from the Olympic Sports Center station were collected from 23 March 2013. Both stations show similar day-to-day variations, with the largest recorded daily average concentrations being 485 µg/m3 for the former and 475 µg/m3 for the latter, which is twice as high as the measured results (218.6 µg/m3) reported previously [33]. Both stations also show similar trends in month-long variations, as they are all urban monitoring stations situated only 7 km apart. Monthly averages (Figure 3) show that the spring and summer seasons tended to have lower PM2.5 concentrations than autumn and winter. Peak concentrations usually occurred during the winter seasons, except for in 2014, when the peak monthly average concentrations occurred in mid-autumn. An average of 10.9 polluted days (i.e., PM2.5 concentrations > 75 µg/m3) were recorded each month at the West Park Officials station and an average of 10.4 polluted days were recorded at the Olympic Sports Center station as shown in Figure 4. The highest numbers of polluted and heavily polluted days (PM2.5 concentrations > 150 µg/m3) were recorded in late autumn, winter, and early spring each year, except for in June 2013. Summer and late spring typically had the least number of polluted and heavily polluted days, as suggested by previous seasonal trends research [34].

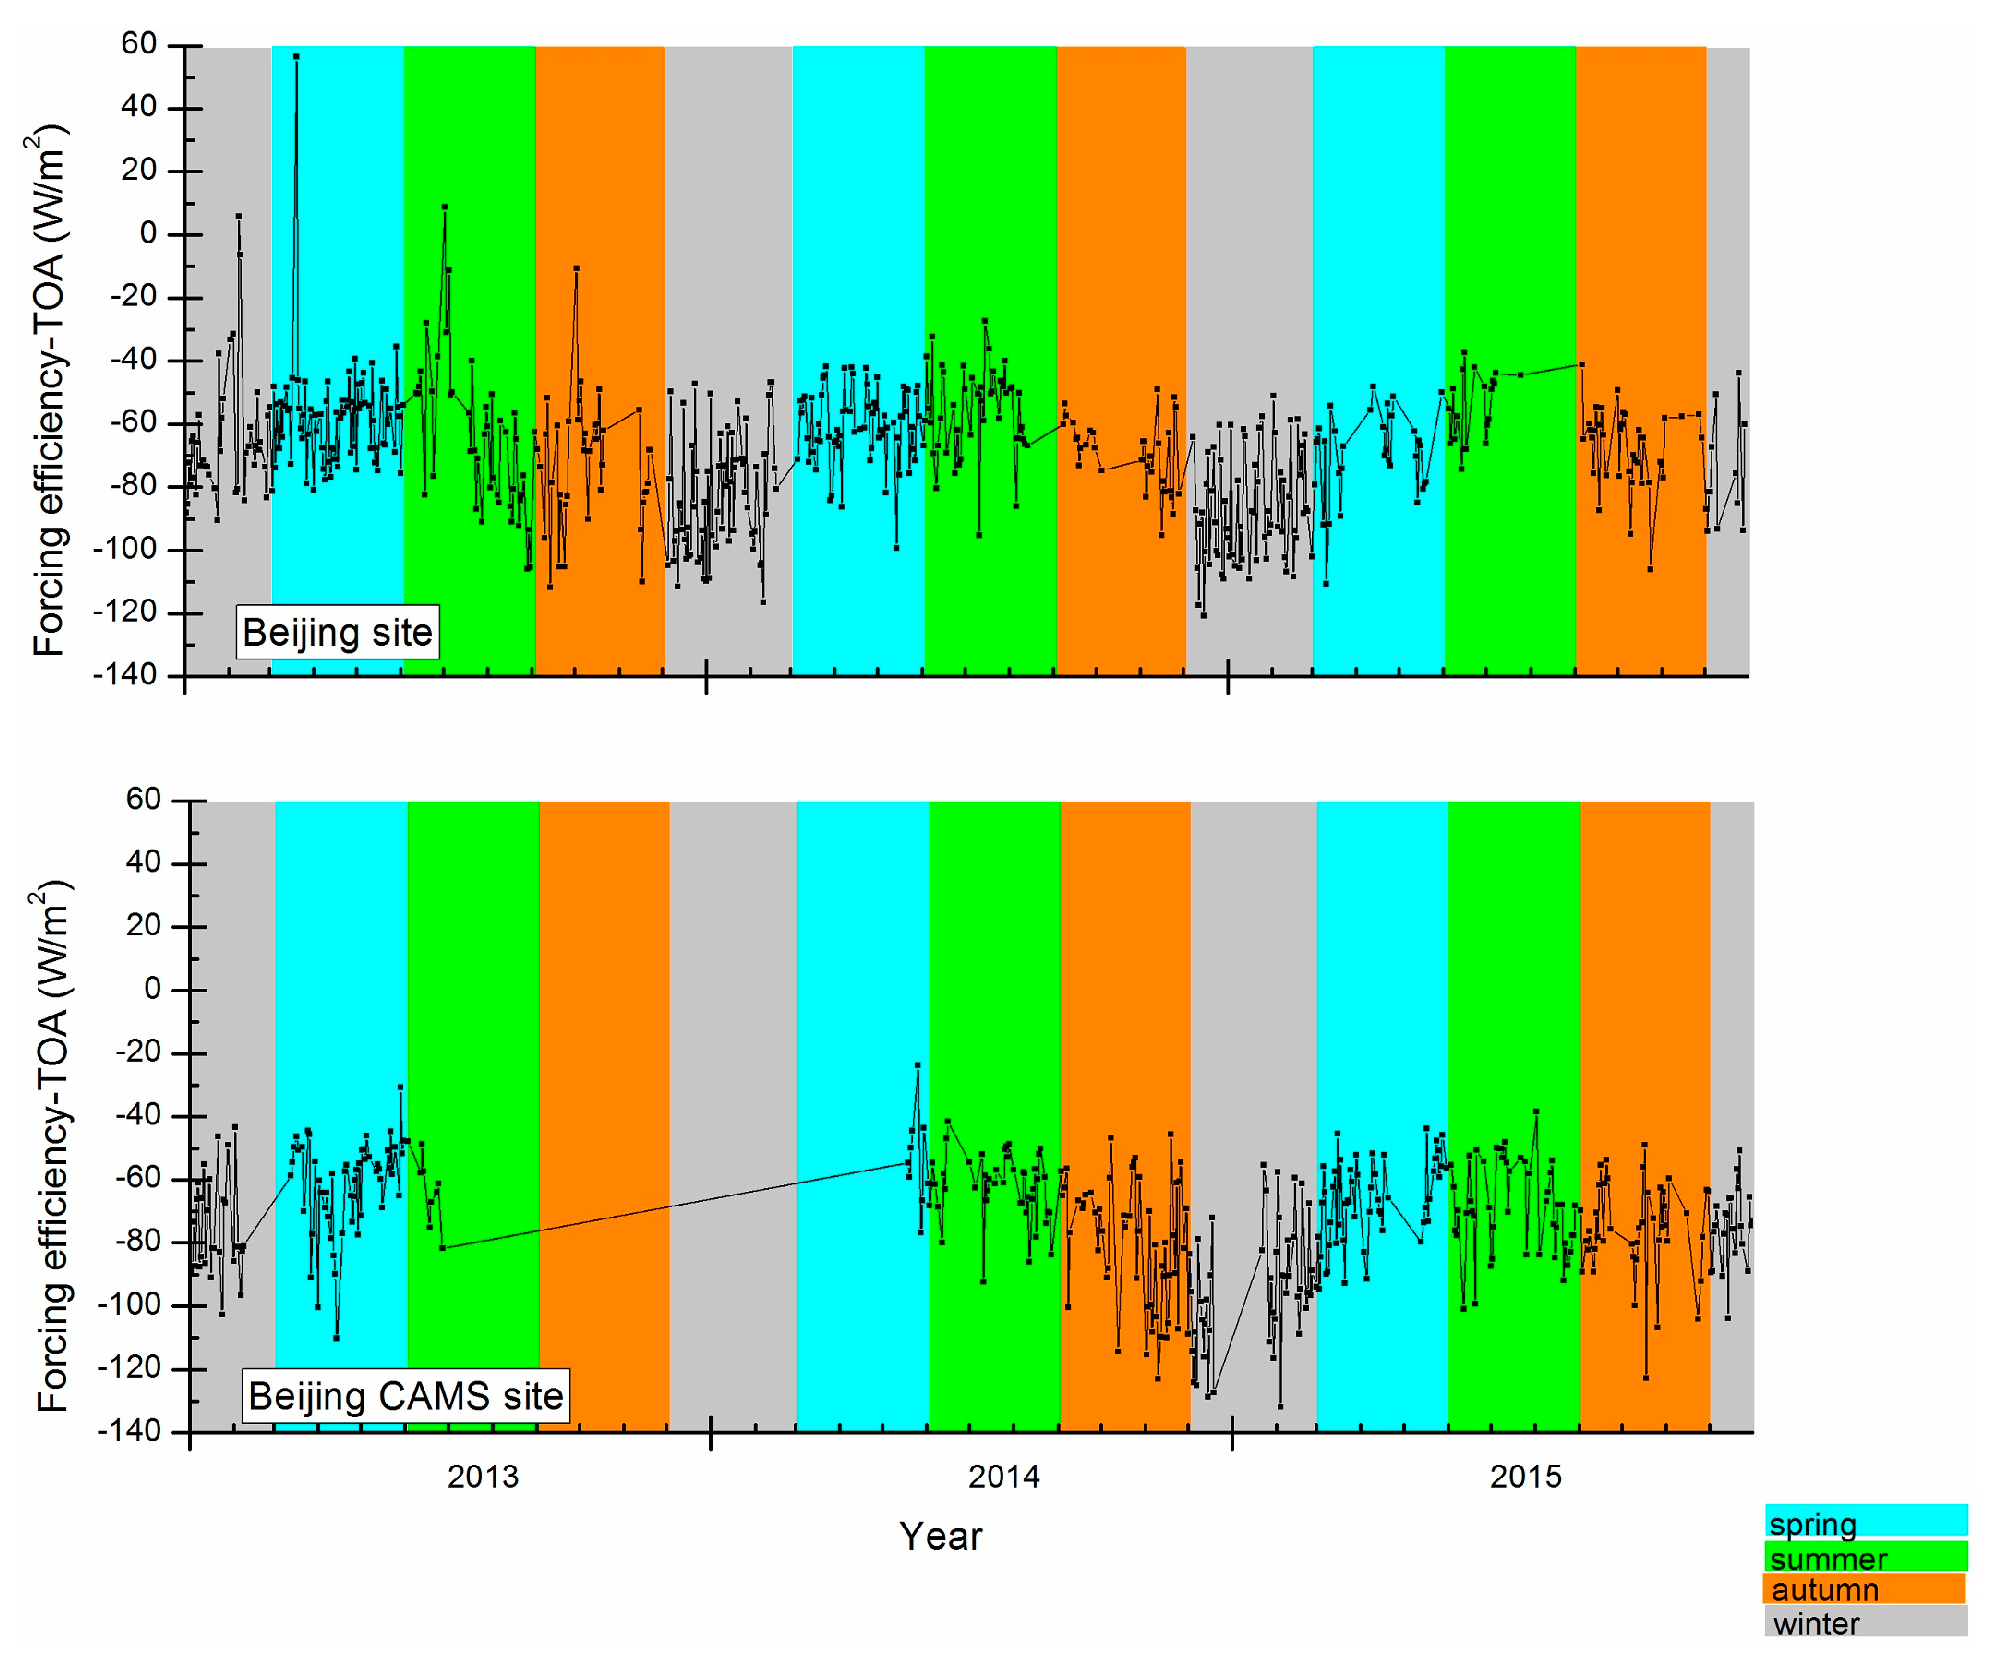
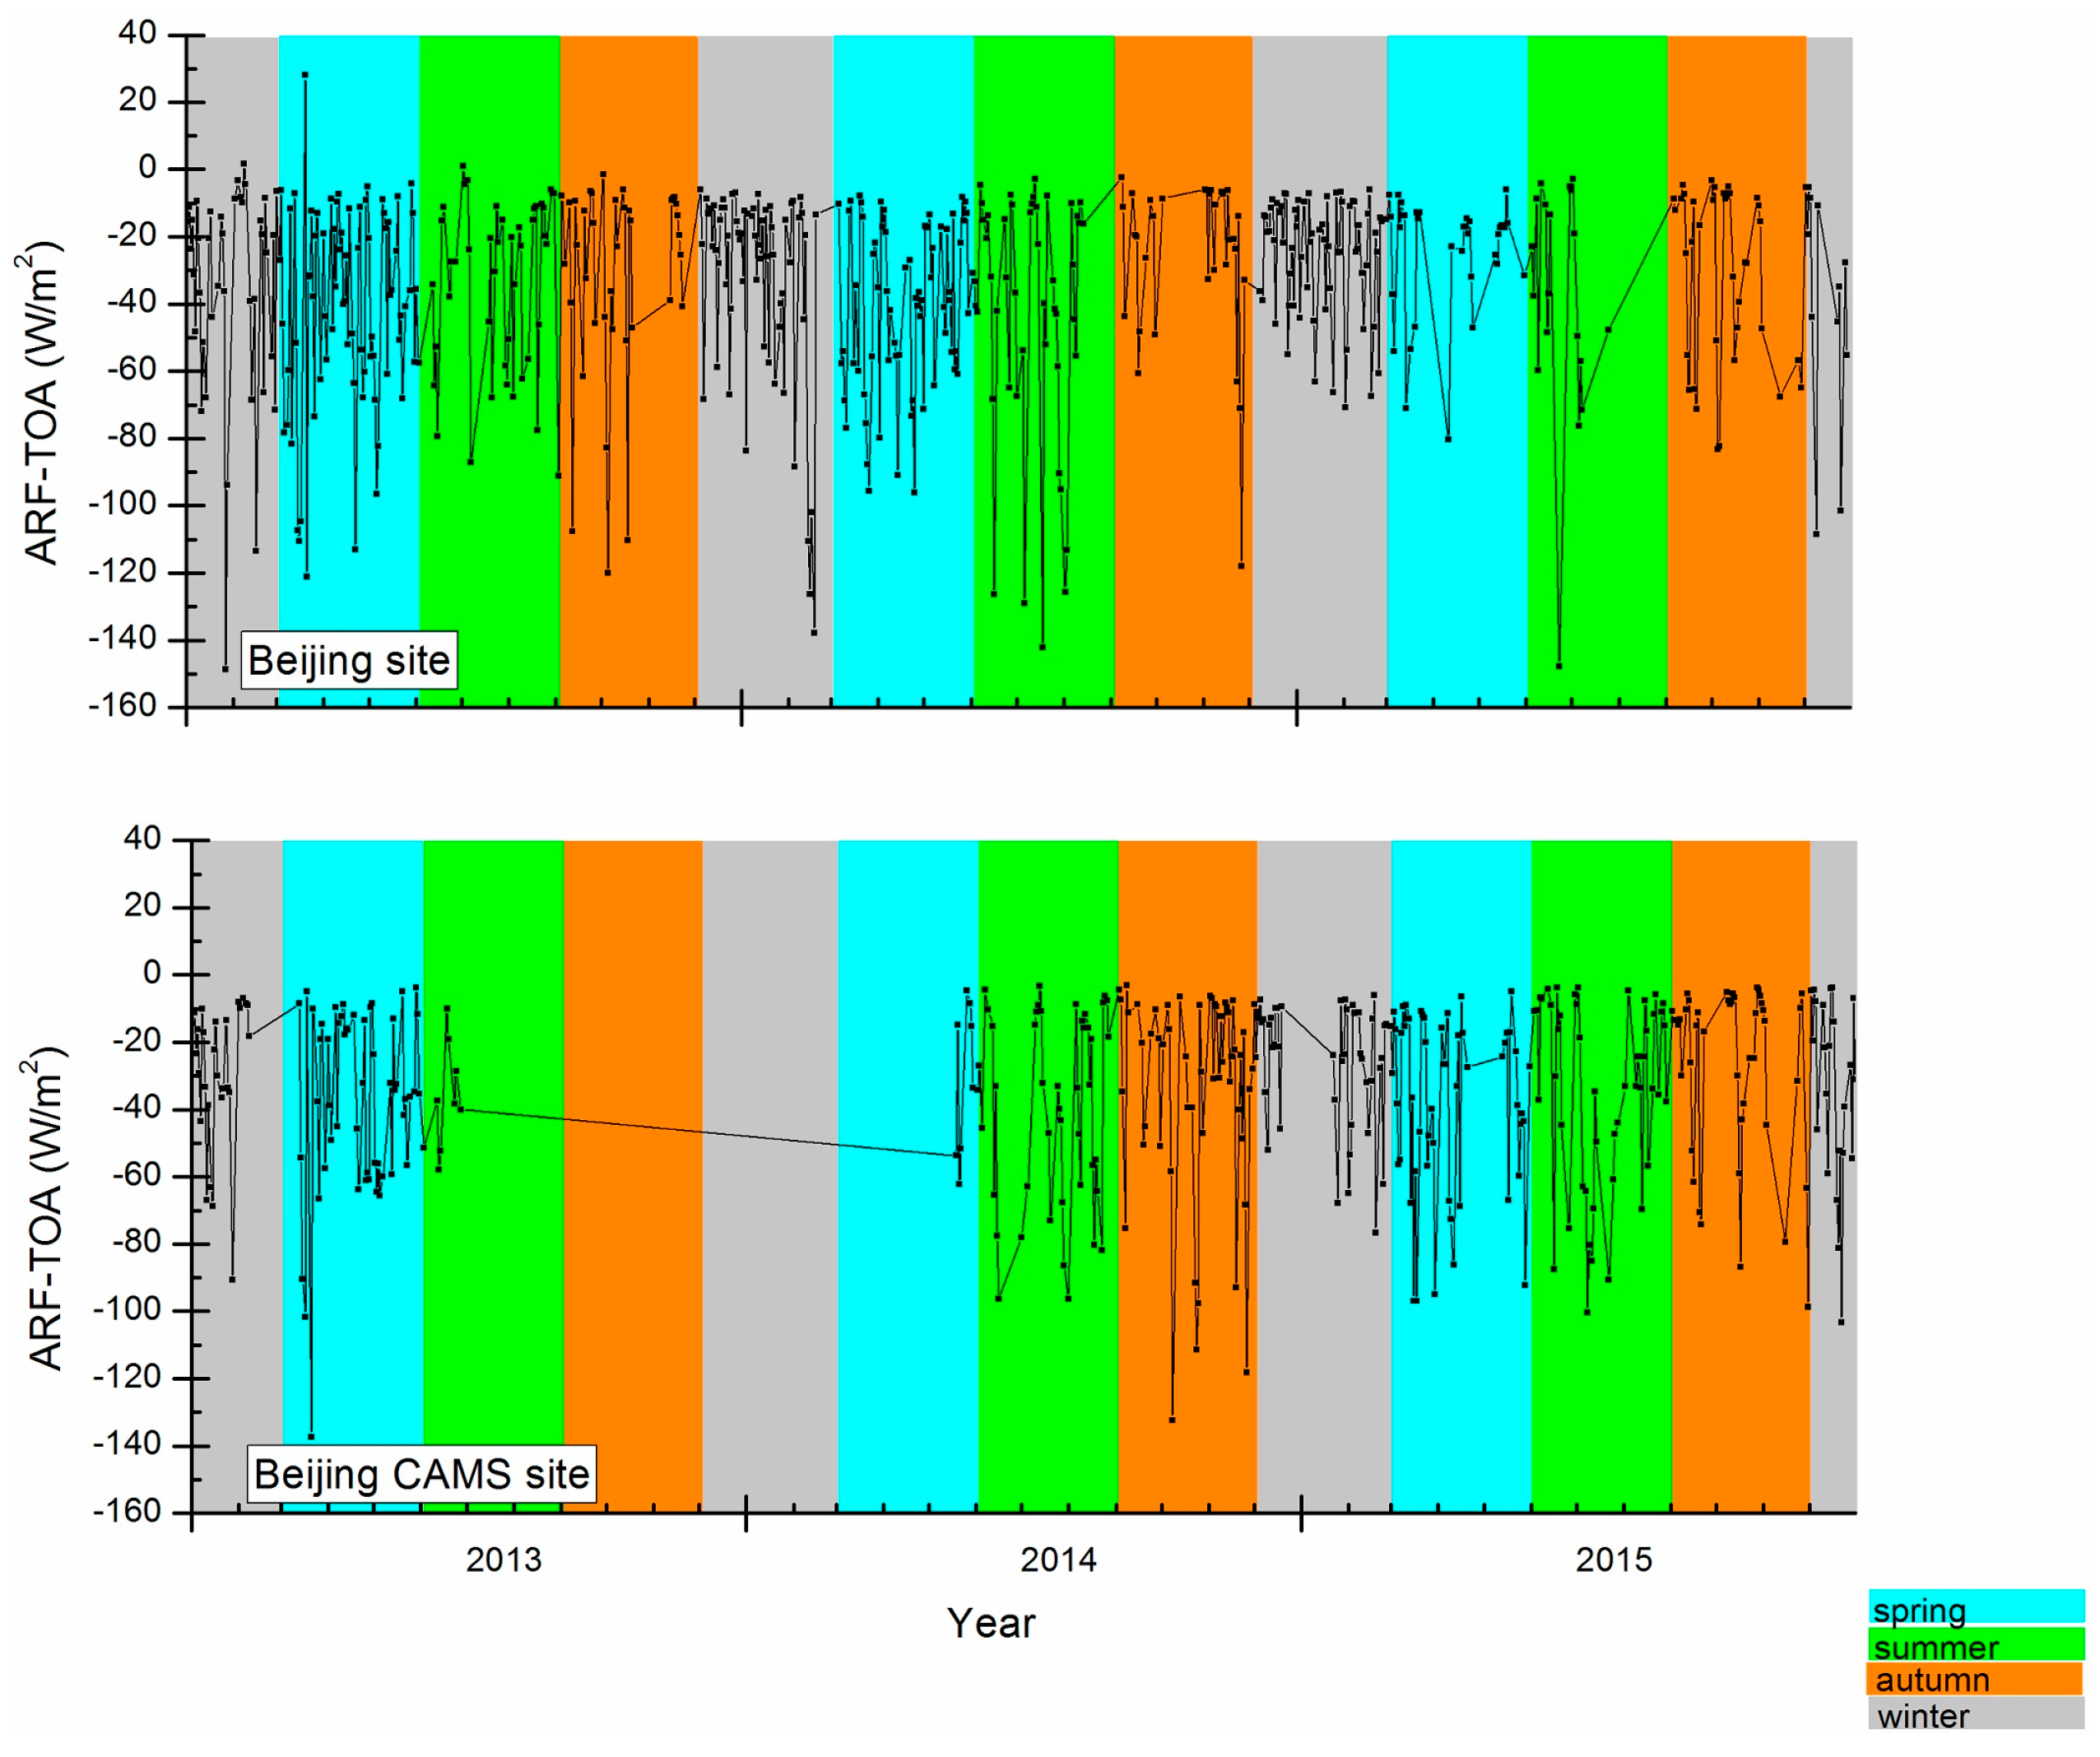
3.2. Aerosol Radiative Forcing Measurements by Sun-Photometers

Aerosol radiative forcing (ARF) can be used to investigate the radiative effect of aerosol particles in atmospheric column [35,36,37]; however, in order to directly compare ARF data obtained under different aerosol loading conditions, the ARF efficiency is a more appropriate measurement [1]. Aerosol radiative forcing efficiency was calculated as the radiative forcing per unit of AOD. Figure 5 and Figure 6 illustrate the daily variations of ARF-BOA (aerosol radiative forcing at the bottom of the atmosphere) and ARF-TOA (aerosol radiative forcing at the top of the atmosphere), respectively. During 2013–2015, 578 and 409 effective retrievals were obtained from the Beijing site and Beijing-CAMS site, respectively. The latter number is less than the former, as no data were obtained between July 2013 and mid-May 2014 at the Beijing-CAMS site. For the Beijing-CAMS site, the average BOA radiative forcing was −73.9 W/m2 (−5.8 to −239.2 W/m2, σ = 53.1 W/m2). Spring and autumn had the most frequent large ARF-BOAs (i.e., an absolute ARF value >150 W/m2), and summer had the least. The average BOA radiative forcing for the Beijing site was −78.8 W/m2 (−7.1 to −292.8 W/m2, σ = 55.3 W/m2), which is comparable to that for the Beijing-CAMS site. For the Beijing site, large ARF-BOAs usually occurred prior to 2015 and frequently exceeded −200 W/m2. In the previous research on the radiative forcing of Beijing, the ARF-BOA ranged from −32 to −144 W/m2, according to one-month data analysis [1]. While, for other cities in China, the ARF-BOA were different: −136.52 W/m2 in Shenyang, Northeast China, and −26.28 W/m2 in Tongyu, Northwest of China [6,38]. The ARF-BOA in Beijing could be comparable with that in the Middle East and Southwest Asia (annual average of −114 W/m2) [39], but larger than in that (−56 to −96 W/m2) of Karachi, a megacity in Pakistan [40,41]. More large ARF-BOAs were measured at the Beijing site than at the Beijing-CAMS site during each summer season before 2015, whereas only a small number were measured at the Beijing site than at the Beijing-CAMS site after 2015. The magnitudes of ARF-TOAs in both sites were smaller than those of ARF-BOAs. The averaged TOA radiative forcing was −33.4 W/m2 (−3.2 to −137.3 W/m2, σ = 26.5 W/m2) for the Beijing-CAMS site and −34.1 W/m2 (28 to −148.7 W/m2, σ = 28.4 W/m2) for the Beijing site. Most of the TOA radiative forcings were negative, suggesting that aerosol particles mainly had a cooling effect on top of the atmosphere.
Figure 7 shows the BOA aerosol radiative forcing efficiencies recorded for both AERONET stations. For the Beijing site, they ranged from −62.2 to −392.7 W/m2 (σ = 55.1 W/m2), with more than 368 daily retrievals exceeding −150 W/m2. Most large BOA radiative forcing efficiencies (exceeding −250 W/m2) occurred in winter and autumn, while the largest for the Beijing site (−392.7 W/m2) occurred in summer 2013. For the Beijing-CAMS site, the BOA efficiencies ranged from −74.7 to −312.9 W/m2 (σ = 48.8 W/m2), with only 261 daily BOA radiative forcing efficiencies exceeding −150 W/m2. Fewer large BOA radiative forcing efficiencies (exceeding −250 W/m2) were measured at the Beijing-CAMS station than at the Beijing site.
Figure 8 shows the TOA aerosol radiative forcing efficiencies recorded for both AERONET stations. The TOA radiative forcing efficiencies at the Beijing site ranged from 56.6 to −120.7 W/m2 (σ = 19.6 W/m2), and only three daily measurements in the first half of 2013 were positive. For the Beijing-CAMS site, the TOA aerosol radiative forcing efficiencies ranged from −23.6 to −131.8 W/m2 (σ = 18.4 W/m2). When considering these data on an annual scale, autumn and winter days generally had relatively larger TOA aerosol radiative forcing efficiencies than summer days.

4. Discussion

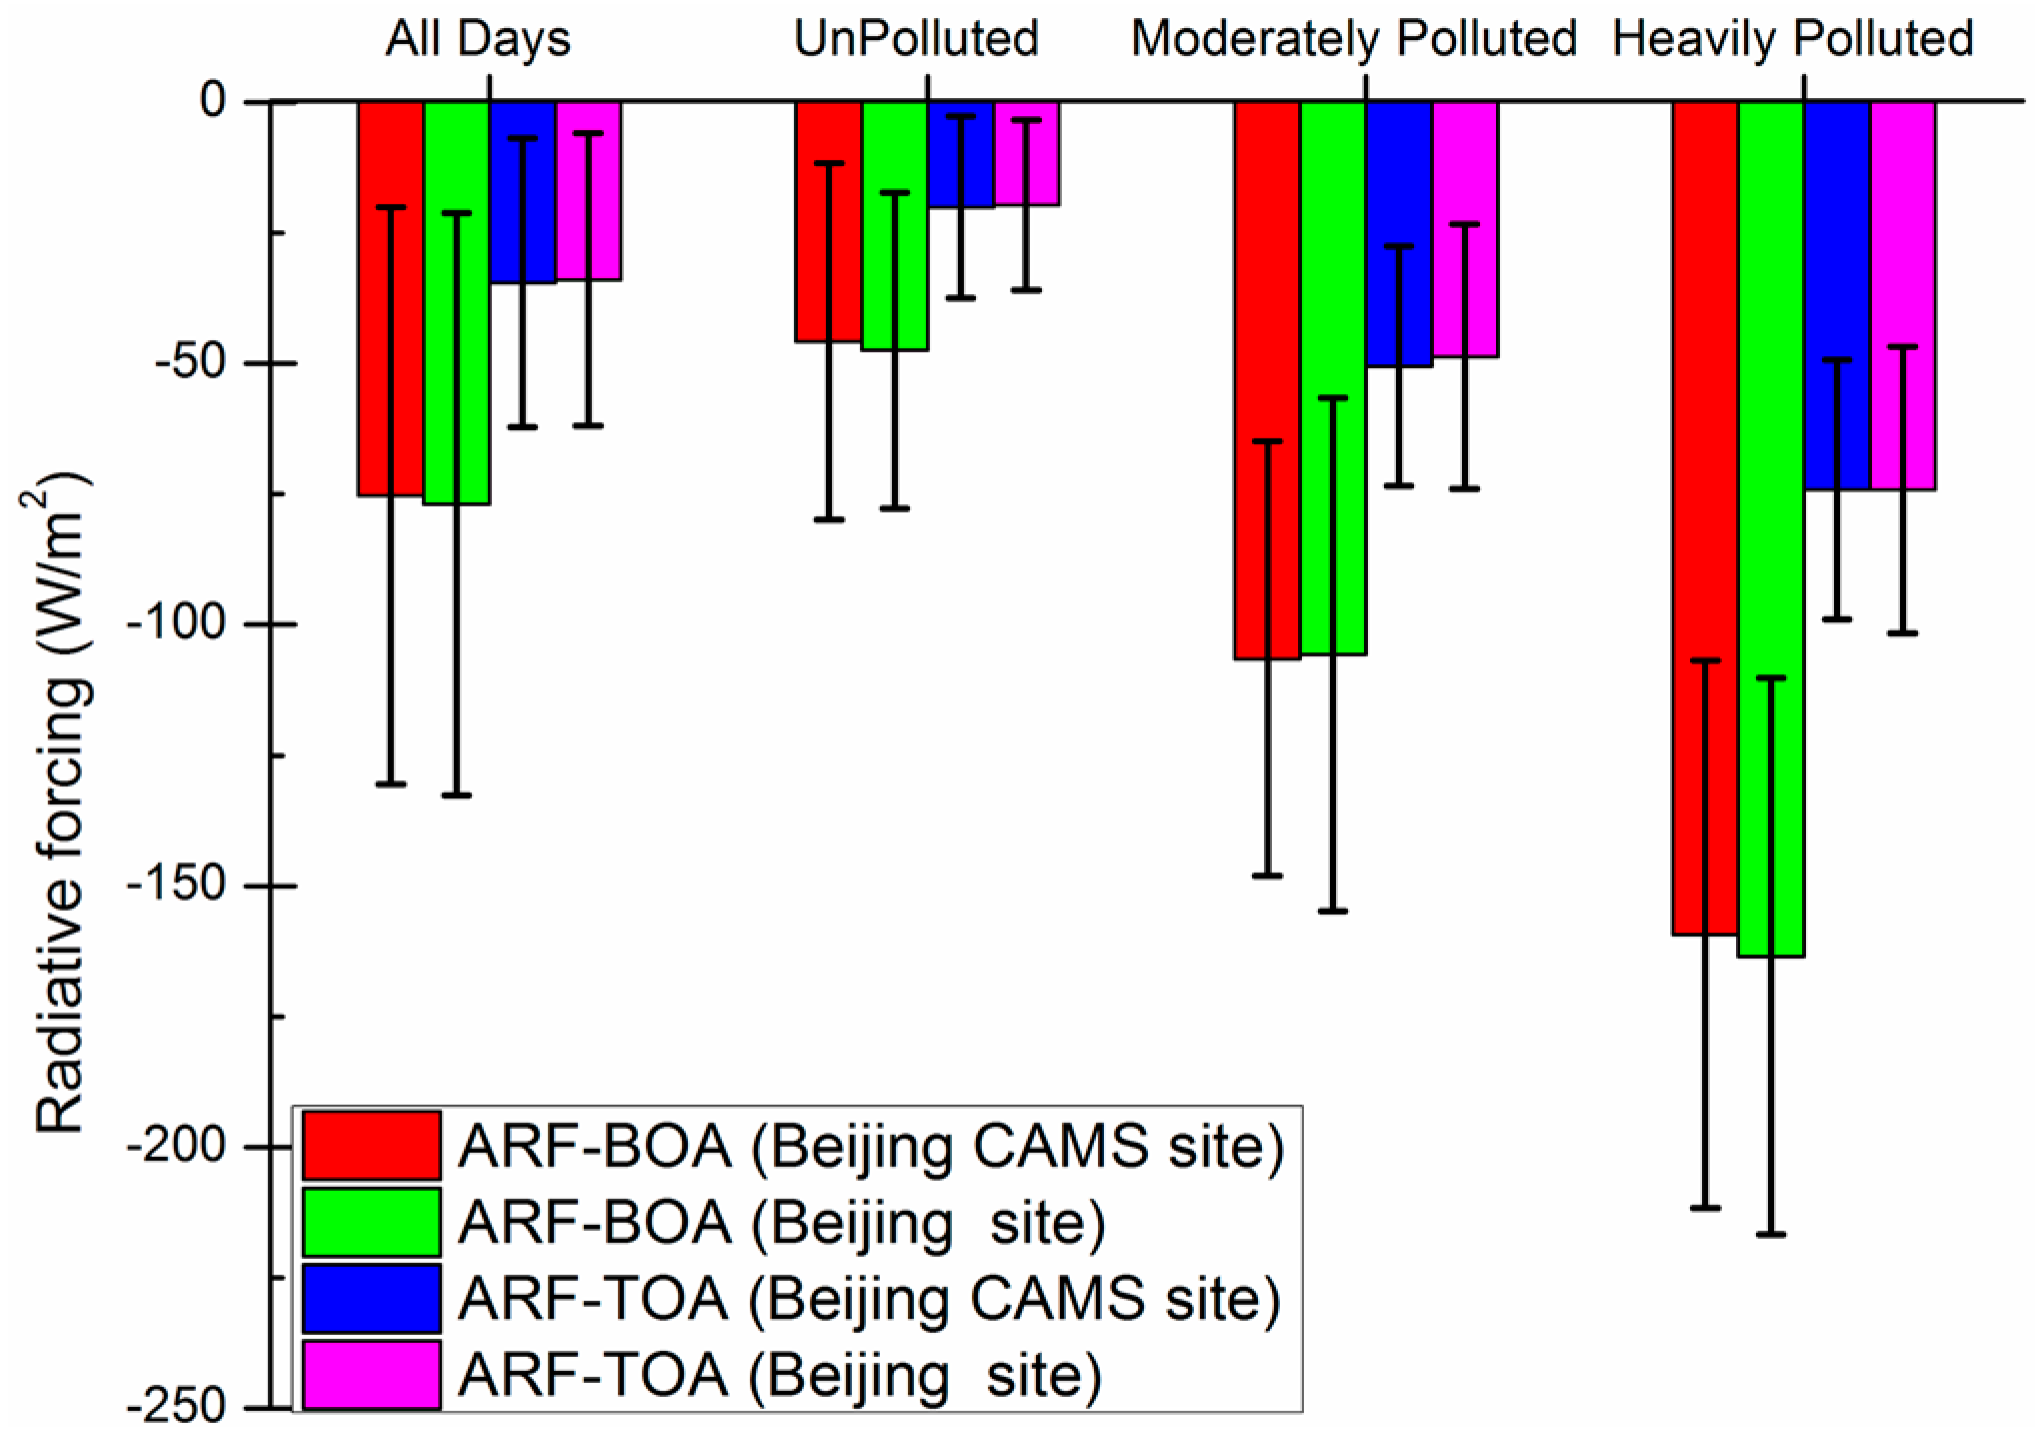
4.1. Aerosol Radiative Forcing on Heavily Polluted Days, Moderately Polluted Days, and Unpolluted Days

According to China’s national ambient air quality standard release in 2012 (NAAQS-2012) [42,43], daily mean PM2.5 concentrations less than 75 µg/m3 are classed as qualified (unpolluted); concentrations between 75 µg/m3 and 150 µg/m3 are classed as moderatedly polluted, while concentrations greater than 150 µg/m3 are classed as heavily polluted [13,32]. In order to guarantee that real-time monitoring data are representative, at least 20 h of observation data are required for calculation of the daily average, considering that some data may be missing on any given day. Calculated daily average PM2.5 concentrations were then used to determine the corresponding aerosol radiative forcing and efficiency. Despite the potential for the retrieval of radiative forcing data to fail, and that there may have been insufficient PM2.5 concentration data to calculate a daily average, 409 data pairs were successfully acquired for the Beijing site (AERONET) and Olympic Sports Center station (air quality station), and 318 data pairs were acquired for the Beijing-CAMS site and the West Park Officials station.
The Olympic Sports Center station recorded 245 unpolluted days, 121 moderately polluted days, and 43 heavily polluted days, while the West Park Officials station recorded 193, 91, and 34, respectively. Calculated average PM2.5 concentrations at the Olympic Sports Center station were 78.7 µg/m3 (5.5–475.0 µg/m3, σ = 66.6 µg/m3) for the entire 409-day measurement period, 38.1 µg/m3 (5.5–74.5 µg/m3, σ = 19.9 µg/m3) for unpolluted days, 108.0 µg/m3 (75.1–150.0 µg/m3, σ = 19.9 µg/m3) for moderately polluted days, and 227.8 µg/m3 (150.7–475.0 µg/m3, σ = 69.7 µg/m3) for heavily polluted days. The West Park Officials station had average values of 77.4 µg/m3 (5.6–347.9 µg/m3, σ = 65.5 µg/m3) for the entire 318-day measurement period, 36.9 µg/m3 (5.6–74.4 µg/m3, σ = 20.1 µg/m3) for unpolluted days, 107.9 µg/m3 (75.1–145.1 µg/m3, σ = 17.9 µg/m3) for moderately polluted days, and 225.9 µg/m3 (152.6–347.9 µg/m3, σ = 56.5 µg/m3) for heavily polluted days. Both stations’ average PM2.5 concentrations were slightly above 75 µg/m3, suggesting that the air quality in urban Beijing was slightly worse (on average) than the minimum quality that defines an unpolluted day. However, the average PM2.5 concentration was less than that recorded in 2013 (92.2 µg/m3) [21], suggesting that the air quality has since improved. ARF-BOAs and ARF-TOAs for the Beijing and Beijing-CAMS sites under heavily polluted days, moderately polluted days, and unpolluted days are shown in Figure 9.
Both sites have comparable ARFs under different air quality conditions (Figure 9), which is likely due to both AERONET sites being located in urban areas of Beijing (7 km apart), and so the aerosol properties measured by each are similar. For both sites, heavily polluted days have the highest absolute ARF-BOAs and ARF-TOAs, whereas unpolluted days have the lowest values. The average ARFs under different air quality conditions were all negative for both the top and bottom of the atmosphere, suggesting that the aerosols have cooling effects at both the BOA and TOA level in the urban Beijing area. Furthermore, the ARF-BOAs were about two-to-three times larger than the ARF-TOAs at different air quality conditions. The average ARF-BOA recorded on unpolluted days was −47.5 W/m2 (−8.4 to −211.6 W/m2, σ = 30.2 W/m2) for the Beijing site and −45.7 W/m2 (−5.8 to −223.8 W/m2, σ = 34.1 W/m2) for the Beijing-CAMS site. According to previous investigations, ARF-BOAs based on AERONET retrievals in January 2013 ranged from −9 to −63 W/m2 [1], although the range of ARF-BOA values presented herein is quite different from these values, partly due to this study’s analysis being made from two years’ worth of observations rather than from a single month’s data. The ARF-TOA recorded on unpolluted days was −19.6 W/m2 (−0.9 to −137.7 W/m2, σ = 16.3 W/m2) for the Beijing site and −20.7 W/m2 (−3.2 to −97.0 W/m2, σ = 17.4 W/m2) for the Beijing-CAMS site. For moderately and heavily polluted days, ARF-BOAs were −105.6 (−106.5) W/m2 and −163.5 (−159.4) W/m2 in Beijing site (Beijing CMAS site), respectively. The ARF-BOAs on unpolluted days were approximately one-third as large as those recorded on heavily polluted days, and about one-half of the values recorded on moderately polluted days. Similarly, the ARF-TOAs recorded under heavily polluted days were 2.5-times as large as those recorded on moderately polluted days, which were 2.5-times as large as those recorded on unpolluted days.

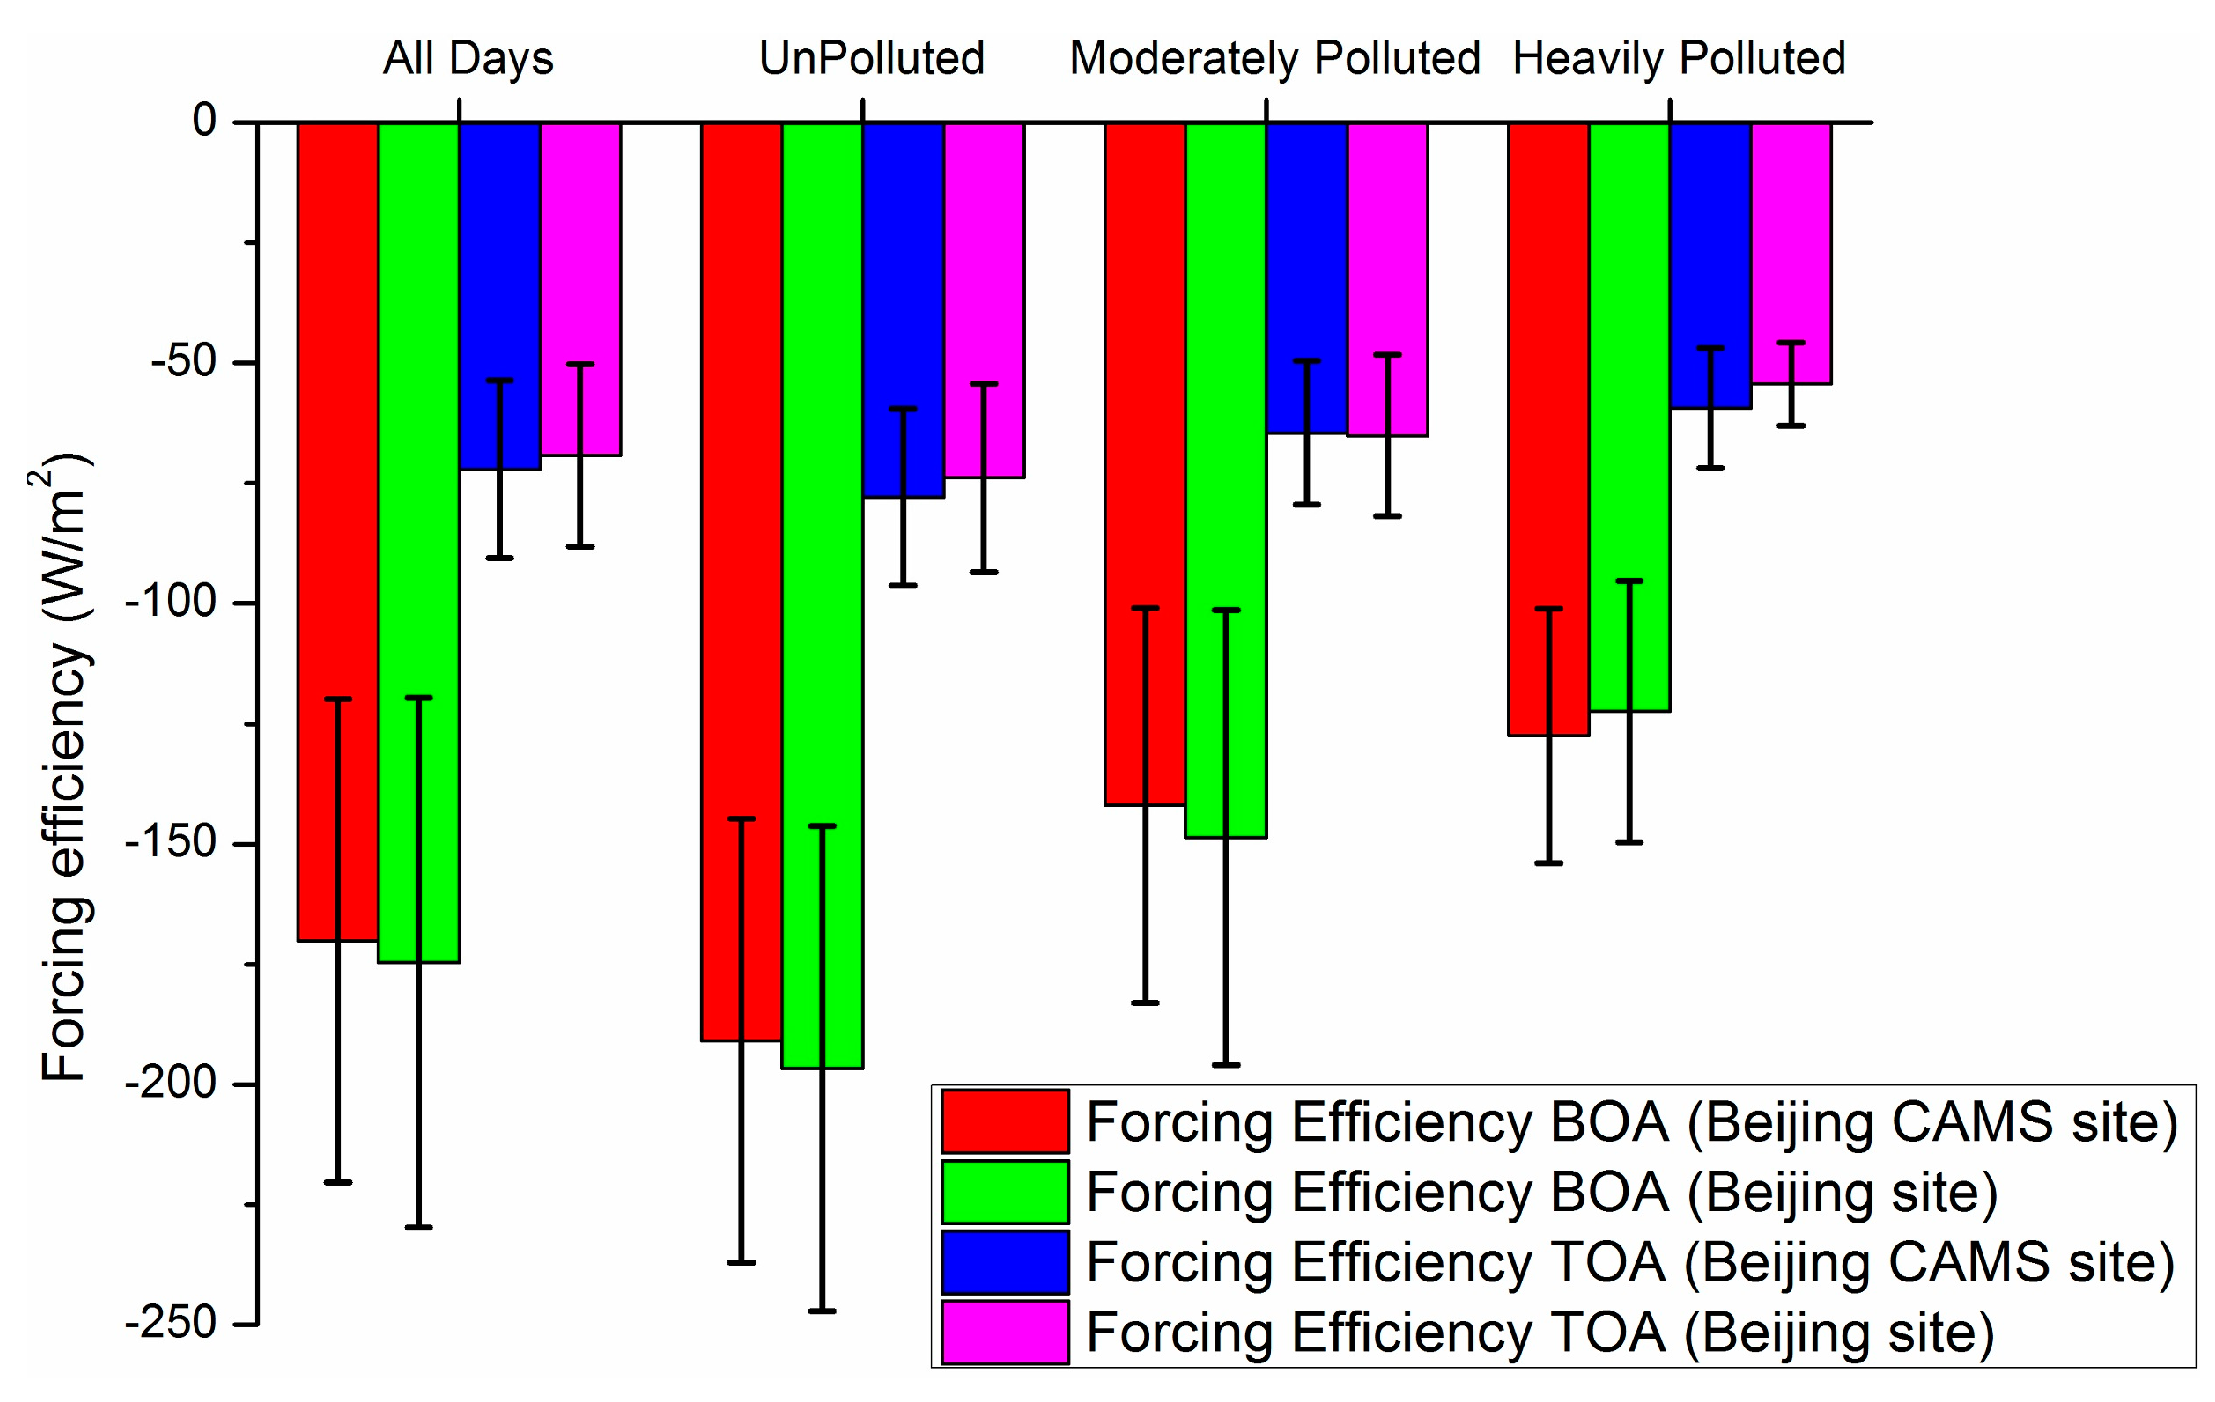
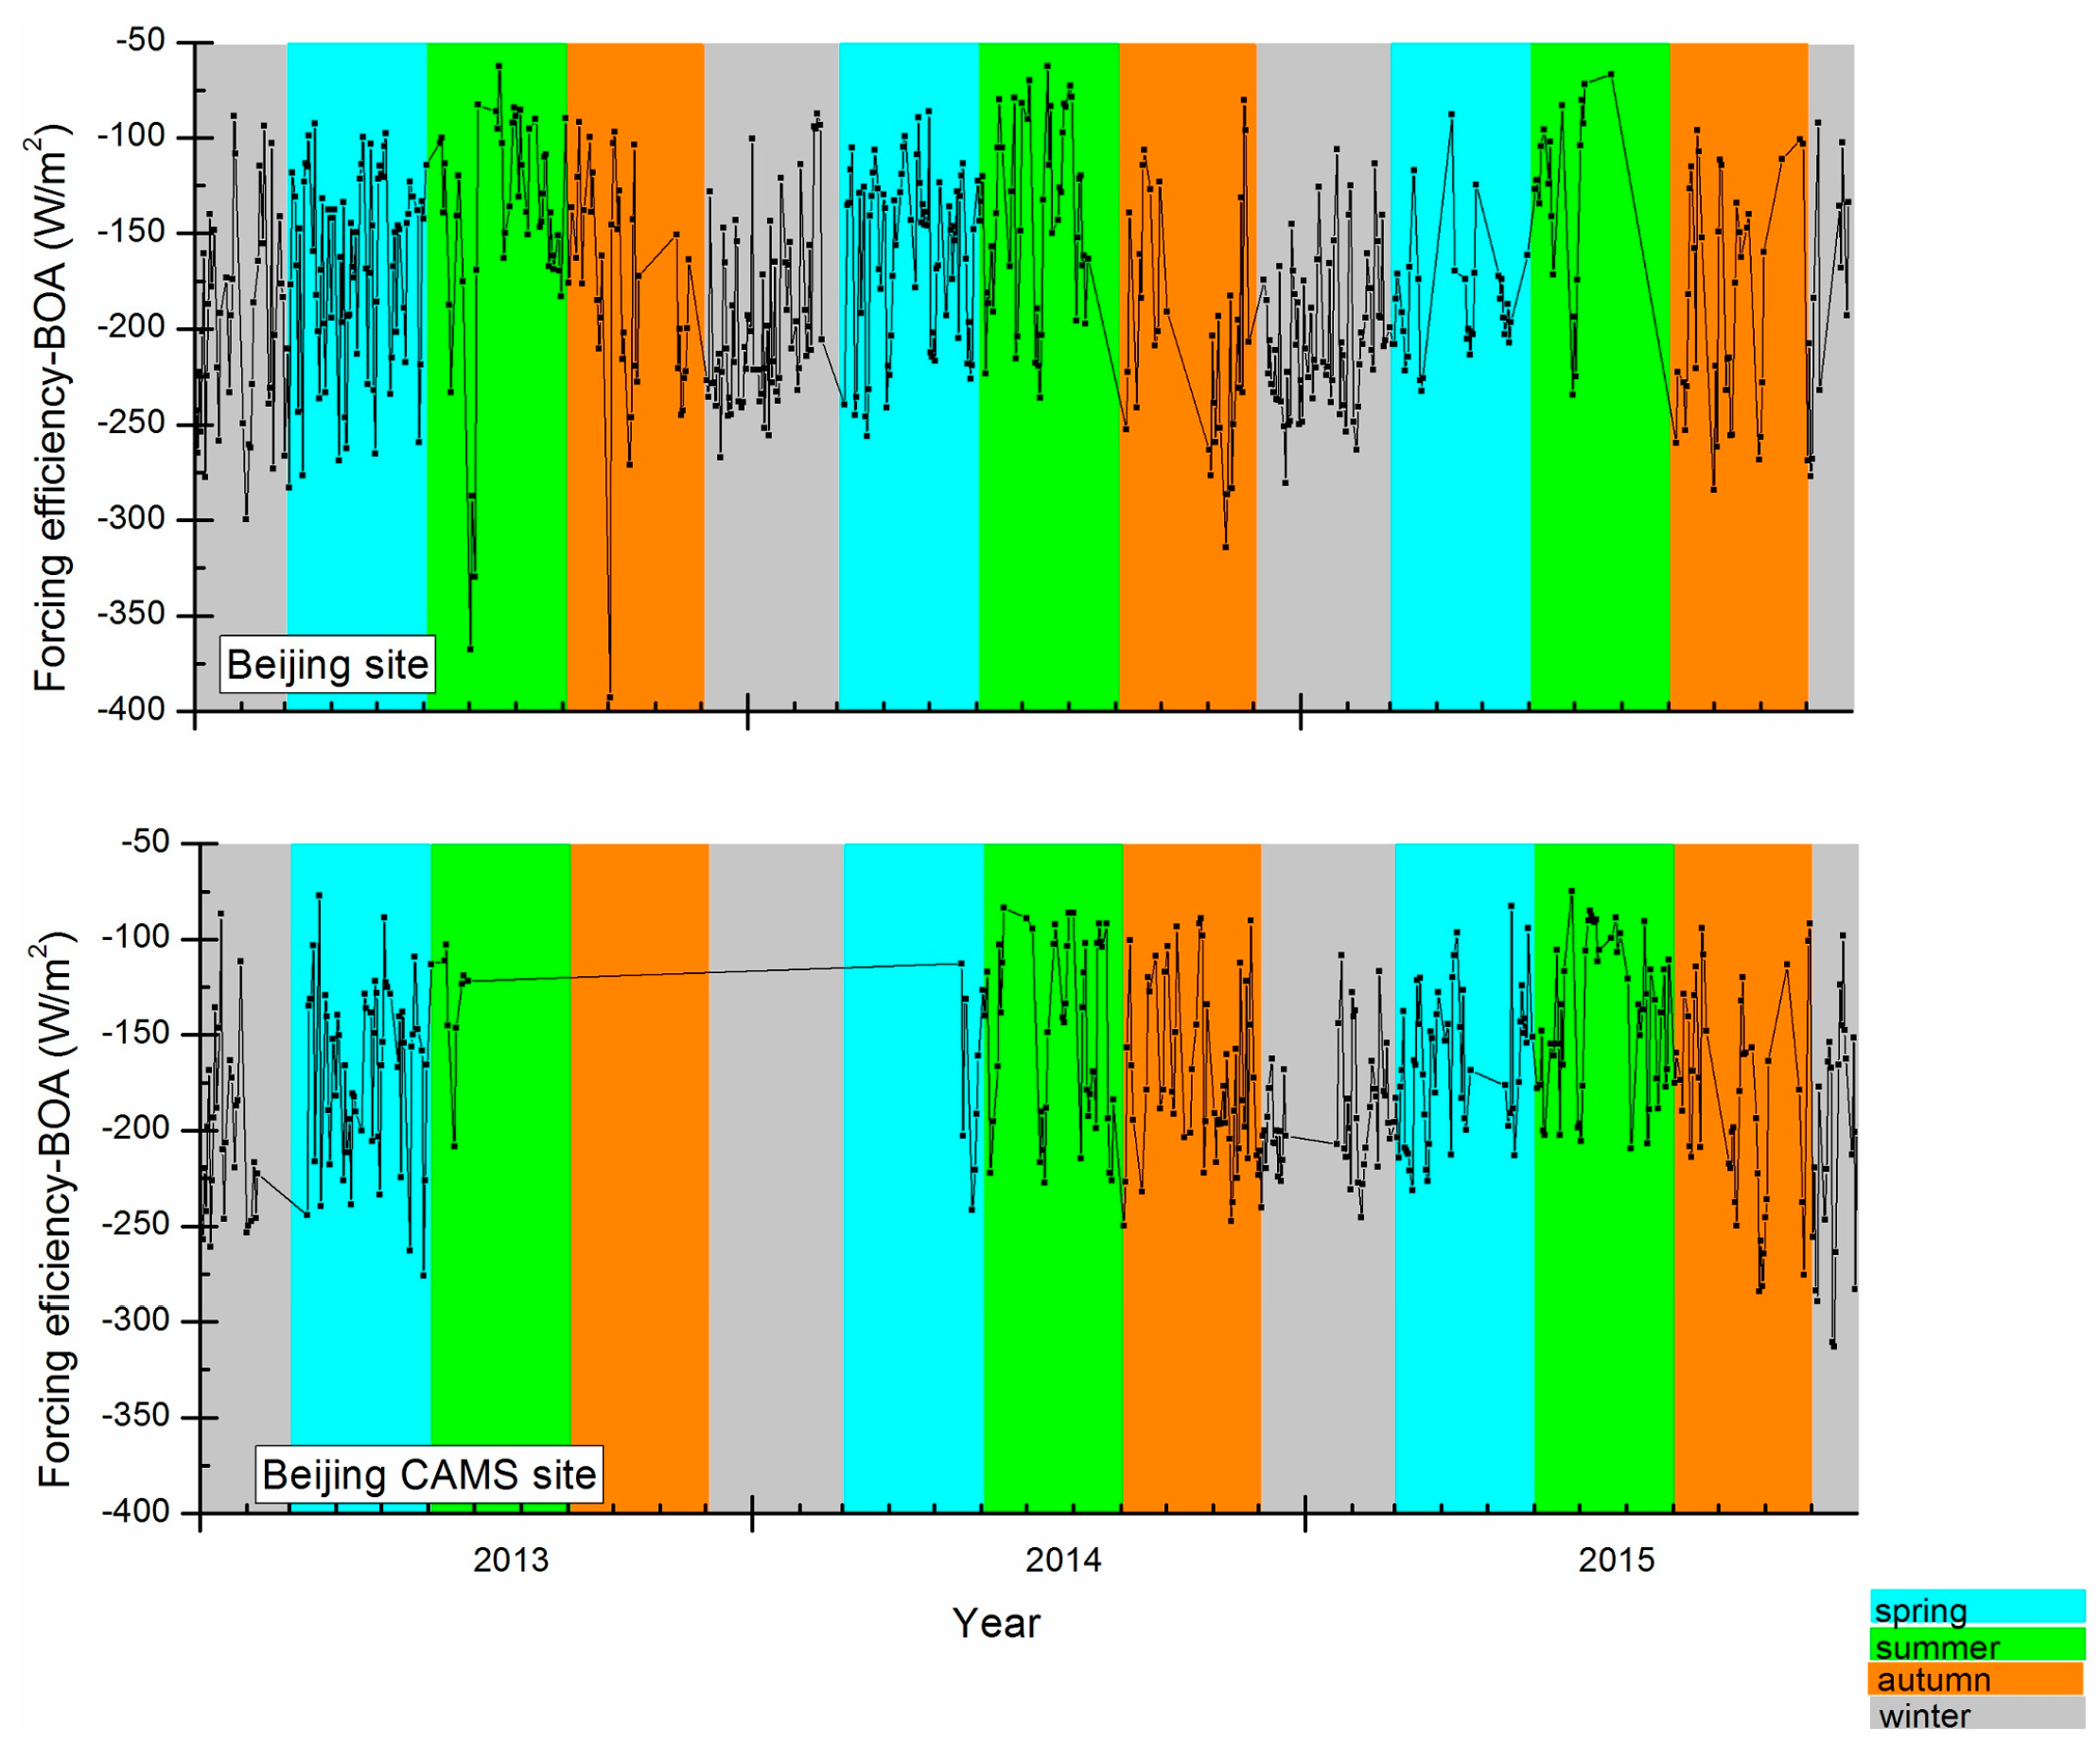
4.2. Aerosol Radiative Forcing Efficiency on Heavily Polluted Days, Moderately Polluted Days, and Unpolluted Days

Figure 10 shows the radiative forcing efficiencies for both AERONET stations under unpolluted, moderately polluted, and heavily polluted days, as well as the mean of all measurements. Non-polluted days had the largest absolute value of BOA radiative forcing efficiency, with values of −196.7 W/m2 (−80.5 to −392.7 W/m2, σ = 50.5 W/m2) for the Beijing site and −190.8 W/m2 (−88.5 to −313.0 W/m2, σ = 46.1 W/m2) for the Beijing-CAMS site. For moderately polluted and heavily polluted days, the average BOA radiative forcing efficiencies were −148.7 W/m2 (−62.2 to −236.3 W/m2, σ = 47.3 W/m2) and −127.5 W/m2 (−83.1 to −195.4 W/m2, σ = 27.1 W/m2) for the Beijing site, respectively, and −141.9 W/m2 (−74.7 to −246.8 W/m2, σ = 41.1 W/m2) and −122.5 W/m2 (−89.1 to −184.3 W/m2, σ = 26.4 W/m2) for the Beijing-CAMS site, respectively. These results are consistent with the that a low AOD could present more impact on radiative forcing efficiencies [1,44]. The magnitudes of TOA radiative forcing efficiencies were far less than those of BOA radiative forcing efficiencies. Unpolluted days had the largest absolute values of radiative forcing efficiencies (−73.9 W/m2 for the Beijing site and −77.9 W/m2 for the Beijing-CAMS site), followed by moderately polluted days (−65.1 W/m2 for the Beijing site and −64.5 W/m2 for the Beijing-CAMS site), and heavily polluted days (−54.4 W/m2 for the Beijing site and −59.4 W/m2 for the Beijing-CAMS site), while the difference between them is smaller than that of BOA radiative forcing efficiencies.

5. Conclusions

The capital of China, Beijing, has been detrimentally affected by both natural and anthropogenic aerosol pollution. Thus, it is important to characterize the climate effect of aerosol in Beijing under different aerosol loading conditions. Two kinds of aerosol monitoring systems, AERONET and air quality monitoring stations, have been deployed in Beijing to investigate the atmospheric environment of Beijing. In this study, observations of aerosol radiative forcing and its efficiency have been made at two AERONET sites in urban Beijing, and have been analyzed and classified in this study according to different air quality conditions.
According to the air quality monitoring data, the daily average PM2.5 concentrations in Beijing varied from 5.5 to 485.0 µg/m3, with an annual average of around 78 µg/m3. Seasonal variations showed that spring and summer tended to have lower PM2.5 concentrations than autumn and winter. More than ten polluted days were recorded each month at both air quality stations, suggesting that Beijing was “polluted” for nearly one-third of each year.
ARF-BOAs measured at both AERONET sites during 2013–2015 varied from −5.8 to −292.8 W/m2. Corresponding ARF-TOAs were between 28 and −148.7 W/m2, most of which were negative. The BOA radiative forcing efficiencies recorded at both AERONET sites ranged from −62.2 W/m2 to −392.7 W/m2. Most large radiative forcing efficiencies (exceeding −250 W/m2) occurred in winter and autumn. The magnitudes of TOA radiative forcing efficiencies were smaller than BOA values, with rare examples exhibiting positive values.
Dividing the air quality situation into unpolluted, moderately polluted, and heavily polluted days allowed the aerosol radiative forcings and efficiencies of each condition to be investigated in detail. Heavily polluted days had the largest ARF-BOAs and ARF-TOAs, with moderately polluted days and unpolluted days having sequentially lower values. The average BOA radiative forcing on heavily polluted days (−163.5 W/m2 for the Beijing site and −159.4 W/m2 for the Beijing-CAMS site) was around three-times larger than that recorded on unpolluted days (−47.5 W/m2 for the Beijing site and −45.7 W/m2 for the Beijing-CAMS site). Average ARF-BOAs recorded on moderately polluted days (−105.6 W/m2 for the Beijing site and −106.5 W/m2 for the Beijing-CAMS site) were approximately twice as large as those recorded on unpolluted days. Similar trends in ARF-TOAs were observed for different air quality situations, except that the ratios of heavily polluted days to unpolluted days, and moderately polluted days to unpolluted days were both ~2.5:1. Furthermore, the magnitudes of ARF-BOAs under different air quality situations were about two-to-three times as large as those of ARF-TOAs, suggesting that aerosol particles more efficiently cool the bottom of the atmosphere than the top. Unpolluted days showed the largest absolute values of ARF efficiencies at both BOA and TOA levels, followed by moderately polluted days and heavily polluted days.
The results of this study suggested that the ARF and its efficiency varied greatly under different air quality situations, and the high concentrations of particulate matter (dry aerosol particles) severely affected the BOA and TOA radiation budget over urban Beijing. The presence of particulate matter, especially high concentrations of particulate matter, has severely affected the environment and climate in Beijing. The quantitative analysis presented herein shows that the reduction of particulate matter concentrations will attenuate the cooling radiative forcings of aerosol in Beijing.

Acknowledgments

This research was supported by the Fundamental Research Funds for the Central Universities under Grant 2014QD02, the Open Fund of State Key Laboratory of Remote Sensing Science (Grant No. OFSLRSS201623), National Natural Science Foundation of China (Grant No. 41371492) and the outstanding talent training project of Beijing under Grant 2014000020124G0441. We acknowledge the Principle Investigators of the Beijing Site (Hong-Bin Chen and Philippe Goloub) and the Beijing-CAMS site (Huizheng Che) for providing AERONET observation data.

Author Contributions

Wei Chen and Lei Yan defined the major working scheme, collected the data, and wrote the paper. Nan Ding and Mengdie Xie processed the air quality data. Ming Lu, Fan Zhang, Yongxu Duan, and Shuo Zong processed the AERONET data.

Conflicts of Interest

The authors declare no conflict of interest.

Abbreviations

The following abbreviations are used in this manuscript:
TOATop of atmosphere
BOABottom of atmosphere
ARFAerosol radiative forcing
AERONETAerosol Robotic Network

References

  1. Che, H.; Xia, X.; Zhu, J.; Li, Z.; Dubovik, O.; Holben, B.; Goloub, P.; Chen, H.; Estelles, V.; Cuevas-Agullo, E. Column aerosol optical properties and aerosol radiative forcing during a serious haze-fog month over north China plain in 2013 based on ground-based sunphotometer measurements. Atmos. Chem. Phys. 2014, 14, 2125–2138. [Google Scholar] [CrossRef]
  2. Kuang, Y.; Zhao, C.S.; Tao, J.C.; Ma, N. Diurnal variations of aerosol optical properties in the north China plain and their influences on the estimates of direct aerosol radiative effect. Atmos. Chem. Phys. 2015, 15, 5761–5772. [Google Scholar] [CrossRef]
  3. Behnert, I.; Matthias, V.; Doerffer, R. Aerosol climatology from ground-based measurements for the southern North Sea. Atmos. Res. 2007, 84, 201–220. [Google Scholar] [CrossRef]
  4. Che, H.; Zhang, X.Y.; Xia, X.; Goloub, P.; Holben, B.; Zhao, H.; Wang, Y.; Zhang, X.C.; Wang, H.; Blarel, L.; et al. Ground-based aerosol climatology of China: Aerosol optical depths from the China aerosol remote sensing network (CARSNET) 2002–2013. Atmos. Chem. Phys. 2015, 15, 7619–7652. [Google Scholar] [CrossRef]
  5. Che, H.Z.; Xia, X.G.; Zhu, J.; Wang, H.; Wang, Y.Q.; Sun, J.Y.; Zhang, X.Y.; Shi, G.Y. Aerosol optical properties under the condition of heavy haze over an urban site of Beijing, China. Environ. Sci. Pollut. R. 2015, 22, 1043–1053. [Google Scholar] [CrossRef] [PubMed]
  6. Che, H.Z.; Zhao, H.J.; Wu, Y.F.; Xia, X.G.; Zhu, J.; Wang, H.; Wang, Y.Q.; Sun, J.Y.; Yu, J.; Zhang, X.Y.; et al. Analyses of aerosol optical properties and direct radiative forcing over urban and industrial regions in northeast China. Meteorol. Atmos. Phys. 2015, 127, 345–354. [Google Scholar] [CrossRef]
  7. Schuster, G.L.; Vaughan, M.; MacDonnell, D.; Su, W.; Winker, D.; Dubovik, O.; Lapyonok, T.; Trepte, C. Comparison of Calipso aerosol optical depth retrievals to aeronet measurements, and a climatology for the LIDAR ratio of dust. Atmos. Chem. Phys. 2012, 12, 7431–7452. [Google Scholar] [CrossRef]
  8. Garcia, O.E.; Diaz, J.P.; Exposito, F.J.; Diaz, A.M.; Dubovik, O.; Derimian, Y.; Dubuisson, P.; Roger, J.C. Shortwave radiative forcing and efficiency of key aerosol types using aeronet data. Atmos. Chem. Phys. 2012, 12, 5129–5145. [Google Scholar] [CrossRef]
  9. Holben, B.N.; Eck, T.F.; Slutsker, I.; Tanré, D.; Buis, J.P.; Setzer, A.; Vermote, E.; Reagan, J.A.; Kaufman, Y.J.; Nakajima, T.; et al. AERONET—A federated instrument network and data archive for aerosol characterization. Remote. Sens. Environ. 1998, 66, 1–16. [Google Scholar] [CrossRef]
  10. Tao, M.H.; Chen, L.F.; Wang, Z.F.; Tao, J.H.; Che, H.Z.; Wang, X.H.; Wang, Y. Comparison and evaluation of the modis collection 6 aerosol data in China. J. Geophys. Res. 2015, 120, 6992–7005. [Google Scholar] [CrossRef]
  11. Sayer, A.M.; Hsu, N.C.; Bettenhausen, C.; Jeong, M.J. Validation and uncertainty estimates for modis collection 6 “deep blue” aerosol data. J. Geophys. Res. 2013, 118, 7864–7872. [Google Scholar] [CrossRef]
  12. Khan, A.; Najm, U.S.; Yaseen, I. Aerosol characteristics and radiative forcing during pre-monsoon and post-monsoon seasons in an urban environment. Aerosol. Air. Qual. Res. 2014, 14, 99–107. [Google Scholar]
  13. Chen, W.; Tang, H.; Zhao, H. Diurnal, weekly and monthly spatial variations of air pollutants and air quality of Beijing. Atmos. Environ. 2015, 119, 21–34. [Google Scholar] [CrossRef]
  14. Chen, W.; Wang, F.; Xiao, G.; Wu, K.; Zhang, S. Air quality of Beijing and impacts of the new ambient air quality standard. Atmosphere 2015, 6, 1243. [Google Scholar] [CrossRef]
  15. Zhao, H.; Che, H.; Ma, Y.; Xia, X.; Wang, Y.; Wang, P.; Wu, X. Temporal variability of the visibility, particulate matter mass concentration and aerosol optical properties over an urban site in northeast China. Atmos. Res. 2015, 166, 204–212. [Google Scholar] [CrossRef]
  16. Xia, X.A.; Chen, H.B.; Wang, P.C.; Zong, X.M.; Qiu, J.H.; Gouloub, P. Aerosol properties and their spatial and temporal variations over north China in spring 2001. Tellus B 2005, 57, 28–39. [Google Scholar]
  17. Chen, W.; Tang, H.; Zhao, H. Urban air quality evaluations under two versions of the national ambient air quality standards of China. Atmos. Pollut. Res. 2016, 7, 49–57. [Google Scholar] [CrossRef]
  18. Streets, D.G.; Fu, J.S.; Jang, C.J.; Hao, J.M.; He, K.B.; Tang, X.Y.; Zhang, Y.H.; Wang, Z.F.; Li, Z.P.; Zhang, Q.; et al. Air quality during the 2008 Beijing Olympic Games. Atmos. Environ. 2007, 41, 480–492. [Google Scholar] [CrossRef]
  19. Fu, J.S.; Streets, D.G.; Jang, C.J.; Hao, J.M.; He, K.B.; Wang, L.T.; Zhang, Q. Modeling regional/urban ozone and particulate matter in Beijing, China. J. Air. Waste Manag. 2009, 59, 37–44. [Google Scholar] [CrossRef]
  20. Bi, J.R.; Huang, J.P.; Hu, Z.Y.; Holben, B.N.; Guo, Z.Q. Investigating the aerosol optical and radiative characteristics of heavy haze episodes in Beijing during January of 2013. J. Geophys. Res. 2014, 119, 9884–9900. [Google Scholar] [CrossRef]
  21. Zhou, Y.; Cheng, S.; Chen, D.; Lang, J.; Wang, G.; Xu, T.; Wang, X.; Yao, S. Temporal and spatial characteristics of ambient air quality in Beijing, China. Aerosol. Air. Qual. Res. 2015, 15, 1868–1880. [Google Scholar] [CrossRef]
  22. Zhang, R.; Jing, J.; Tao, J.; Hsu, S.C.; Wang, G.; Cao, J.; Lee, C.S.L.; Zhu, L.; Chen, Z.; Zhao, Y.; et al. Chemical characterization and source apportionment of PM2.5 in Beijing: Seasonal perspective. Atmos. Chem. Phys. 2013, 13, 7053–7074. [Google Scholar] [CrossRef]
  23. Distribution of Real Time Air Qulaity of China. Available online: http://113.108.142.147:20035/emcpublish/ (accessed on 16 June 2016).
  24. Dubovik, O.; Herman, M.; Holdak, A.; Lapyonok, T.; Tanr, D.; Deuz, J.L.; Ducos, F.; Sinyuk, A.; Lopatin, A. Statistically optimized inversion algorithm for enhanced retrieval of aerosol properties from spectral multi-angle polarimetric satellite observations. Atmos. Meas. Tech. 2011, 4, 975–1018. [Google Scholar] [CrossRef] [Green Version]
  25. Sayer, A.M.; Munchak, L.A.; Hsu, N.C.; Levy, R.C.; Bettenhausen, C.; Jeong, M.J. MODIS collection 6 aerosol products: Comparison between aqua’s e-deep blue, dark target, and “merged” data sets, and usage recommendations. J. Geophys. Res. 2014, 119, 13965–13989. [Google Scholar] [CrossRef]
  26. Gong, C.; Xin, J.; Wang, S.; Wang, Y.; Wang, P.; Wang, L.; Li, P. The aerosol direct radiative forcing over the Beijing metropolitan area from 2004 to 2011. J. Aerosol. Sci. 2014, 69, 62–70. [Google Scholar] [CrossRef]
  27. Dubovik, O.; King, M.D. A flexible inversion algorithm for retrieval of aerosol optical properties from sun and sky radiance measurements. J. Geophys. Res. 2000, 105, 20673–20696. [Google Scholar] [CrossRef]
  28. Dubovik, O.; Smirnov, A.; Holben, B.N.; King, M.D.; Kaufman, Y.J.; Eck, T.F.; Slutsker, I. Accuracy assessments of aerosol optical properties retrieved from aerosol robotic network (AERONET) sun and sky radiance measurements. J. Geophys. Res. 2000, 105, 9791–9806. [Google Scholar] [CrossRef]
  29. Zhao, S.; Yu, Y.; Yin, D.; He, J.; Liu, N.; Qu, J.; Xiao, J. Annual and diurnal variations of gaseous and particulate pollutants in 31 provincial capital cities based on in situ air quality monitoring data from China national environmental monitoring center. Environ. Int. 2016, 86, 92–106. [Google Scholar] [CrossRef] [PubMed]
  30. Ministry of Environmental Protection. Determination of Atmospheric Articles PM10 and PM2.5 in Ambient Air by Gravimetric Method. Available online: http://english.mep.gov.cn/standards_reports/standards/Air_Environment/air_method/201111/t20111101_219390.htm (accessed on 11 June 2016).
  31. Ministry of Environmental Protection. Specifications and Test Procedures for Ambient Air Quality Continuous Automated Monitoring System for PM10 and PM2.5. Available online: http://english.mep.gov.cn/standards_reports/standards/Air_Environment/air_method/201308/t20130816_257556.htm (accessed on 11 June 2016).
  32. Li, R.; Li, Z.; Gao, W.; Ding, W.; Xu, Q.; Song, X. Diurnal, seasonal, and spatial variation of PM2.5 in Beijing. Sci. Bull. 2015, 60, 387–395. [Google Scholar] [CrossRef]
  33. Zhang, Y.; Huang, W.; Cai, T.; Fang, D.; Wang, Y.; Song, J.; Hu, M.; Zhang, Y. Concentrations and chemical compositions of fine particles (PM2.5) during haze and non-haze days in Beijing. Atmos. Res. 2016, 174–175, 62–69. [Google Scholar] [CrossRef]
  34. Shen, R.; Schäfer, K.; Schnelle-Kreis, J.; Shao, L.; Norra, S.; Kramar, U.; Michalke, B.; Abbaszade, G.; Streibel, T.; Fricker, M.; et al. Characteristics and sources of PM in seasonal perspective—A case study from one year continuously sampling in Beijing. Atmos. Pollut. Res. 2016, 7, 235–248. [Google Scholar] [CrossRef]
  35. Bhaskar, V.V.; Safai, P.D.; Raju, M.P. Long term characterization of aerosol optical properties: Implications for radiative forcing over the desert region of Jodhpur, India. Atmos. Environ. 2015, 114, 66–74. [Google Scholar] [CrossRef]
  36. Kumar, S.; Dey, S.; Srivastava, A. Quantifying enhancement in aerosol radiative forcing during ‘extreme aerosol days’ in summer at Delhi national capital region, India. Sci Total. Environ. 2016, 550, 994–1000. [Google Scholar] [CrossRef] [PubMed]
  37. Noh, Y.M.; Lee, K.; Kim, K.; Shin, S.-K.; Müller, D. Influence of the vertical absorption profile of mixed Asian dust plumes on aerosol direct radiative forcing over East Asia. Atmos. Environ. 2016, 138, 191–204. [Google Scholar] [CrossRef]
  38. Wu, Y.; Zhu, J.; Che, H.; Xia, X.; Zhang, R. Column-integrated aerosol optical properties and direct radiative forcing based on sun photometer measurements at a semi-arid rural site in northeast China. Atmos. Res. 2015, 157, 56–65. [Google Scholar] [CrossRef]
  39. Alam, K.; Trautmann, T.; Blaschke, T.; Subhan, F. Changes in aerosol optical properties due to dust storms in the middle east and southwest Asia. Remote. Sens. Environ. 2014, 143, 216–227. [Google Scholar] [CrossRef]
  40. Alam, K.; Trautmann, T.; Blaschke, T. Aerosol optical properties and radiative forcing over mega-city Karachi. Atmos. Res. 2011, 101, 773–782. [Google Scholar] [CrossRef]
  41. Alam, K.; Trautmann, T.; Blaschke, T.; Majid, H. Aerosol optical and radiative properties during summer and winter seasons over Lahore and Karachi. Atmos. Environ. 2012, 50, 234–245. [Google Scholar] [CrossRef]
  42. Sheng, N.; Tang, U.W. The first official city ranking by air quality in china—A review and analysis. Cities 2016, 51, 139–149. [Google Scholar] [CrossRef]
  43. Ministry of Environmental Protection. Ambient Air Quality Standards 2012. Available online: https://www3.epa.gov/ttn/naaqs/criteria.html (accessed on 11 June 2016).
  44. Xia, X.; Chen, H.; Goloub, P.; Zhang, W.; Chatenet, B.; Wang, P. A compilation of aerosol optical properties and calculation of direct radiative forcing over an urban region in northern China. J. Geophys. Res. 2007, 112. [Google Scholar] [CrossRef]
Figure 1. The distribution of air quality monitoring stations and AERONET stations in Beijing.
Remotesensing 08 00510 g001
Figure 2. Daily variations of PM2.5 concentrations (µg/m3) for the two selected monitoring stations.
Remotesensing 08 00510 g002
Figure 3. Monthly average PM2.5 concentrations (µg/m3) for both selected monitoring stations.
Remotesensing 08 00510 g003
Figure 4. Numbers of polluted and heavily polluted days recorded at both monitoring stations. (a) West Park Official station; (b) Olympic Sports Center station.
Remotesensing 08 00510 g004
Figure 5. Aerosol radiative forcing at the bottom of the atmosphere (ARF-BOA) for both AERONET stations.
Remotesensing 08 00510 g005
Figure 6. Aerosol radiative forcing at the top of the atmosphere (ARF-TOA) for both AERONET stations.
Remotesensing 08 00510 g006
Figure 7. Aerosol radiative forcing efficiencies recorded at the bottom of the atmosphere for both AERONET stations.
Remotesensing 08 00510 g007
Figure 8. Aerosol radiative forcing efficiencies recorded at the top of the atmosphere for both AERONET stations.
Remotesensing 08 00510 g008
Figure 9. Aerosol radiative forcings at the bottom and top of the atmosphere under different air quality conditions.
Remotesensing 08 00510 g009
Figure 10. Aerosol radiative forcing efficiencies at the bottom and top of the atmosphere under different air quality conditions.
Remotesensing 08 00510 g010

