
An Assessment of HIRS Surface Air Temperature with USCRN Data

1
NOAA’s Cooperative Institute for Climate and Satellites, North Carolina (CICS-NC), NC State University, Asheville, NC 28801, USA
2
NOAA’s National Centers for Environmental Information (NCEI), Asheville, NC 28801, USA
*
Author to whom correspondence should be addressed.
Remote Sens. 2016, 8(6), 485; https://doi.org/10.3390/rs8060485
Submission received: 29 January 2016
/
Revised: 19 May 2016
/
Accepted: 27 May 2016
/
Published: 8 June 2016
(This article belongs to the Special Issue Satellite Climate Data Records and Applications)
Abstract
:The surface air temperature retrievals from the High Resolution Infrared Radiation Sounder (HIRS) are evaluated by using observations from the U.S. Climate Reference Network (USCRN) for the period of 2006 to 2013. One year of the USCRN data is also used as ground truth in calibrating retrieval biases. The final retrieval results show that mean biases of HIRS retrievals from comparisons to all surface stations for each year are mostly in the range of ±0.2 °C, and the root mean square difference (RMSD) values are 3.2–3.5 °C. Results for biases of individual stations are mostly within ±2 °C. In average, RMSDs are smaller over the eastern U.S. than over the western U.S., smaller at nighttime than at daytime, and smaller at lower elevations. The comparison patterns are consistent from year to year and for different satellites, showing the potential of HIRS data for long-term studies.
1. Introduction
The ability to monitor and assess the state of the global climate (i.e., climate assessment and adaptation) requires high quality measurements of surface air temperature (SAT) on all continents. The greatest temporal and spatial coverage of in situ SAT observations is available in densely populated areas of North America, Europe and Asia. Gaps in coverage, either due to the lack of observational networks or because data are not easily and quickly available, are common in less populated areas of these continents as well as large parts of Africa and South America [1]. The absence of data complicates climate monitoring and assessment and increases uncertainty in global and regional analyses. In the absence of in situ data, measurements of SAT from satellites can be used to augment in situ data and fill data gaps. This can be especially valuable in remote regions where surface stations are sparse. With areas having a non-uniform array of SAT observations, satellites can add to observations by adding data in between the observed network [2].
There have been a large number of studies using satellite measurements to derive SAT. For example, a dynamic multiple linear regression model including land surface temperature, vegetation fraction and other predictors with collocated station and geostationary satellite data was used to estimate values of bias and root mean square difference (RMSD) of SAT over Europe [3]. The results were from 2012–2013 and yielded a bias of 0.0 to 0.5 °C and a RMSD of 2.3 to 2.7 °C. Using Moderate Resolution Imaging Spectroradiometer (MODIS) data interpolated to 1 km globally, it was shown that RMSD with highly dense station data yielded a RMSD of ±2 °C, while areas of lower density station data yielded a RMSD of ±2 °C ± 4 °C for 2011 [4]. Another study estimated daily maximum and minimum temperatures over Portugal at 1 km using MODIS data at 1 km, yielding RMSDs of 1.83 °C and 1.74 °C, respectively, from 2000 to 2009 [5]. MODIS data were also used to derive SAT interpolated to 1 km over Oregon [6].
Several satellite instruments have the capability of retrieving temperatures with various lengths of observations such as the studies described above. For climate monitoring, a consistent long-term observation is required. Among satellite instruments the High Resolution Infrared Radiation Sounder (HIRS) is one of the sensors that has made the longest period of measurements, with the first dataflow started in 1978. Furthermore, inter-satellite calibration has been made available that adjusts differences from an individual satellite’s HIRS channel brightness temperatures to a reference satellite [7,8] to build a temporally homogeneous time series. The inter-calibrated data allow for studies of global temperatures including surface and air temperatures over the last several decades. For example, HIRS-derived land surface temperature has been combined with land surface model estimates to build a consistent dataset from 1979 to 2009 [9].
In this study, SAT at the reference height of 2 m derived from HIRS data are assessed and analyzed against the SAT observation at 1.5 m from the U.S. Climate Reference Network (USCRN). The HIRS dataset is part of a climate data record (CDR) product that is developed to provide long-term, large-scale global atmospheric background to aid other relevant climate data generation. The goal of this paper is two-fold: (1) to provide an in situ calibration to the retrieval; and (2) to evaluate the consistency of final retrieval results with station observations over the U.S.
The data sources are discussed and the retrieval calibration is described in Section 2. An assessment of HIRS compared to USCRN including bias and RMSD is analyzed in Section 3. The analysis details the difference of the retrieval results between day and night, followed by longitude, latitude, and elevation patterns of results. Conclusions are presented in Section 4.
2. Materials and Methods
2.1. Data
The HIRS instrument is carried onboard the National Oceanic and Atmospheric Administration (NOAA) polar orbiting satellite series. It is also deployed on the Meteorological Operational satellite program (Metop) series operated by the European Organisation for the Exploitation of Meteorological Satellites (EUMETSAT). The HIRS has 20 spectral channels, including 19 infrared channels and one visible channel. The footprint size of a HIRS pixel is approximately 20 km and 10 km at the nadir, respectively, for HIRS/2 and HIRS/3 series of the instruments. The footprint size increases for the pixels away from the nadir, and becomes more than twice of the nadir size at the sides of the scanlines. The effect of increasing viewing angles on channel brightness temperatures has been adjusted to nadir viewing by a multi-channel linear multivariate regression algorithm [10]. HIRS measurements have been inter-calibrated to a reference satellite [7,8,11], for which Metop-A is designated. HIRS observations provide a global coverage, twice a day, from a satellite. For the majority of the HIRS time series, there are two or more satellites in operation that provide four or more daily observations.
Because clouds in the view of an infrared sensor interfere with measurements of surface properties underneath clouds, HIRS pixels have been screened for cloud contamination with a two-tiered approach. HIRS pixels are first screened for clouds by a neighborhood difference method in both spatial and temporal dimensions [10]. This approach uses a simplified method based on the International Satellite Cloud Climatology Project process [12]. The pixels are then further screened with co-located Advanced Very High Resolution Radiometer (AVHRR) cloud products to flag the likelihood of cloud contamination. The cloud products are part of the AVHRR Pathfinder Atmospheres-Extended (PATMOS-x) CDR dataset acquired from National Oceanic and Atmospheric Administration (NOAA)’s National Centers for Environmental Information [13]. PATMOS-x generates mapped products with a spatial resolution of 0.1 degrees on a global latitude-longitude grid. HIRS pixels that are associated with high cloud probability in the PATMOS-x cloud products are removed from retrieval. The cloud screening procedure has been done before data are processed for retrieval.
Satellite measurements of SAT are derived from remotely observed radiances and as such require assessment of the retrievals against high quality in situ observations. A gold standard for climate-observing networks was established by NOAA’s USCRN. This network of 114 stations in the contiguous U.S. and more than 20 in Alaska and Hawaii provide climate quality records of SAT, precipitation, and soil moisture for climate monitoring (Figure 1). The USCRN [14] provides homogenous SAT, precipitation, and soil moisture measurements to traceable standards using triplicate instrument configurations for reducing uncertainty in the analysis of climate variability and change on a national scale. Measurements of SAT, wind speed at 1.5 m, relative humidity, and solar radiation are also made. The network also provides an observing standard by which other U.S. monitoring stations can be compared.
Another goal of USCRN is to provide data for satellite calibration and validation [14]. USCRN has been compared to Automated Surface Observing System (ASOS) SAT measurements [15] and SAT and precipitation data from the U.S. Cooperative Observers Network [1,16]. USCRN data have also been used for validation of insolation derived from Geostationary Operational Environmental Satellite (GOES) satellite data [17].
In the present study, SAT from NOAA-17 (N17) and from Metop-A (M02) that overlap the USCRN years 2006–2013 are examined. The USCRN hourly SAT data [14,18] is the base dataset for HIRS to be assessed against. This observational dataset is of very high quality and sufficient temporal scale for collocation of HIRS satellite SAT data. For the analysis of annual means, only HIRS data with a full year of observations are used (except for 2007 in order to include the M02 operational data which began in the latter half of the year). There is a varying number of stations through the years. To keep the analysis consistent, only stations that span through the entire length of 2006–2013 are used, totaling 82 stations.
The analysis is based on in situ observations that are coincident with satellite over pass time and near-HIRS pixel observation. HIRS observations within the distance of 25 km from a USCRN station and in the hour of the USCRN measurement are chosen for the comparison analysis This gives ~200 to ~300 collocated measurements for a year at a station. A study on the sensitivity of co-location radius between HIRS and surface observations showed that having a spatial radius of 30 km does not adversely affect comparison statistics [19]. The spatial radius is decreased to 25 km in this study to further reduce inhomogeneity between the two data sources. Most of the years of the N17 and M02 HIRS data include a full set of days per year. There are some years missing one or several days, which do not pose significant impact to the results. Two notable exceptions are 2007 in which M02 time series started in the middle of the year, and 2008 in which there are 310 days available for M02 due to HIRS sensor problems in part of the year.
2.2. Retrieval Algorithm
For SAT retrievals, measurements from the atmospheric window channel, channel 8, as well as two other channels that are sensitive to the near-surface temperature and humidity, channels 7 and 10, are used. The wavelengths of HIRS channels 7, 8, and 10 are 13.4, 11.1, and 12.5 µm, respectively. These channels are sensitive to a layer of atmosphere near the surface [8]. The window channel (channel 8) measures temperature at the surface, while weighting function peaks of channels 7 and 10 are near 900 hPa [20]. Surface emissivity, which is a function of surface types, is also incorporated in the derivation of clear-sky SAT along with temperature and humidity at other levels [8]. The retrieval scheme employed a radiative transfer model to compute HIRS channel radiances based on a diverse sample of atmospheric temperature and humidity from European Center for Medium range Weather Forecasting (ECMWF) that span the full range of temperature and humidity [21,22]. A neural network technique was then used to connect the non-linear relationship between SAT and HIRS channel radiances in the retrieval process.
There are a total of 6891 clear-sky profiles in the sample dataset which include SAT and humidity data at the reference height of 2 m and at atmospheric levels above. The data are randomly divided into three groups at 60%, 20% and 20%. The 60% group is used as the training dataset for the retrieval of SAT. One of the 20% group is used during iterations of neural network development. The remaining 20% group is used in evaluating retrieval performance. In this study, a three-layer back-propagation neural network, with one input layer, one hidden layer, and one output layer, is constructed for the retrieval of SAT.
Remotely sensed and retrieved surface measurements require in situ calibration to reduce retrieval biases. Retrieval biases can be a combination effect from several factors including the variation in sensor sensitivity, radiative transfer model bias, and bias in the retrieval scheme. High quality USCRN observations are a good candidate to build a calibration database as a final step in the retrieval algorithm. Our examinations showed that the biases of SAT retrievals are linearly correlated with the USCRN-observed SATs for a large range of SATs. In selecting a calibration database, scatter plots of M02 retrieval biases with respect to USCRN observations for each year were analyzed with linear regression. There are small variations of regression coefficients from year to year. We choose the year that has the medium regression slope (year 2011) to represent the mean condition of the datasets. Different linear patterns are observed for temperatures above and below −15 °C, therefore two linear regression equations are derived separately. The linear regression equations are 0.11*x − 1.28 and −0.12*x − 4.57, respectively, where x is the HIRS co-located SAT (Figure 2). The 2011 regression coefficient is derived as a calibration to the HIRS retrieval time series including other years of M02 and inter-satellite calibrated HIRS data of other satellites.
3. Results
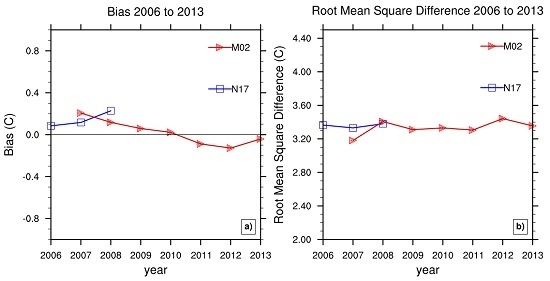
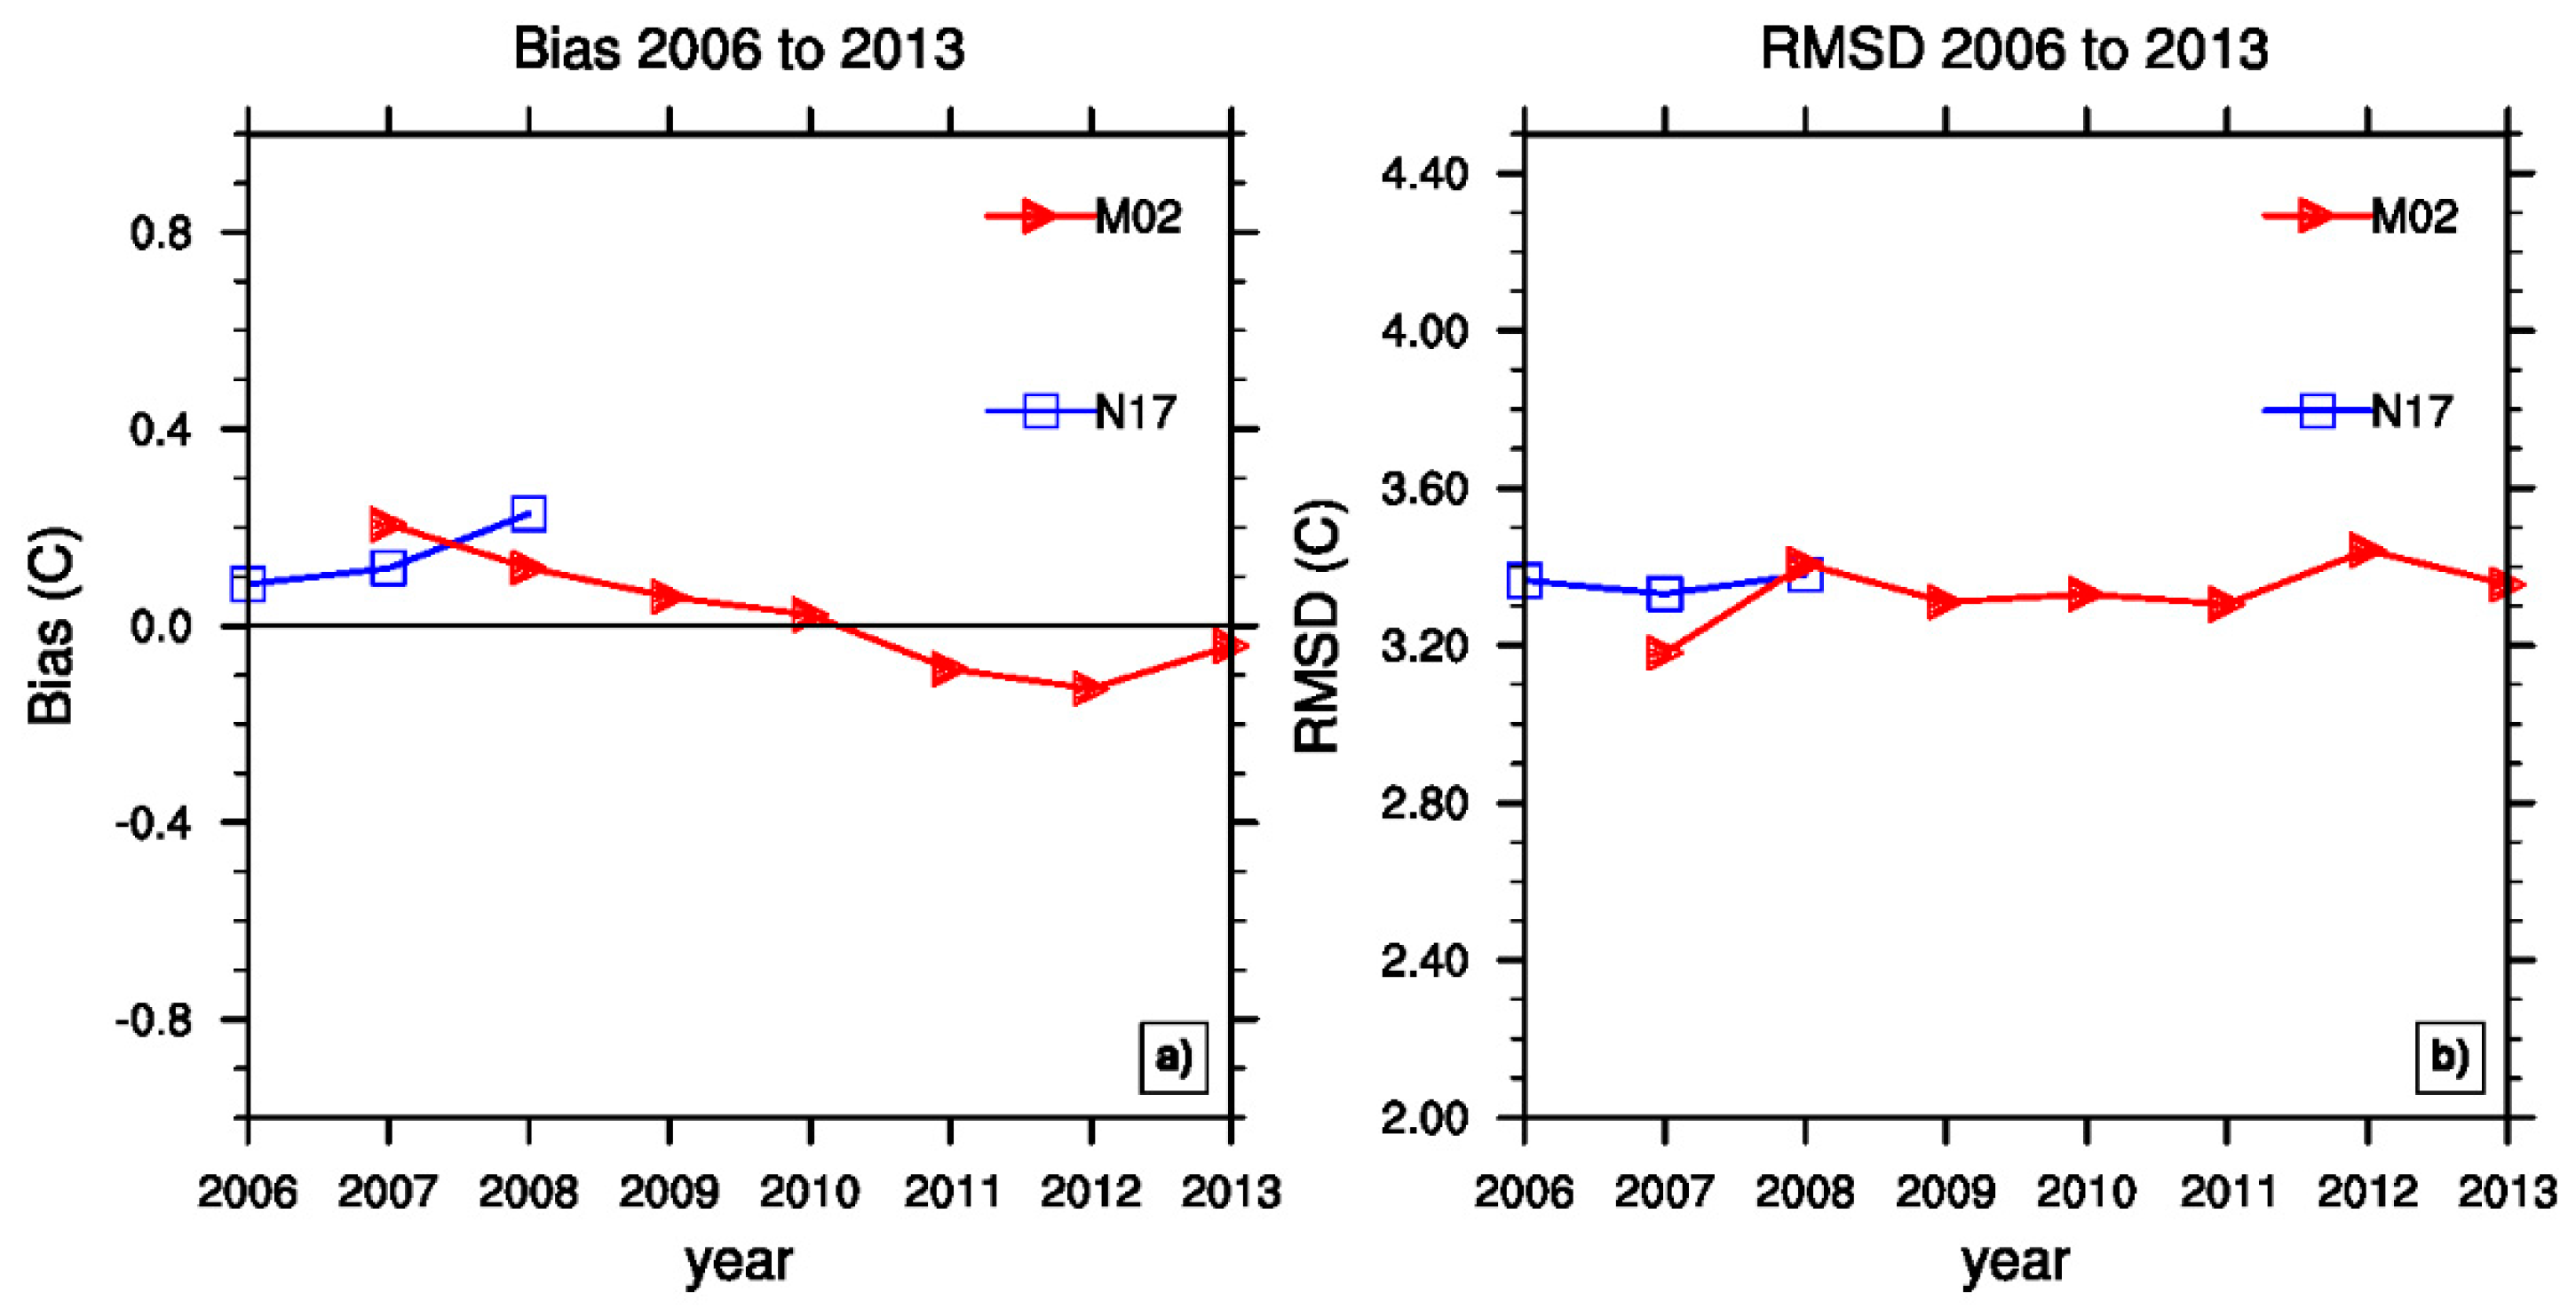
The calibration scheme discussed above is applied to HIRS retrievals of SAT. Examinations are carried out to evaluate if the calibration based on 2011 M02 data can be applied to other years and satellites. The goal of the dataset development is to achieve a mean consistency between HIRS retrievals and in situ observations for climate applications. The large number of USCRN stations provides a high quality database to examine the consistency over the U.S. Figure 3a,b show the yearly average of bias (defined as HIRS minus USCRN SAT) and RMSD to assess the results for all co-located HIRS (after calibration discussed above is applied) and USCRN station data. In this study observations from USCRN are treated as “ground truth” data. However, in situ measurements are not absolutely free from errors, and therefore the term RMSD is used in the analysis instead of the root mean square error that is frequently seen in the literature. The results for 2011 are included in the time series for comparison. Data from other years are not used in the development of the calibration scheme and serve for evaluation of the final retrieval performance. The availability of N17 data is confined to the years (2006–2008) when both HIRS and AVHRR data were available, as required by the cloud-clearing process. Operational M02 data started in the latter half of 2007. Figure 3 shows that the mean biases are in the range of ±0.2 °C, and the RMSDs are consistently around 3.3 °C through the years. Both biases and RMSDs of non-2011 years are reasonably close to those of 2011, indicating that the regression coefficients derived from 2011 match-ups work consistently well for other years and other inter-satellite calibrated satellites.
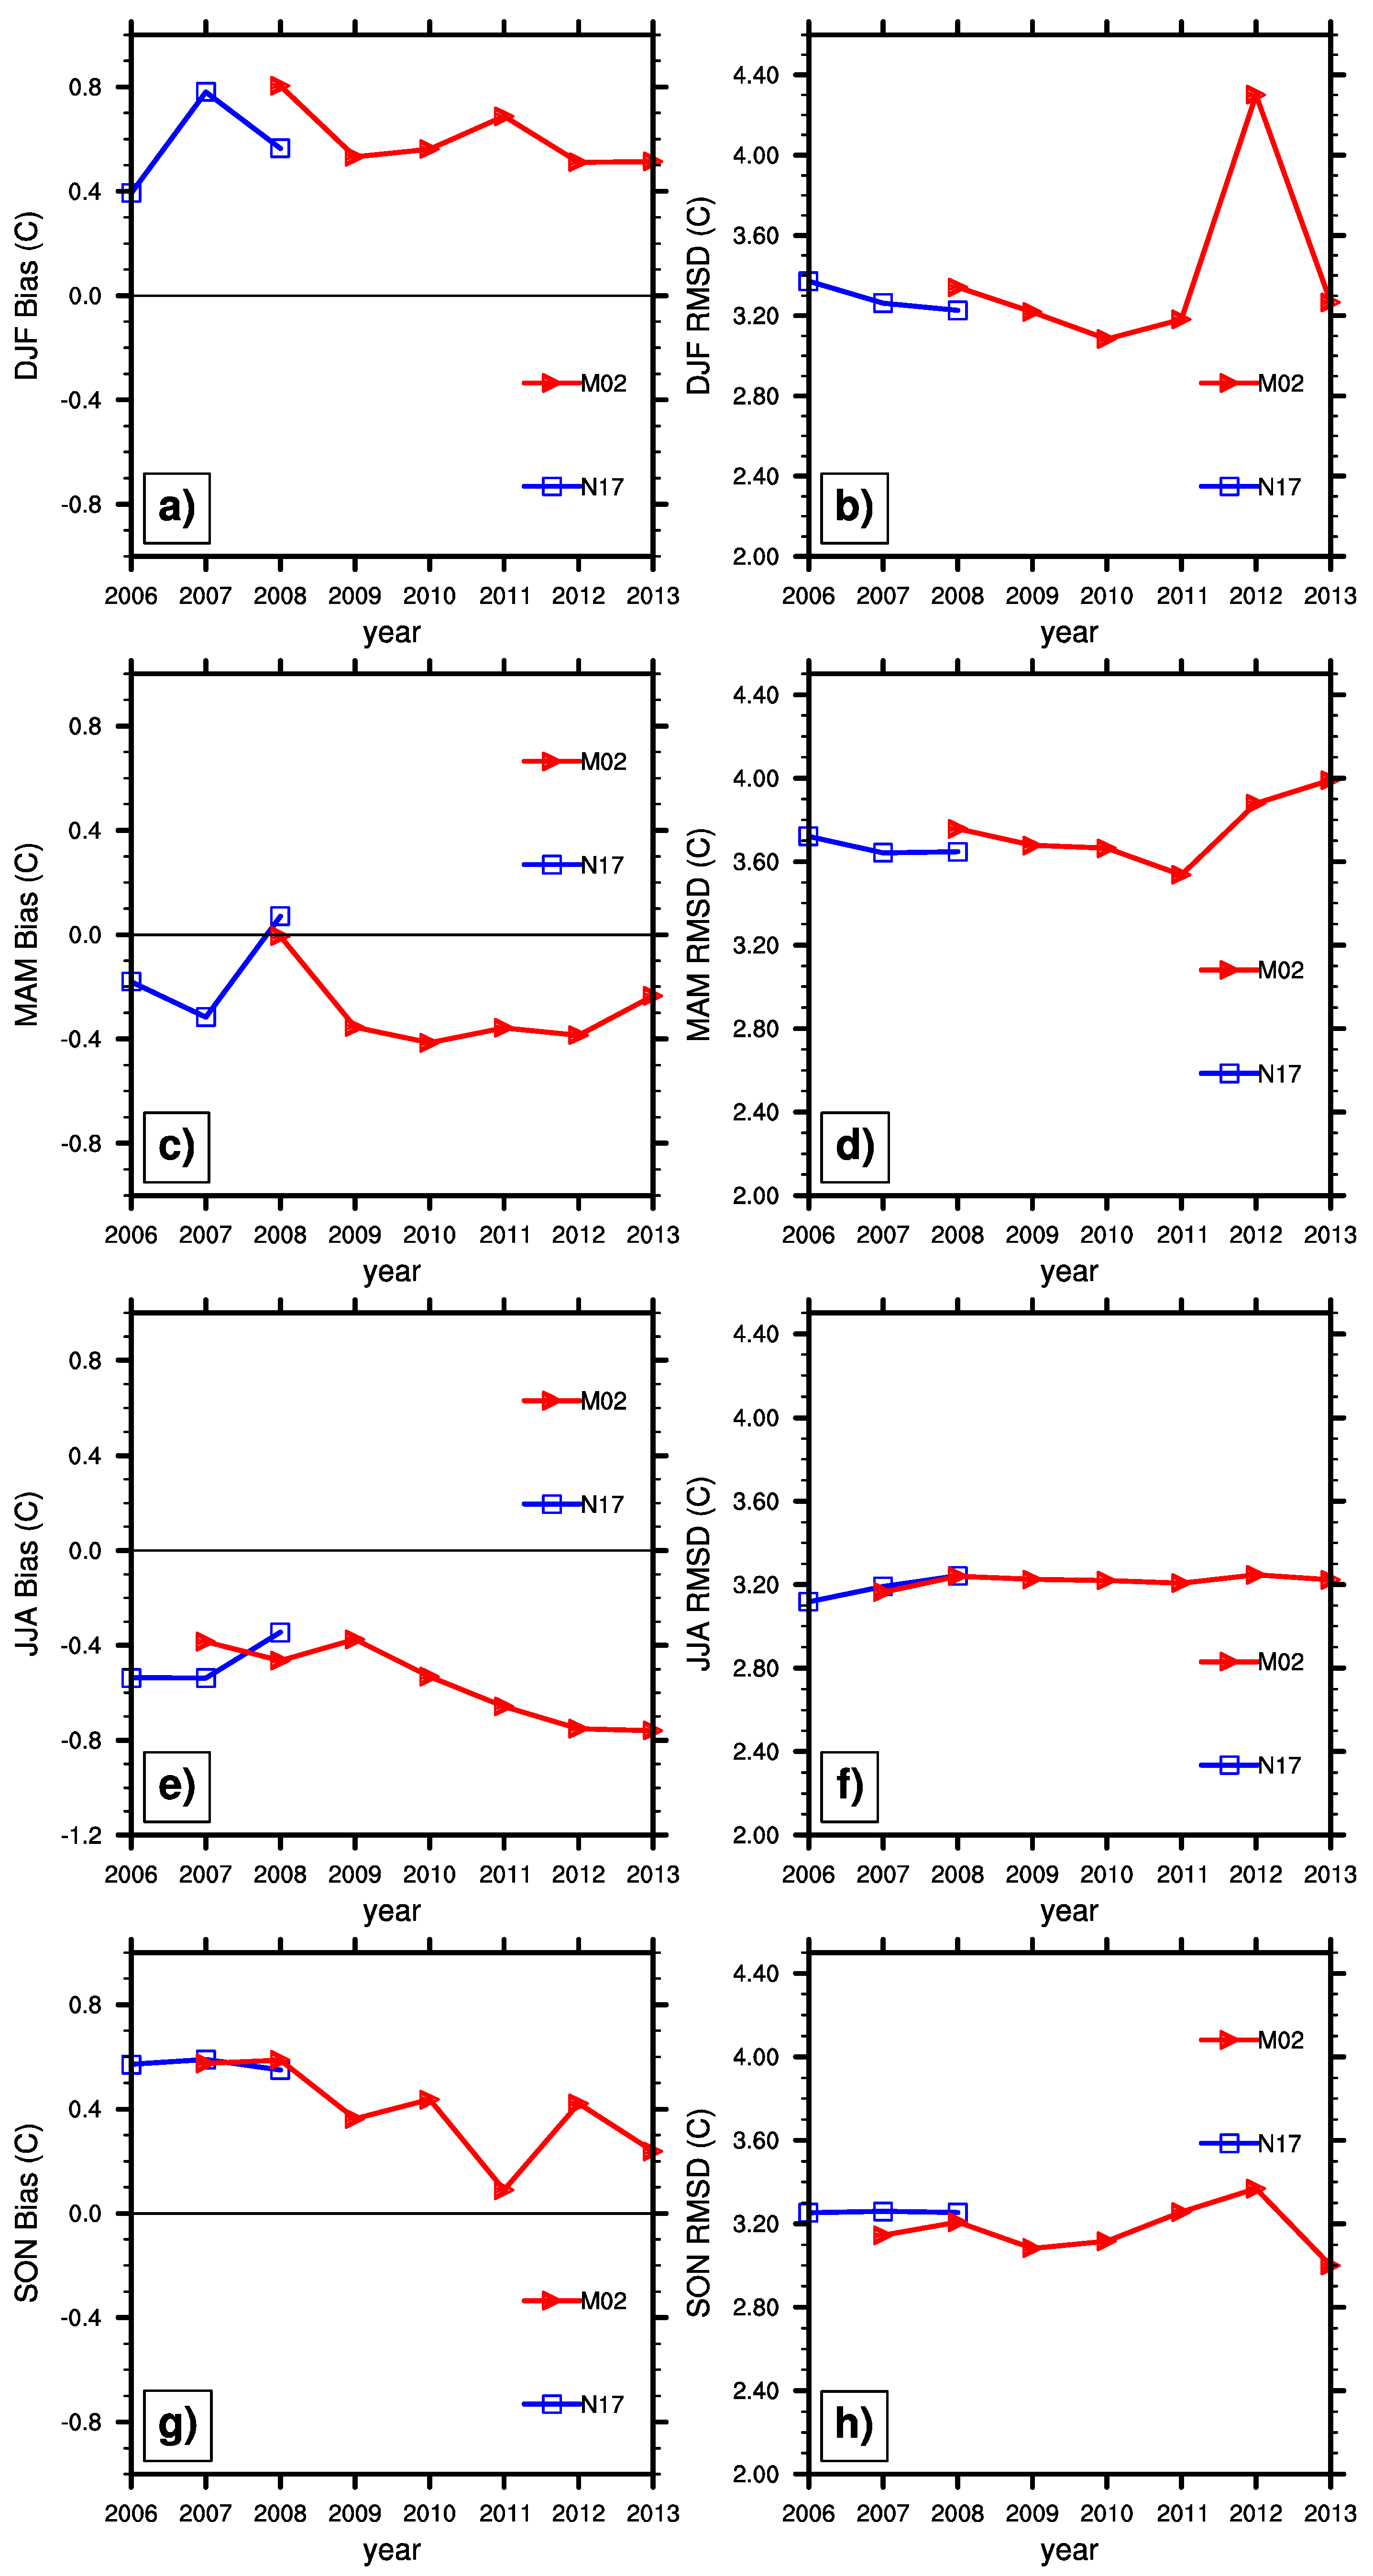
Figure 4 breaks the annual analysis into four seasons: winter (DJF), spring (MAM), summer (JJA), and fall (SON). The RMSDs for summer and fall are relatively small, around 3.2 °C. The RMSDs are generally larger for winter and spring, associated with more frequent changes in weather systems during the two seasons. There is a jump of RMSD in winter 2012. Examination of data shows that there are a few outliers of unusually high HIRS temperatures in winter 2012, likely due to occasional HIRS sensor problems, and the RMSD is pushed up by these large departures of HIRS temperatures. There is a seasonal variation in mean bias. The winter and fall seasons show a warm bias for each satellite and for each year. The spring and summer months both show negative biases for both satellites for the 2006–2013 time period. The seasonal biases may be a result of possible non-linearity that is not captured by the linear regression in the calibration process.
To further assess the HIRS SAT data, it is helpful to break down the assessment to daytime and nighttime SATs. For the simplicity of qualitative analysis, two blocks of 12 h, 0 to 12UTC and 12 to 24UTC, are used to approximate nighttime and daytime over the U.S. Figure 5 displays results of the daytime and nighttime biases and the RMSDs. Figure 5a shows that the nighttime biases of HIRS SAT are negative at −0.5 °C to −1.0 °C for both N17 and M02. The daytime bias is positive at 1.8 °C to 2.0 °C. Figure 5b shows that the N17 and M02 nighttime RMSDs are reasonably consistent for 2006–2013 at around 3.0 °C. The daytime RMSDs for the N17 and M02 are higher than the nighttime RMSDs with values between ~3.6 °C to 4.0 °C from 2006 to 2013. Nighttime observations, in general, provide a more uniform comparison database. During daytime, the uneven heating surrounding the station can further complicate the match-up of a field-of-view measurement from HIRS and a point measurement from a surface station, and these factors may contribute to larger RMSDs.
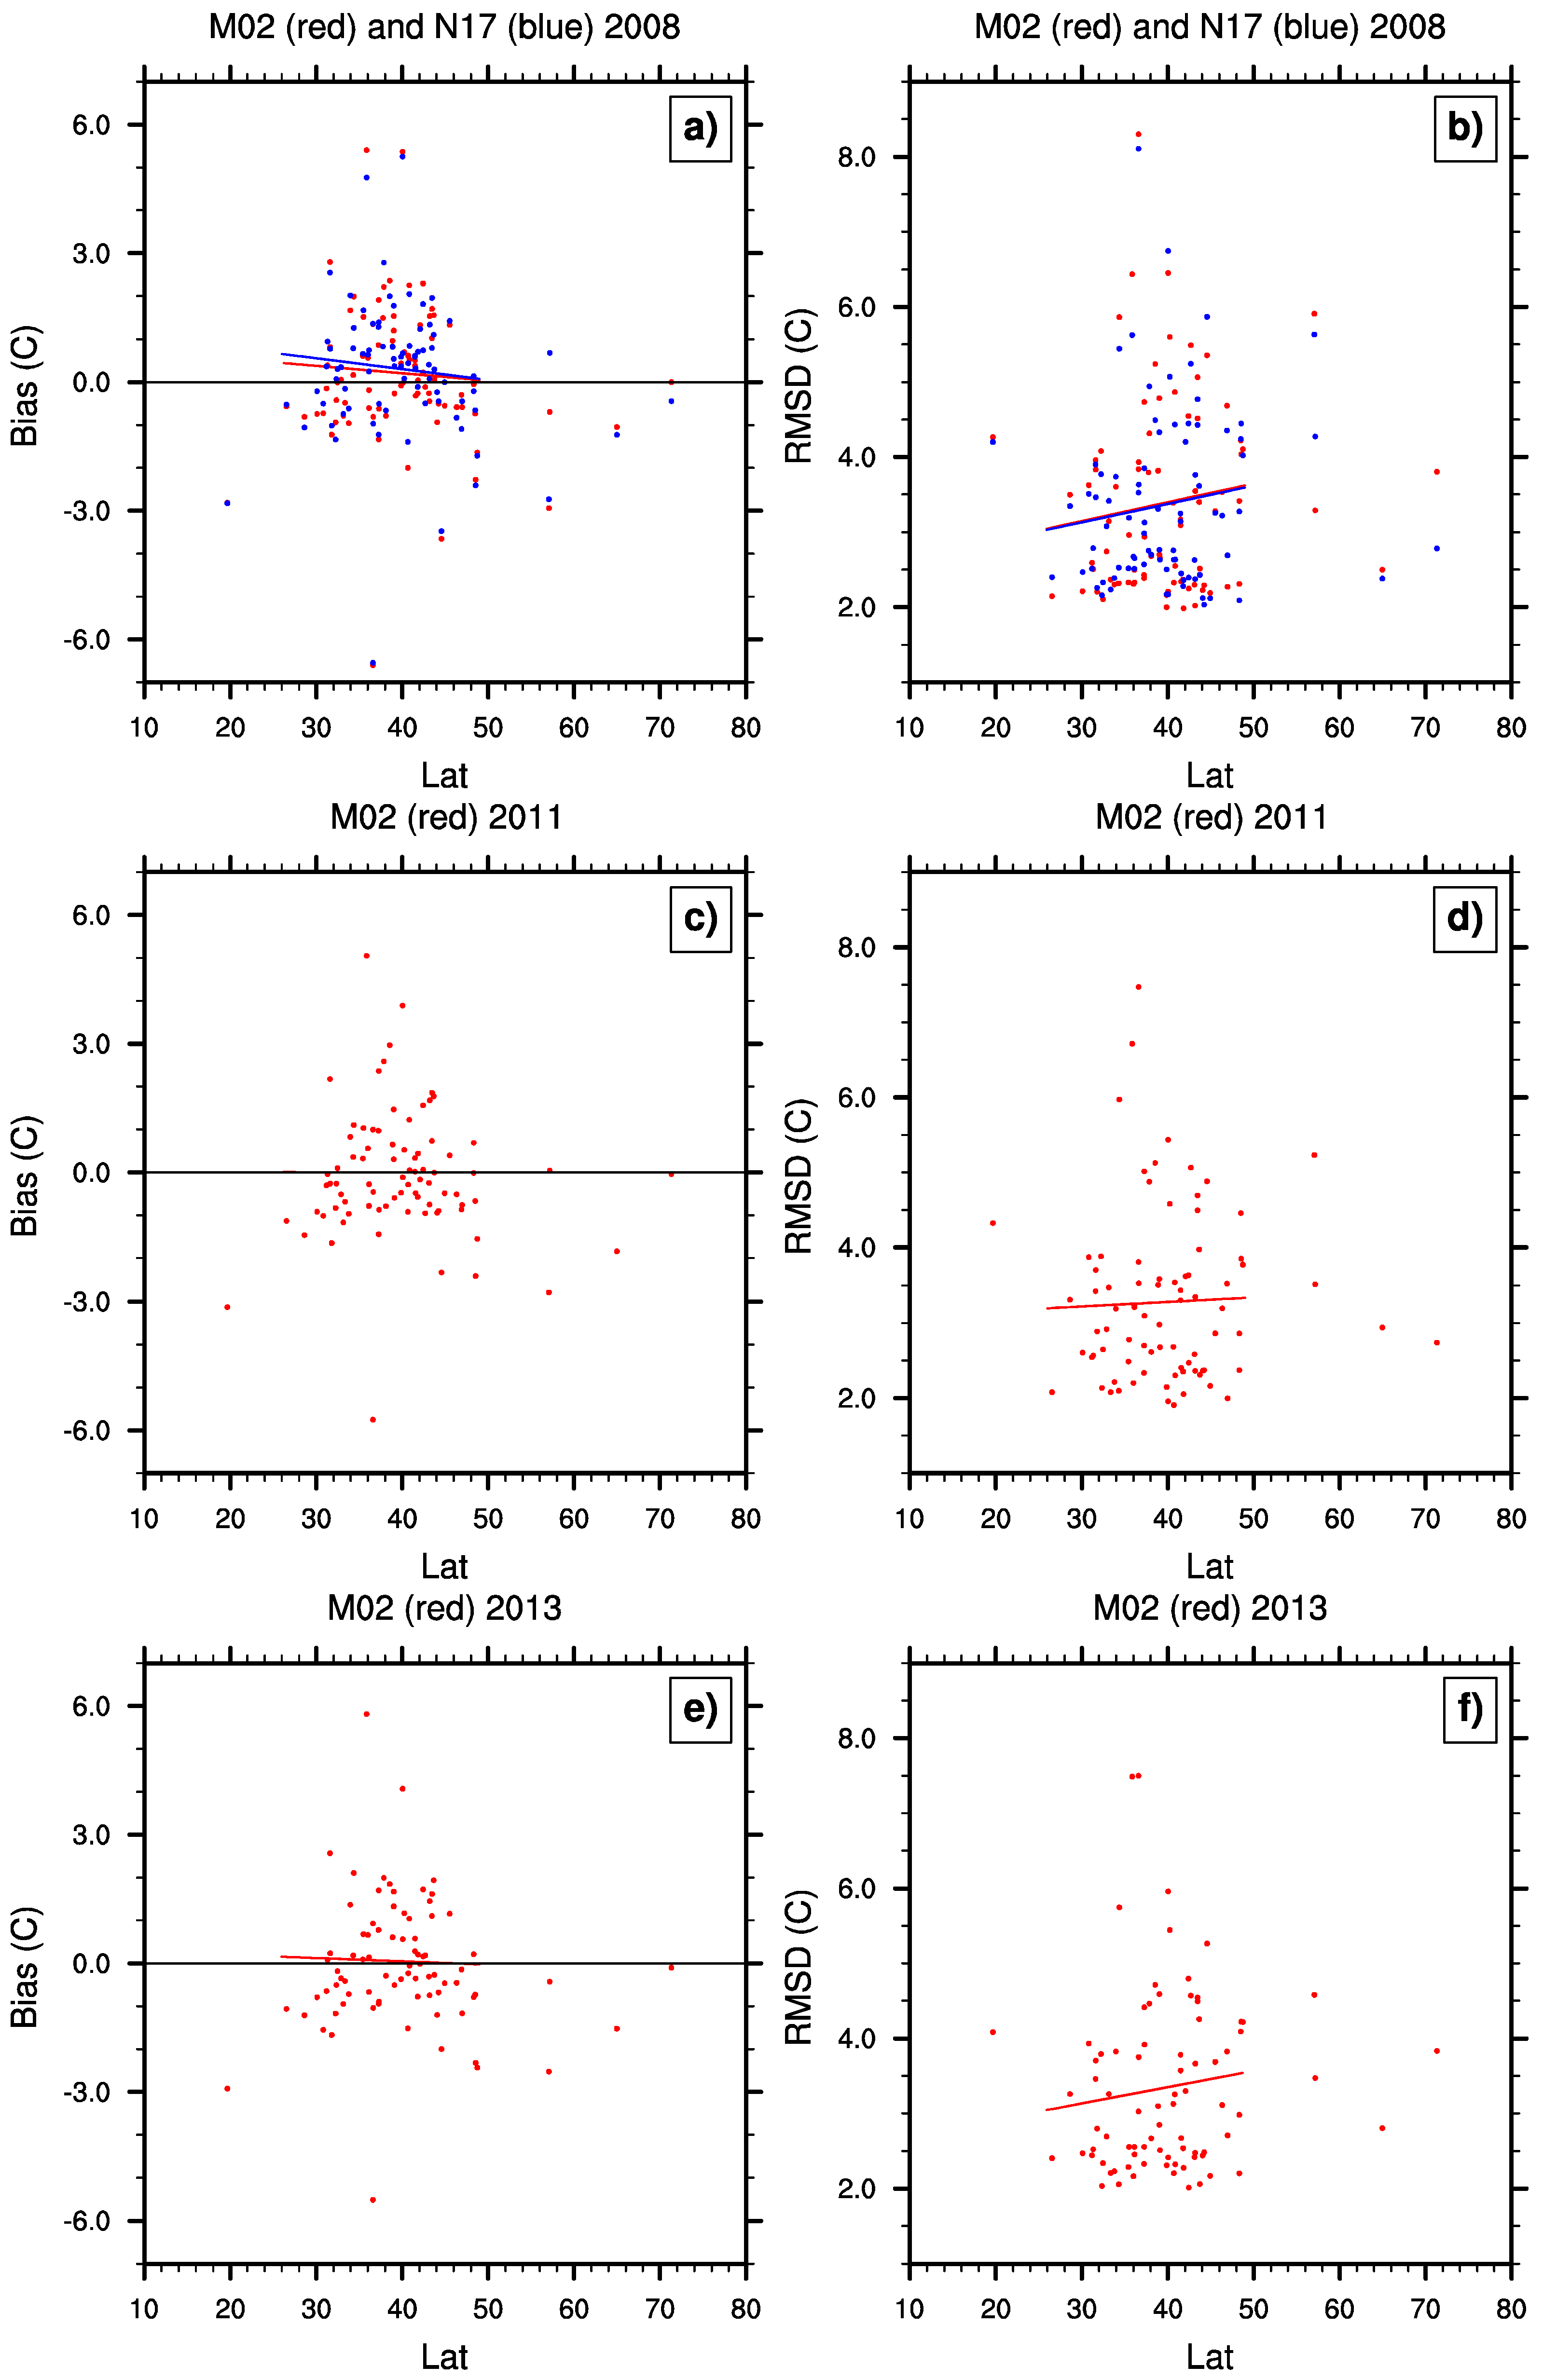
To examine the error patterns of the retrievals across the United States, Figure 6 and Figure 7 show the annual bias and RMSD vs. longitude and latitude, respectively, at each station. As patterns are similar from year to year, only three years (2008, 2011, and 2013) are displayed. Results show that the biases of individual stations are within about ±6 °C for all years, with most of them within ±2.5 °C. Each year shows a similar pattern with overall lower RMSD east of −90° E and higher RMSD west of −90° E, except stations along the west coast line. On average, the mean RMSD values are about 2.5 °C with a mean bias of −0.5 °C in the east and about 4 °C with a mean bias of 1.5 °C in the west.
This difference in RMSD is likely a result of the difference in topography and land surface types between the eastern and the western U.S. The eastern U.S. is much more homogenous in both topography and land surface types than the western U.S. In the western U.S. the topography is much more complex and heterogeneous, and there are a wider variety of land surface types, such as deserts, grasslands, and forests. The topography in the western U.S. is higher in elevation than much of the eastern U.S. In a study of the Atmospheric Infrared Sounder (AIRS) SAT retrievals, it was also found that RMSDs vary with topography and different land surface types [23]. Their results show higher RMSD (3.4 to 6.3 K for July 2004, 2.31 to 5.09 K for January 2005) over areas with different surface types and increasing topography. A study in the Red River-Arkansas River basin also reported the RMSD of Television Infrared Observation Satellite Program (TIROS) Operational Vertical Sounder (TOVS) and AVHRR SAT retrievals to range overall from 3.5 to 5.3 °C for May to July 1987 [24]. The large diurnal variation of SAT over the western U.S. can also contribute to higher values of RMSD. Figure 6 shows that the lowest RMSD values are found over coastal stations where diurnal variations of SAT are relatively small.
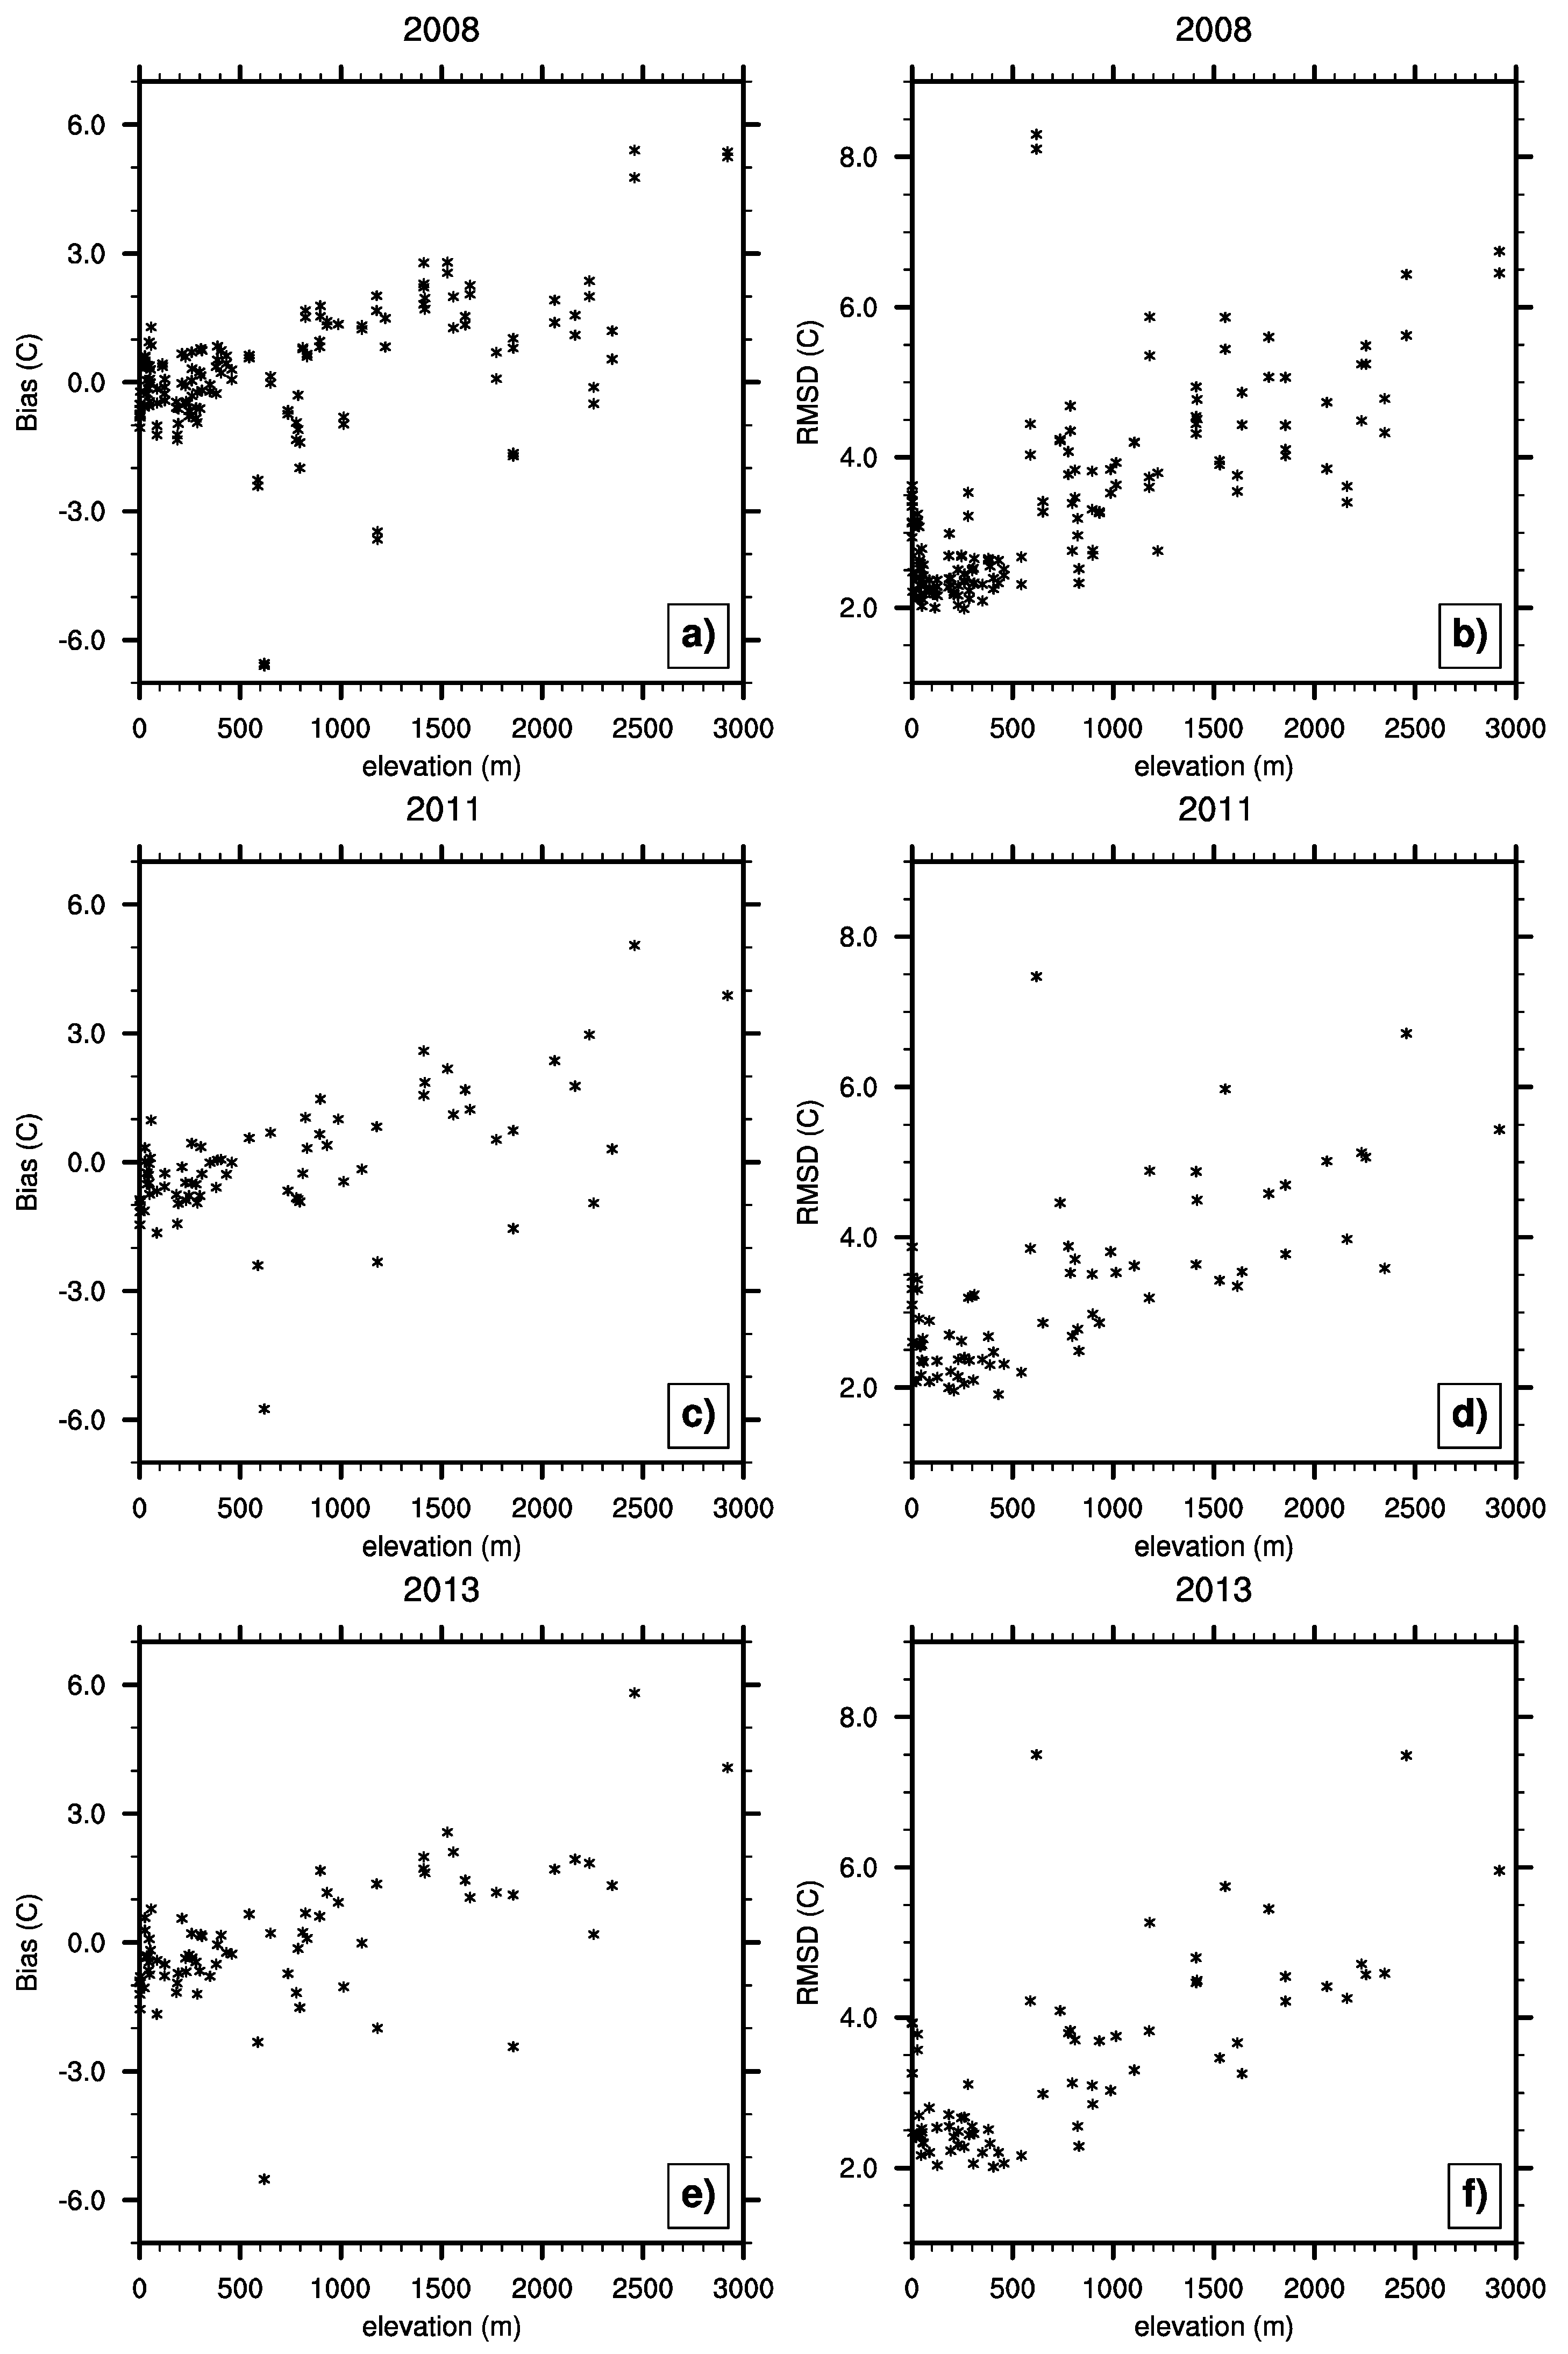
To further investigate HIRS retrieval errors, Figure 8 shows bias and RMSD vs. elevation over the contiguous U.S. for 2008, 2011, and 2013. Larger bias and RMSD values are observed at higher elevations. Many of these larger values are from the mountainous region in the western U.S. between 30° N and 40° N as shown in Figure 7. A couple of those with unusually large bias and RMSD values are over stations at the mountain peaks with nearby steep slopes. The point measurements at the stations can be much colder than the areal measurements from HIRS pixels that include temperatures in the nearby lower elevations and changing surface types. Figure 8 shows that smallest RMSDs are clustered over low elevation areas where surface topography is smooth.
4. Conclusions
With more than 37 years of observation, HIRS has the potential of providing long-term studies of large-scale global SAT and filling data gaps of remote areas. However, before the measurement can be used, the SAT retrievals need to be calibrated with ground truth and the retrieval uncertainty is assessed. This study provides a detailed assessment of the SAT of HIRS using co-located SAT of the USCRN network. A bias calibration scheme is developed by using a linear regression approach based on one full year of co-located M02 data. The derived coefficients are applied to the inter-satellite calibrated data of other years and other satellites. For the majority of the retrievals co-located with individual stations, bias values are within ±2 °C. On average, RMSDs are smaller over the eastern U.S. than over the western U.S., smaller at nighttime than at daytime, and smaller at lower elevations. Overall, on an annual average, the mean biases are ±0.2 °C and mean RMSDs are 3.2–3.5 °C through the years examined.
The intended use of the HIRS retrievals is to provide a long-term, large-scale background to aid other climate dataset development. The results show that the U.S. mean HIRS SATs are generally in agreement with the USCRN SATs. However, the analyses also indicate variation of biases in different seasons, between daytime and nighttime, and along elevation. Quantification of these patterns lays a baseline for future improvement.
USCRN station observations are used to derive retrieval calibrations. The HIRS retrieval results are shown generally consistent with in situ observations. The study over the U.S. provides valuable information and guidance for the future work of extending the investigation to the global scale and to the full length of HIRS records.
Acknowledgments
The Authors would like to thank Jessica Matthews for processing the HIRS data, Rocky Bilotta for producing Figure 1, Huai-min Zhang for helpful discussions, and Jay Lawrimore and three anonymous reviewers for constructive comments. This work was supported by NOAA through the Cooperative Institute for Climate and Satellites—North Carolina under Cooperative Agreement NA14NES432003.
Author Contributions
Steve T. Stegall and Lei Shi conceived and designed the methods and analyses. Steve T. Stegall ran the programs to generate the figures. Both Steve T. Stegall and Lei Shi analyzed the data and wrote the manuscript.
Conflicts of Interest
The authors declare no conflict of interest. The funding sponsors had no role in the design of the study, in the collection, analyses, or interpretation of data, in the writing of the manuscript, and in the decision to publish the results.
Abbreviations
The following abbreviations are used in this manuscript:
| HIRS | High Resolution Infrared Radiation Sounder |
| USCRN | U.S. Climate Reference Network |
| RCRN | Regional Climate Reference Network |
| RMSD | root mean square difference |
| SAT | surface air temperature |
| CDR | climate data record |
| NOAA | National Oceanic and Atmospheric Administration |
| Metop | Meteorological Operational satellite program |
| EUMETSAT | European Organisation for the Exploitation of Meteorological Satellites |
| AVHRR | Advanced Very High Resolution Radiometer |
| PATMOS-x | Pathfinder Atmospheres-Extended |
| N17 | NOAA-17 |
| M02 | Metop-A |
| UTC | Coordinated Universal Time |
| AIRS | Atmospheric Infrared Sounder |
| TOVS | TIROS Operational Vertical Sounder |
| TIROS | Television Infrared Observation Satellite |
References
- Rennie, J.J.; Lawrimore, J.H.; Gleason, B.E.; Thorne, P.W.; Morice, C.P.; Menne, M.J.; Williams, C.N.; De Almeida, W.G.; Christy, J.R.; Flannery, M.; et al. The International Surface Temperature Initiative Global Land Surface Databank: Monthly Temperature Data Release Description and Methods. Geosci. Data J. 2014, 1, 75–102. [Google Scholar] [CrossRef]
- Liu, Y.; Key, J.R.; Schweiger, A.; Francis, J. Characteristics of Satellite-Derived Clear-Sky Atmospheric Temperature Inversion Strength in the Arctic 1980–1996. J. Clim. 2006, 19, 4902–4913. [Google Scholar] [CrossRef]
- Good, E. Daily Minimum and Maximum Surface Air Temperatures from Geostationary Satellite Data. J. Geophys. Res. Atmos. 2015, 120, 2306–2324. [Google Scholar] [CrossRef]
- Kilibarda, M.; Hengl, T.; Heuvelink, G.B.M.; Gräler, B.; Pebesma, E.; Tadić, M.P.; Bajat, B. Spatio-Temporal Interpolation of Daily Temperatures for Global Land Ares at 1 km Resolution. J. Geophys. Res. Atmos. 2014, 119, 2294–2313. [Google Scholar] [CrossRef]
- Benali, A.; Carvalho, A.C.; Nunes, J.P.; Carvalhais, N.; Santos, A. Estimating Air Surface Temperature in Portugal using MODIS LST Data. Remote Sens. Environ. 2012, 124, 108–121. [Google Scholar] [CrossRef]
- Parmentier, B.; McGill, B.J.; Wilson, A.M.; Regetz, J.; Jetz, W.; Guralnick, R.; Tuanmu, M.-N.; Schildhauer, M. Using Multi-Timescale Methods and Satellite-Derived Land Surface Temperature for the Interpolation of Daily Maximum Air Temperature in Oregon. Int. J. Climatol. 2015, 35, 3862–3878. [Google Scholar] [CrossRef]
- Shi, L.; Bates, J.J.; Cao, C. Scene Radiance—Dependent Intersatellite Biases of HIRS Longwave Channels. J. Atmos. Ocean. Technol. 2008, 25, 2219–2229. [Google Scholar] [CrossRef]
- Shi, L.; Matthews, J.; Ho, S.-P.; Yang, Q.; Bates, J. Algorithm development of temperature and humidity profile retrievals for long-term HIRS observations. Remote Sens. Basel 2016, 8, 280. [Google Scholar] [CrossRef]
- Coccia, G.; Siemann, A.L.; Pan, M.; Wood, E.F. Creating consistent datasets by combining remotely-sensed data and land surface model estimates through Bayesian uncertainty post-processing: The case of Land Surface Temperature from HIRS. Remote Sens. Environ. 2015, 170, 290–305. [Google Scholar] [CrossRef]
- Jackson, D.L.; Wylie, D.P.; Bates, J.J. The HIRS pathfinder radiance data set (1979–2001). In Proceedings of the 12th Conference on Satellite Meteorology and Oceanography, American Meteorological Society, Long Beach, CA, USA, 10–13 February 2003.
- Shi, L. Intersatellite differences of HIRS longwave channels between noaa-14 and noaa-15 and between noaa-17 and metop-a. IEEE Trans. Geosci. Remote Sens. 2013, 51, 1414–1424. [Google Scholar] [CrossRef]
- Rossow, W.B.; Garder, L.C. Cloud detection using satellite measurements of infrared and visible radiances for ISCCP. J. Clim. 1993, 6, 2341–2369. [Google Scholar] [CrossRef]
- Heidinger, A.K.; Foster, M.J.; Walther, A.; Zhao, X. The Pathfinder Atmospheres Extended (PATMOS-x) AVHRR Climate Data Set. Bull. Amer. Meteor. Soc. 2013. [Google Scholar] [CrossRef]
- Diamond, H.J.; Karl, T.R.; Palecki, M.A.; Baker, C.B.; Bell, J.E.; Leeper, R.D.; Easterling, D.R.; Lawrimoer, J.H.; Meyers, T.P.; Helfert, M.R.; et al. U.S. Climate Reference Network after One Decade of Operations, Status and Assessment. Bull. Am. Meteor. Soc. 2013, 94, 485–498. [Google Scholar] [CrossRef]
- Sun, B.; Baker, C.B.; Karl, T.R.; Gifford, M.D. A Comparative Study of ASOS and USCRN Temperature Measurements. J. Atmos. Ocean. Technol. 2005, 22, 679–686. [Google Scholar] [CrossRef]
- Hubbard, K.G.; Lin, X.; Baker, C.B.; Sun, B. Air Temperature Comparison between the MMTS and the USCRN Temperature Systems. J. Atmos. Ocean. Technol. 2004, 21, 1590–1597. [Google Scholar] [CrossRef]
- Otkin, J.A.; Anderson, M.C.; Mecikalski, J.R.; Diak, G.R. Validation of GOES-Based Insolation Estimates using Data from the U.S. Climate Reference Network. J. Hydrometeor. 2005, 6, 460–475. [Google Scholar] [CrossRef]
- Bell, J.E.; Palecki, M.A.; Baker, C.B.; Collins, W.G.; Lawrimore, J.H.; Leeper, T.D.; Hall, M.E.; Kochendorger, J.; Meyers, T.P.; Wilson, T.; et al. U.S. Climate Reference Network Soil Moisture and Temperature Observations. J. Hydrometeorol. 2013, 14, 977–988. [Google Scholar] [CrossRef]
- Peng, G.; Shi, L.; Stegall, S.T.; Matthwes, J.L.; Fairall, C.W. An evaluation of HIRS near-surface air temperature product in the arctic with sheba data. J. Atmos. Ocean. Technol. 2016. [Google Scholar] [CrossRef]
- Jackson, D.L.; Soden, B.J. Detection and correction of diurnal sampling bias in HIRS/2 brightness temperatures. J. Atmos. Ocean. Technol. 2007, 24, 1425–1438. [Google Scholar] [CrossRef]
- Saunders, R.; Matricardi, M.; Brunel, P. An improved fast radiative transfer model for assimilation of satellite radiance observations. Q. J. R. Meteorol. Soc. 1999, 125, 1407–1425. [Google Scholar] [CrossRef]
- Chevallier, F. Sampled Databases of 60-Level Atmospheric Profiles from the ECMWF Analyses; Research Report No. 4; EUMETSAT/ECMWF SAF Programme 2001. Available online: http://nwpsaf.eu/downloads/profiles/profiles_60L.pdf (accessed on 1 June 2016).
- Gao, W.; Zhao, F.; Xu, Y.; Feng, X. Validation of the Surface Air Temperature Products Retrieved from the Atmospheric Infrared Sounder over China. IEEE Trans. Geosci. Remote Sens. 2008, 46, 1783–1789. [Google Scholar]
- Lakshmi, V.; Czajkowski, K.; Dubayah, R.; Susskind, J. Land Surface Air Temperature Mapping Using TOVS and AVHRR. Int. J. Remote Sens. 2001, 22, 643–662. [Google Scholar] [CrossRef]
Figure 1.
The 2013 locations of stations. Blue circles represent locations of the U.S. Climate Reference Network (USCRN).
Figure 1.
The 2013 locations of stations. Blue circles represent locations of the U.S. Climate Reference Network (USCRN).
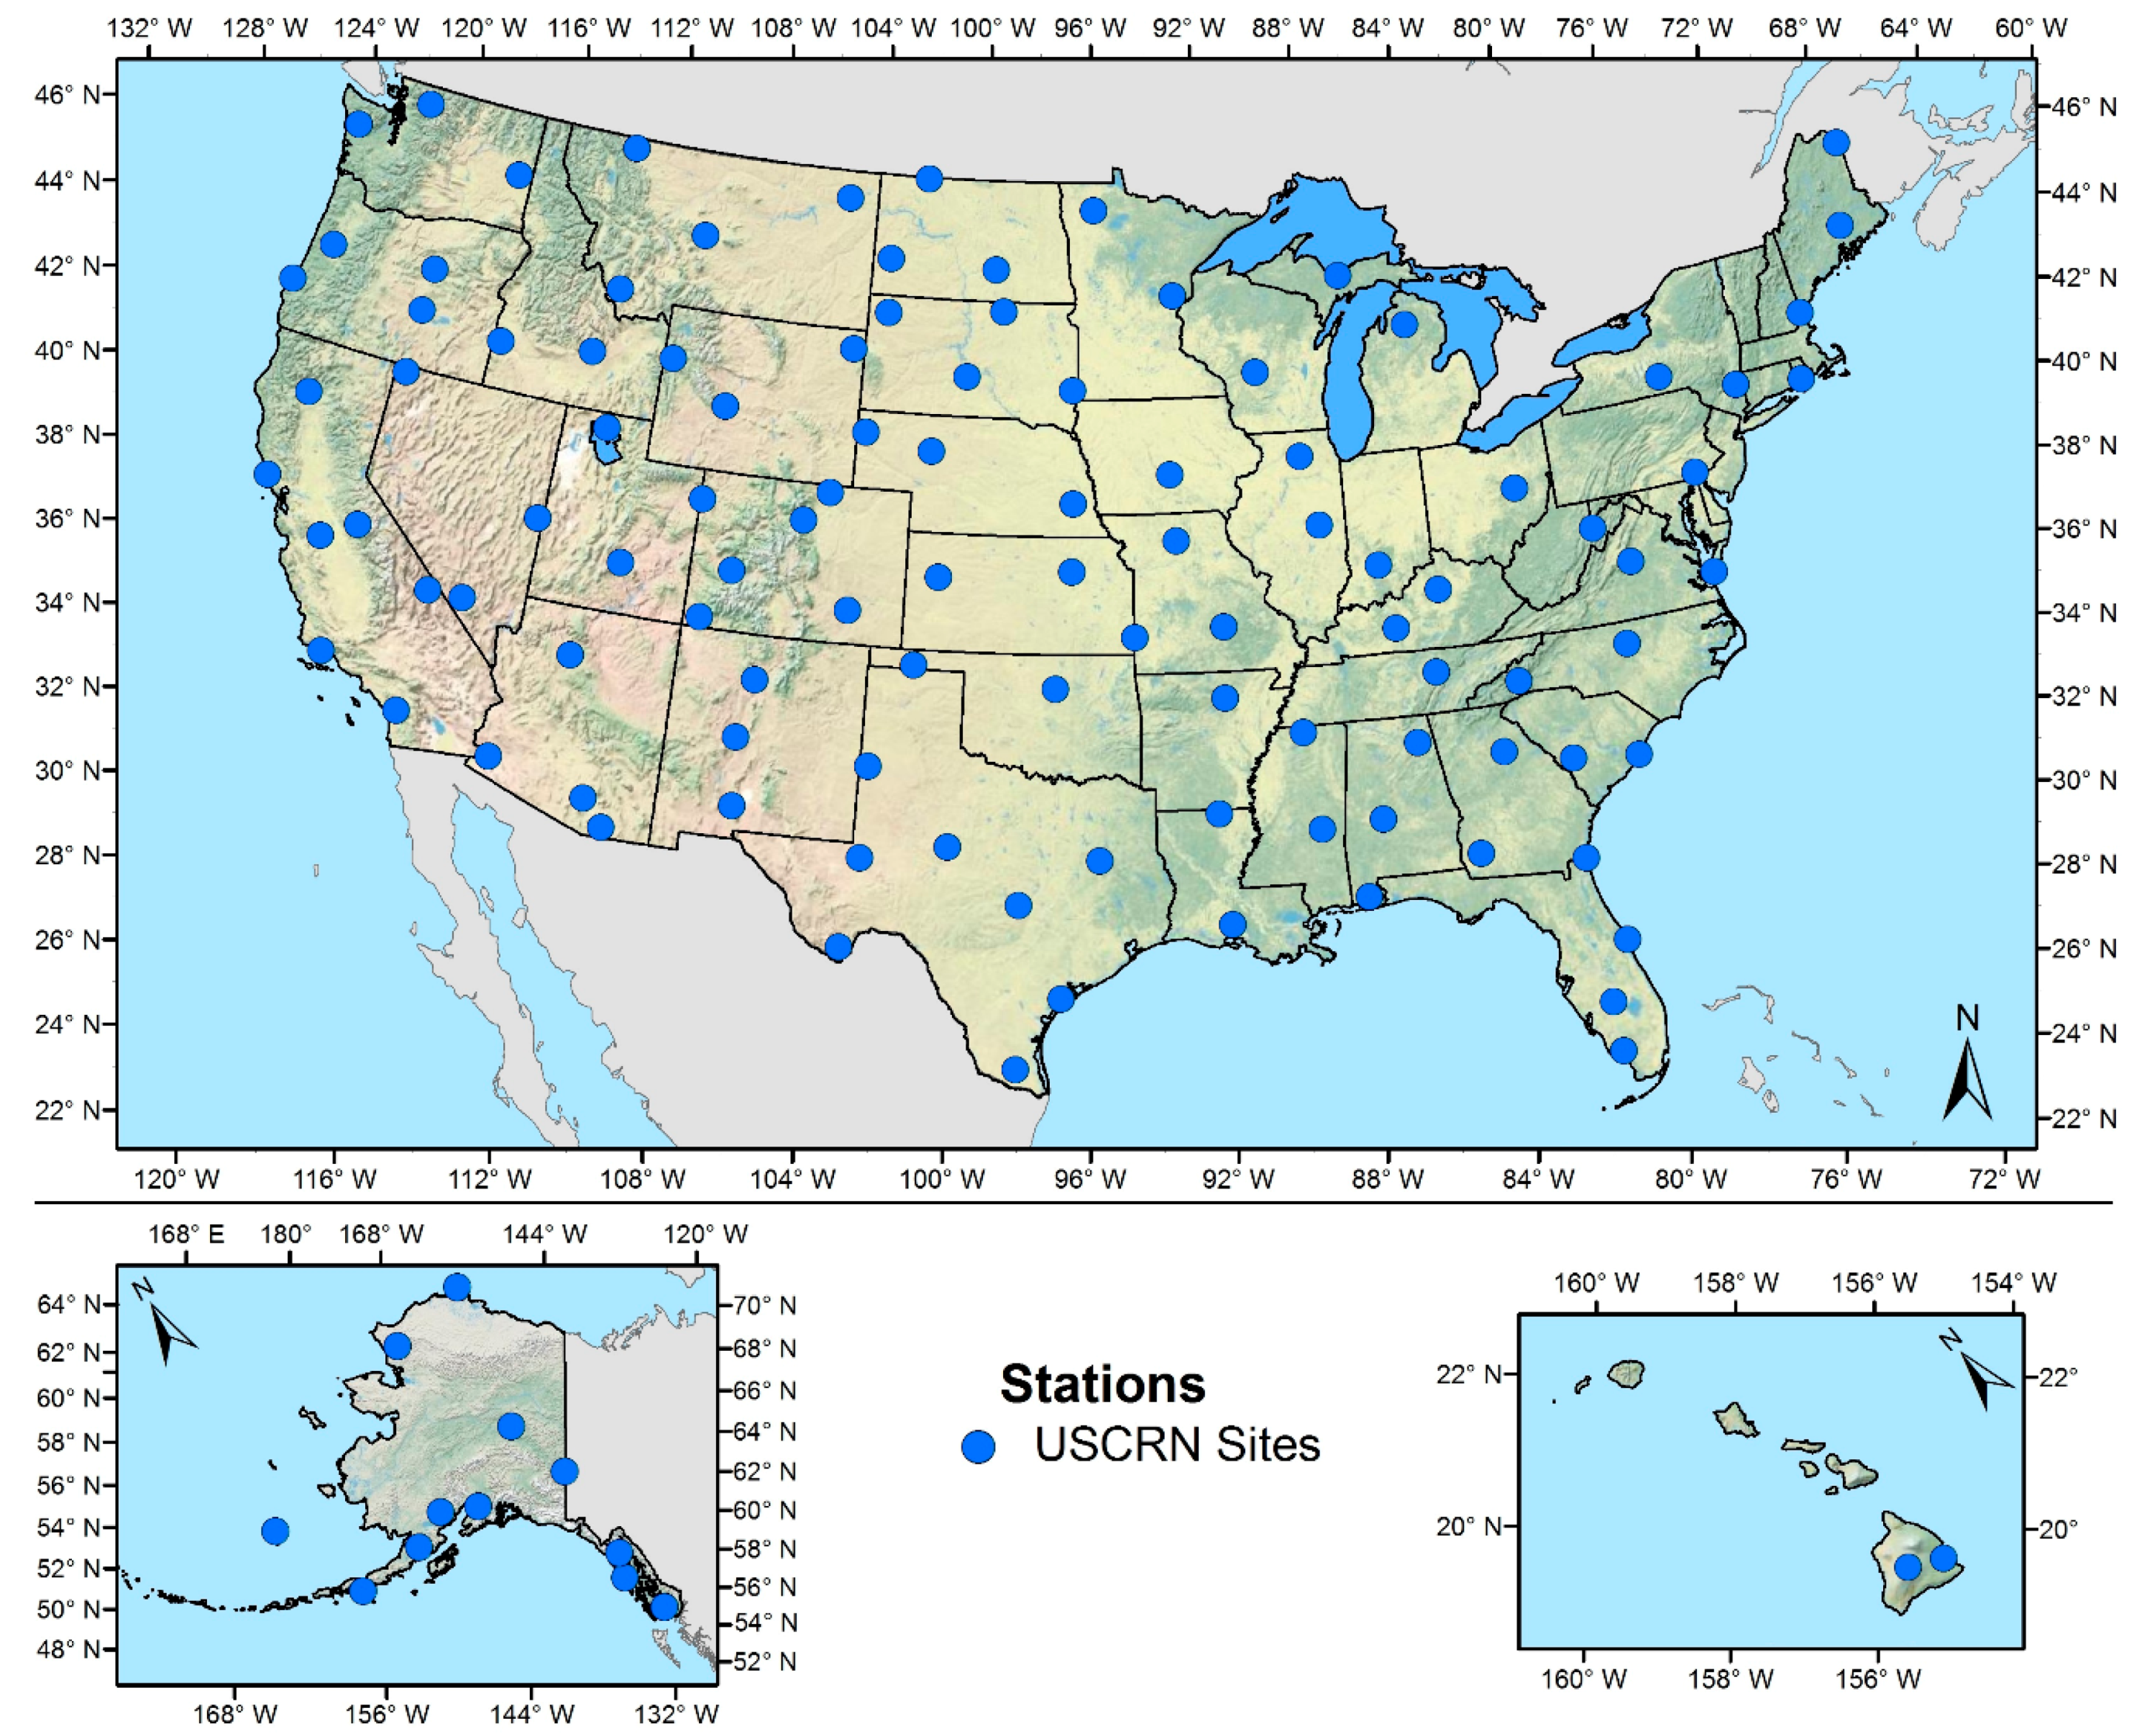
Figure 2.
Scatterplot of the 2011 M02 bias (HIRS SAT minus USCRN SAT) vs. the HIRS SAT for 2011. For HIRS temperatures at or above −15 °C the black line is the best fit and the equation is: 0.11*x − 1.28 in which x is the HIRS SAT. For HIRS temperatures below −15 °C, the best fit equation is: −0.12*x − 4.57. The units of bias and temperature are °C.
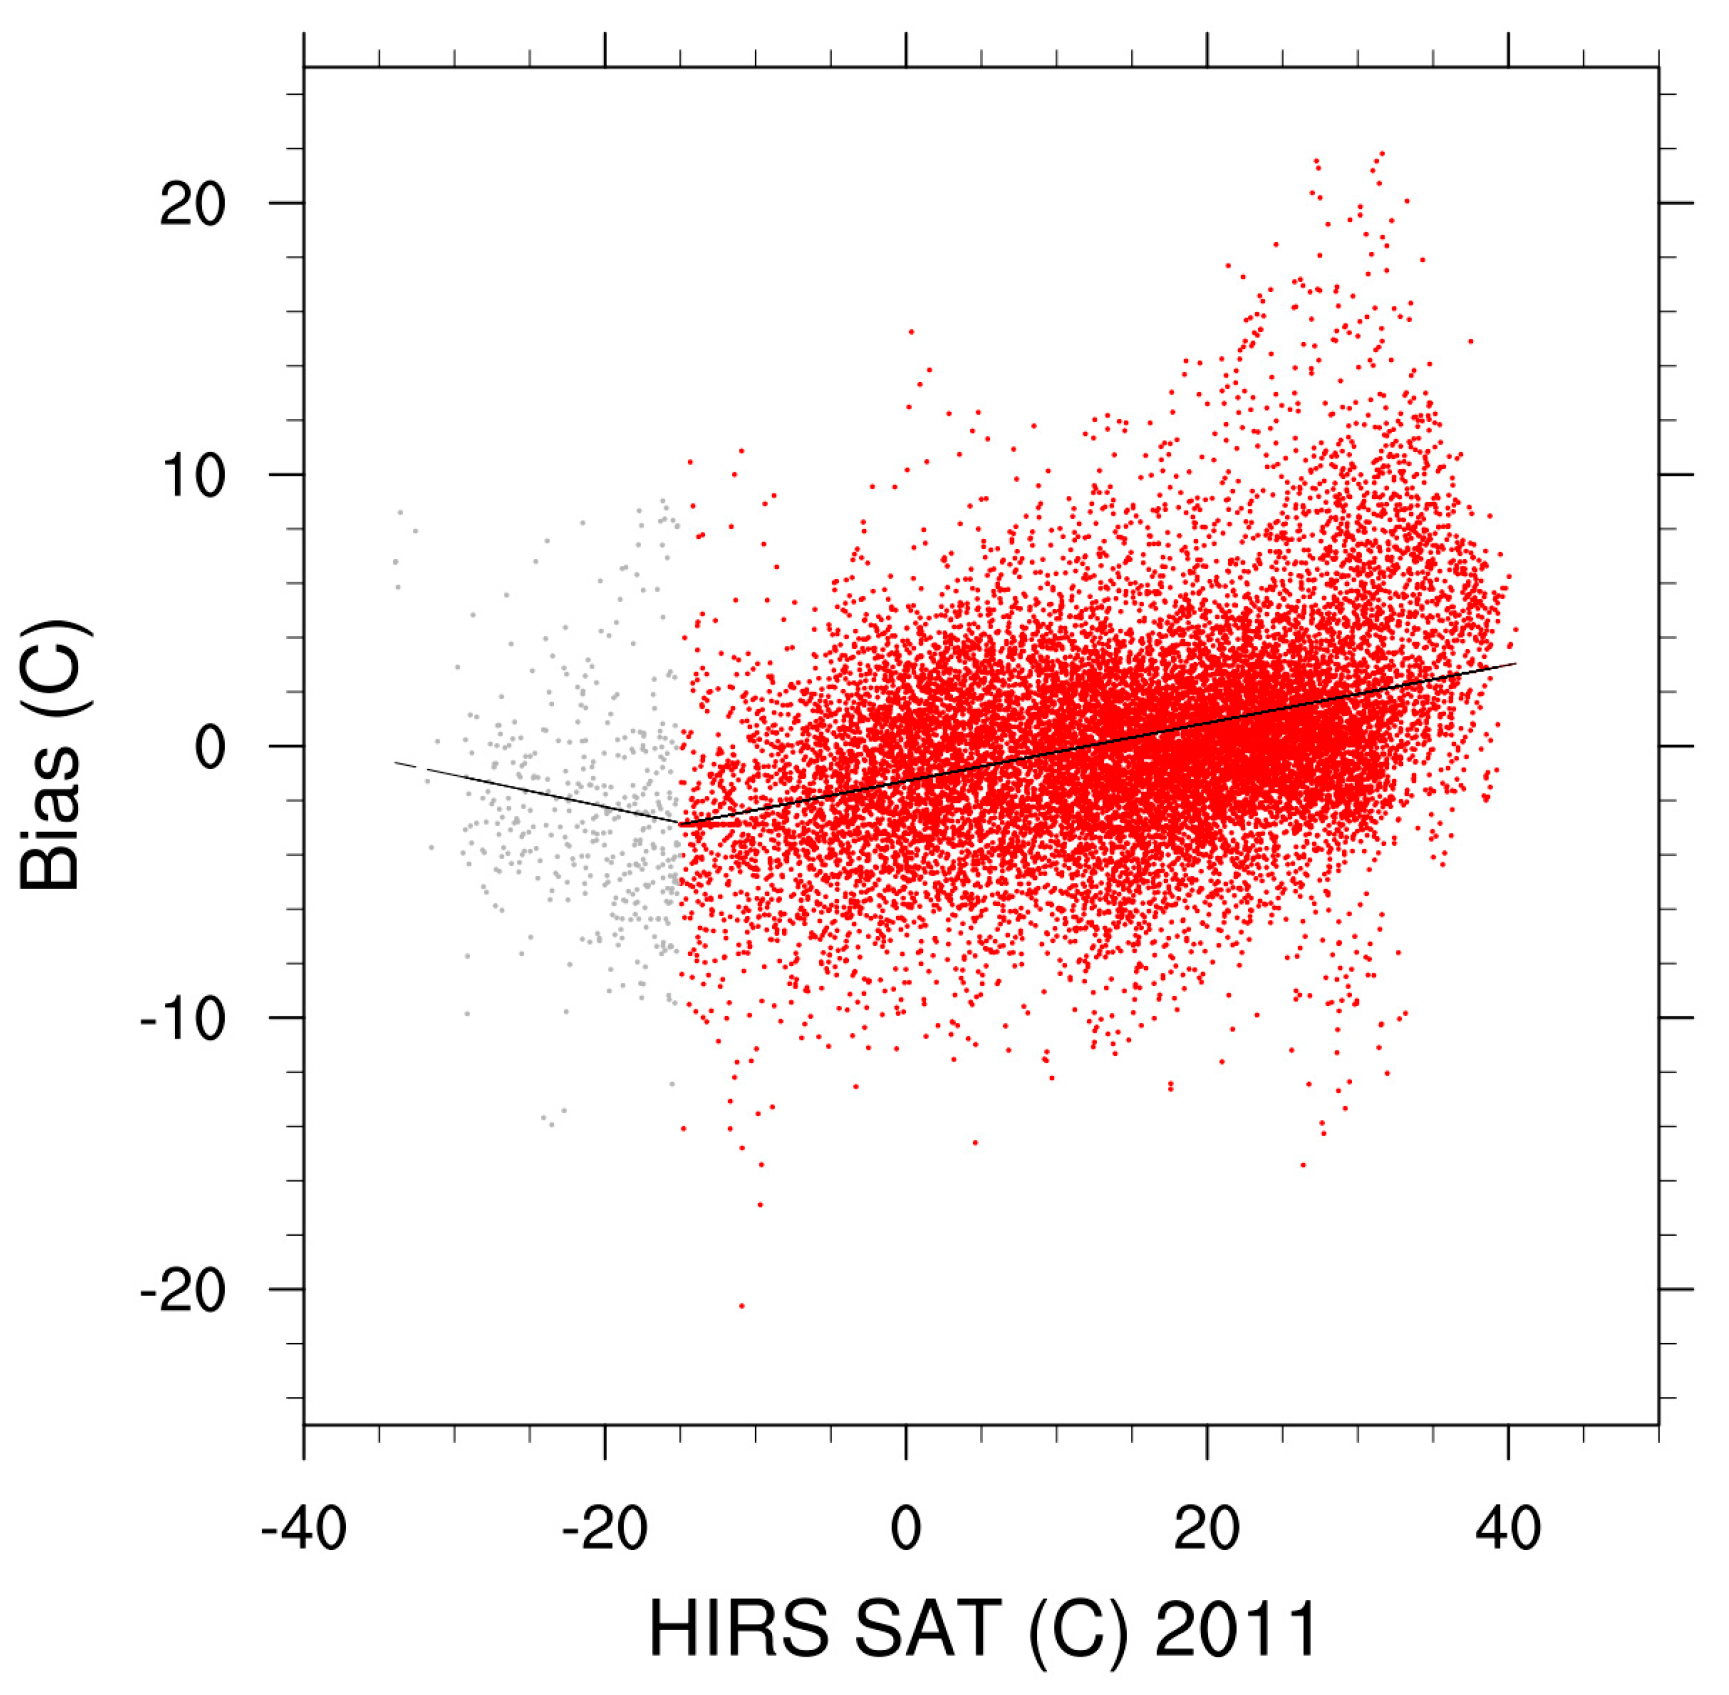
Figure 3.
Annual bias (a) and RMSD (b) of HIRS M02 and N17 SATs (in °C). Each year represents the average bias and RMSD of the stations. Bias is defined here as HIRS minus USCRN.
Figure 3.
Annual bias (a) and RMSD (b) of HIRS M02 and N17 SATs (in °C). Each year represents the average bias and RMSD of the stations. Bias is defined here as HIRS minus USCRN.

Figure 4.
Seasonal mean bias and RMSD of HIRS M02 and N17 SATs (in °C). Bias is defined here as HIRS minus USCRN. Panels (a) and (b) show winter mean bias and RMSD; (c) and (d) show spring mean bias and RMSD; (e) and (f) show summer mean bias and RMSD; and (g) and (h) show fall mean bias and RMSD.
Figure 4.
Seasonal mean bias and RMSD of HIRS M02 and N17 SATs (in °C). Bias is defined here as HIRS minus USCRN. Panels (a) and (b) show winter mean bias and RMSD; (c) and (d) show spring mean bias and RMSD; (e) and (f) show summer mean bias and RMSD; and (g) and (h) show fall mean bias and RMSD.

Figure 5.
Annual mean bias (a) and RMSD (b) of HIRS M02 and N17 SATs (in °C, both day and night). Bias is defined here as HIRS minus USCRN.
Figure 5.
Annual mean bias (a) and RMSD (b) of HIRS M02 and N17 SATs (in °C, both day and night). Bias is defined here as HIRS minus USCRN.
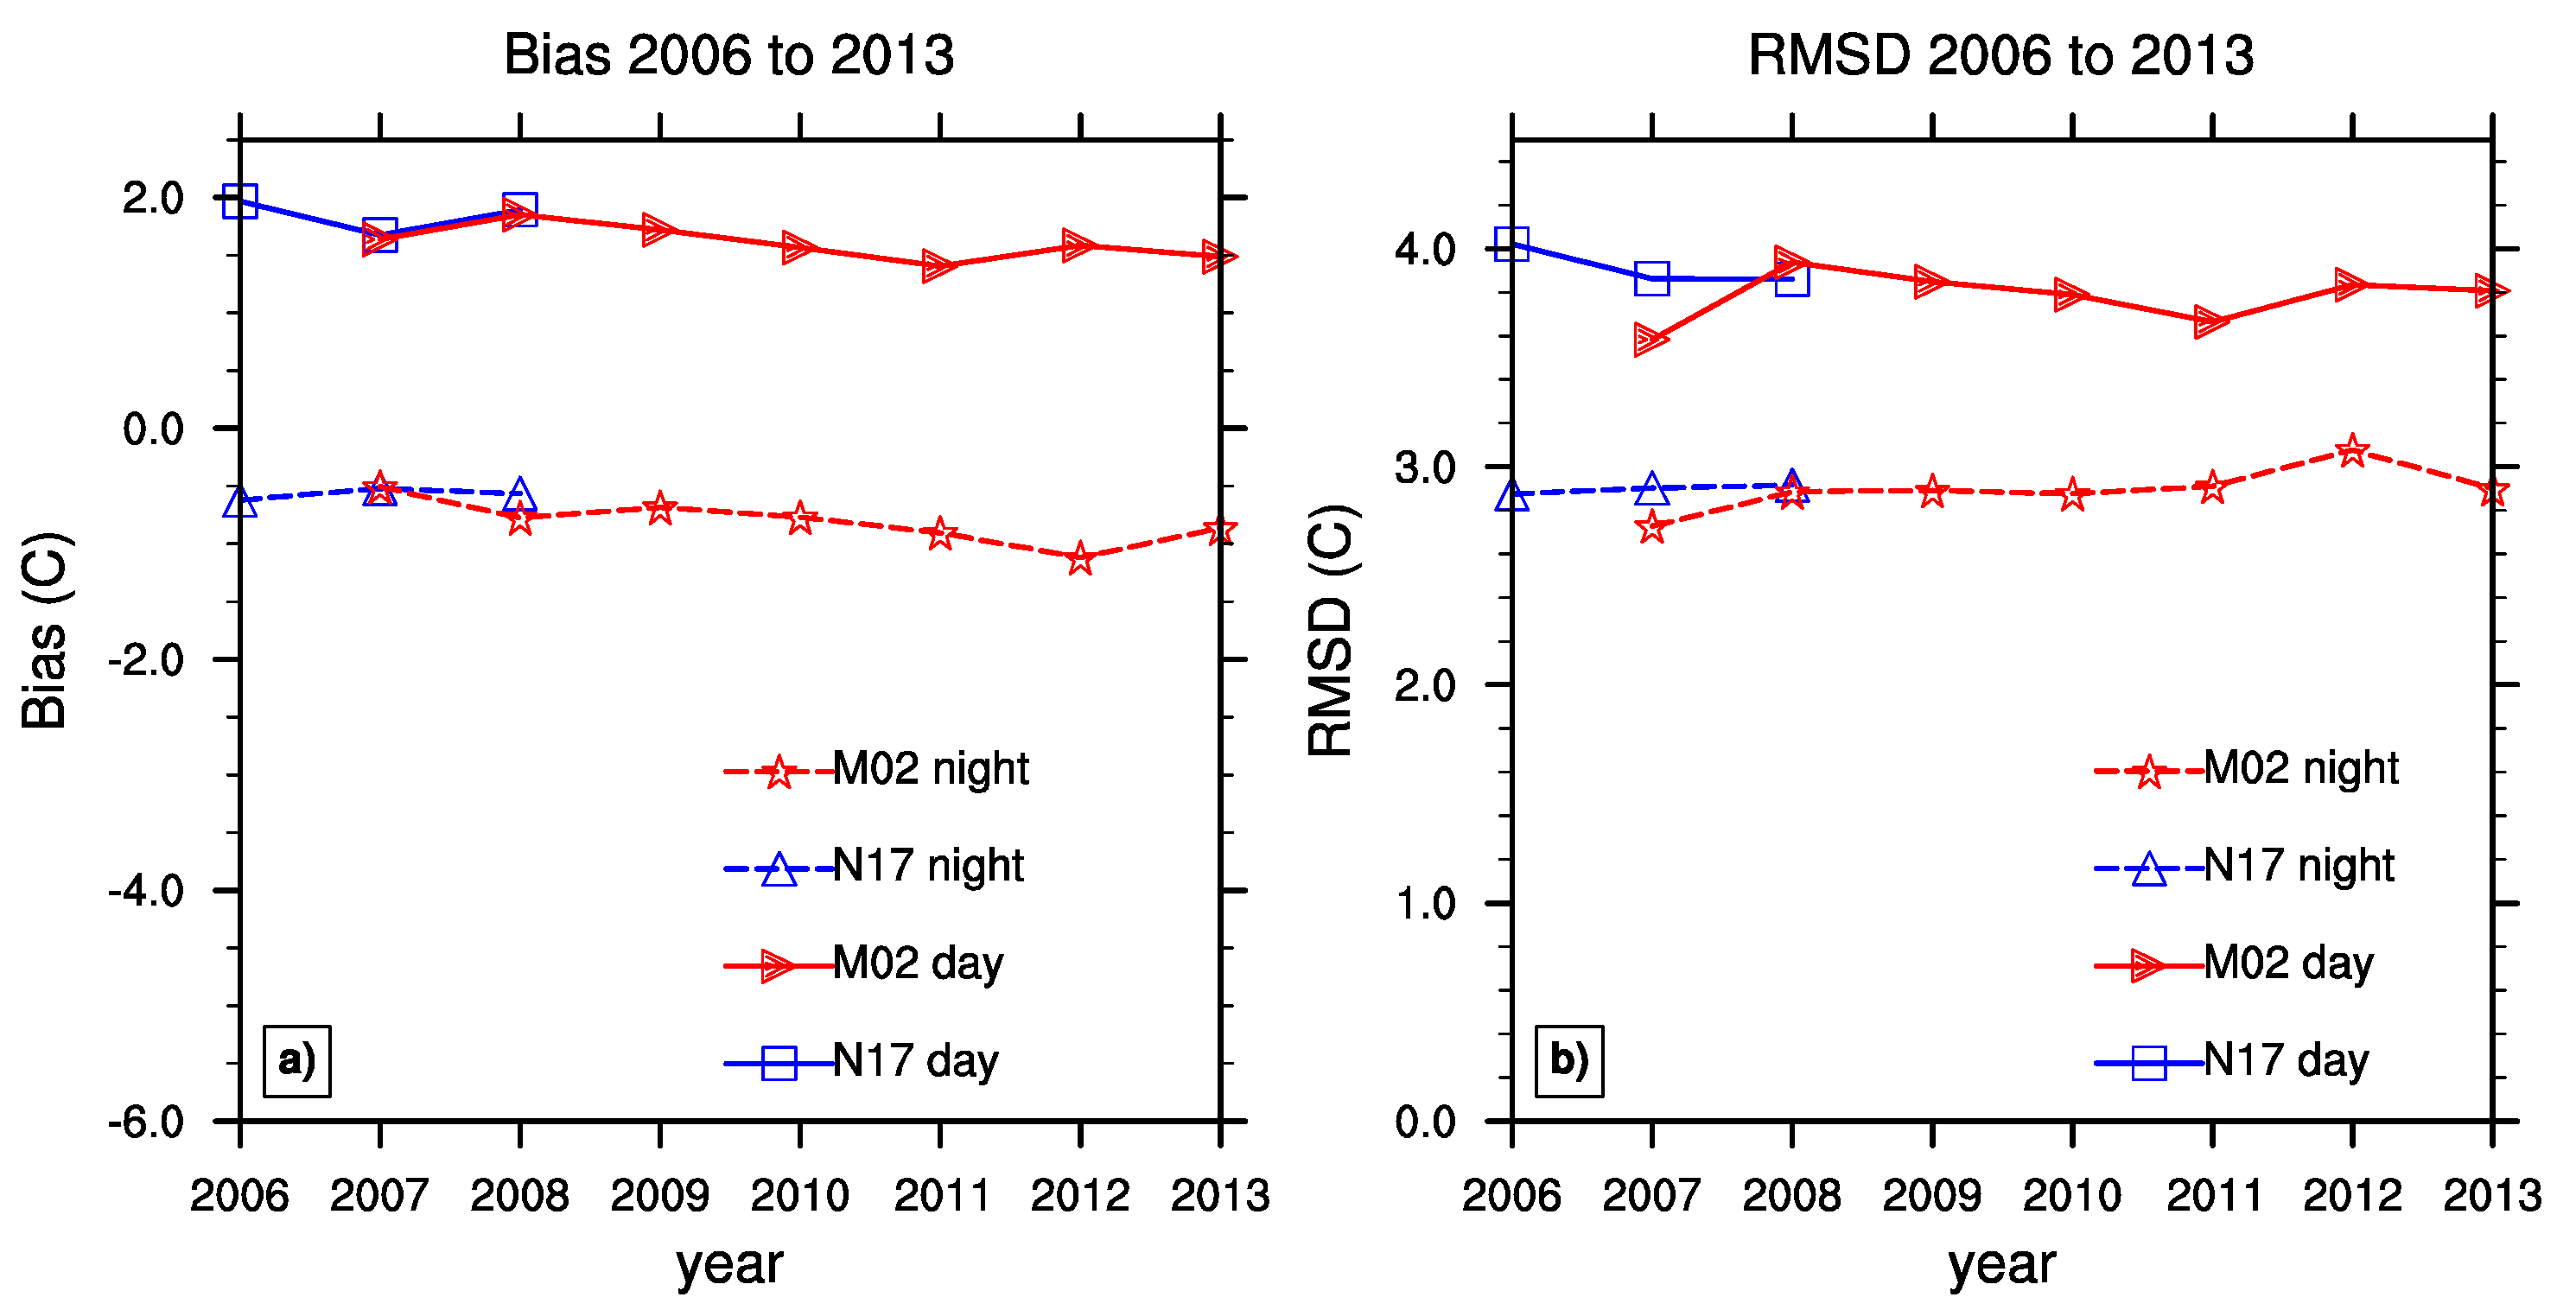
Figure 6.
Scatter plots of annual mean bias and RMSD (°C) of HIRS SAT co-located to each USCRN station along longitude for 2008, 2011, and 2013. The bias and RMSD values for the three years are plotted in (a) and (b) for 2008, in (c) and (d) for 2011; and in (e) and (f) for 2013, respectively. Lines represent the least squares fit to the data. N17 data are in blue and M02 data are in red.
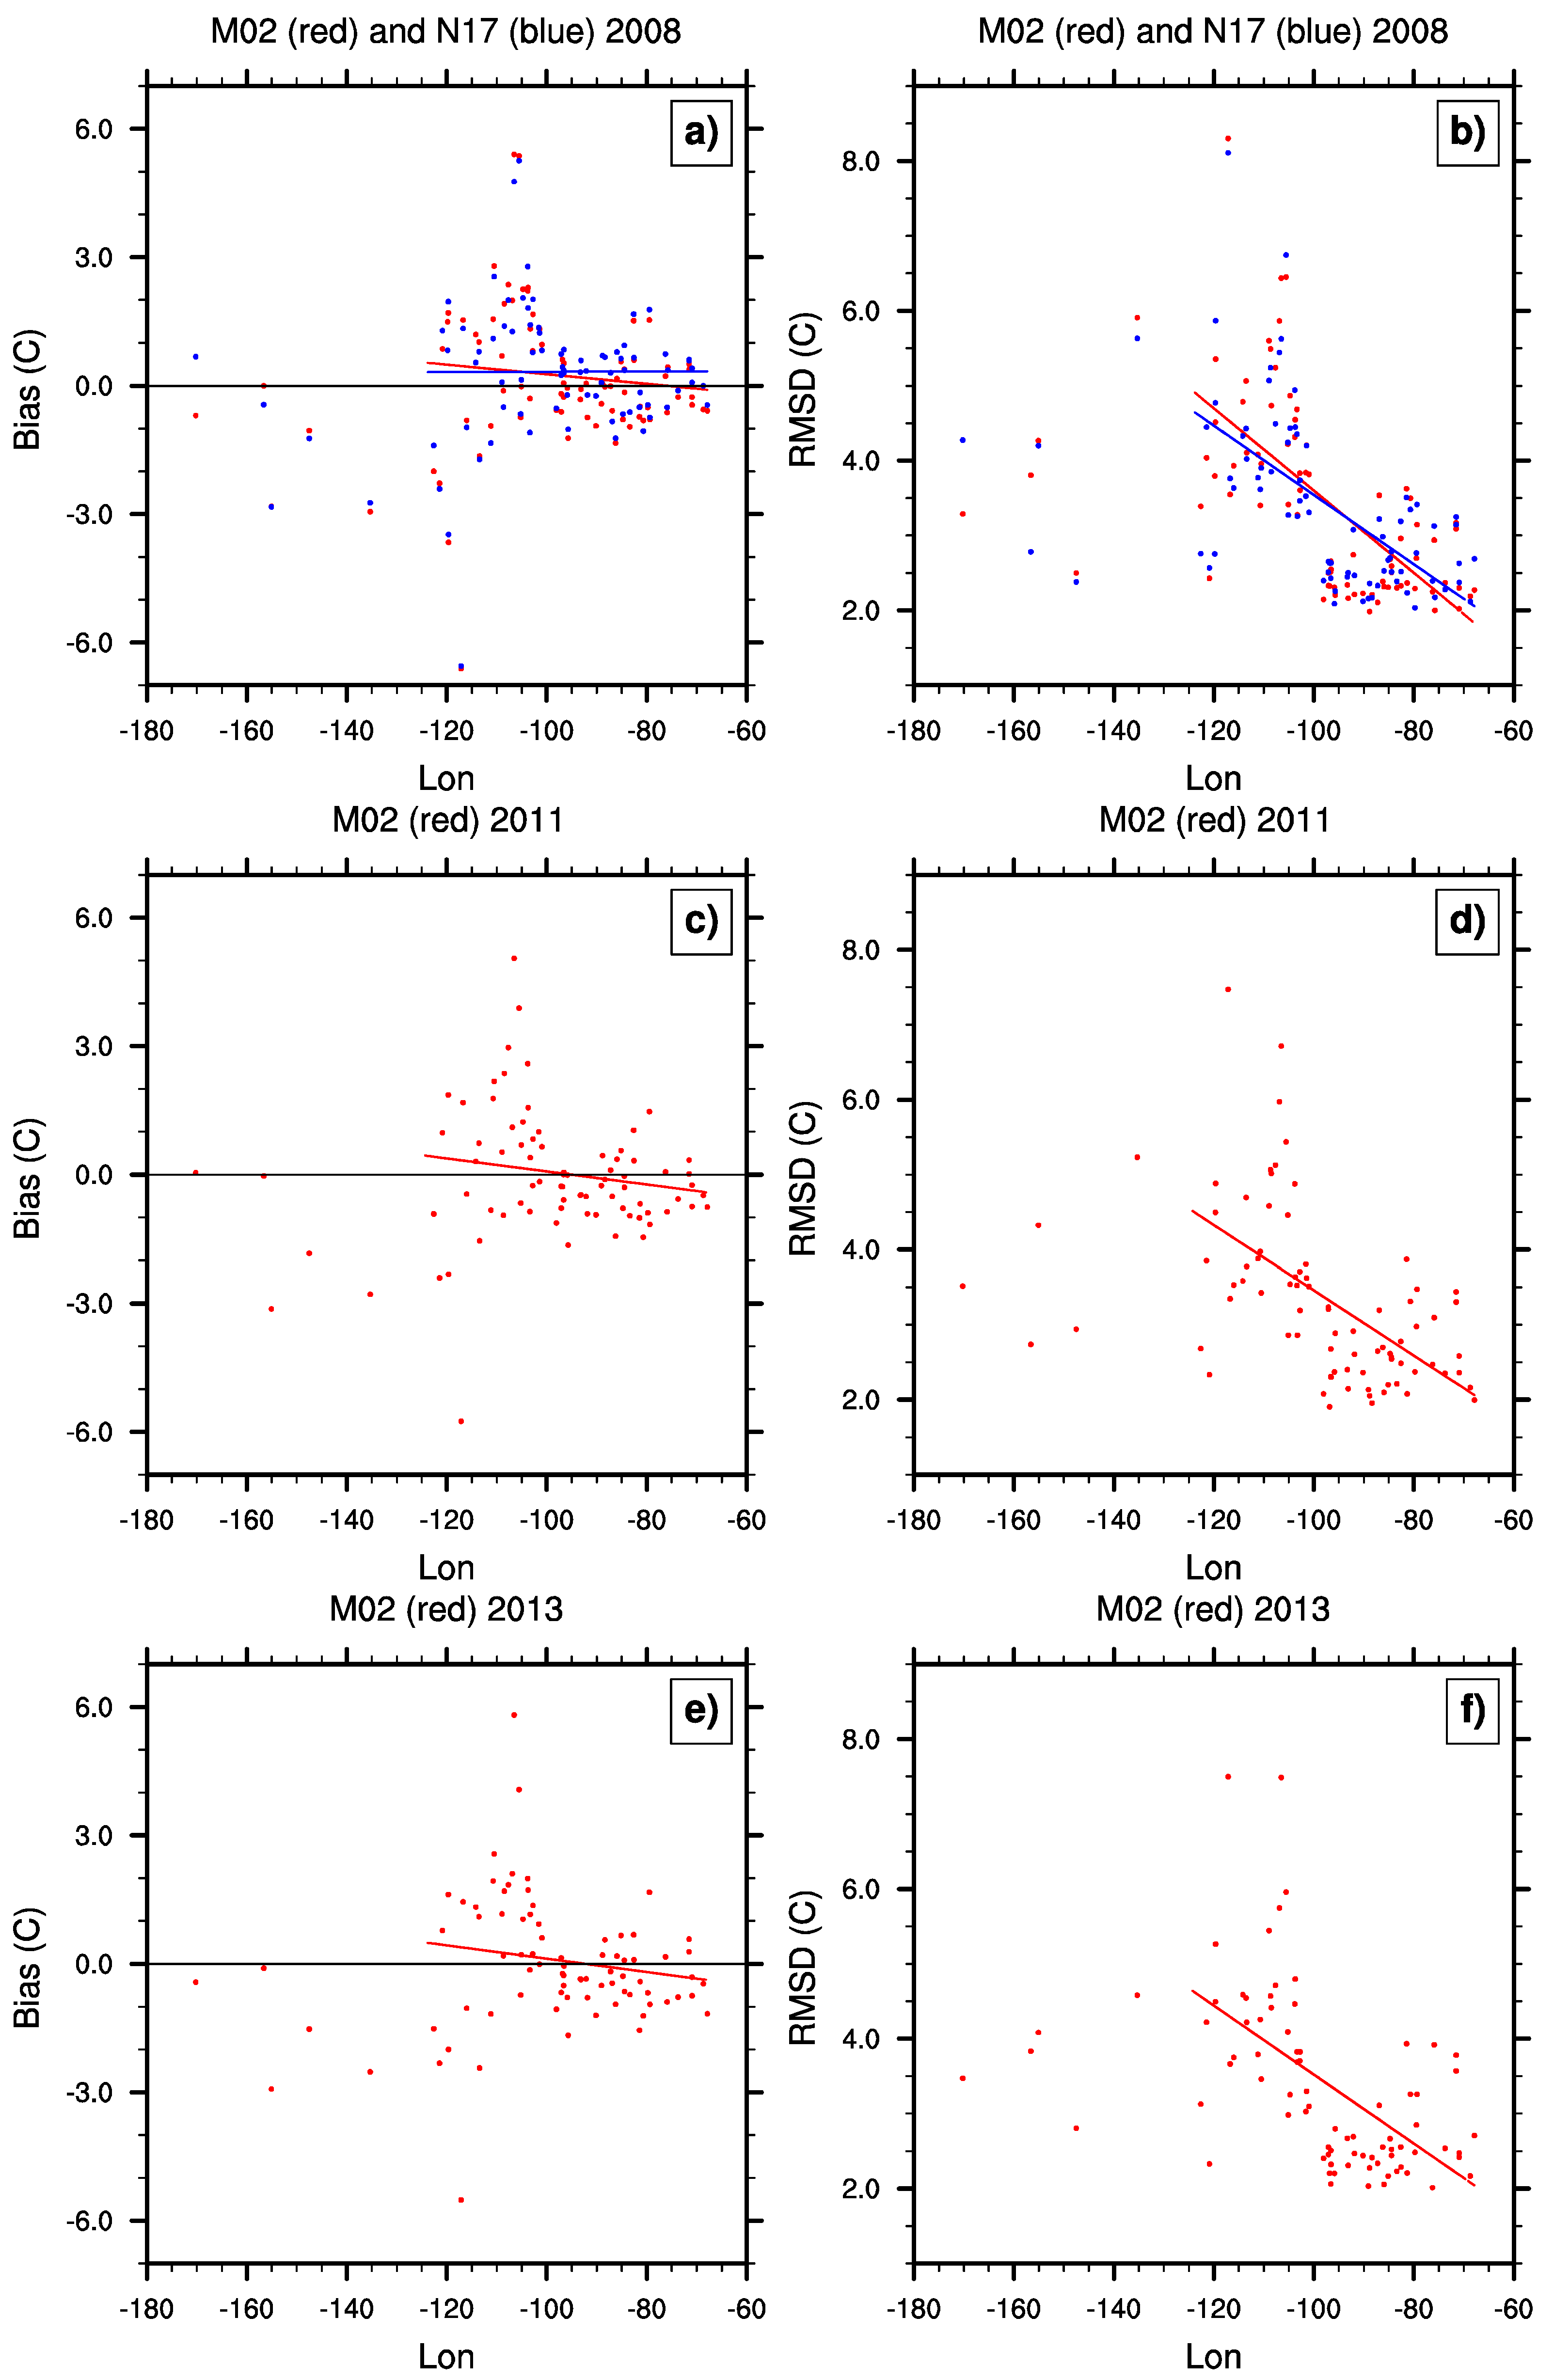
Figure 7.
Similar to Figure 6 for scatter plots of annual mean bias and RMSD (°C) of HIRS SAT co-located to each USCRN station along latitude for 2008 (a,b); 2011 (c,d); and 2013 (e,f).
Figure 7.
Similar to Figure 6 for scatter plots of annual mean bias and RMSD (°C) of HIRS SAT co-located to each USCRN station along latitude for 2008 (a,b); 2011 (c,d); and 2013 (e,f).

Figure 8.
Scatter plots of annual mean bias and RMSD (°C) of HIRS SAT co-located to each USCRN station along elevation (m) for 2008, 2011, and 2013. The bias and RMSD values for the three years are plotted in (a) and (b) for 2008; in (c) and (d) for 2011; and in (e) and (f) for 2013, respectively.
Figure 8.
Scatter plots of annual mean bias and RMSD (°C) of HIRS SAT co-located to each USCRN station along elevation (m) for 2008, 2011, and 2013. The bias and RMSD values for the three years are plotted in (a) and (b) for 2008; in (c) and (d) for 2011; and in (e) and (f) for 2013, respectively.
© 2016 by the authors; licensee MDPI, Basel, Switzerland. This article is an open access article distributed under the terms and conditions of the Creative Commons Attribution (CC-BY) license (http://creativecommons.org/licenses/by/4.0/).
Share and Cite
MDPI and ACS Style
Stegall, S.T.; Shi, L. An Assessment of HIRS Surface Air Temperature with USCRN Data. Remote Sens. 2016, 8, 485. https://doi.org/10.3390/rs8060485
AMA Style
Stegall ST, Shi L. An Assessment of HIRS Surface Air Temperature with USCRN Data. Remote Sensing. 2016; 8(6):485. https://doi.org/10.3390/rs8060485
Chicago/Turabian StyleStegall, Steve T., and Lei Shi. 2016. "An Assessment of HIRS Surface Air Temperature with USCRN Data" Remote Sensing 8, no. 6: 485. https://doi.org/10.3390/rs8060485
Note that from the first issue of 2016, this journal uses article numbers instead of page numbers. See further details here.