
Error-Component Analysis of TRMM-Based Multi-Satellite Precipitation Estimates over Mainland China

Abstract
:
1. Introduction
2. Data Sources, Study Area, and Error-Decomposition Method
2.1. Data Sources
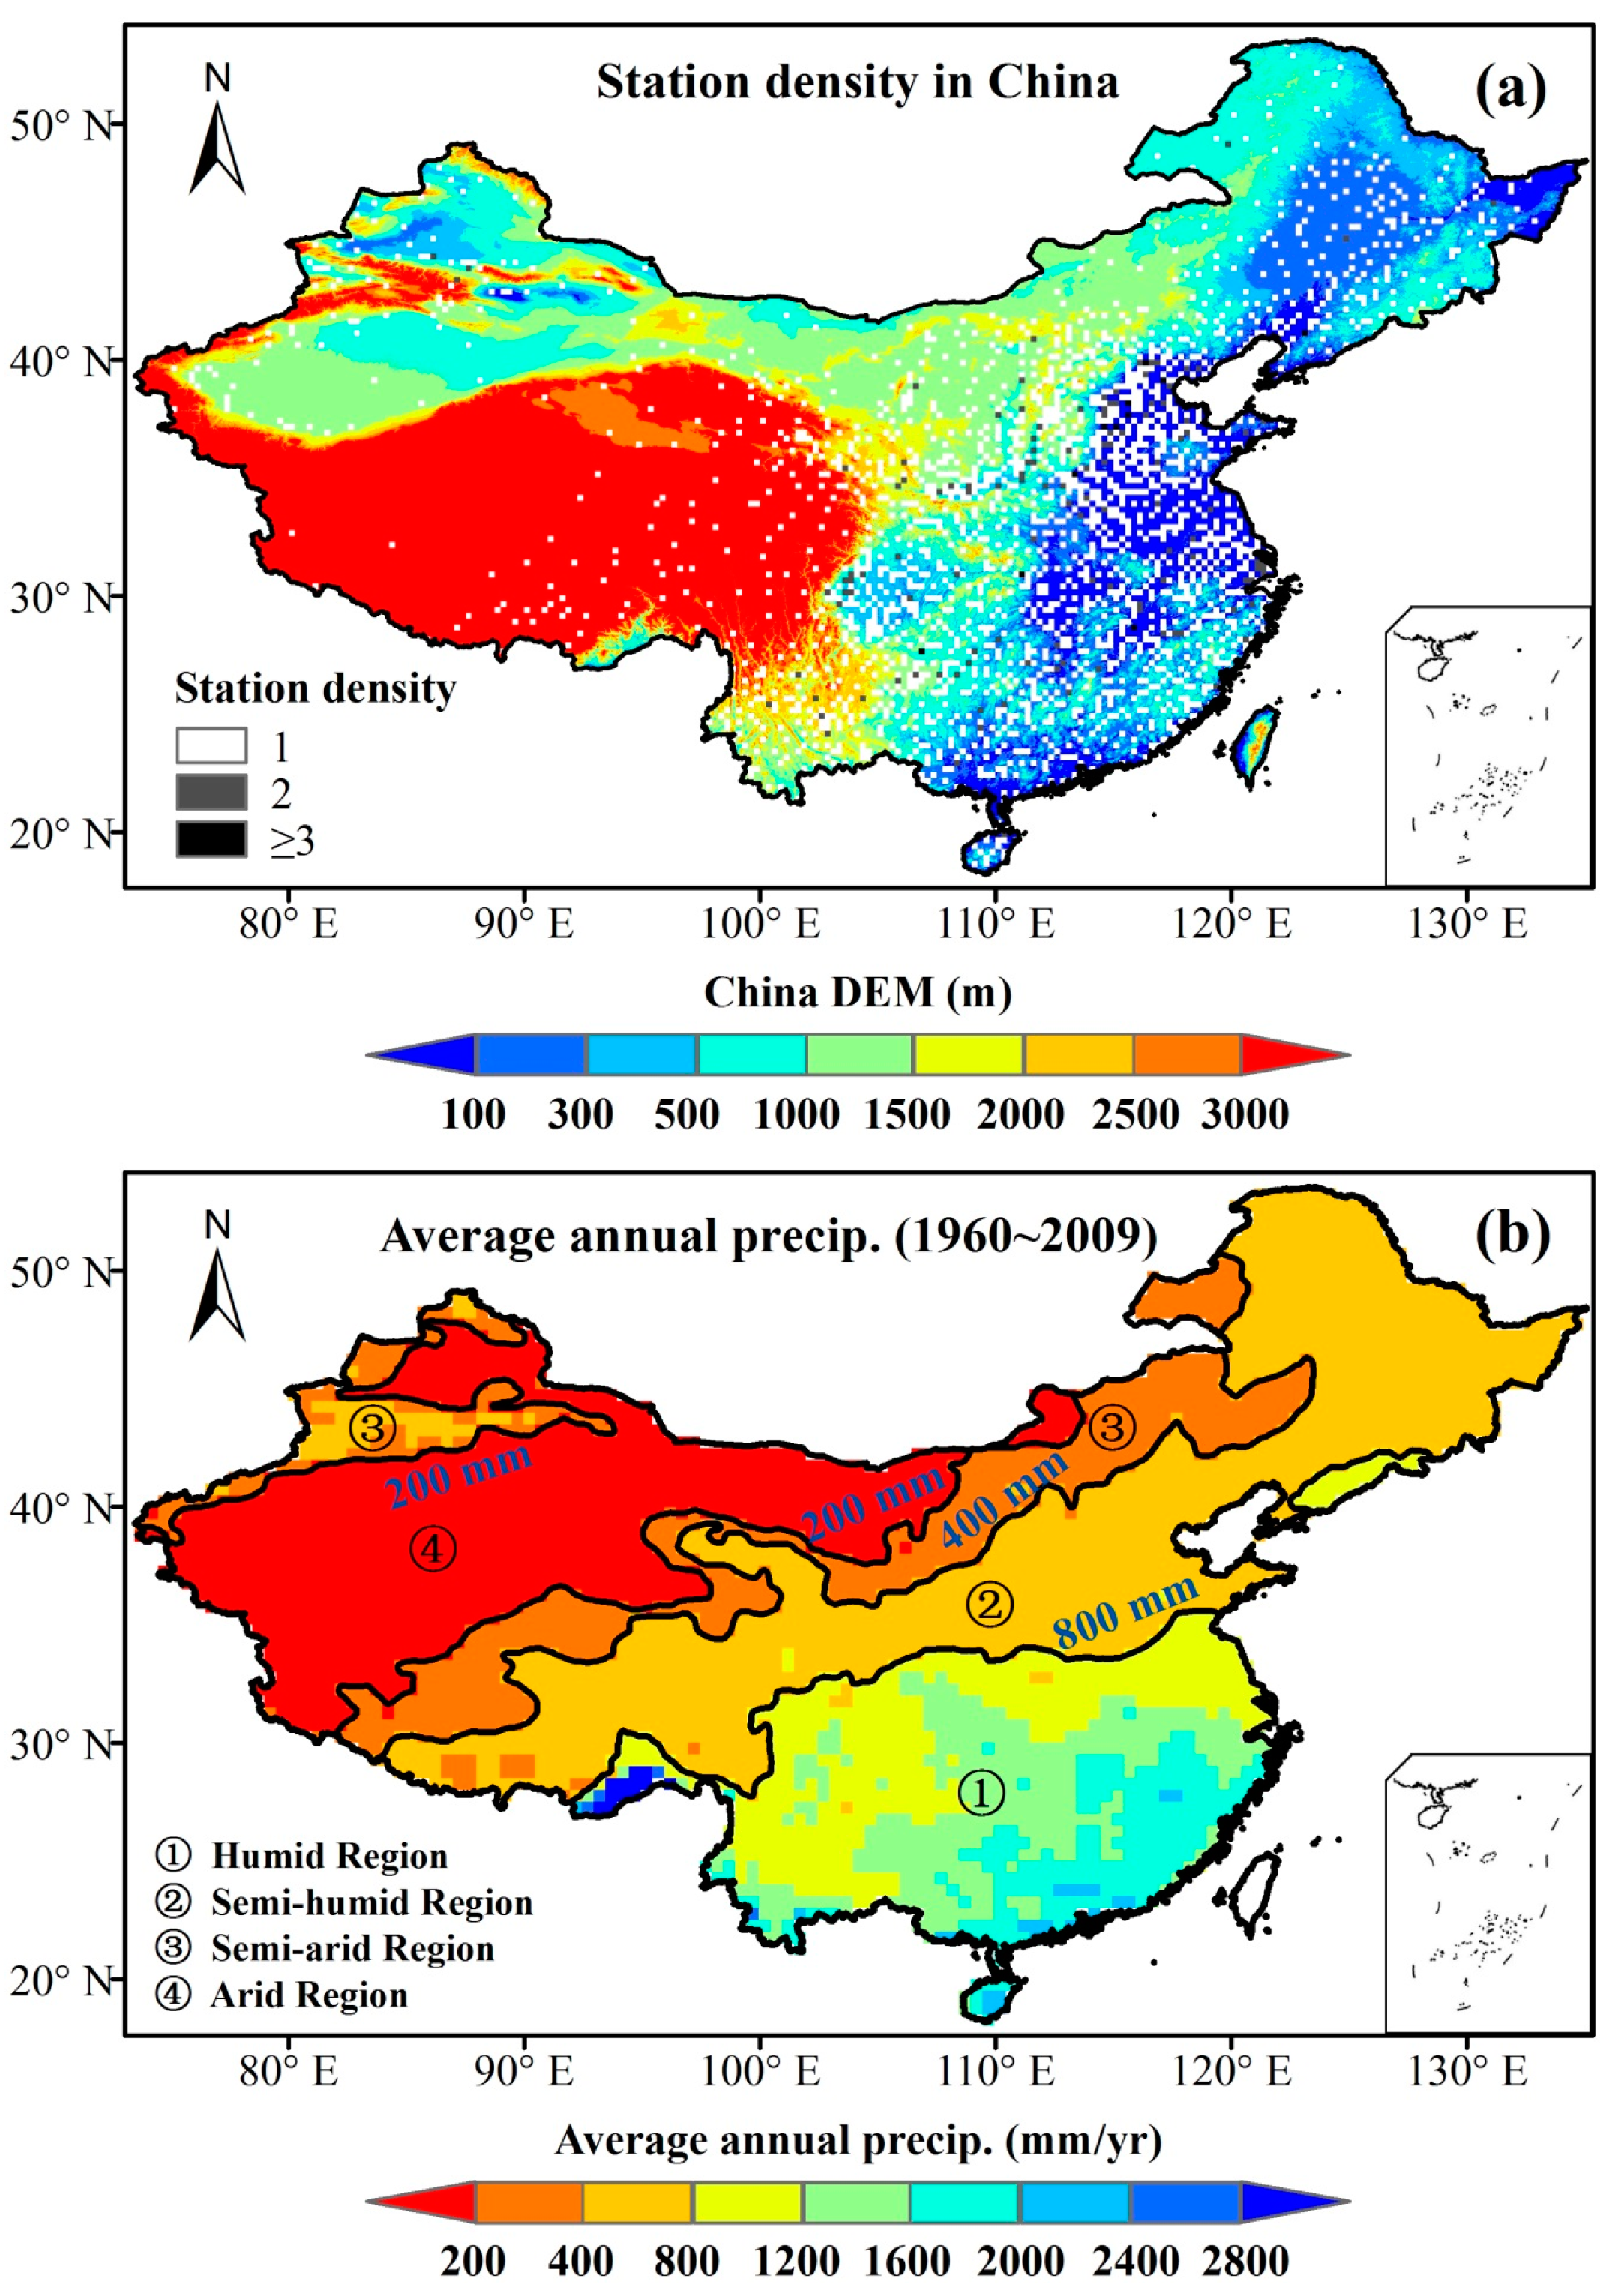
2.2. Study Area
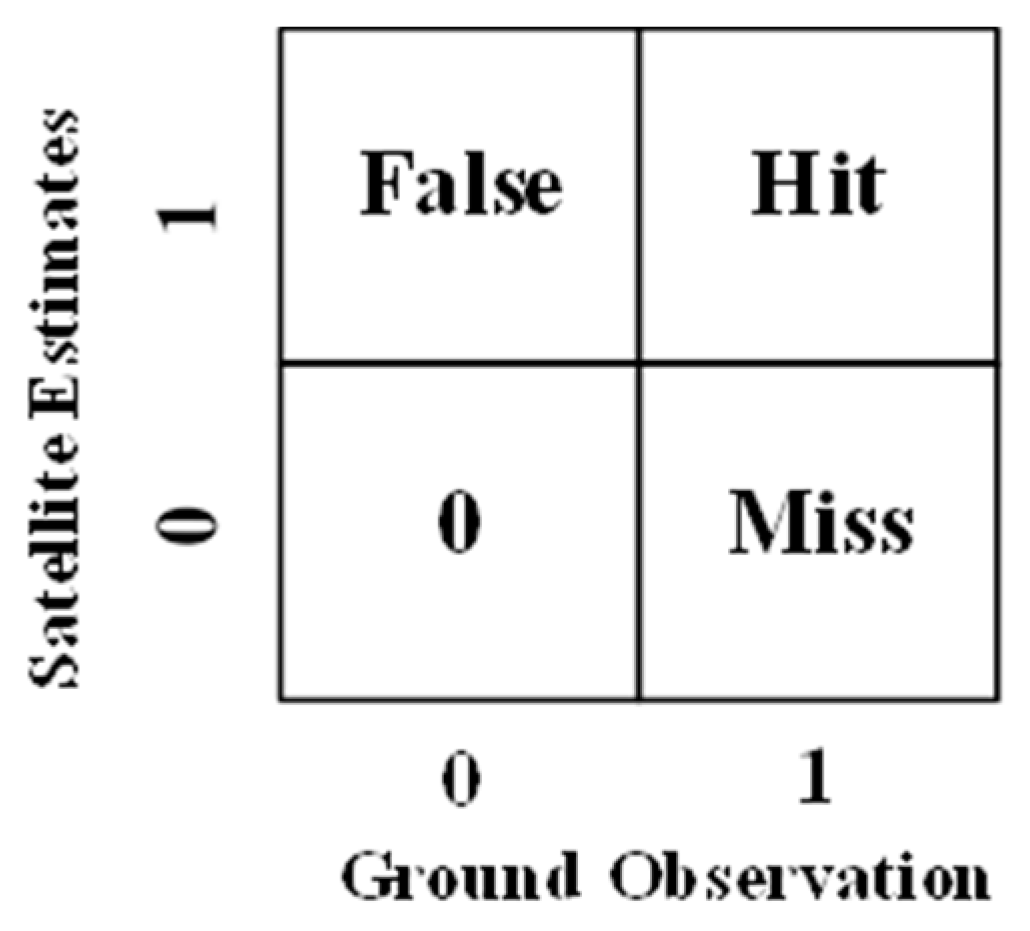
2.3. Error Decomposition
3. Results
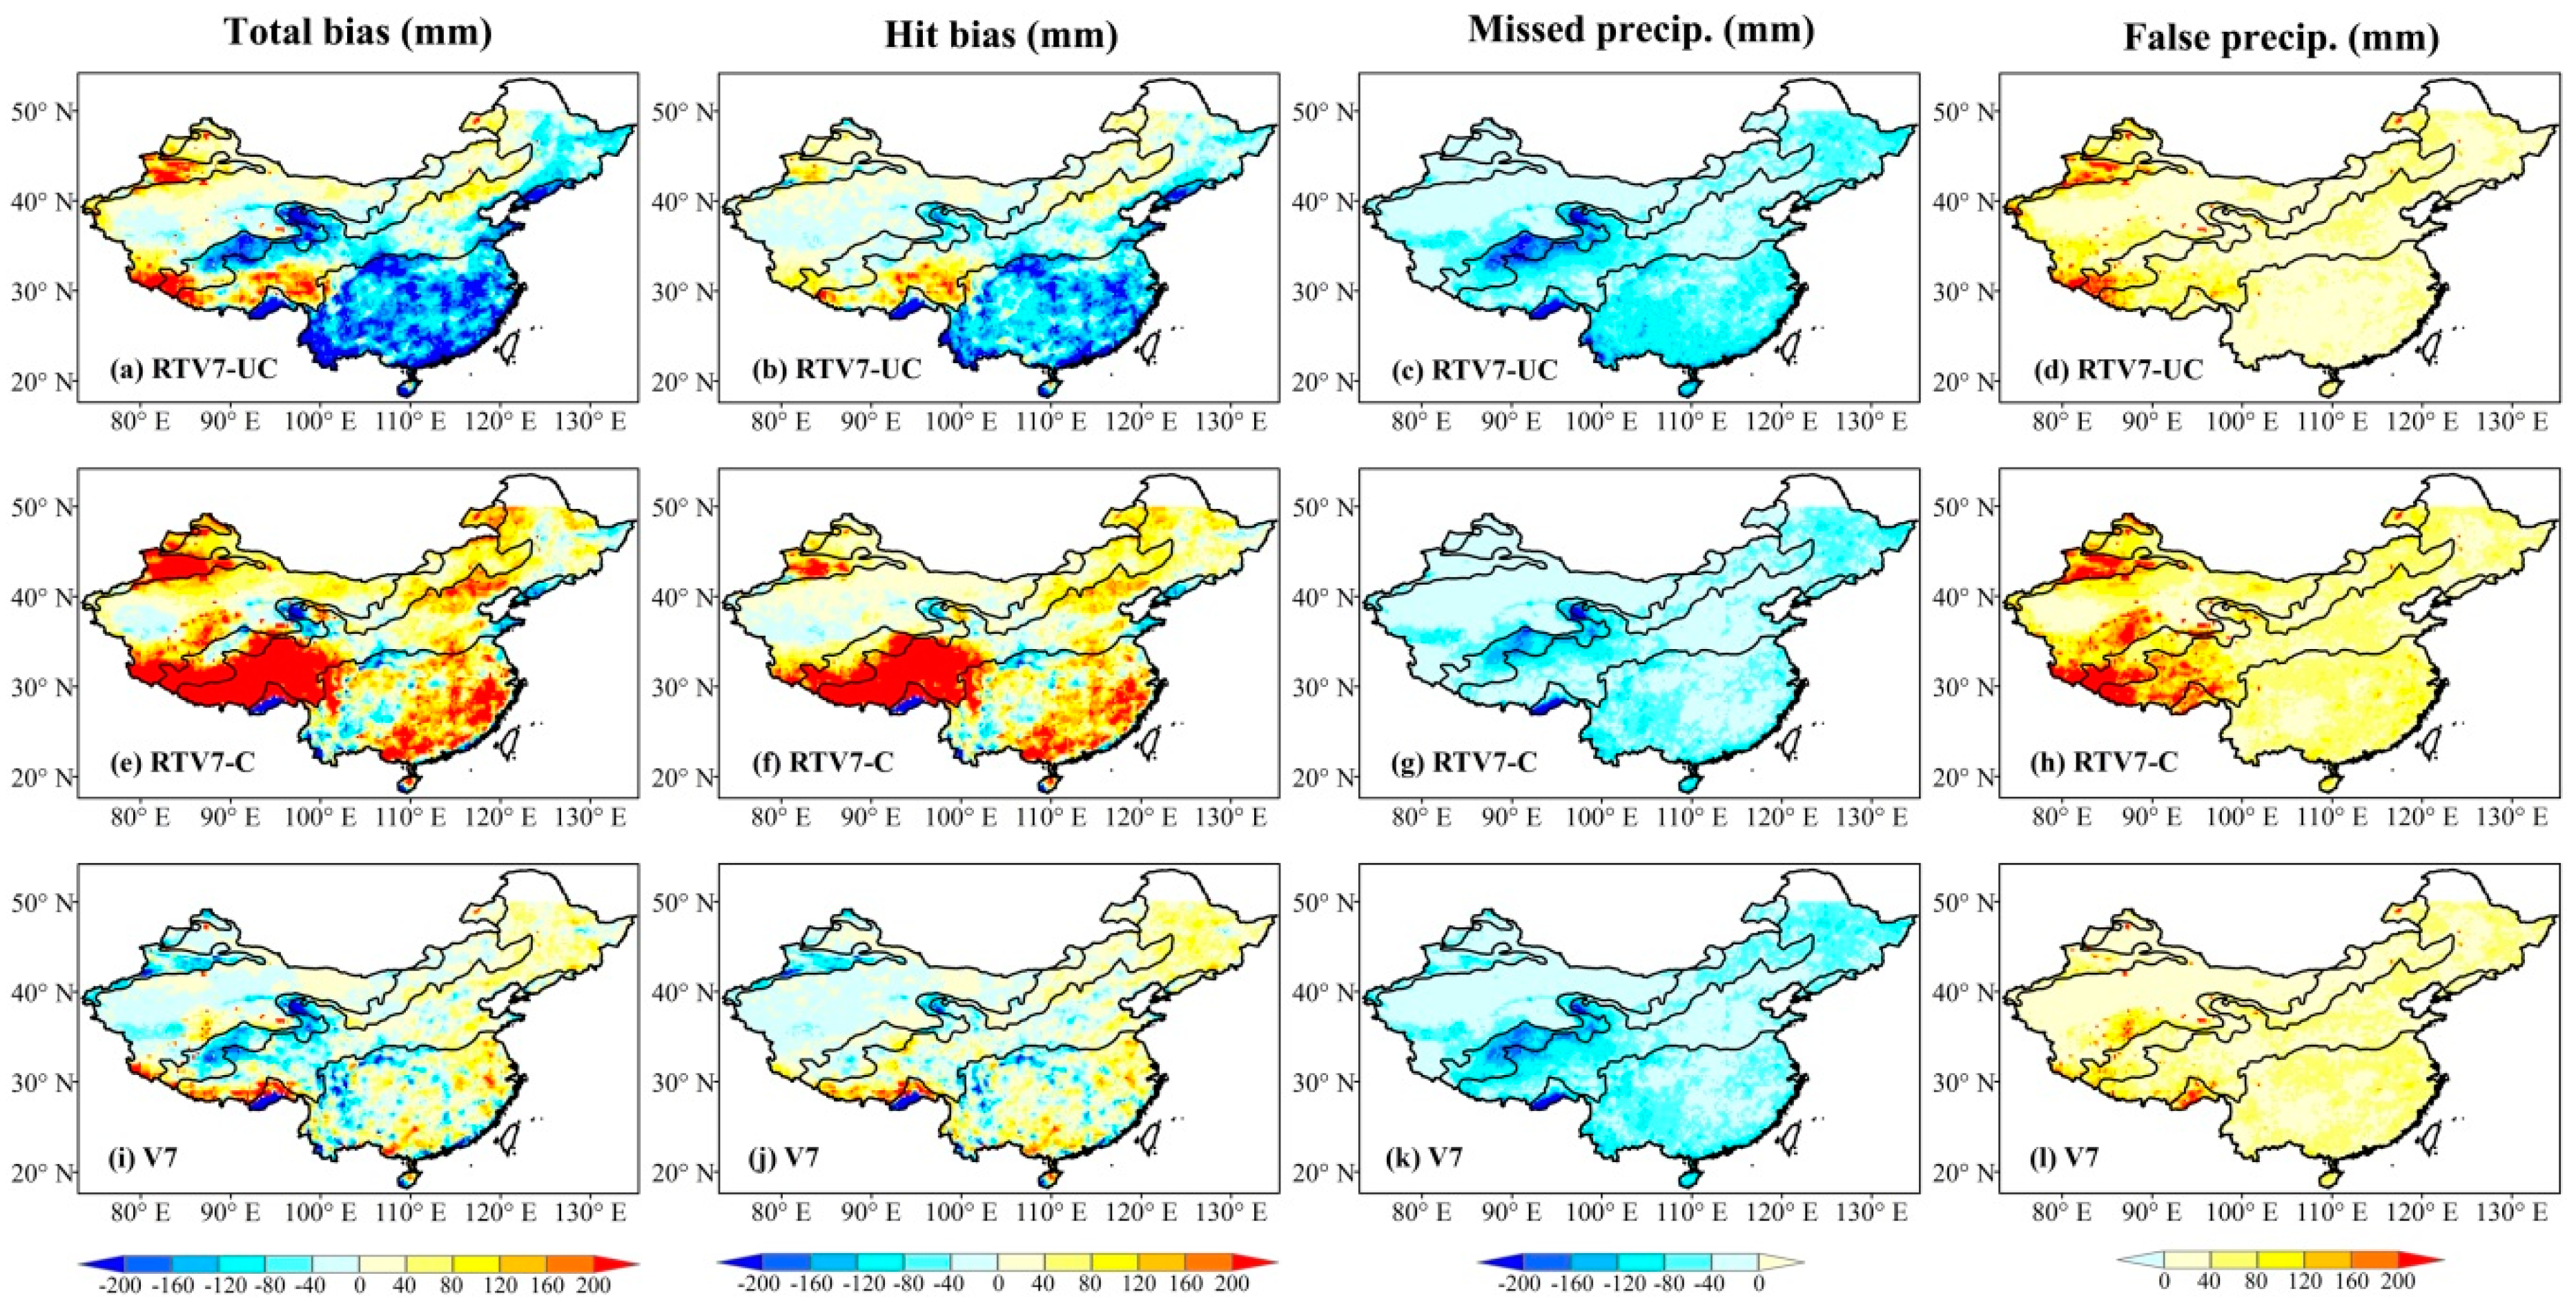
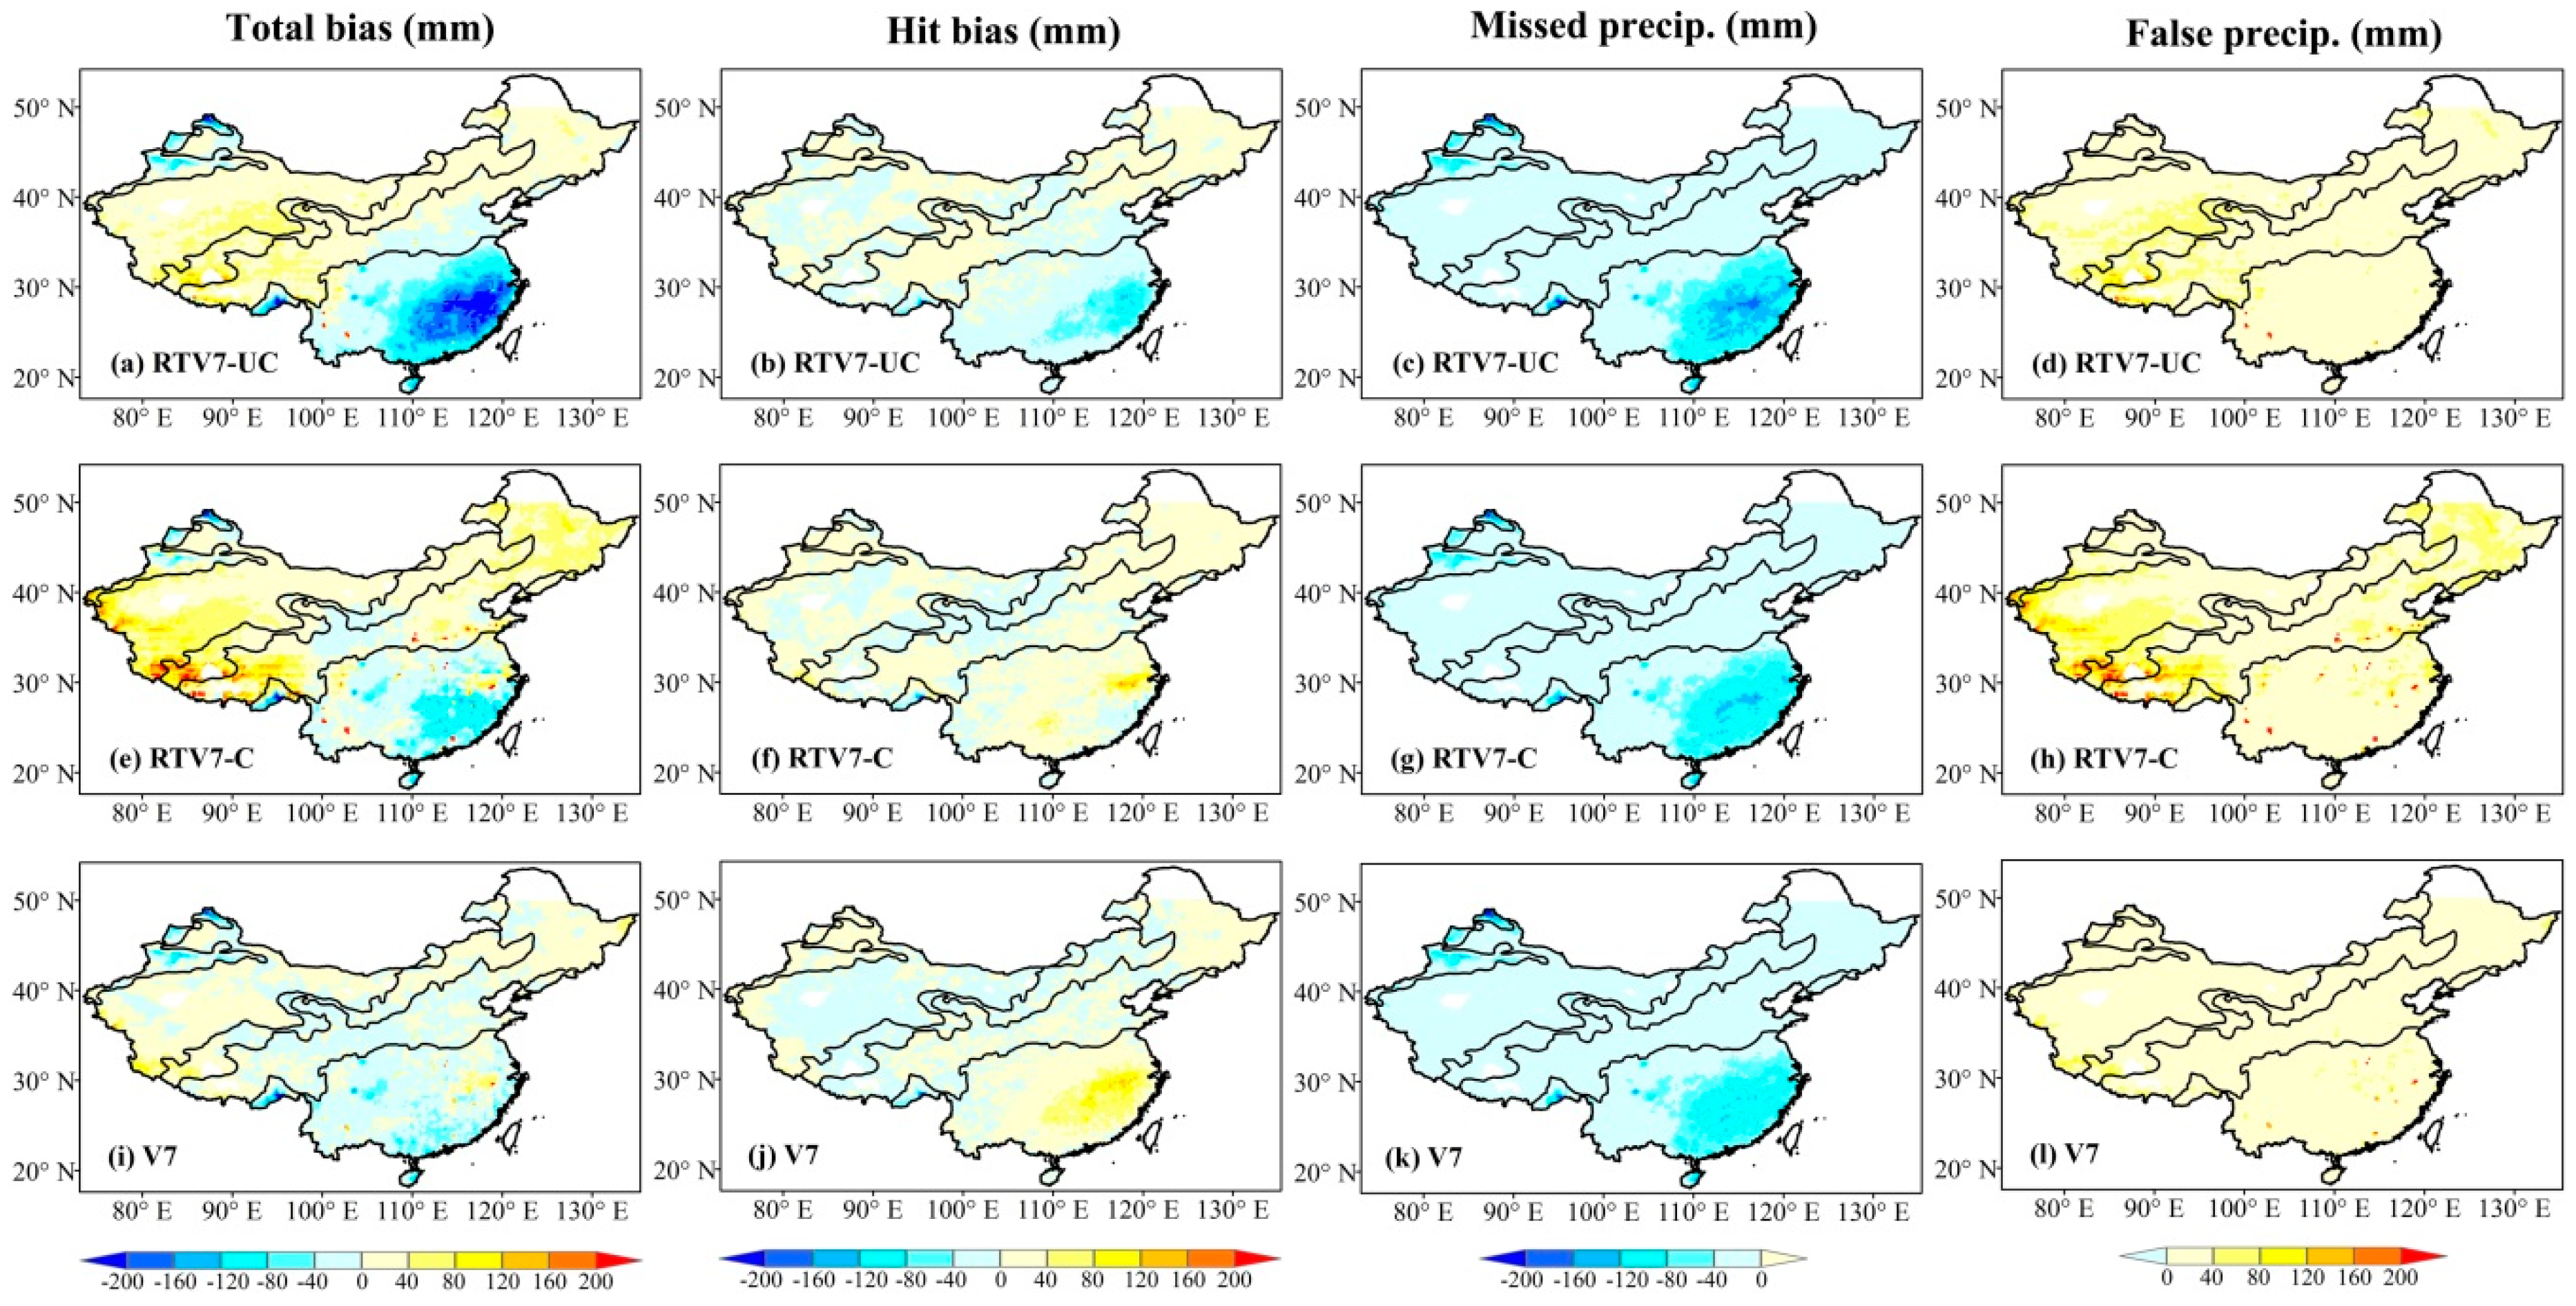
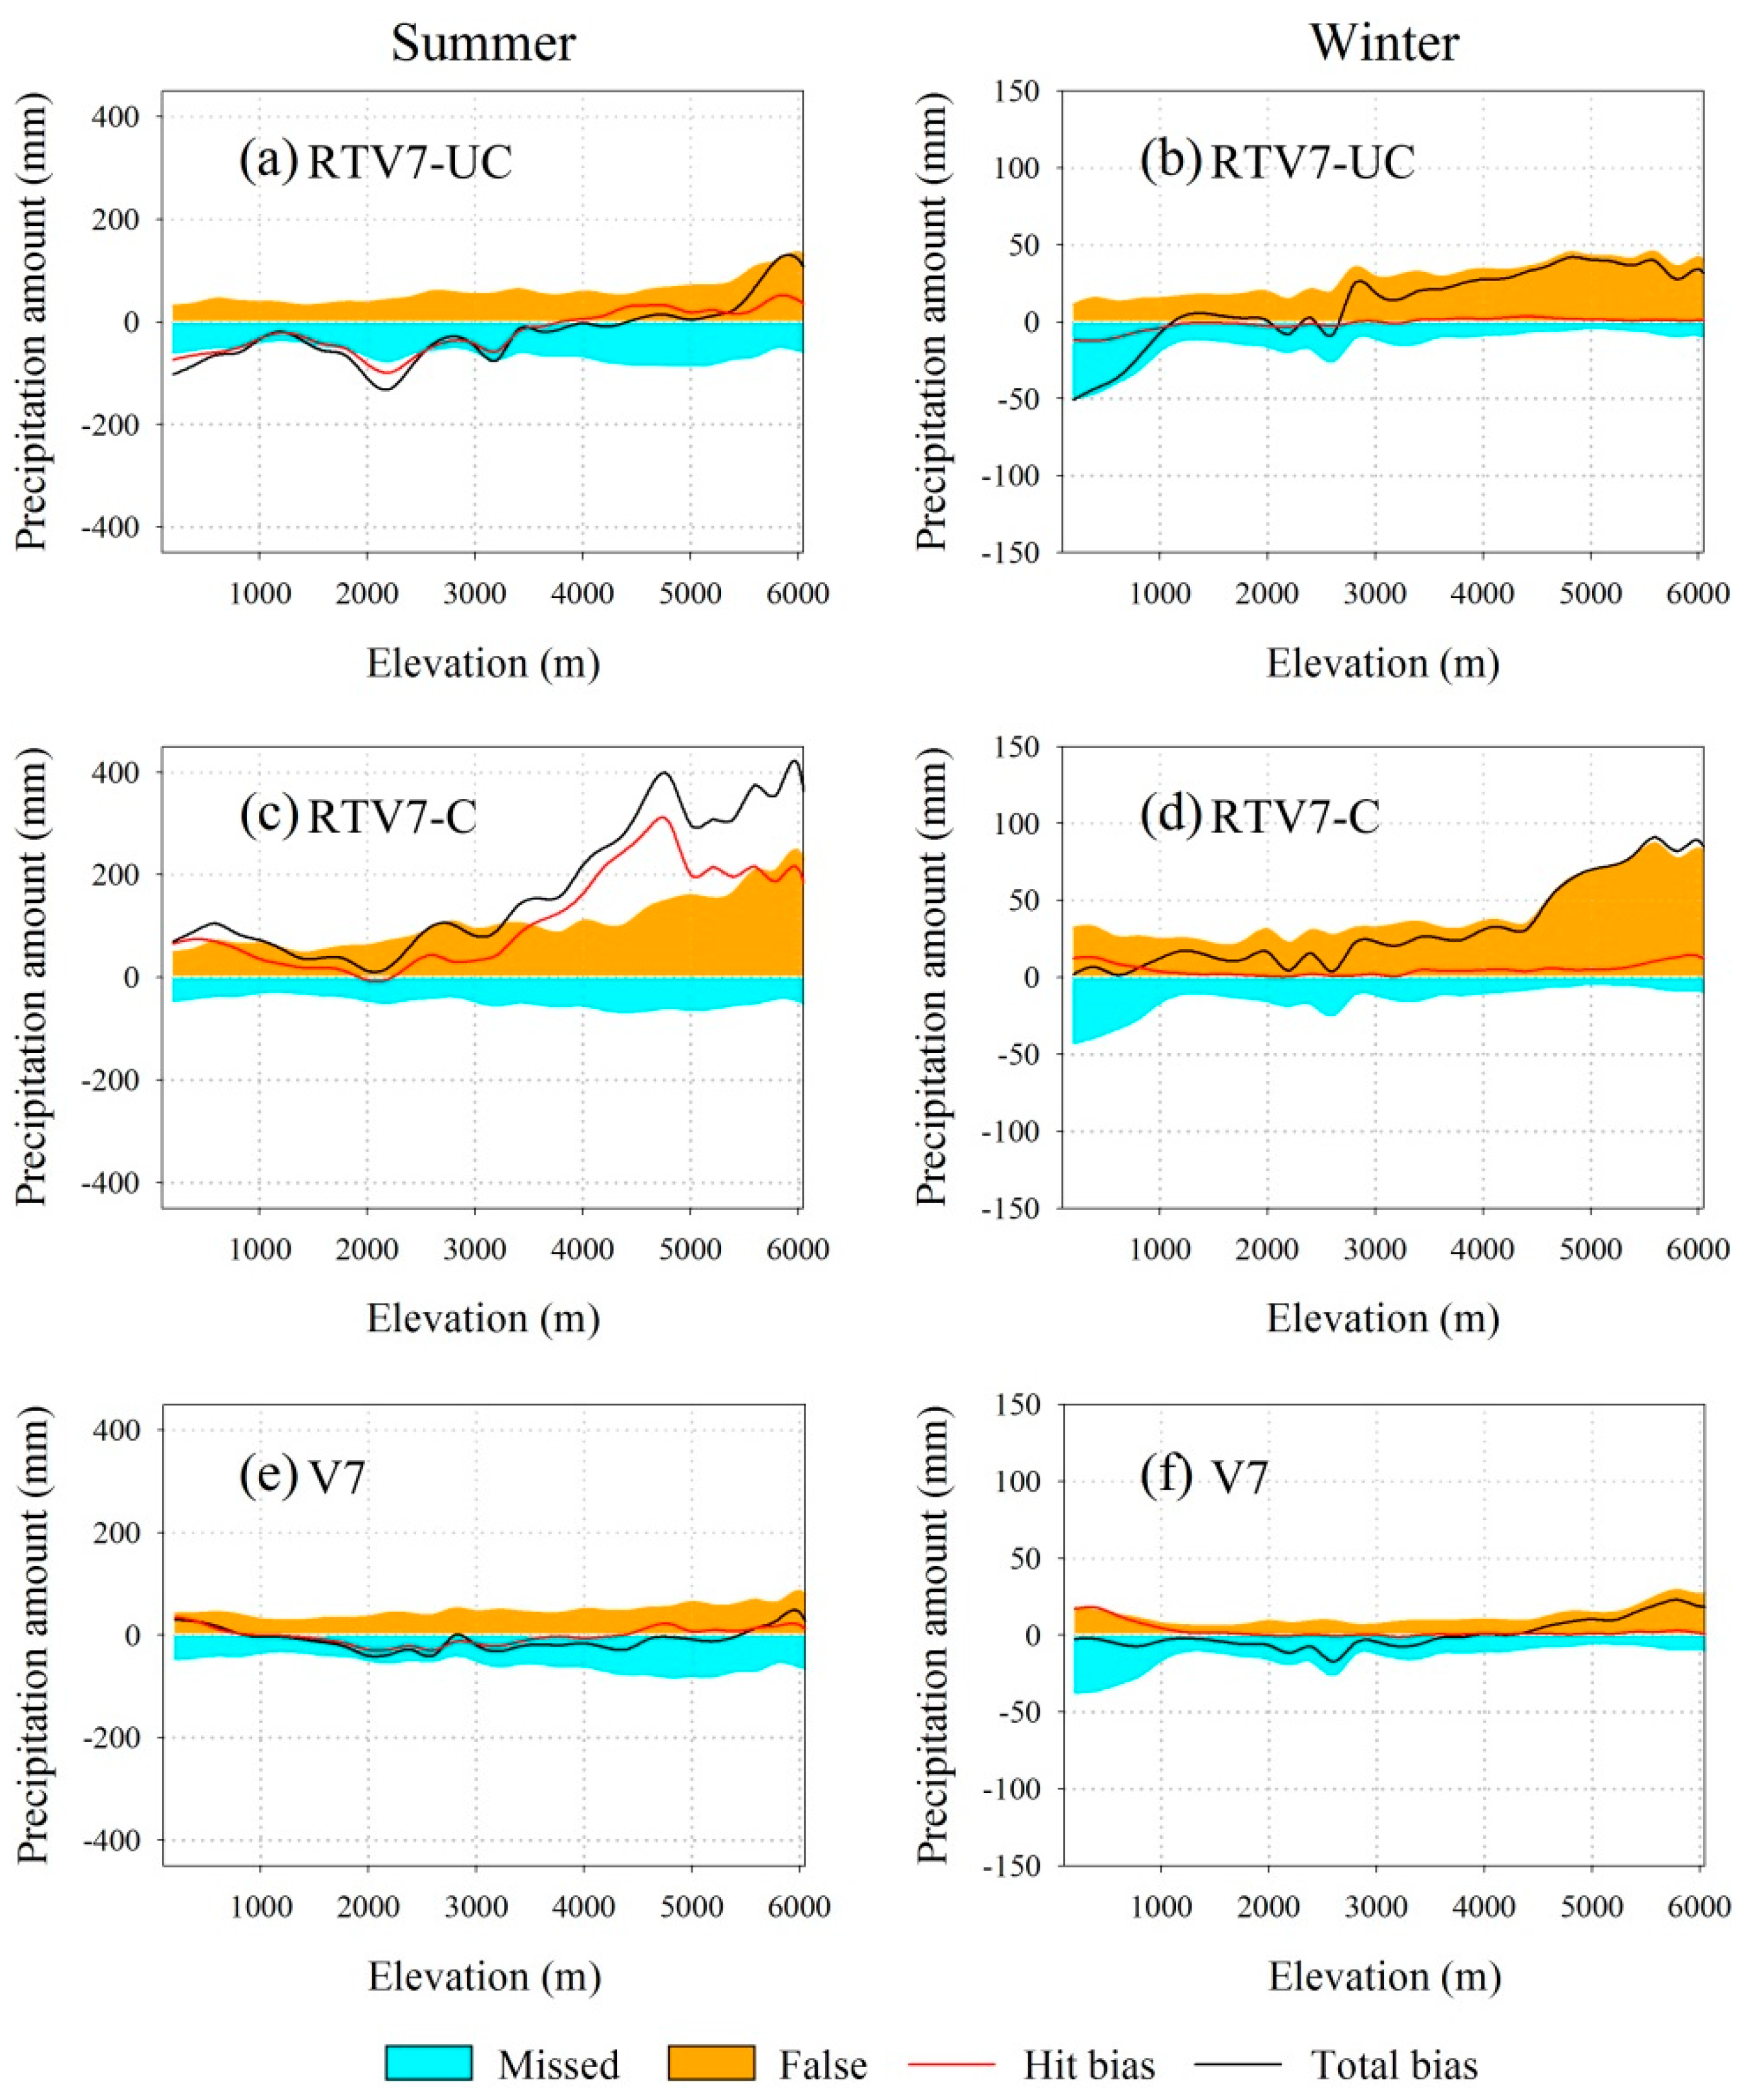
3.1. Spatial Analysis of Error Components
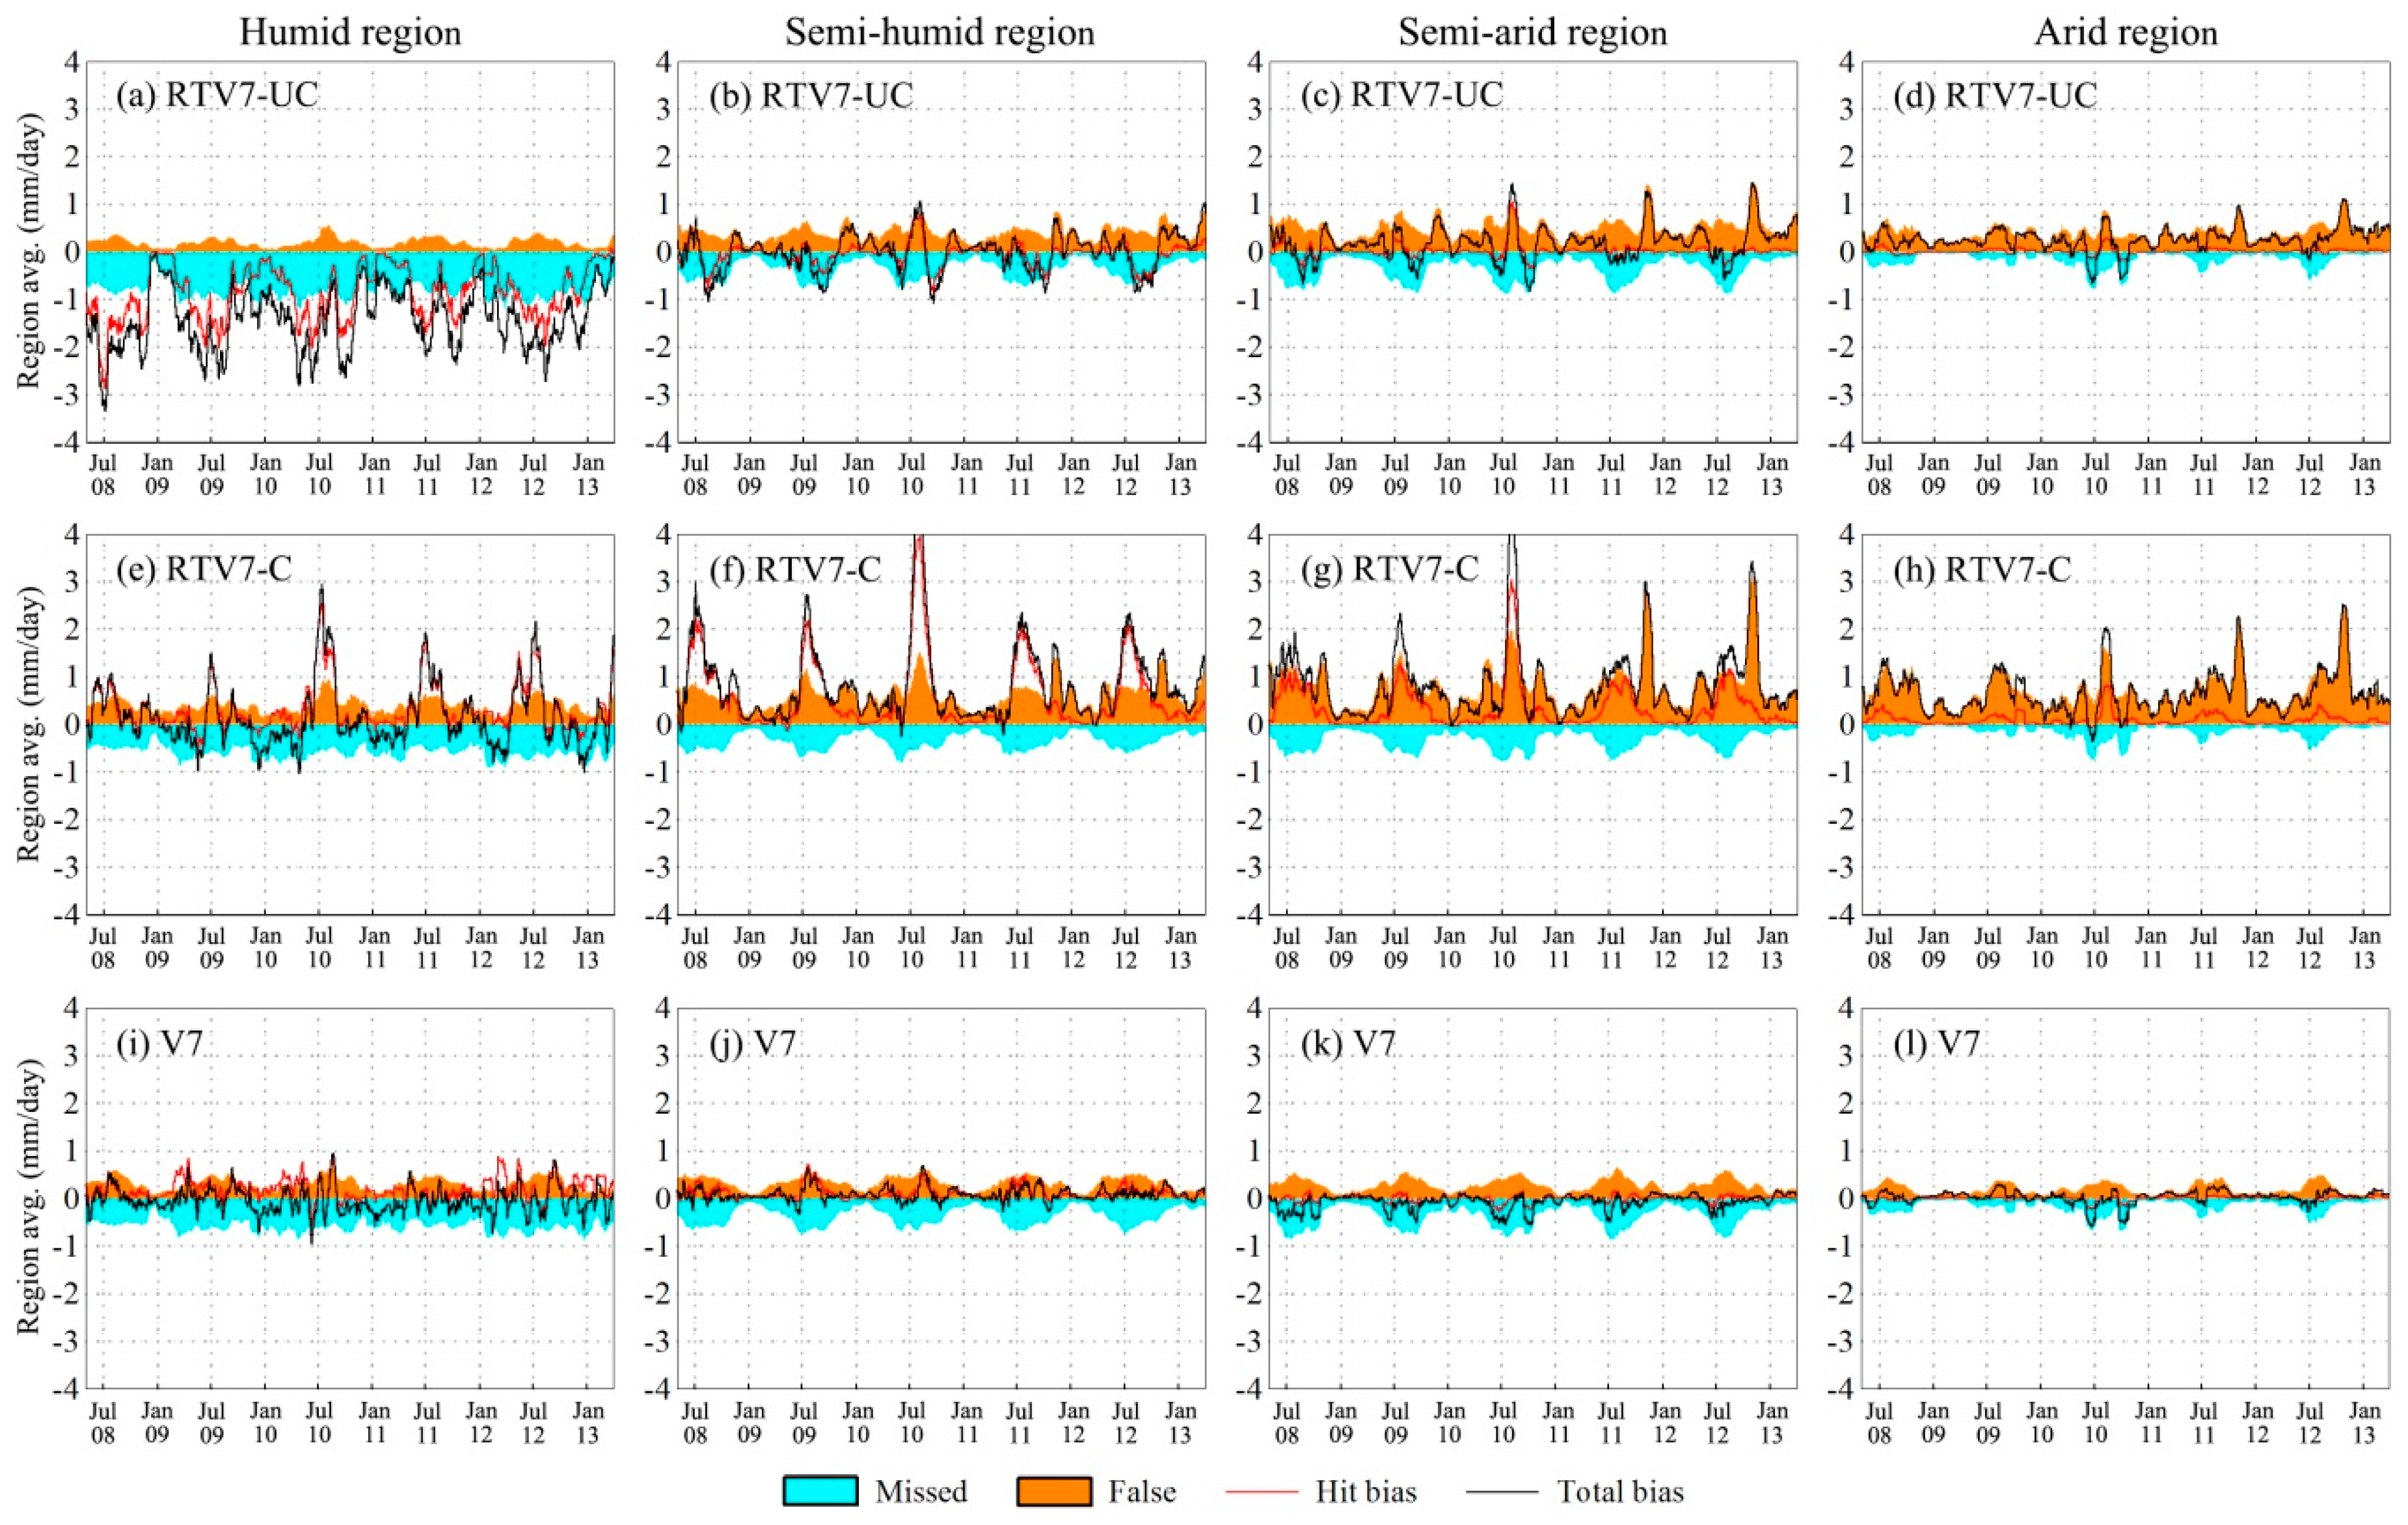
3.2. Temporal Analysis of Error Components
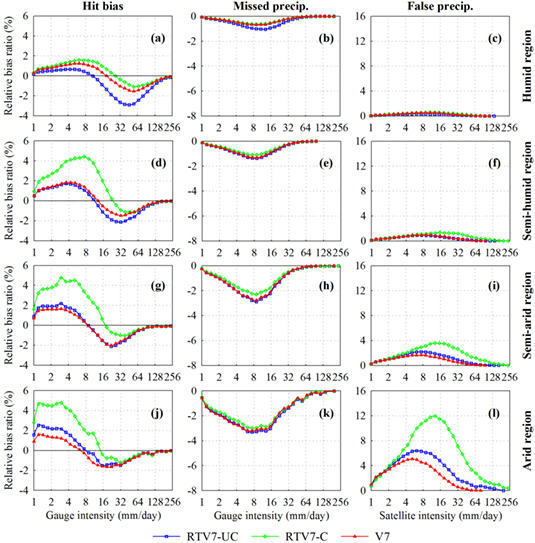
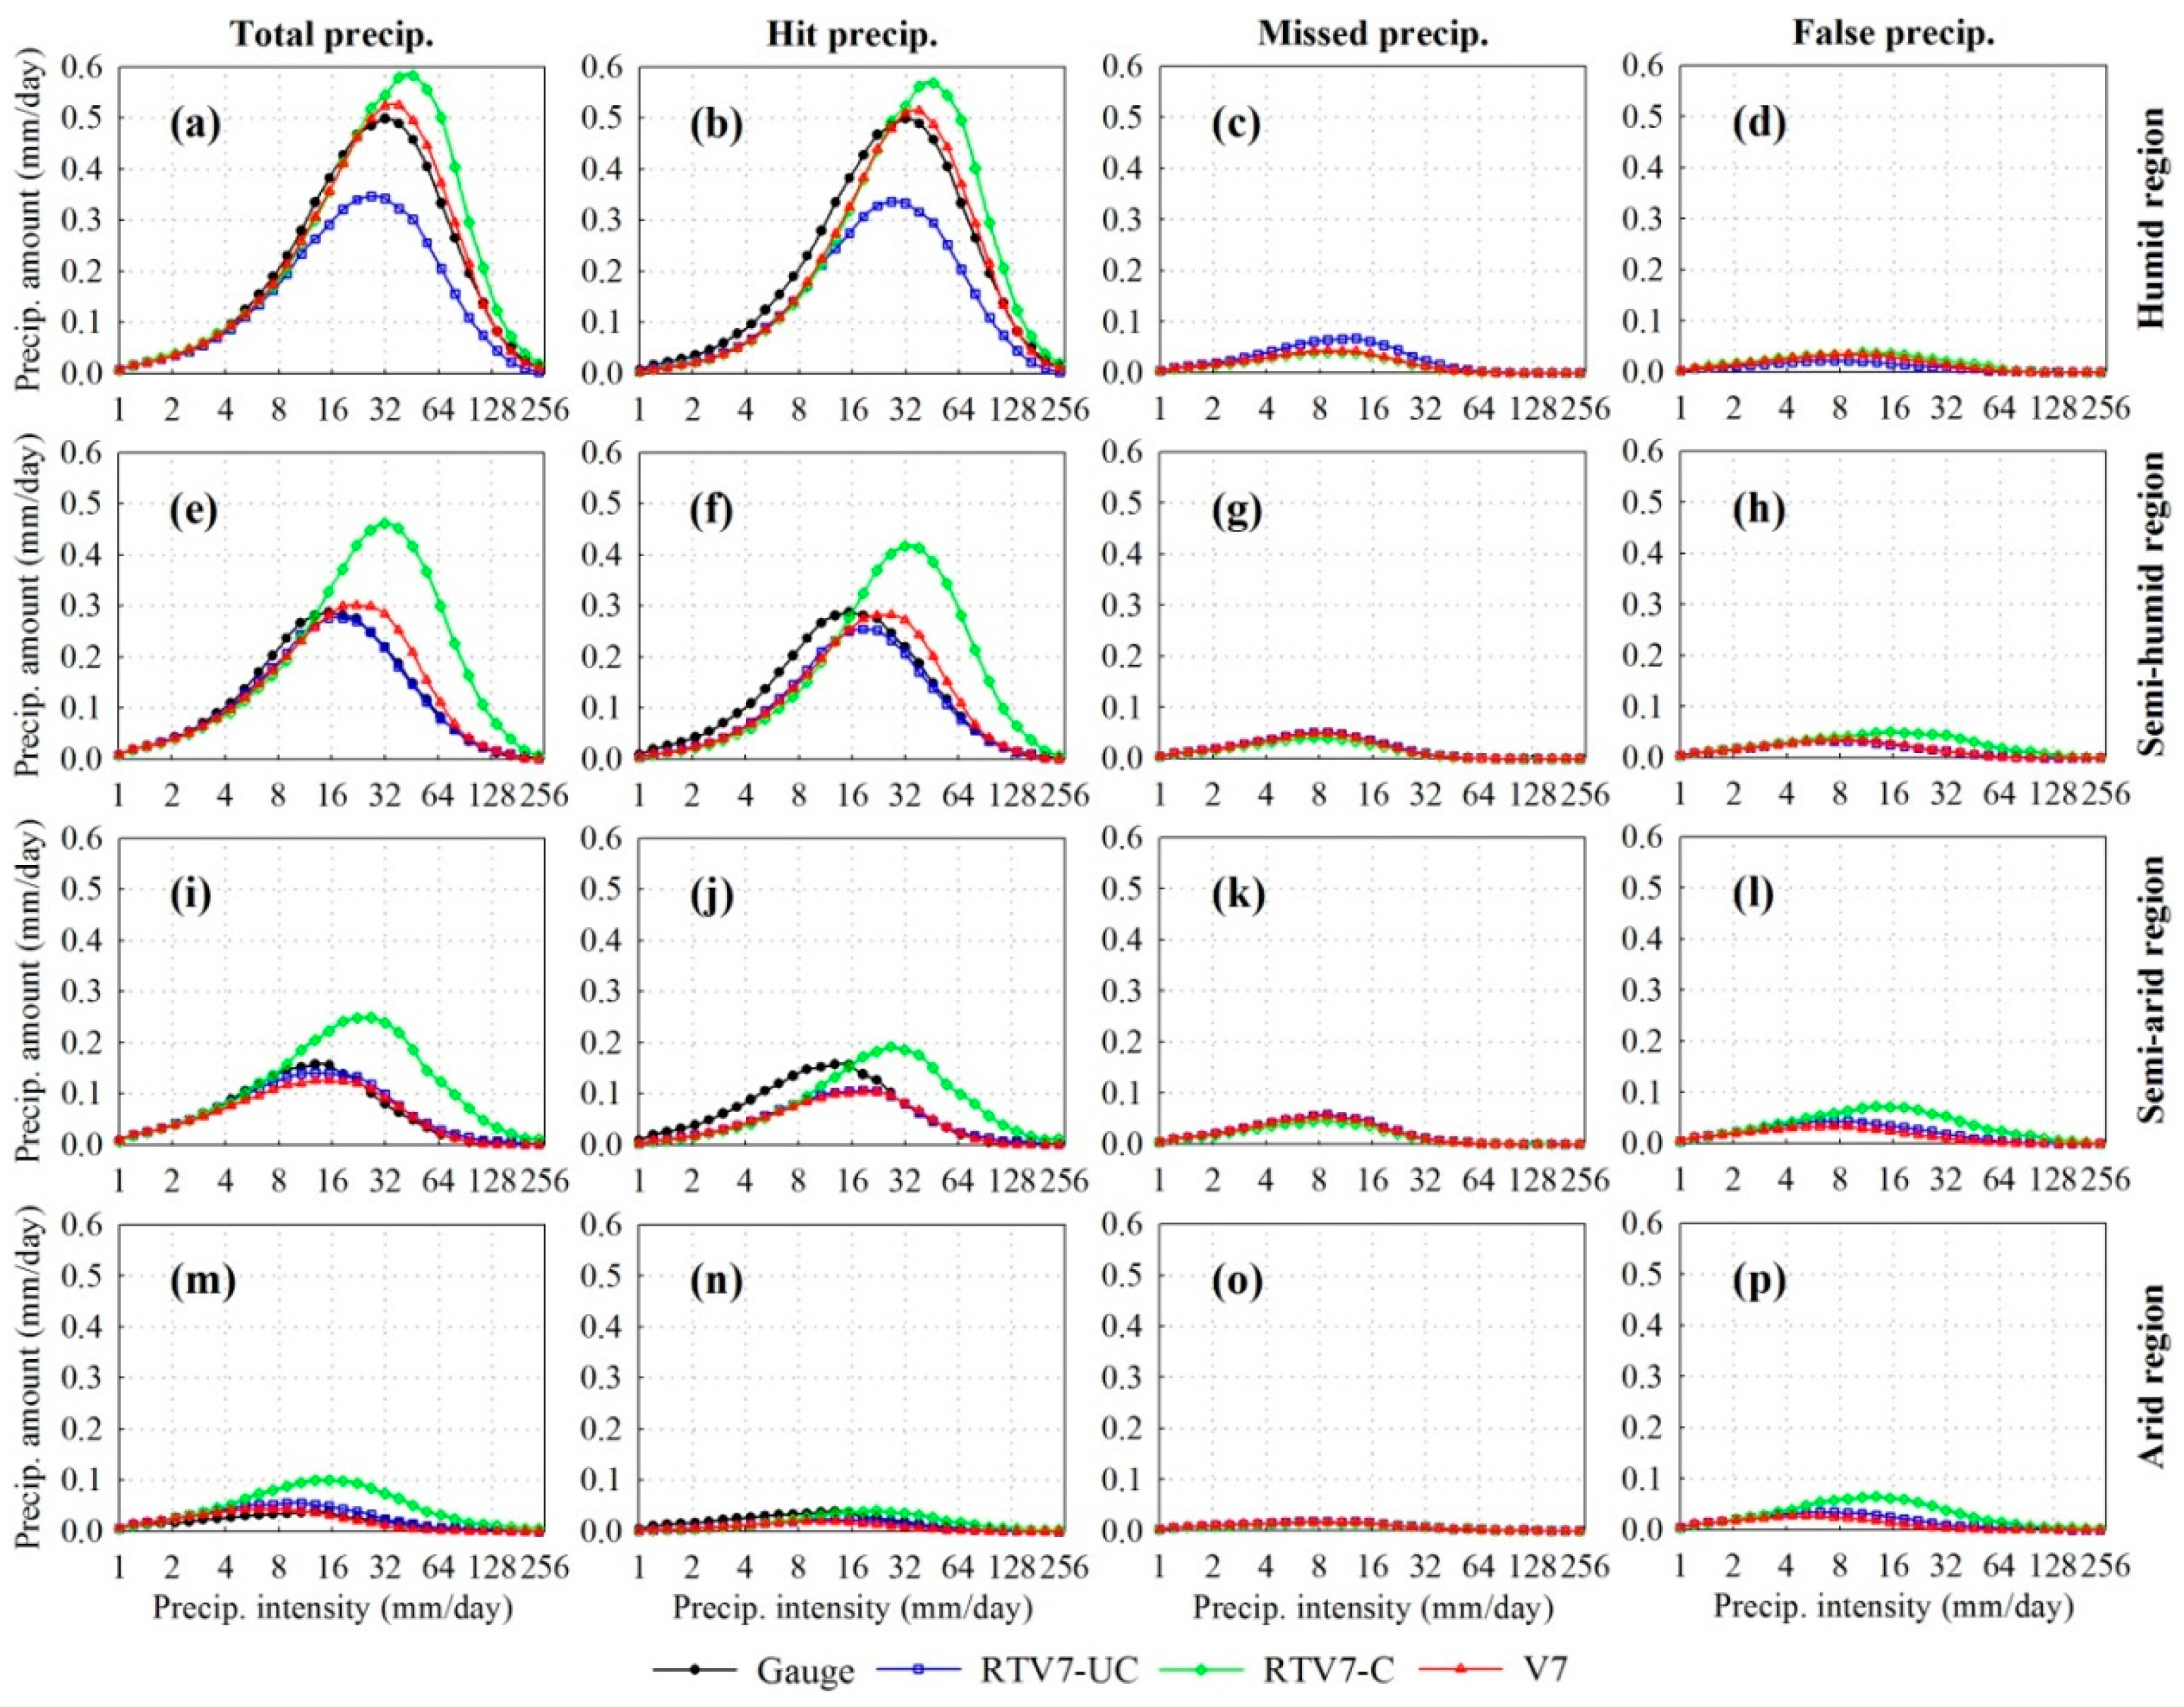
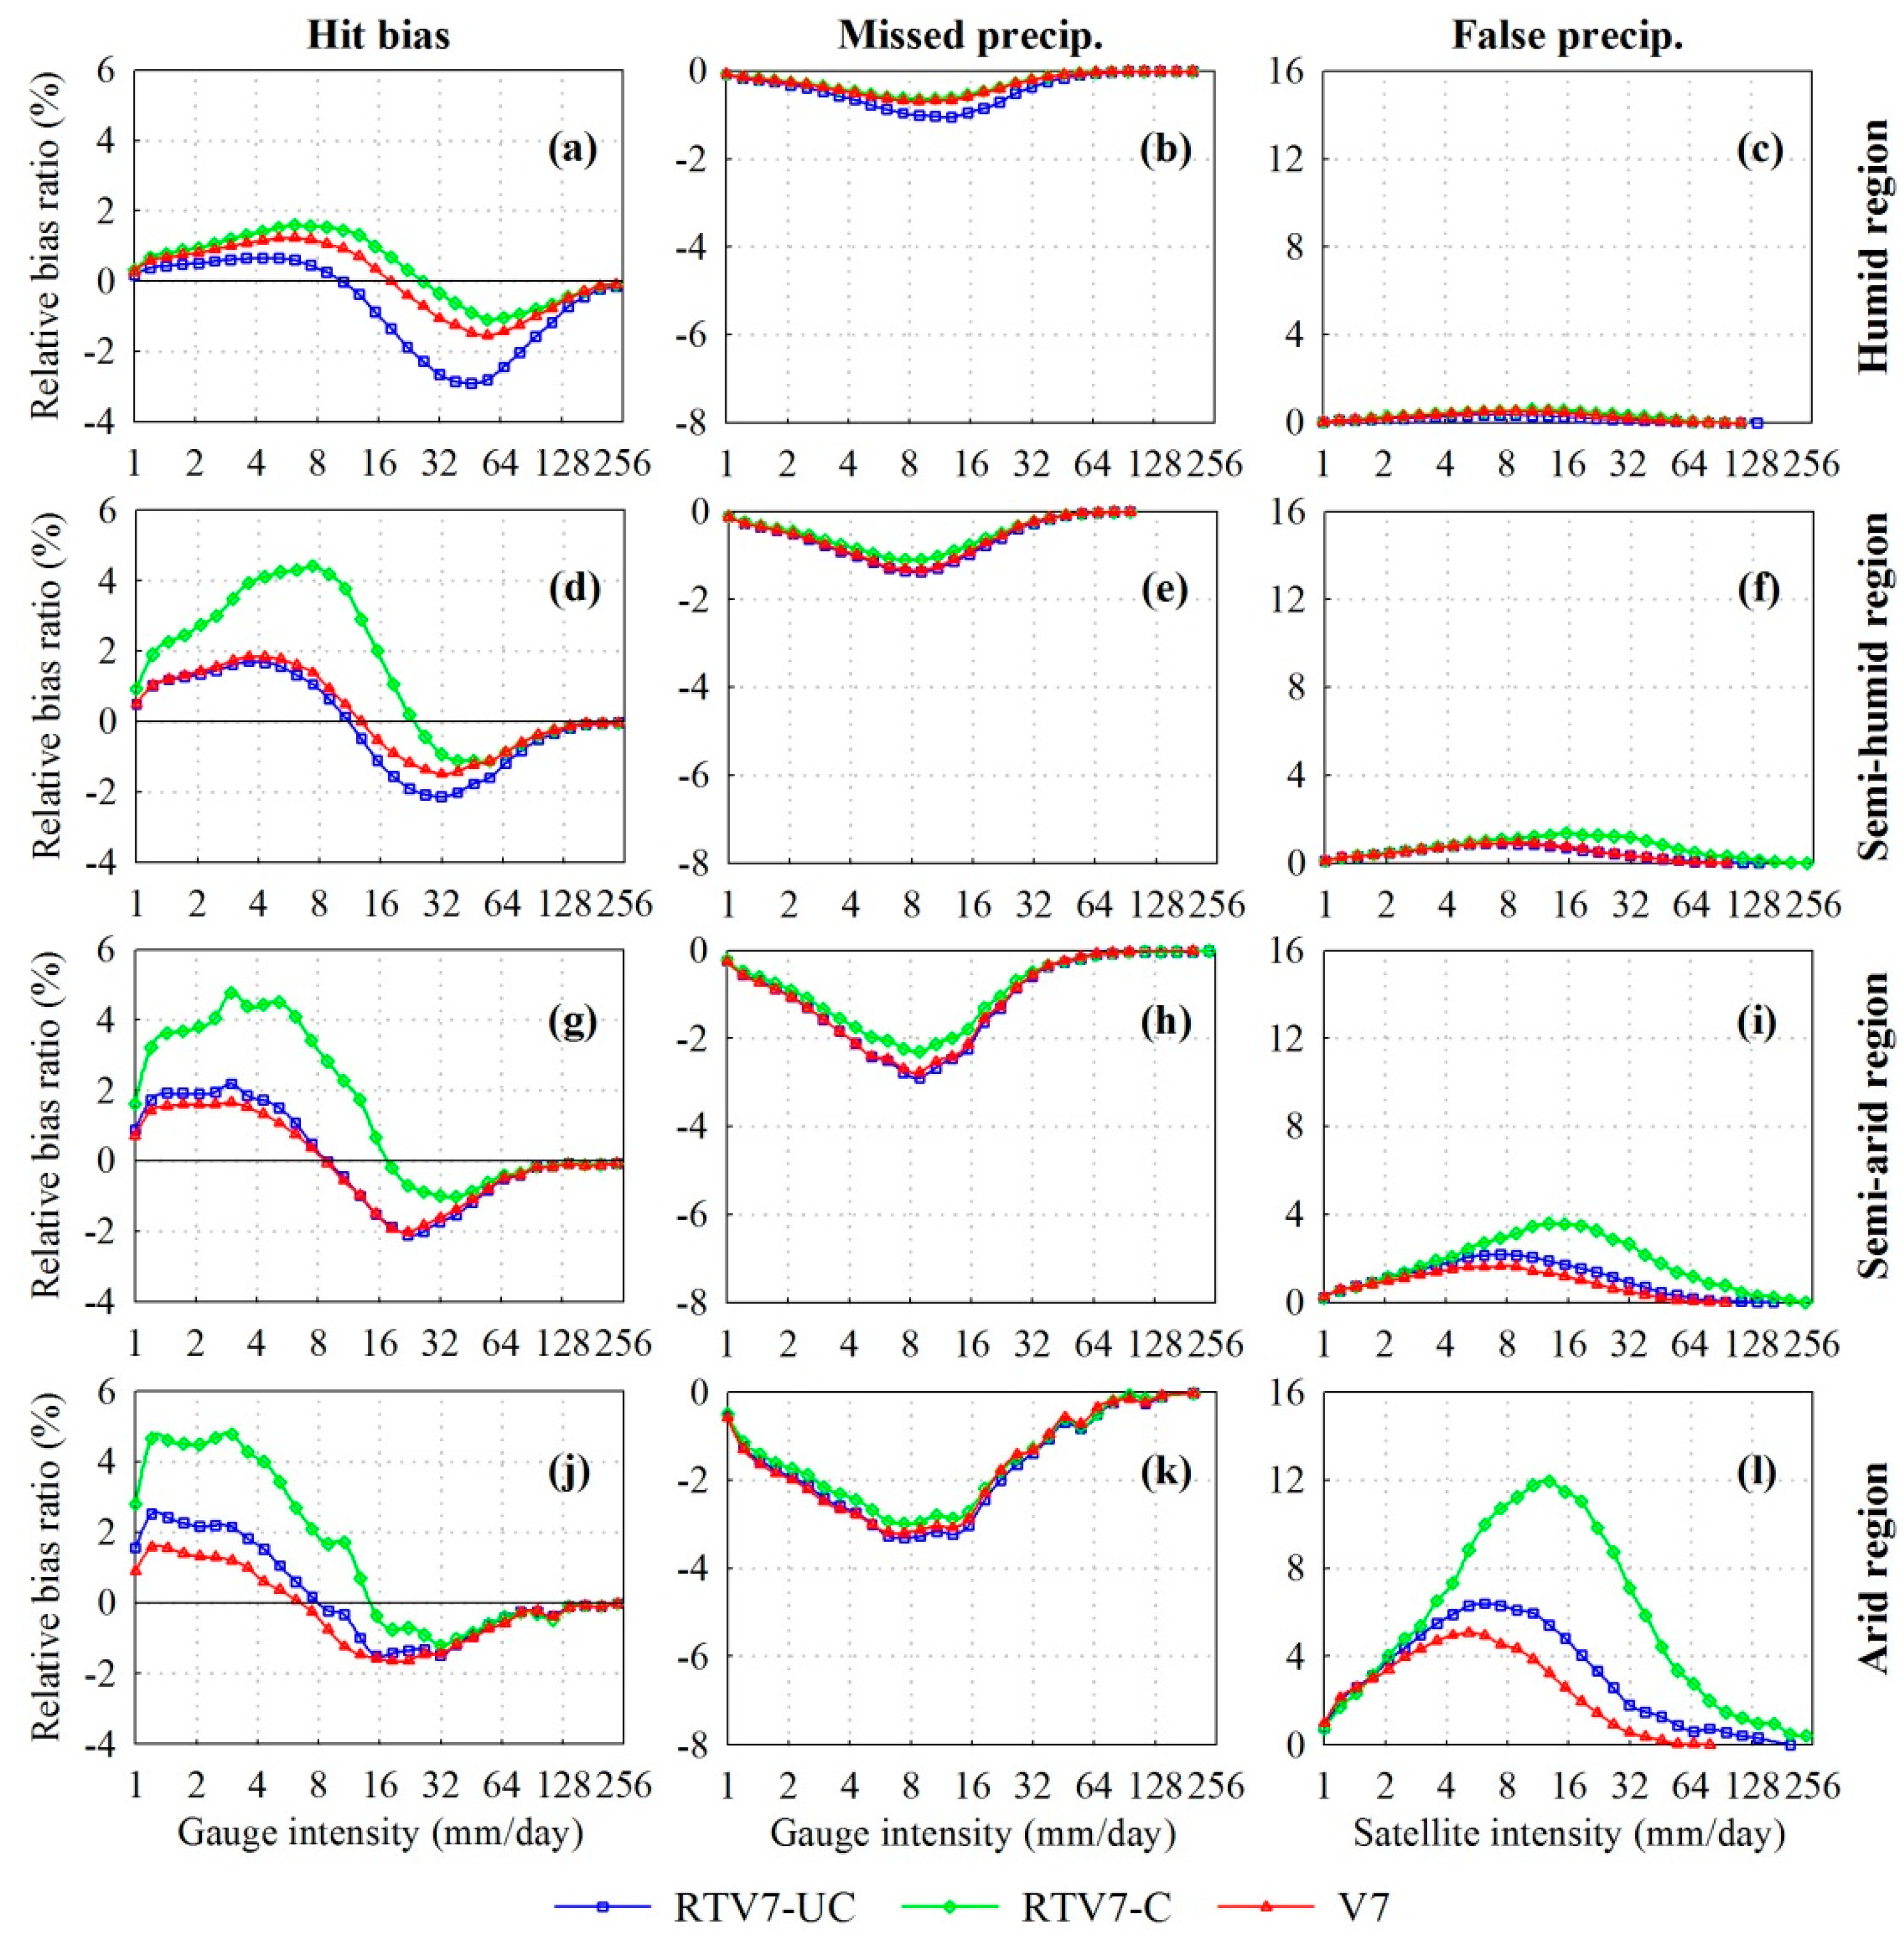
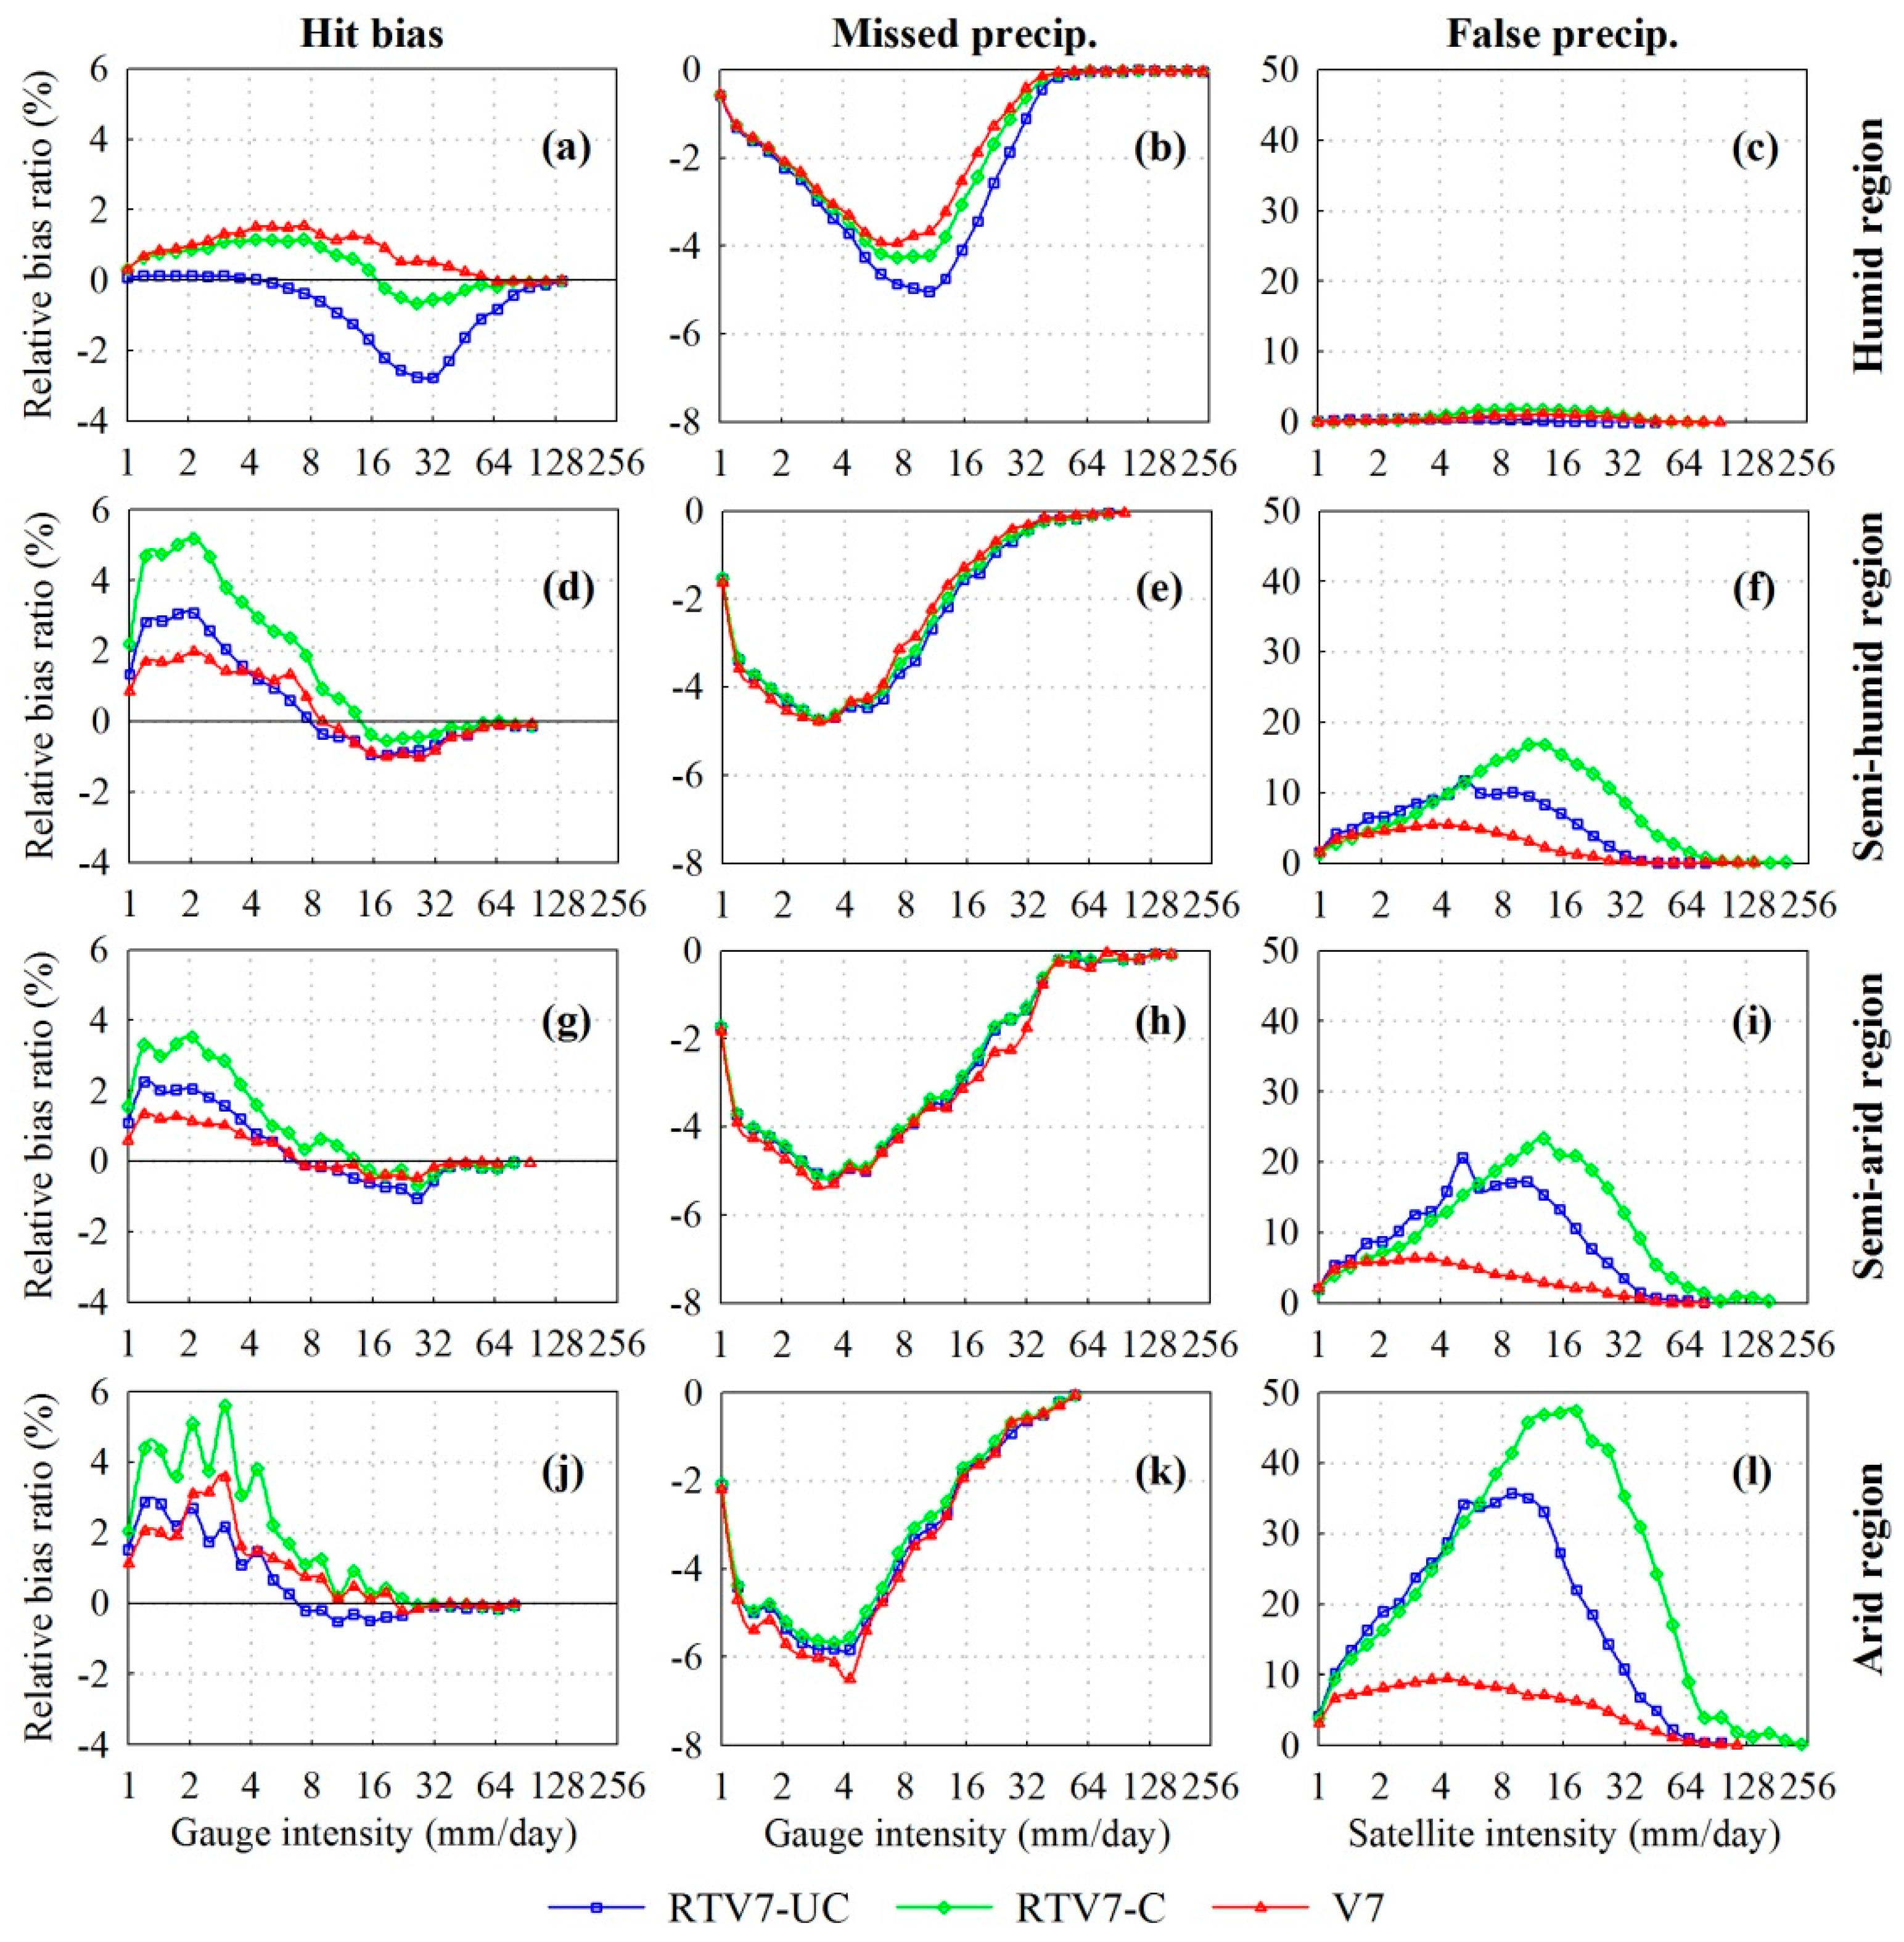
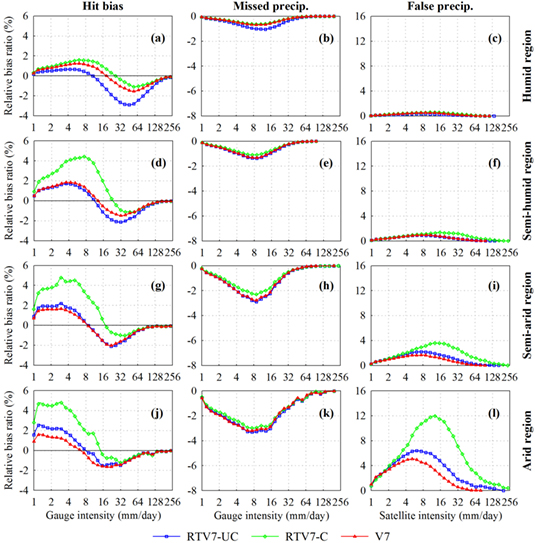
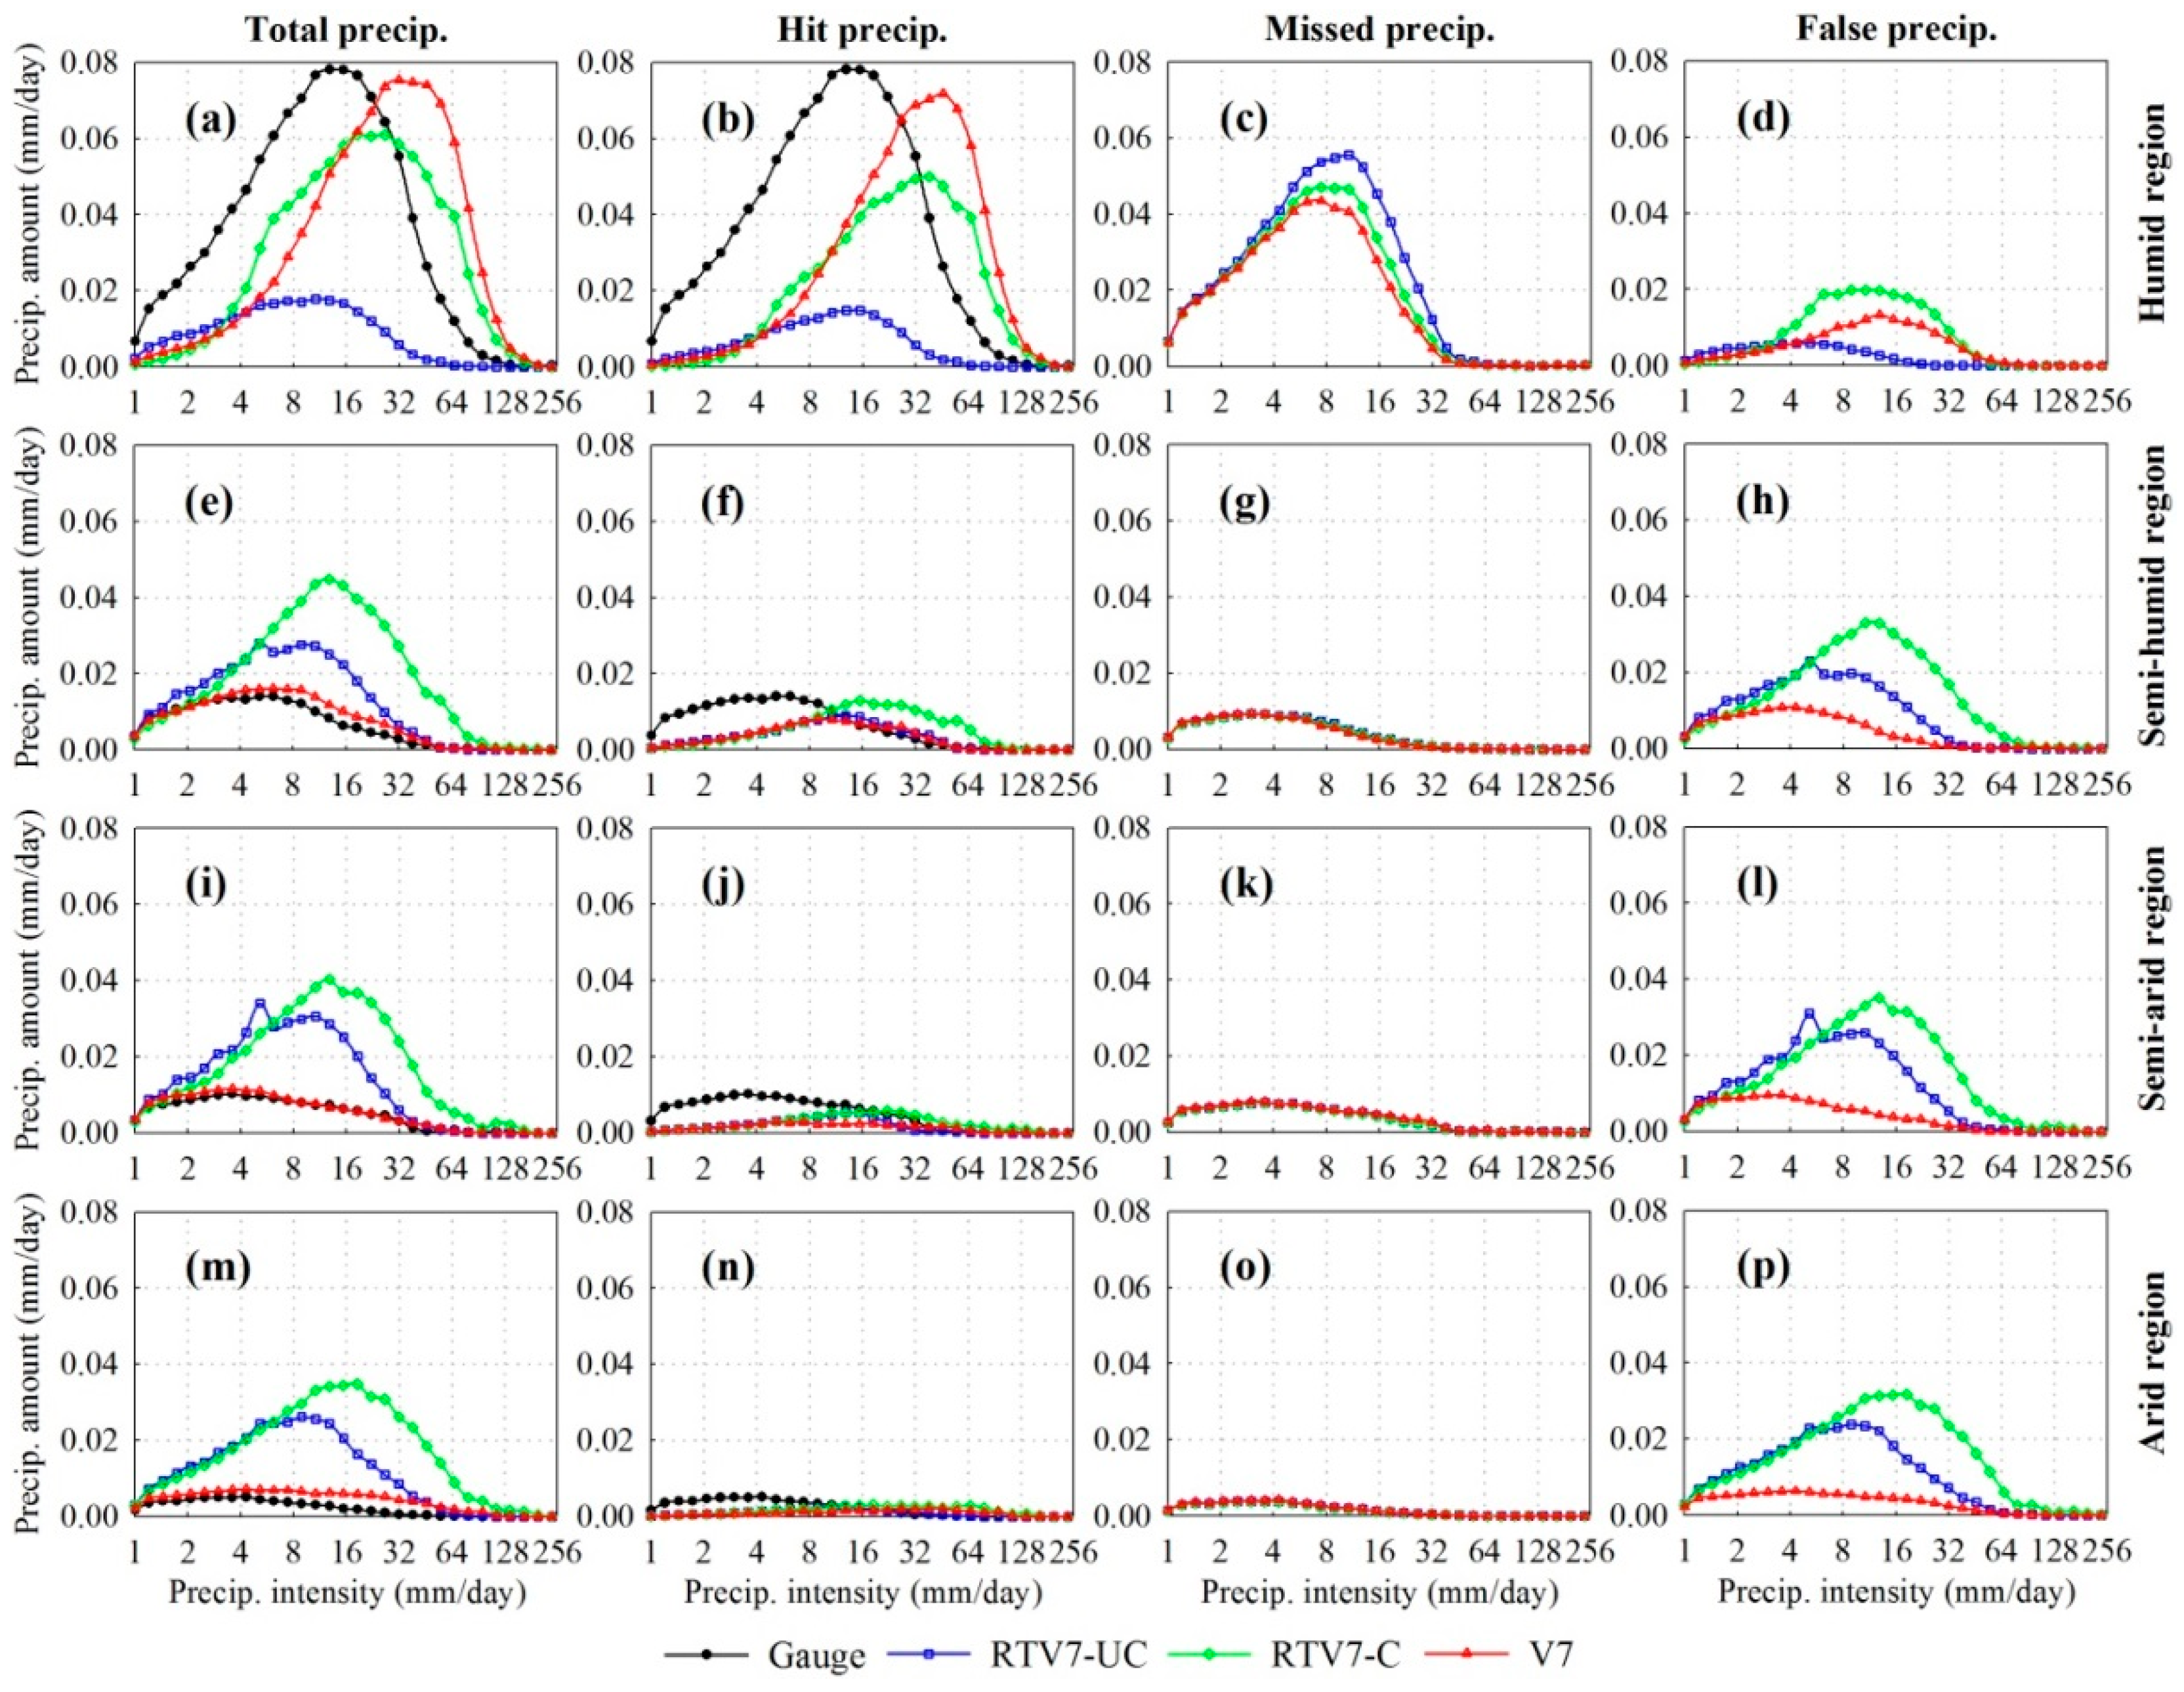
3.3. Intensity Distribution of Error Components
3.4. Contribution Ratio of Error Components
4. Conclusions and Recommendations
Acknowledgments
Author Contributions
Conflicts of Interest
Appendix A: Improving Error-component Analysis with Relative Bias Ratio (RBR)
References
- Zhai, P.; Zhang, X.; Wan, H.; Pan, X. Trends in Total Precipitation and Frequency of Daily Precipitation Extremes over China. J. Clim. 2005, 18, 1096–1108. [Google Scholar] [CrossRef]
- Piao, S.; Ciais, P.; Huang, Y.; Shen, Z.; Peng, S.; Li, J.; Zhou, L.; Liu, H.; Ma, Y.; Ding, Y.; et al. The impacts of climate change on water resources and agriculture in China. Nature 2010, 467, 43–51. [Google Scholar] [CrossRef] [PubMed]
- Ma, S.; Zhou, T. Observed trends in the timing of wet and dry season in China and the associated changes in frequency and duration of daily precipitation. Int. J. Climatol. 2015, 35, 4631–4641. [Google Scholar] [CrossRef]
- Yong, B.; Liu, D.; Gourley, J.J.; Tian, Y.; Huffman, G.J.; Ren, L.; Hong, Y. Global View Of Real-Time TRMM Multisatellite Precipitation Analysis: Implications For Its Successor Global Precipitation Measurement Mission. Bull. Am. Meteorol. Soc. 2015, 96, 283–296. [Google Scholar] [CrossRef]
- Huffman, G.J.; Bolvin, D.T.; Nelkin, E.J.; Wolff, D.B.; Adler, R.F.; Gu, G.; Hong, Y.; Bowman, K.P.; Stocker, E.F. The TRMM Multisatellite Precipitation Analysis (TMPA): Quasi-Global, Multiyear, Combined-Sensor Precipitation Estimates at Fine Scales. J. Hydrometeorol. 2007, 8, 38–55. [Google Scholar] [CrossRef]
- Huffman, G.J.; Bolvin, D.T.; Nelkin, E.J.; Adler, R.F. Highlights of the Version 7 TRMM Multi-satellite Precipitation Analysis (TMPA). In Proceedings of the 5th International Precipitation Working Group Workshop, Hamburg, Germany, 11–15 October 2010; pp. 11–15.
- Yong, B.; Ren, L.; Hong, Y.; Wang, J.; Gourley, J.J.; Jiang, S.; Chen, X.; Wang, W. Hydrologic evaluation of Multisatellite Precipitation Analysis standard precipitation products in basins beyond its inclined latitude band: A case study in Laohahe basin, China. Water Resour. Res. 2010, 46. [Google Scholar] [CrossRef]
- Huang, Y.; Chen, S.; Cao, Q.; Hong, Y.; Wu, B.; Huang, M.; Qiao, L.; Zhang, Z.; Li, Z.; Li, W.; et al. Evaluation of Version-7 TRMM Multi-Satellite Precipitation Analysis Product during the Beijing Extreme Heavy Rainfall Event of 21 July 2012. Water 2013, 6, 32–44. [Google Scholar] [CrossRef]
- Li, Z.; Yang, D.; Hong, Y. Multi-scale evaluation of high-resolution multi-sensor blended global precipitation products over the Yangtze River. J. Hydrol. 2013, 500, 157–169. [Google Scholar] [CrossRef]
- Chen, S.; Hong, Y.; Cao, Q.; Gourley, J.J.; Kirstetter, P.-E.; Yong, B.; Tian, Y.; Zhang, Z.; Shen, Y.; Hu, J.; Hardy, J. Similarity and difference of the two successive V6 and V7 TRMM multisatellite precipitation analysis performance over China. J. Geophys. Res. 2013, 118, 13060–13074. [Google Scholar] [CrossRef]
- Zhao, T.; Yatagai, A. Evaluation of TRMM 3B42 product using a new gauge-based analysis of daily precipitation over China. Int. J. Climatol. 2014, 34, 2749–2762. [Google Scholar] [CrossRef]
- Yang, X.; Yong, B.; Hong, Y.; Chen, S.; Zhang, X. Error analysis of multi-satellite precipitation estimates with an independent raingauge observation network over a medium-sized humid basin. Hydrol. Sci. J. 2015. [Google Scholar] [CrossRef]
- Zhang, X.; Tang, Q. Combining satellite precipitation and long-term ground observations for hydrological monitoring in China. J. Geophys. Res. Atmos. 2015, 120, 6426–6443. [Google Scholar] [CrossRef]
- Bellerby, T.J.; Sun, J. Probabilistic and ensemble representations of the uncertainty in an IR/Microwave satellite precipitation product. J. Hydrometeorol. 2005, 6, 1032–1044. [Google Scholar] [CrossRef]
- Ebert, E.E.; Janowiak, J.E.; Kidd, C. Comparison of Near-Real-Time Precipitation Estimates from Satellite Observations and Numerical Models. Bull. Am. Meteorol. Soc. 2007, 88, 47–64. [Google Scholar] [CrossRef]
- Tian, Y.; Peters-Lidard, C.D.; Choudhury, B.J.; Garcia, M. Multitemporal Analysis of TRMM-Based Satellite Precipitation Products for Land Data Assimilation Applications. J. Hydrometeorol. 2007, 8, 1165–1183. [Google Scholar] [CrossRef]
- Turk, F.J.; Arkin, P.; Sapiano, M.R.P.; Ebert, E.E. Evaluating High-Resolution Precipitation Products. Bull. Am. Meteorol. Soc. 2008, 89, 1911–1916. [Google Scholar] [CrossRef]
- Clarke, R.T.; Bulhoes Mendes, C.A.; Costa Buarque, D. A comparison of extreme rainfall characteristics in the Brazilian Amazon derived from two gridded data sets and a national rain gauge network. J. Geophys. Res. Atmos. 2010, 115. [Google Scholar] [CrossRef]
- Gourley, J.J.; Hong, Y.; Flamig, Z.L.; Li, L.; Wang, J. Intercomparison of Rainfall Estimates from Radar, Satellite, Gauge, and Combinations for a Season of Record Rainfall. J. Appl. Meteorol. Climatol. 2010, 49, 437–452. [Google Scholar] [CrossRef]
- Scheel, M.L.M.; Rohrer, M.; Huggel, C.; Santos Villar, D.; Silvestre, E.; Huffman, G.J. Evaluation of TRMM Multi-satellite Precipitation Analysis (TMPA) performance in the Central Andes region and its dependency on spatial and temporal resolution. Hydrol. Earth Syst. Sci. 2011, 15, 2649–2663. [Google Scholar] [CrossRef] [Green Version]
- Sorooshian, S.; AghaKouchak, A.; Arkin, P.; Eylander, J.; Foufoula-Georgiou, E.; Harmon, R.; Hendrickx, J.M.H.; Imam, B.; Kuugowski, R.; Skahill, B.; et al. Advanced Concepts on Remote Sensing of Precipitation at Multiple Scales. Bull. Am. Meteorol. Soc. 2011, 92, 1353–1357. [Google Scholar] [CrossRef]
- Ward, E.; Buytaert, W.; Peaver, L.; Wheater, H. Evaluation of precipitation products over complex mountainous terrain: A water resources perspective. Adv. Water Res. 2011, 34, 1222–1231. [Google Scholar] [CrossRef]
- Chen, S.; Hong, Y.; Gourley, J.J.; Huffman, G.J.; Tian, Y.D.; Cao, Q.; Yong, B.; Kirstetter, P.-E.; Hu, J.; Hardy, J.; et al. Evaluation of the successive V6 and V7 TRMM multisatellite precipitation analysis over the Continental United States. Water Resour. Res. 2013, 49, 8174–8186. [Google Scholar] [CrossRef]
- Xue, X.; Hong, Y.; Limaye, A.S.; Gourley, J.J.; Huffman, G.J.; Khan, S.I.; Dorji, C.; Chen, S. Statistical and hydrological evaluation of TRMM-based Multi-satellite Precipitation Analysis over the Wangchu Basin of Bhutan: Are the latest satellite precipitation products 3B42V7 ready for use in ungauged basins? J. Hydrol. 2013, 499, 91–99. [Google Scholar] [CrossRef]
- Zulkafli, Z.; Buytaert, W.; Onof, C.; Manz, B.; Tarnavsky, E.; Lavado, W.; Guyot, J.-L. A Comparative Performance Analysis of TRMM 3B42 (TMPA) Versions 6 and 7 for Hydrological Applications over Andean–Amazon River Basins. J. Hydrometeorol. 2014, 15, 581–592. [Google Scholar] [CrossRef]
- Tian, Y.; Peters-Lidard, C.D.; Eylander, J.B.; Joyce, R.J.; Huffman, G.J.; Adler, R.F.; Hsu, K.-L.; Turk, F.J.; Garcia, M.; Zeng, J. Component analysis of errors in satellite-based precipitation estimates. J. Geophys. Res. Atmos. 2009, 114. [Google Scholar] [CrossRef]
- Yong, B.; Hong, Y.; Ren, L.; Gourley, J.J.; Huffman, G.J.; Chen, X.; Wang, W.; Khan, S.I. Assessment of evolving TRMM-based multisatellite real-time precipitation estimation methods and their impacts on hydrologic prediction in a high latitude basin. J. Geophys. Res. 2012, 117. [Google Scholar] [CrossRef]
- Yong, B.; Ren, L.; Hong, Y.; Gourley, J.J.; Tian, Y.; Huffman, G.J.; Chen, X.; Wang, W.; Wen, Y. First evaluation of the climatological calibration algorithm in the real-time TMPA precipitation estimates over two basins at high and low latitudes. Water Resour. Res. 2013, 49, 2461–2472. [Google Scholar] [CrossRef]
- Shen, Y.; Xiong, A. Validation and comparison of a new gauge-based precipitation analysis over mainland China. Int. J. Climatol. 2016, 36, 252–265. [Google Scholar] [CrossRef]
- Xie, P.; Chen, M.; Yang, S.; Yatagai, A.; Hayasaka, T.; Fukushima, Y.; Liu, C. A Gauge-Based Analysis of Daily Precipitation over East Asia. J. Hydrometerol. 2007, 8, 607–626. [Google Scholar] [CrossRef]
- Chen, M.; Shi, W.; Xie, P.; Silva, V.B.S.; Kousky, V.E.; Wayne Higgins, R.; Janowiak, J.E. Assessing objective techniques for gauge-based analyses of global daily precipitation. J. Geophys. Res. 2008, 113. [Google Scholar] [CrossRef]
- Zou, X.; Zhai, P.; Zhang, Q. Variations in droughts over China: 1951–2003. Geophys. Res. Lett. 2005, 32. [Google Scholar] [CrossRef]
- Qian, W.; Lin, X. Regional trends in recent precipitation indices in China. Meteorol. Atmos. Phys. 2005, 90, 193–207. [Google Scholar] [CrossRef]
- Zhou, T.; Yu, R.; Chen, H.; Dai, A.; Pan, Y. Summer Precipitation Frequency, Intensity, and Diurnal Cycle over China: A Comparison of Satellite Data with Rain Gauge Observations. J. Clim. 2008, 21, 3997–4010. [Google Scholar] [CrossRef]
- Shen, Y.; Xiong, A.; Wang, Y.; Xie, P. Performance of high-resolution satellite precipitation products over China. J. Geophys. Res. Atmos. 2010, 115. [Google Scholar] [CrossRef]
- Gebregiorgis, A.S.; Tian, Y.; Peters-Lidard, C.D.; Hossain, F. Tracing hydrologic model simulation error as a function of satellite rainfall estimation bias components and land use and land cover conditions. Water Resour. Res. 2012, 48. [Google Scholar] [CrossRef]
- Wilks, D.S. Statistical Methods in the Atmospheric Sciences; Academic Press: San Diego, CA, USA, 1995. [Google Scholar]
- Dai, A.G. Precipitation Characteristics in Eighteen Coupled Climate Models. J. Clim. 2006, 19, 4605–4630. [Google Scholar] [CrossRef]
- Dai, A.G.; Lin, X.; Hsu, K.-L. The frequency, intensity, and diurnal cycle of precipitation in surface and satellite observations over low- and mid-latitudes. Clim. Dyn. 2007, 29, 727–744. [Google Scholar] [CrossRef]
- Krakauer, N.Y.; Pradhanang, S.M.; Panthi, J.; Lakhankar, T.; Jha, A.K. Probabilistic Precipitation Estimation with a Satellite Product. Climate 2015, 3, 329–348. [Google Scholar] [CrossRef]
- Krakauer, N.Y.; Pradhanang, S.M.; Lakhankar, T.; Jha, A.K. Evaluating Satellite Products for Precipitation Estimation in Mountain Regions: A Case Study for Nepal. Remote Sens. 2013, 5, 4107–4123. [Google Scholar] [CrossRef]
- McCollum, J.R.; Krajewski, W.F.; Ferraro, R.R.; Ba, M.B. Evaluation of biases of satellite rainfall estimation algorithms over the Continental United States. J. Appl. Meteorol. 2002, 41, 1065–1080. [Google Scholar] [CrossRef]
- Tang, L.; Tian, Y.; Lin, X. Validation of precipitation retrievals from satellite-based passive microwave sensors. J. Geophys. Res. Atmos. 2014, 119, 4546–4567. [Google Scholar] [CrossRef]
- Yong, B.; Chen, B.; Gourley, J.J.; Ren, L.; Hong, Y.; Chen, X.; Wang, W.; Chen, S.; Gong, L. Intercomparison of the Version-6 and Version-7 TMPA precipitation products over high and low latitudes basins with independent gauge networks: Is the newer version better in both real-time and post-real-time analysis for water resources and hydrologic extremes? J. Hydrol. 2014, 508, 77–87. [Google Scholar]
- You, Y.; Liu, G. The relationship between surface rainrate and water paths and its implications to satellite rainrate retrieval. J. Geophys. Res. Atmos. 2012, 117. [Google Scholar] [CrossRef]
- Kummerow, C.D.; Ringerud, S.; Crook, J.; Randel, D.; Berg, W. An Observationally Generated A Priori Database for Microwave Rainfall Retrievals. J. Atmos. Ocean. Technol. 2011, 28, 113–130. [Google Scholar] [CrossRef]


| Climate Region | Product | Summer | Winter | ||||||
|---|---|---|---|---|---|---|---|---|---|
| H (%) | −M (%) | F (%) | E = H − M + F (%) | H (%) | −M (%) | F (%) | E = H − M + F (%) | ||
| Humid Region | RTV7-UC | −20.3 | −12.7 | 4.8 | −28.2 | −21.0 | −62.7 | 6.3 | −77.4 |
| RTV7-C | 12.3 | −8.0 | 8.8 | 13.1 | 10.5 | −53.1 | 21.1 | −21.5 | |
| V7 | 2.2 | −8.6 | 7.3 | 0.9 | 21.5 | −48.3 | 13.5 | −13.3 | |
| Semi-humid Region | RTV7-UC | −1.4 | −16.1 | 12.6 | −4.9 | 15.3 | −61.9 | 138.5 | 91.9 |
| RTV7-C | 44.9 | −13.2 | 21.5 | 53.2 | 42.4 | −59.9 | 214.8 | 197.3 | |
| V7 | 7.1 | −15.4 | 12.8 | 4.5 | 10.3 | −58.9 | 68.0 | 19.4 | |
| Semi-arid Region | RTV7-UC | 3.3 | −33.7 | 31.1 | 0.7 | 10.1 | −74.6 | 229.6 | 165.1 |
| RTV7-C | 46.5 | −27.7 | 54.1 | 72.9 | 25.1 | −73.5 | 297.1 | 248.7 | |
| V7 | −0.2 | −32.8 | 23 | −10.0 | 6.9 | −79.2 | 83.4 | 11.1 | |
| Arid Region | RTV7-UC | 7.4 | −50.4 | 92.6 | 49.6 | 16.3 | −74.8 | 476.4 | 417.9 |
| RTV7-C | 42.8 | −45.2 | 173 | 170.6 | 43.5 | −71.4 | 698.3 | 670.4 | |
| V7 | −5.0 | −49.0 | 64.6 | 10.6 | 24.1 | −78.7 | 152.2 | 97.6 | |
© 2016 by the authors; licensee MDPI, Basel, Switzerland. This article is an open access article distributed under the terms and conditions of the Creative Commons Attribution (CC-BY) license (http://creativecommons.org/licenses/by/4.0/).
Share and Cite
Yong, B.; Chen, B.; Tian, Y.; Yu, Z.; Hong, Y. Error-Component Analysis of TRMM-Based Multi-Satellite Precipitation Estimates over Mainland China. Remote Sens. 2016, 8, 440. https://doi.org/10.3390/rs8050440
Yong B, Chen B, Tian Y, Yu Z, Hong Y. Error-Component Analysis of TRMM-Based Multi-Satellite Precipitation Estimates over Mainland China. Remote Sensing. 2016; 8(5):440. https://doi.org/10.3390/rs8050440
Chicago/Turabian StyleYong, Bin, Bo Chen, Yudong Tian, Zhongbo Yu, and Yang Hong. 2016. "Error-Component Analysis of TRMM-Based Multi-Satellite Precipitation Estimates over Mainland China" Remote Sensing 8, no. 5: 440. https://doi.org/10.3390/rs8050440