Article

Evaluation of the Chinese Fine Spatial Resolution Hyperspectral Satellite TianGong-1 in Urban Land-Cover Classification

1
Department of Geography, University of Connecticut, Storrs, Mansfield, CT 06269, USA
2
State Key Laboratory of Remote Sensing Science, Institute of Remote Sensing and Digital Earth, Chinese Academy of Sciences, Beijing 100101, China
3
Key Laboratory of Water Cycle & Related Land Surface Processes, Institute of Geographic Sciences and Natural Resources, Chinese Academy of Sciences, Beijing 100101, China
4
University of Chinese Academy of Sciences, Beijing 100094, China
*
Authors to whom correspondence should be addressed.
These authors contributed equally to this work.
Remote Sens. 2016, 8(5), 438; https://doi.org/10.3390/rs8050438
Submission received: 24 March 2016 / Revised: 12 May 2016 / Accepted: 18 May 2016 / Published: 21 May 2016

Abstract

:
The successful launch of the Chinese high spatial resolution hyperspectral satellite TianGong-1 (TG-1) opens up new possibilities for applications of remotely-sensed satellite imagery. One of the main goals of the TG-1 mission is to provide observations of surface attributes at local and landscape spatial scales to map urban land cover accurately using the hyperspectral technique. This study attempted to evaluate the TG-1 datasets for urban feature analysis, using existing data over Beijing, China, by comparing the TG-1 (with a spatial resolution of 10 m) to EO-1 Hyperion (with a spatial resolution of 30 m). The spectral feature of TG-1 was first analyzed and, thus, finding out optimal hyperspectral wavebands useful for the discrimination of urban areas. Based on this, the pixel-based maximum likelihood classifier (PMLC), pixel-based support vector machine (PSVM), hybrid maximum likelihood classifier (HMLC), and hybrid support vector machine (HSVM) were implemented, as well as compared in the application of mapping urban land cover types. The hybrid classifier approach, which integrates the pixel-based classifier and the object-based segmentation approach, was demonstrated as an effective alternative to the conventional pixel-based classifiers for processing the satellite hyperspectral data, especially the fine spatial resolution data. For TG-1 imagery, the pixel-based urban classification was obtained with an average overall accuracy of 89.1%, whereas the hybrid urban classification was obtained with an average overall accuracy of 91.8%. For Hyperion imagery, the pixel-based urban classification was obtained with an average overall accuracy of 85.9%, whereas the hybrid urban classification was obtained with an average overall accuracy of 86.7%. Overall, it can be concluded that the fine spatial resolution satellite hyperspectral data TG-1 is promising in delineating complex urban scenes, especially when using an appropriate classifier, such as the hybrid classifier.

Graphical Abstract

1. Introduction

Remote sensing technology with the ability to acquire images with fine spatial and spectral heterogeneity for various land-cover types is a useful tool for delineating the urban environment. Hyperspectral sensing systems with hundreds of contiguous spectral bands provide valuable sources of information related to the physical nature of different materials, and enable distinguishing different landscapes [1,2]. The Hyperion sensor on board NASA’s Earth Observing-1 (EO-1) satellite is an extensively-used hyperspectral imaging instrument that can acquire both visible/near-infrared (VNIR) and shortwave infrared (SWIR) spectra with a medium spatial resolution of 30 m. The fine spectral resolution of the Hyperion sensor has shown to be useful in urban classification applications [3,4,5].
Studies carried out with accurate geographic locations of urban features tend to be limited by the medium spatial resolution of Hyperion imagery [6]. This may influence the accuracy of the extracted urban land-cover information. To overcome these limitations, a newer generation of hyperspectral sensor was explored with both fine spatial and spectral resolution. The deployment of the TianGong-1 (TG-1) spacecraft on 29 September 2011, made it possible to identify complex terrestrial features with high accuracy. China’s TG-1 sensor marked another operational test for spaceborne hyperspectral capabilities, which is an important supplement to the only on-orbit hyperspectral satellite sensor, EO-1 Hyperion. Similar to the Hyperion, the TG-1 instrument was designed as a technology demonstration tool to test a set of scientific research experiments and applications for land imaging [7]. Four advanced imaging instruments were carried on board: a panchromatic (PAN) imager, a visible near-infrared (VNIR) imager, a shortwave infrared (SWIR) imager, and a thermal infrared (TIR) imager. The ground resolution of the PAN system is 5 m, the resolution of the VNIR is 10 m, that of the SWIR is 20 m, and that of the TIR is 10 m. Due to the fine spatial and spectral resolution, the TG-1 images have the potential to depict detailed features and, hence, to improve the accuracy of complex urban mapping.
As Tong, Xue, and Zhang [1] suggested, robust algorithms are required to fully exploit the abundance of hyperspectral data. One conventional method of classifying hyperspectral images, which allocates each pixel to a certain category based on its spectrum, is known as pixel-based classification [8]. Such pixel-level processing is typically carried out using a variety of conventional classifiers, such as the maximum-likelihood classifier (MLC), artificial neural network (ANN), decision tree (DT), and support vector machine (SVM). For medium and coarse spatial resolution data, pixel-based classifiers are recognized as powerful methods since the spectral information is considered to be a more critical attribute than the coarse spatial information [9,10]. However, for data with relatively finer spatial resolution, the use of pixel-based classifiers can be problematic since within-pixel variations exist, and may lead to “salt and pepper” noise in classification maps. Some techniques that focus on using the sharpening images have been developed to improve the pixel-based mapping results. For example, [11,12,13] proposed some spatial-spectral enhanced fusion methods to facilitate the delineation of land-cover patterns. In addition, the sub-pixel level classification, which assigns an optimal land cover type according to the land-cover fractions obtained from a soft classification such as the spectral mixture analysis, has also been extensively used in urban land-cover mapping for medium and coarse spatial resolution data [14,15].
Another essential approach to address the pixel-based mapping issue is the object-based classification, which is implemented at the object level rather than the pixel level. It avoids intra-class spectral variations by merging pixels into objects or segments [16,17,18]. However, the object-based classification is often encountered with the issue of over-segmentation or under-segmentation, which makes the spectral separability within different classes smoothed and directly affects the resulted classification [19,20,21]. Further improvements to classification can be achieved by using a hybrid of pixel-based and object-based approaches. This is typically implemented by incorporating the advantages of pixel-based classification into object-based classification. As Shackelford and Davis [22] and Malinverni, et al. [23] reported, the hybrid method is capable of extracting the land-cover classes more effectively and accurately than using either pixel-based or object-based methods. In addition, some studies such as [17,24,25] have also demonstrated that both object-based and hybrid object-based classification methods are more suitable to fine spatial resolution (a pixel size of 2–20 m) than medium-resolution (a pixel size of >20 m) images.
The approaches by means of object segmentation have been primarily designed for multispectral remote sensing data. A thoroughly integration of these techniques for satellite hyperspectral data analysis is comparatively limited. Furthermore, an effective utilizing of them for complex urban environment to evaluate fine spatial resolution hyperspectral imagery is even scarcer. On the other hand, because of the difficulties in collecting hyperspectral images with relatively fine spatial resolution, most object-based classification methods have focused on airborne hyperspectral sensors that typically have a finer spatial resolution than satellite hyperspectral sensors. Compared to airborne hyperspectral sensors, however, satellite hyperspectral imaging systems, especially those with a relatively fine spatial resolution (such as that provided by the future Chinese Gaofen-5 sensor), may provide more economical and practical data acquisition. Regrettably, until recently there was little knowledge as to whether these object-based classification methods were suitable for fine spatial resolution satellite hyperspectral data.
According to above context, present study attempted to evaluate the potential of spectral and spatial information acquired from the TG-1 and EO-1 Hyperion systems for classification of urban land-cover types. Specifically, this study aims (1) to analyze the spectral features of TG-1 data and examine the capability of TG-1 data in facilitating urban land-cover mapping; (2) to investigate the performance of TG-1 and EO-1 Hyperion images in mapping complex urban scene; and (3) to assess the algorithms of pixel-based and hybrid urban classification approaches concerning on satellite hyperspectral data with different spatial resolutions. Ultimately, this study hopes to pre-assess the capabilities of different urban classifiers for the Chinese upcoming Gaofen-5 sensor, which will provide hyperspectral images with fine spatial resolution (10–20 meter).

2. Study Site and Datasets
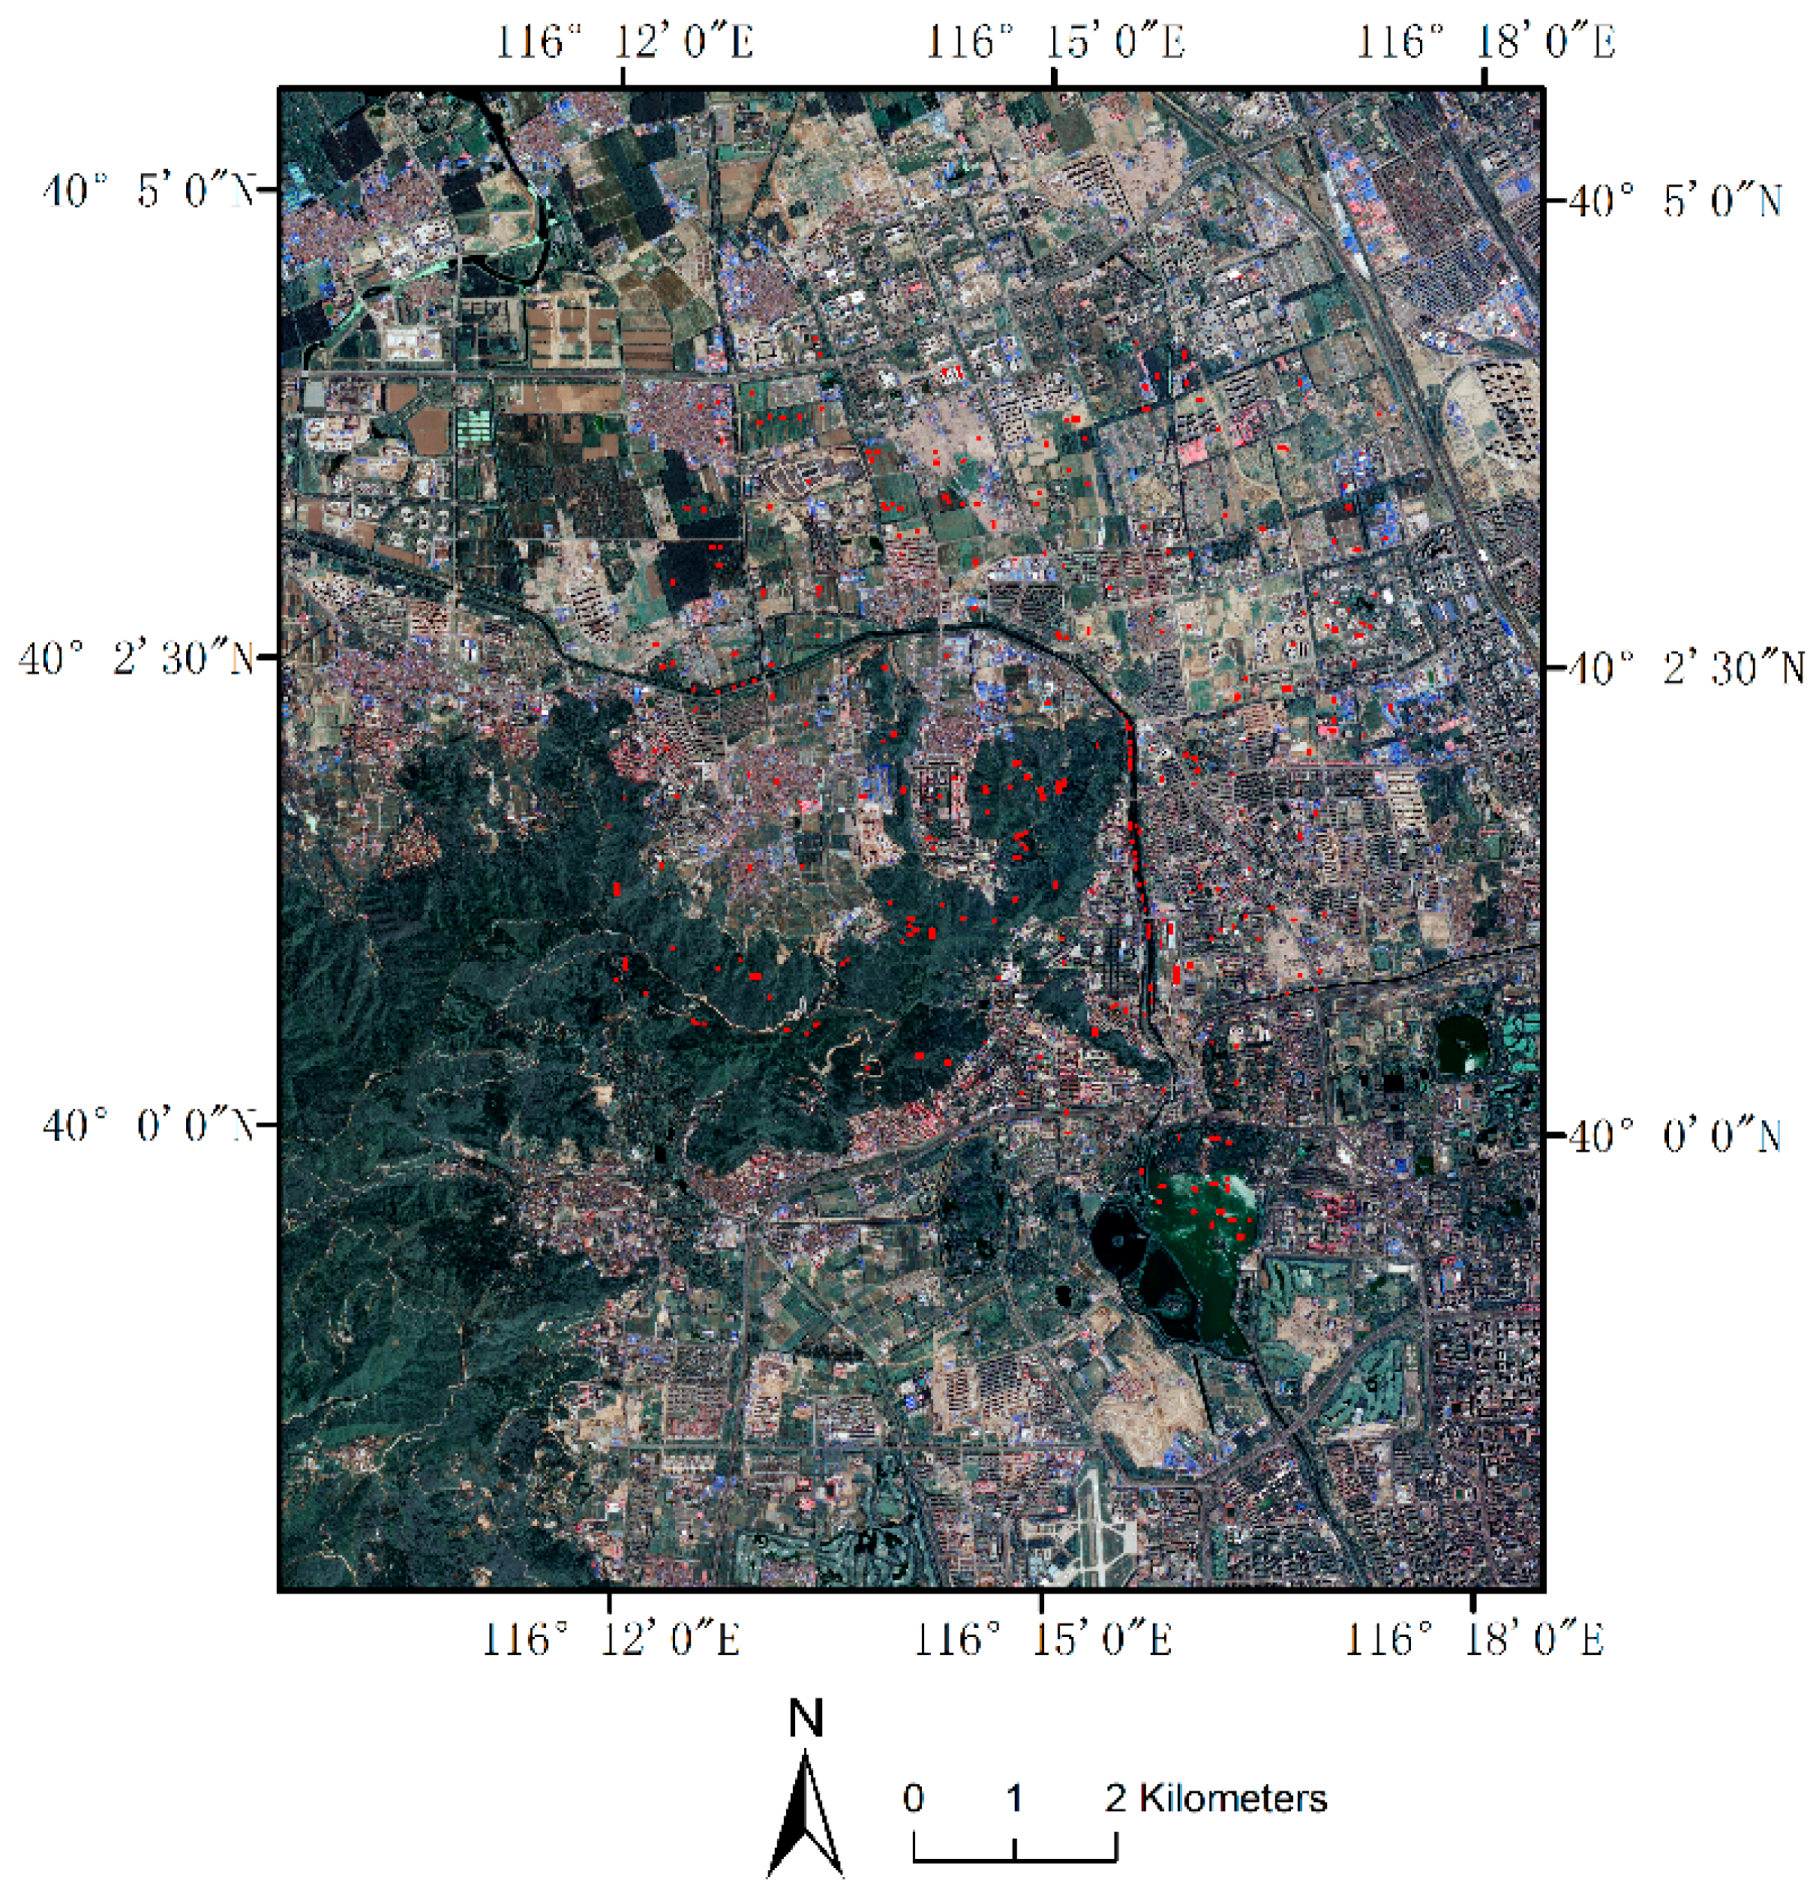
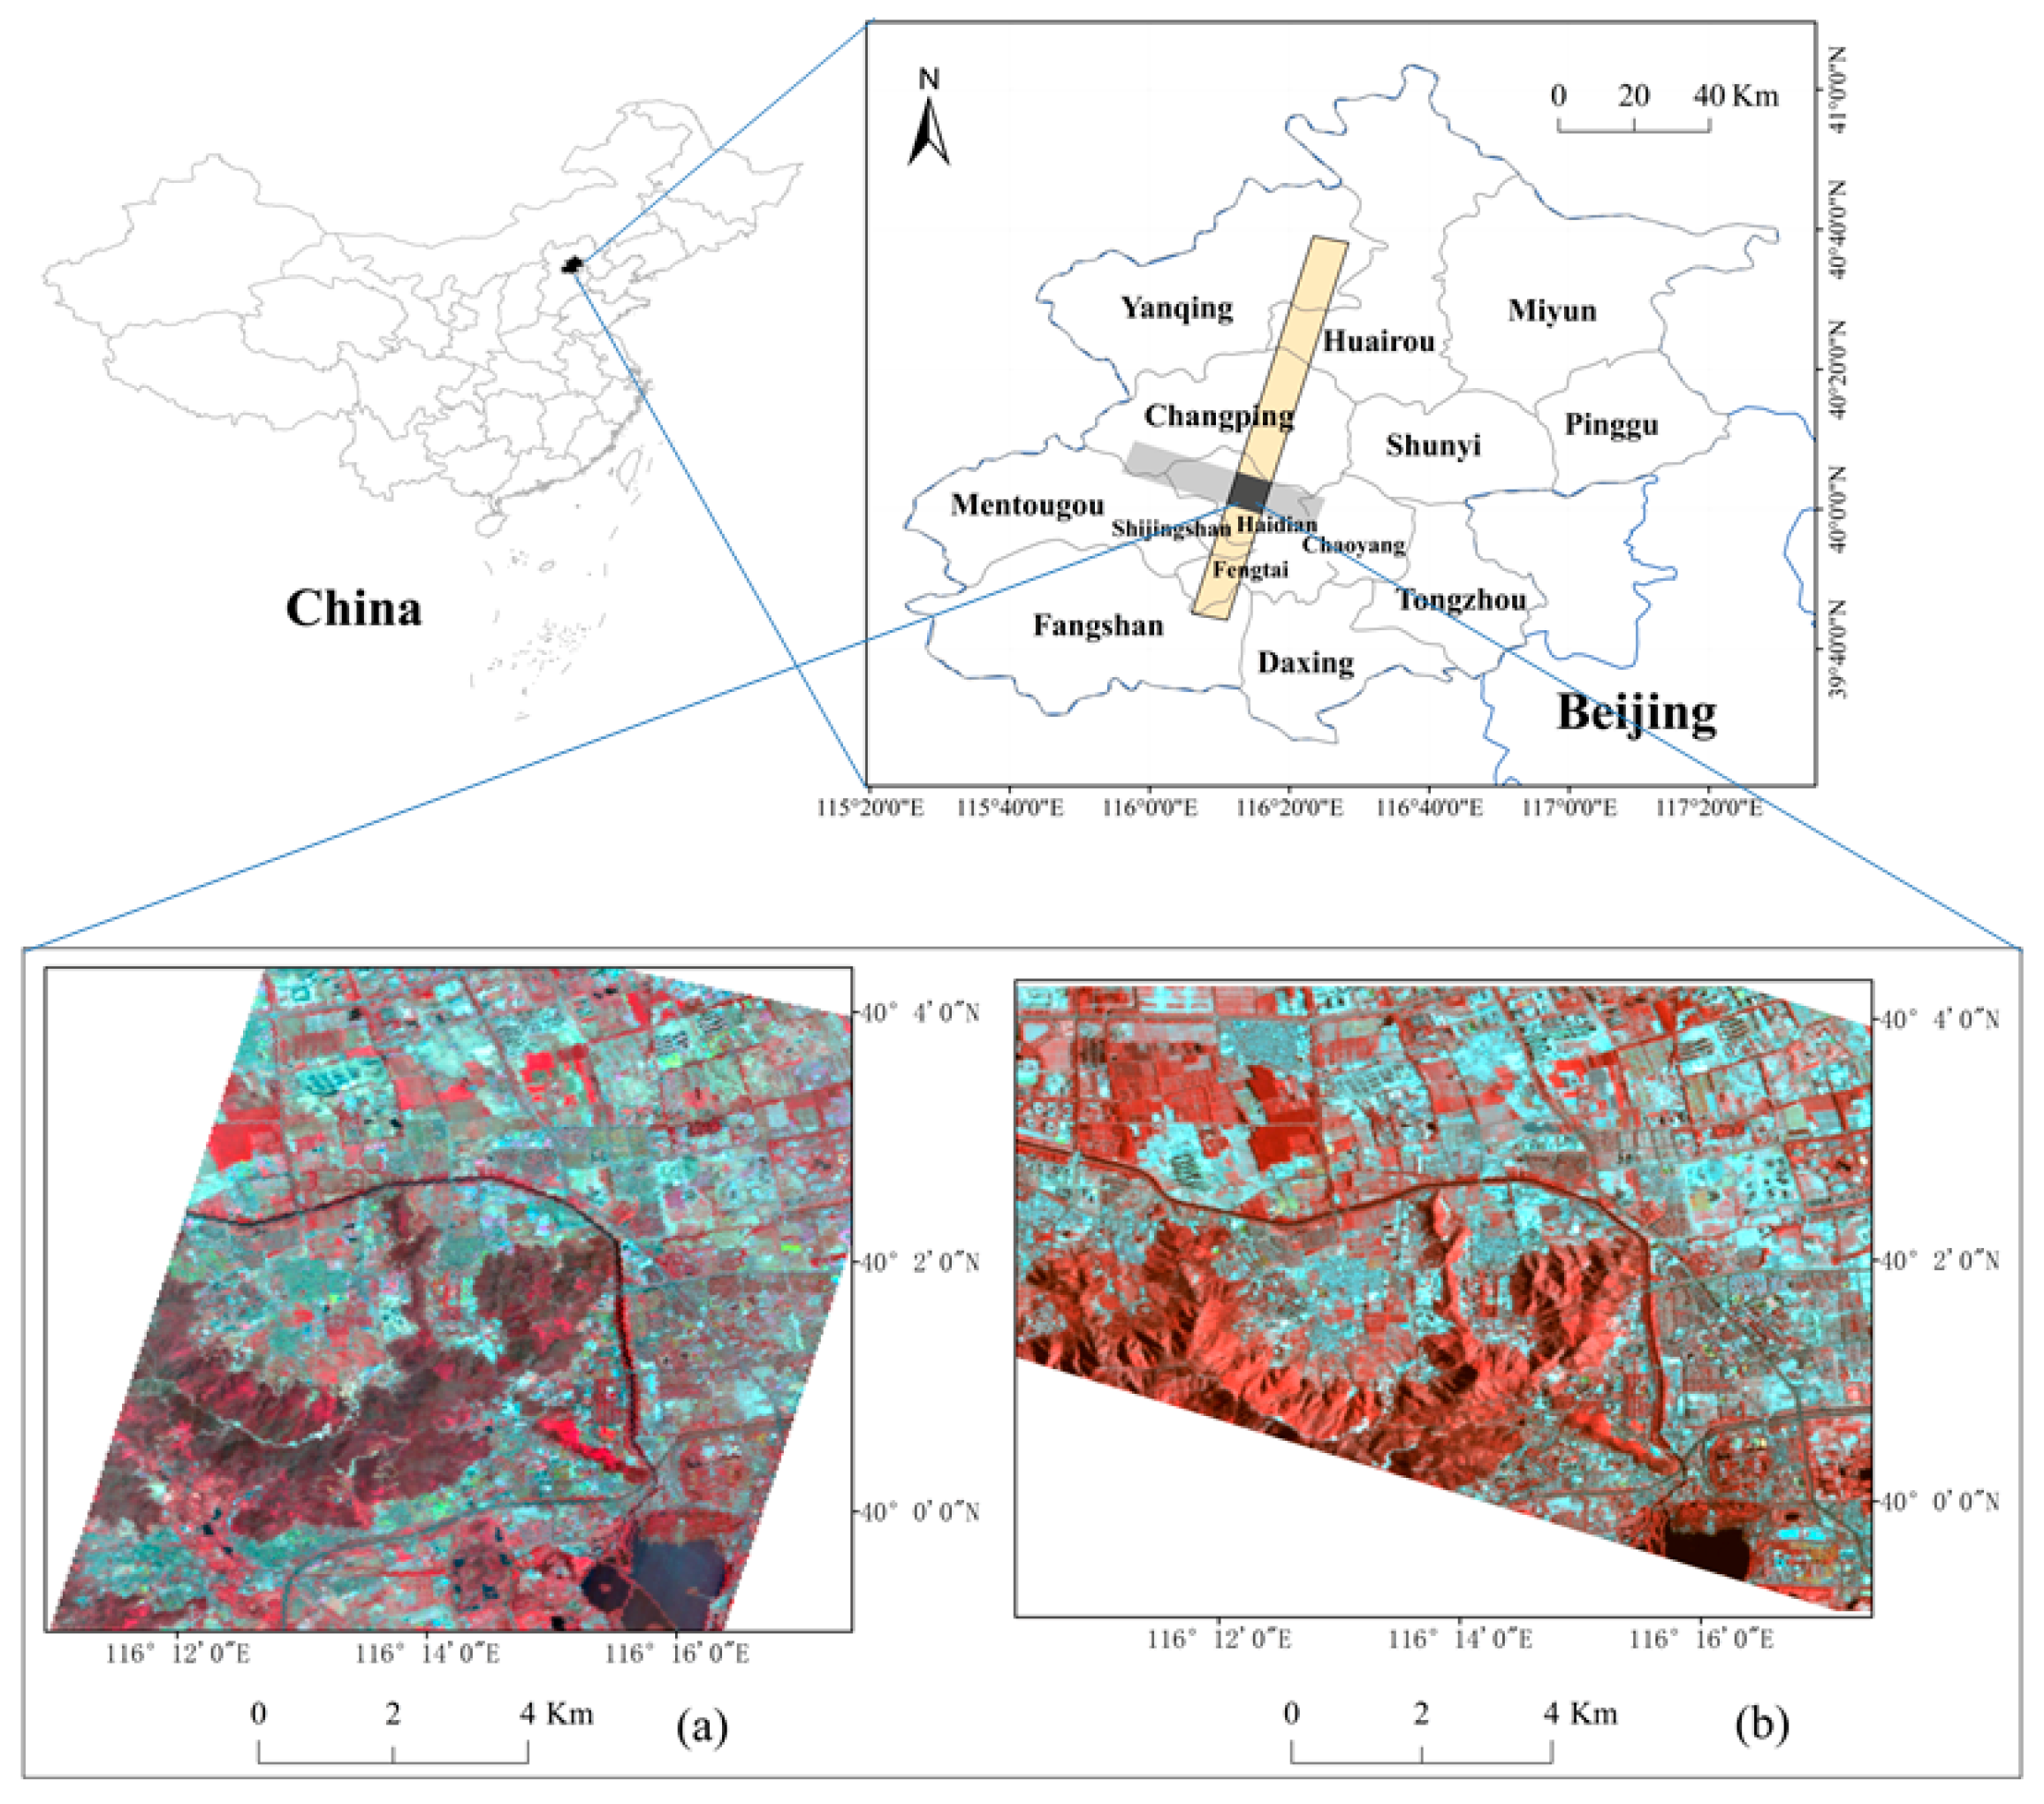
2.1. Study Area

The study area ranges from 39°59’8.12”N to 40°4’16.30”N and from 116°10’17.62”E to 116°17’29.76”E; it is located to the northwest of Beijing, China, as shown in Figure 1. The site lies in the temperate zone, with a continental monsoon semi-humid climate, and presents four distinct seasons characterized by hot, humid summers and cold, windy, dry winters. The average annual temperature of Beijing is 11.3 °C, and the average precipitation is 508.4 mm, as recorded from 1981 to 2010. The abundant land-cover types include trees, grass, cropland, urban regions, and water. This variety makes land-cover classification in Beijing so particularly interesting that it deserves to be studied.

2.2. Remote Sensing Data

The datasets were acquired using the high-quality TG-1 and EO-1 Hyperion satellite hyperspectral sensors. The TG-1 data were acquired on 10 May 2013 (15:30 LST (Local Standard Time)); the EO-1 Hyperion image acquisition took place on 1 May 2013 (10:30 LST). Both of the satellite images were acquired under sunny and cloud-free conditions and, thus, are appropriate for further analysis.
The China’s TG-1 spacecraft is in a circular and non-sun-synchronous, which has an altitude of approximately 340 km and an orbital inclination angle of 43°. The swath width of TG-1 data is 10 km. The TG-1 hyperspectral sensor was a 128-band push broom scanner with nominal bandwidths of 10 nm (VNIR) and 23 nm (SWIR), covering a spectral range of 400–2500 nm [26]. TG-1 offers finer spatial resolution (10 m) than other hyperspectral sensors carried on previous Earth observation satellites. The characteristics of TG-1 are listed in Table 1. The level 2 data, which were calibrated for at-sensor radiance (W·m−2·sr−1·nm−1), were used to eliminate the “spectral smile” effect. Systematic geometric correction was carried out compared to level 1 data.
The EO-1 Hyperion image contained 242 bands in the range 355–2577 nm, with a bandwidth of 10 nm and a spatial resolution of 30 m. The images were provided as level 1R data, and were radiometrically corrected. Table 1 also listed the specific characteristics of the Hyperion imaging system.
In addition, fine spatial resolution GaoFen-1 (GF-1) images (2 m panchromatic band) acquired on 19 June 2013, and QuickBird images from Google EarthTM acquired on 4 March 2013, were utilized as ancillary data to collect training and validating sites representative for each of the land-cover categories.

2.3. Urban Land-Cover Classes and Reference Data

In this study, seven dominated land-cover classes that were basically consistent with previous work [27,28] were selected for the TG-1 and Hyperion data: built-up, cropland, grass, trees, water, barren land, and shadow. For the sake of accuracy assessment, sufficiently spatial and temporal representative sample regions were selected for both the TG-1 and Hyperion imagery through several data sources (Figure 2). Ground surveys of broad urban covers, involving a mix of grasslands/shrubs, built-up, and water pools, were carried out in March–June 2013 and August 2014 of downtown Beijing. Other sample regions representing inaccessible rural forests, cropland and bare land were obtained by visual interpretations of fine spatial resolution data including GF-1 pan image and Google EarthTM data. The same geographical location was chosen for both TG-1 and Hyperion data. Table 2 exhibited the number of pixels for each class selected for classification purposes using TG-1 and Hyperion sensors. It should be mentioned that, although the study areas selected for two sensors were not perfectly matched in the present research, this would not impact the final classification accuracy and the further comparison work, since that the four classification methods used here were all implemented in a pixel-by-pixel manner.

3. Methodology

Land-cover classification was carried out on the two sets of satellite hyperspectral images using both pixel-based and hybrid classification approaches. Figure 3 shows a summary of the methodology used in the study.

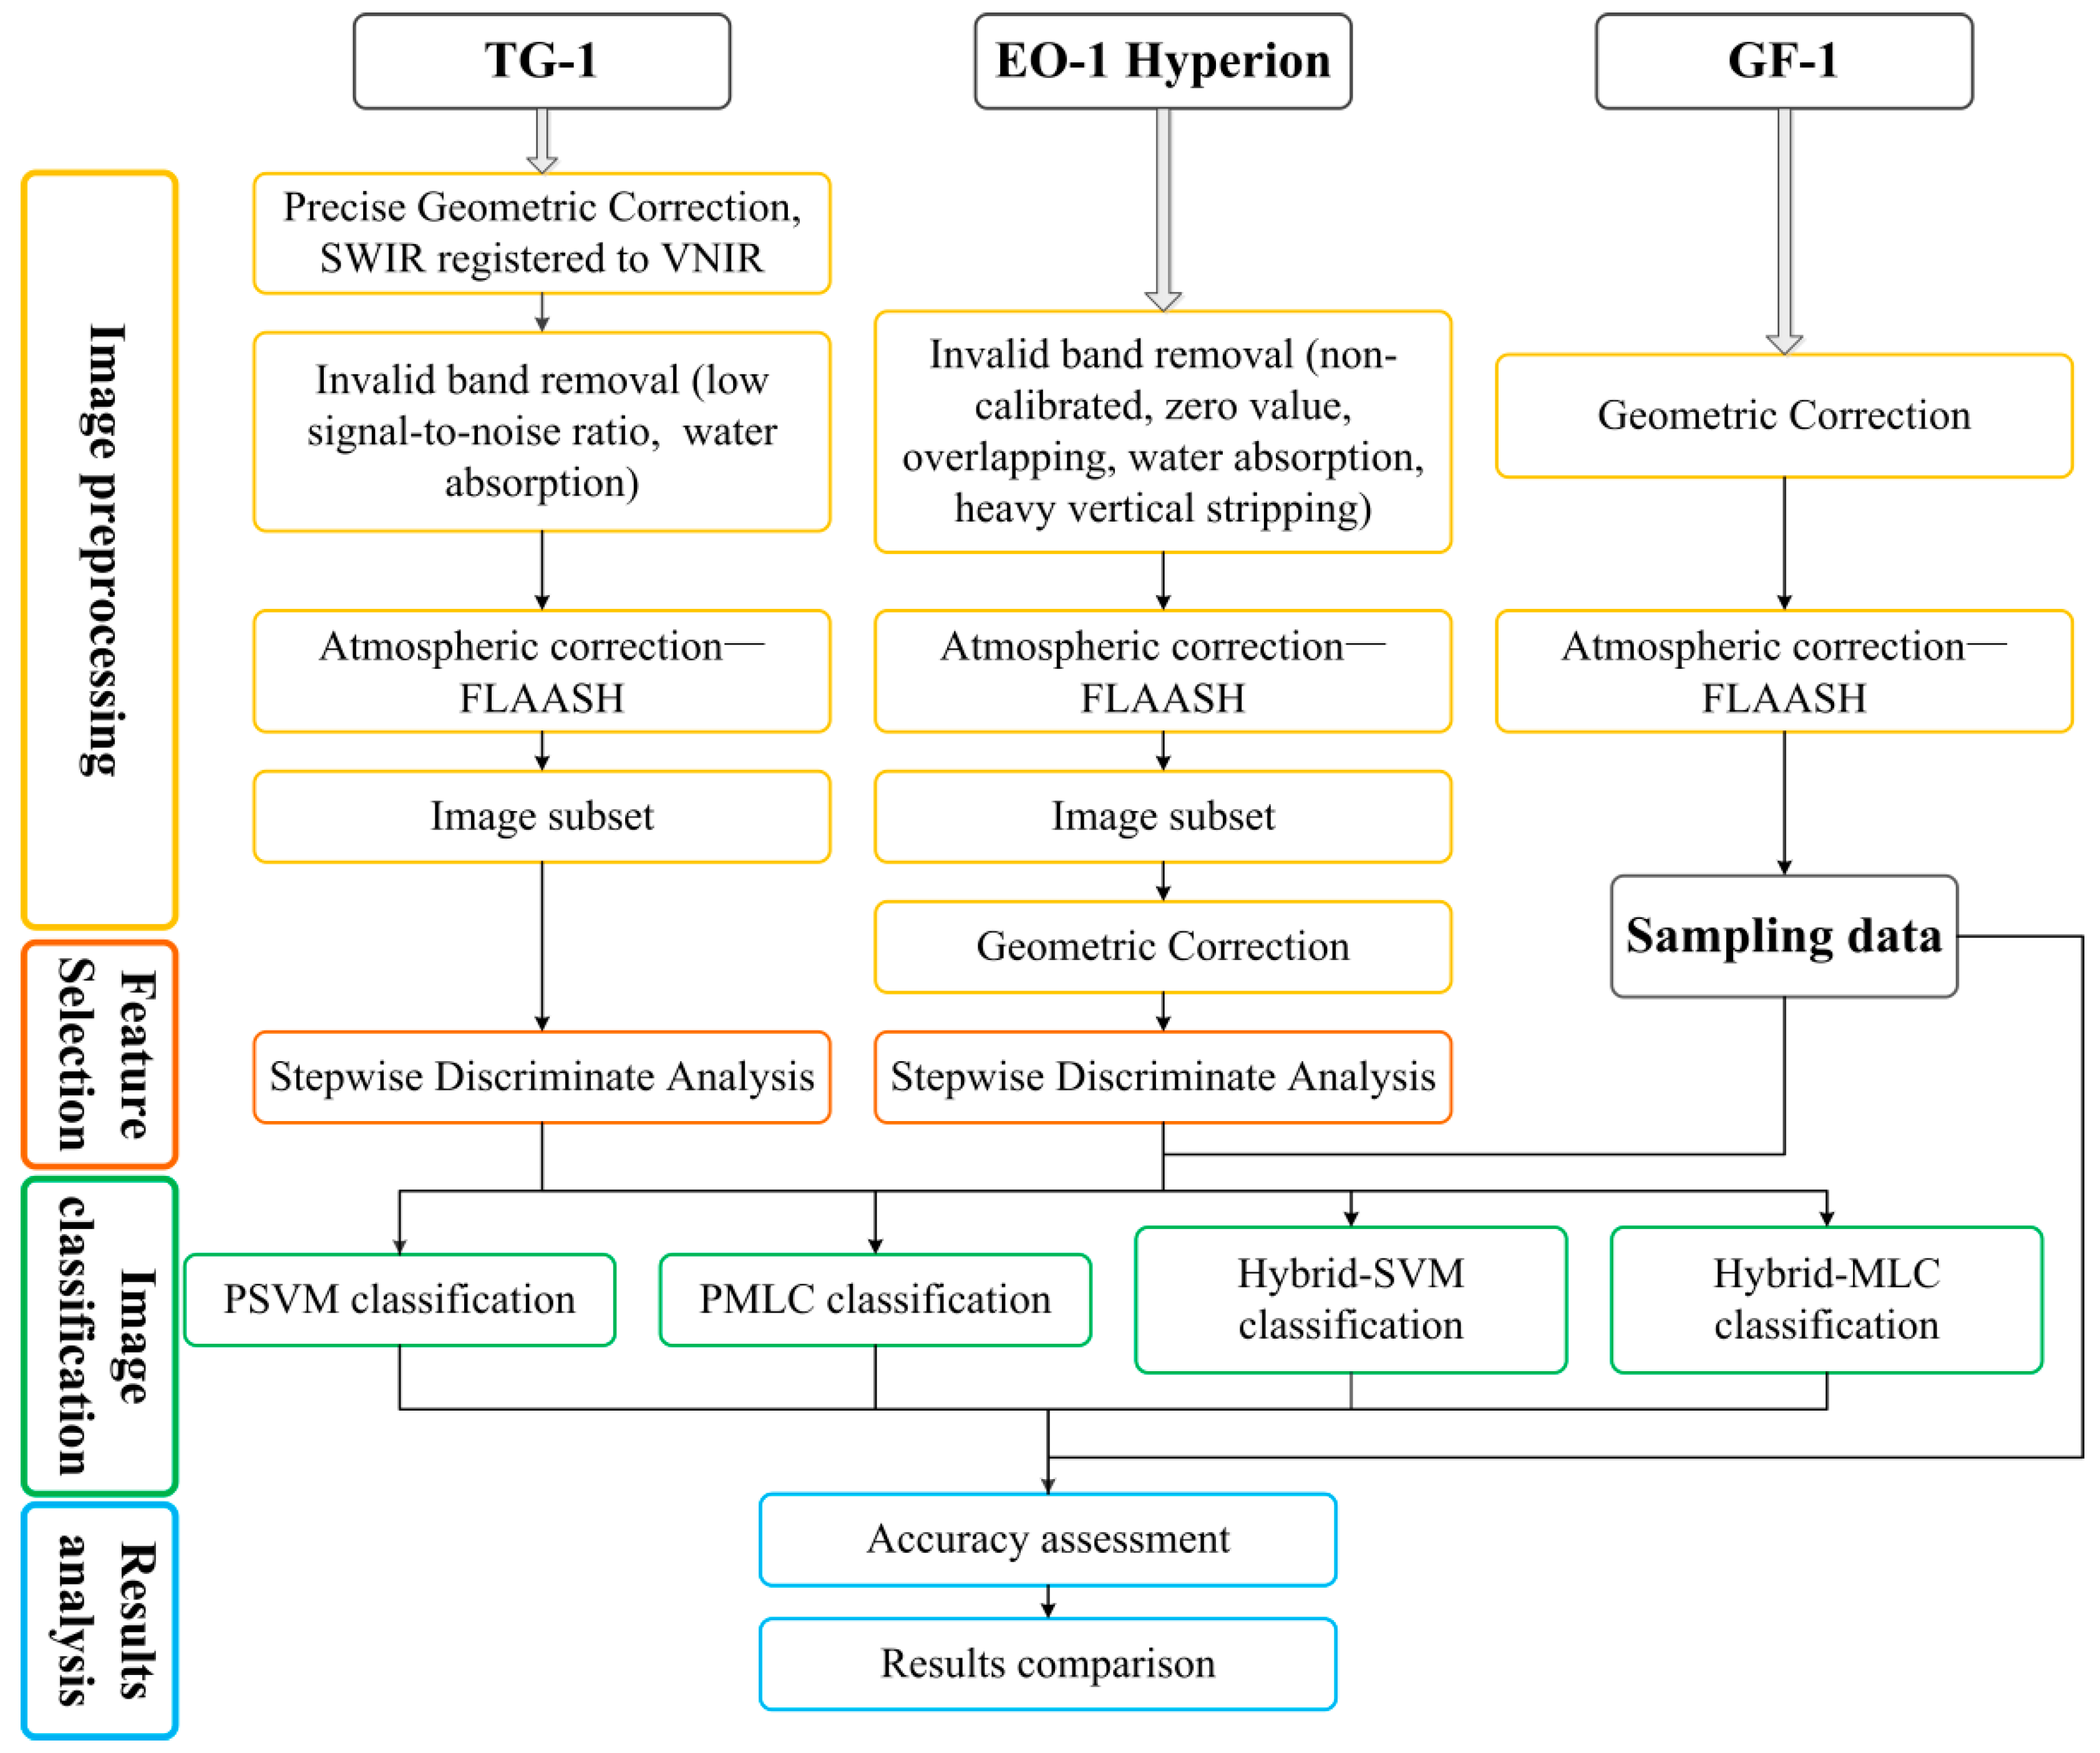
3.1. Image Pre-Processing

3.1.1. TG-1

Pre-processing of TG-1 data consisted of three steps. First, a precise image-to-image geometric correction was carried out on the VNIR with GF-1 and Google EarthTM being the reference images, which achieved a root-mean-square error (RMSE) of less than one pixel using a first-order polynomial transformation. The SWIR images were then registered to the VNIR images, yielding an RMSE of less than 0.5 pixels. Second, 15 bands of the TG-1 image data were discarded due to low signal-to-noise ratios and water vapor absorption. Third, the image was atmospherically corrected and converted into surface reflectance data using the Fast Line-of-sight Atmospheric Analysis of Hypercubes (FLAASH) model. FLAASH is an atmospheric correction software designed jointly by the Air Force Phillips Laboratory, Hamscon AFB and Spectral Sciences, Inc. (Burlington, MA, USA) [29]. The bands that were used to calculate the water absorption features were removed after the atmospheric correction, and only the remaining 111 bands were used for further analysis.
The TG-1 data were visually examined to identify a suitable location for study (seen in Figure 1a,b), ensuring that the TG-1 data overlap with the Hyperion data. The TG-1 SWIR data were resampled to the same spatial resolution (10 m) with the VNIR. Finally, a 1016 × 959 pixel subset of the full TG-1 scene was selected for the research presented here.

3.1.2. EO-1 Hyperion

The first step in pre-processing the Hyperion image data was to remove the zero data, duplicated data, and the water absorption and heavy vertical stripping bands. Atmospheric correction was then carried out using the FLAASH module. An image subset of 333 × 431 pixels was extracted from the original Hyperion image, such that it coincided with the TG-1 image data. Geometric registration was accomplished with the aid of the GF-1 pan image and Google EarthTM of the study site, achieving an RMSE of 0.6 pixels using a first-order polynomial transformation. Eventually, following removal of the water absorption bands, as well as the removal of abnormal bands, 158 bands remained for further discriminant analysis.

3.1.3. Dimensionality Reduction

Hyperspectral data generally contains a plentiful amount of redundant spectral information. Statistical analysis concerning the correlation between bands revealed that many of the TG-1 and Hyperion bands were highly correlated. Thus, the dimensionality of the two hyperspectral datasets was reduced using a stepwise discriminant analysis (SDA) approach [30]. The SDA was based on Wilks’s lambda distribution, which is a multivariate analysis of variance using a ratio of determinants, and is given by:
Λ = | S effect | | S effect | + | S error |
where S is a matrix, known as the “sum of squares (SS) and cross-products”. The Wilks’s lambda value can be used as an indicator of the discriminatory power between independent spectral wavebands, and is in the range 0–1. A value near to 0 implies that the means of the group differ significantly; whereas a value close to 1 implies that the means are similar (a value of 1 indicates the means of the group are identical).
SDA was implemented via a stepwise selection method, which begins with no bands in the model. Bands contributing the most to the discriminatory power are retained, and others are rejected. The band selection process stops when there is no further significant decrease in the Wilks’s lambda distribution. Bands selected via this analysis were perceived as the optimal features for classification.

3.2. Pixel-Based Classification

Present research selected two supervised classification algorithms: parametric Maximum Likelihood Classification (MLC) and kernel based Support Vector Machine Classification (SVM), as they represent two different ‘families’ of algorithms.
MLC is a commonly-used parametric method for pixel-based classification, and uses the multivariate normal probability density model [23,31,32]. This algorithm is based on Bayes’ theory of decision. With the assumption that the distribution of each class sample in the multidimensional space is normal, a class can be well characterized with the mean vector and the covariance matrix. The principle advantage of the MLC is that, for normally-distributed data, it is superior to other parametric classifiers; however, for data that are not normally distributed, the results may be unfavorable.
SVM is an effective non-parametric classifier for classifying complex data involving higher dimensionality [33,34]. This classifier exploits a margin-based geometrical criterion in the context of a multidimensional feature space, aiming to locate the maximum margin between classes. In the present study, the radial basis function (RBF) kernel was used with the SVM algorithm. The gamma value γ and penalty parameter C were used as input parameters for the SVM. Inappropriate parameter settings can lead to poor classification results: an excessively large C may give rise to excessive penalties for prediction errors, which may produce an over-fitting model, and excessively large values of γ may affect the shape of the separating hyper-plane, which can influence the classification outcomes.

3.3. Hybrid-Based Classification

Hybrid classification is a method that combines pixel-based classification with object segmentation mapping using majority voting [20]. In this process, pixel-based classification and segmentation are carried out independently. Each object in the segmentation map acts as a filter, and all of the pixels within each segmented object are assigned to the same class to which more than 50% of pixels belong using a pixel-based classifier. Note that, unlike common filters, majority voting is not carried out with a fixed neighborhood, but rather with an adaptive neighborhood that contains the spatial patterns. Hybrid classification has proved to be successful in previous studies on urban classification [35,36].
Image segmentation is a critical aspect of hybrid classification, and this study follows the approach given by [37]. It is a region-growing technique that starts with pixel-sized segments, and iteratively merges neighboring pixels or regions according to local heterogeneity, i.e.,
h = w s p i = 1 n w i σ i + ( 1 w s p ) ( w c p l N + ( 1 w c p ) l r )
where n is the number of spectral bands, w i is the weight of band i , w s p and w c p are spectral and compact parameters, controlling object shape and compactness, respectively; N is the number of pixels, σ i is the variance of pixels within object, l is the perimeter of object, and r is the perimeter of the rectangles bounding the object. The merging procedure stops when h exceeds a user-defined scale parameter.

3.4. Accuracy Assessment

Accuracy assessment of classification results is very important. This study used the k-fold cross-validation, a model for calculating generalization errors and widely applied in classification results evaluation [31,38,39]. The k-fold cross-validation is also called the leave-one validation. It splits the sampling data (introduced in Section 2.3) into k smaller sets, k − 1 of which is used to train the classification model and the remaining part of the data is used to validate the results. The accuracy of cross-validation is the statistical values averaged from the k-fold loop. In present study, five-fold cross-validation was implemented.
The accuracy of the TG-1 and Hyperion classified images was assessed based on the overall accuracy (OA) and kappa coefficient (Kc). The overall accuracy provides a discerning statistical parameter to compare the performance of mapped classes with the referenced classes. The kappa coefficient is calculated to determine statistically if an error matrix is significantly different from another. The OA and Kc presented in this study were the averaged value and best value from five-fold cross-validation for each classifier.

4. Results and Analysis

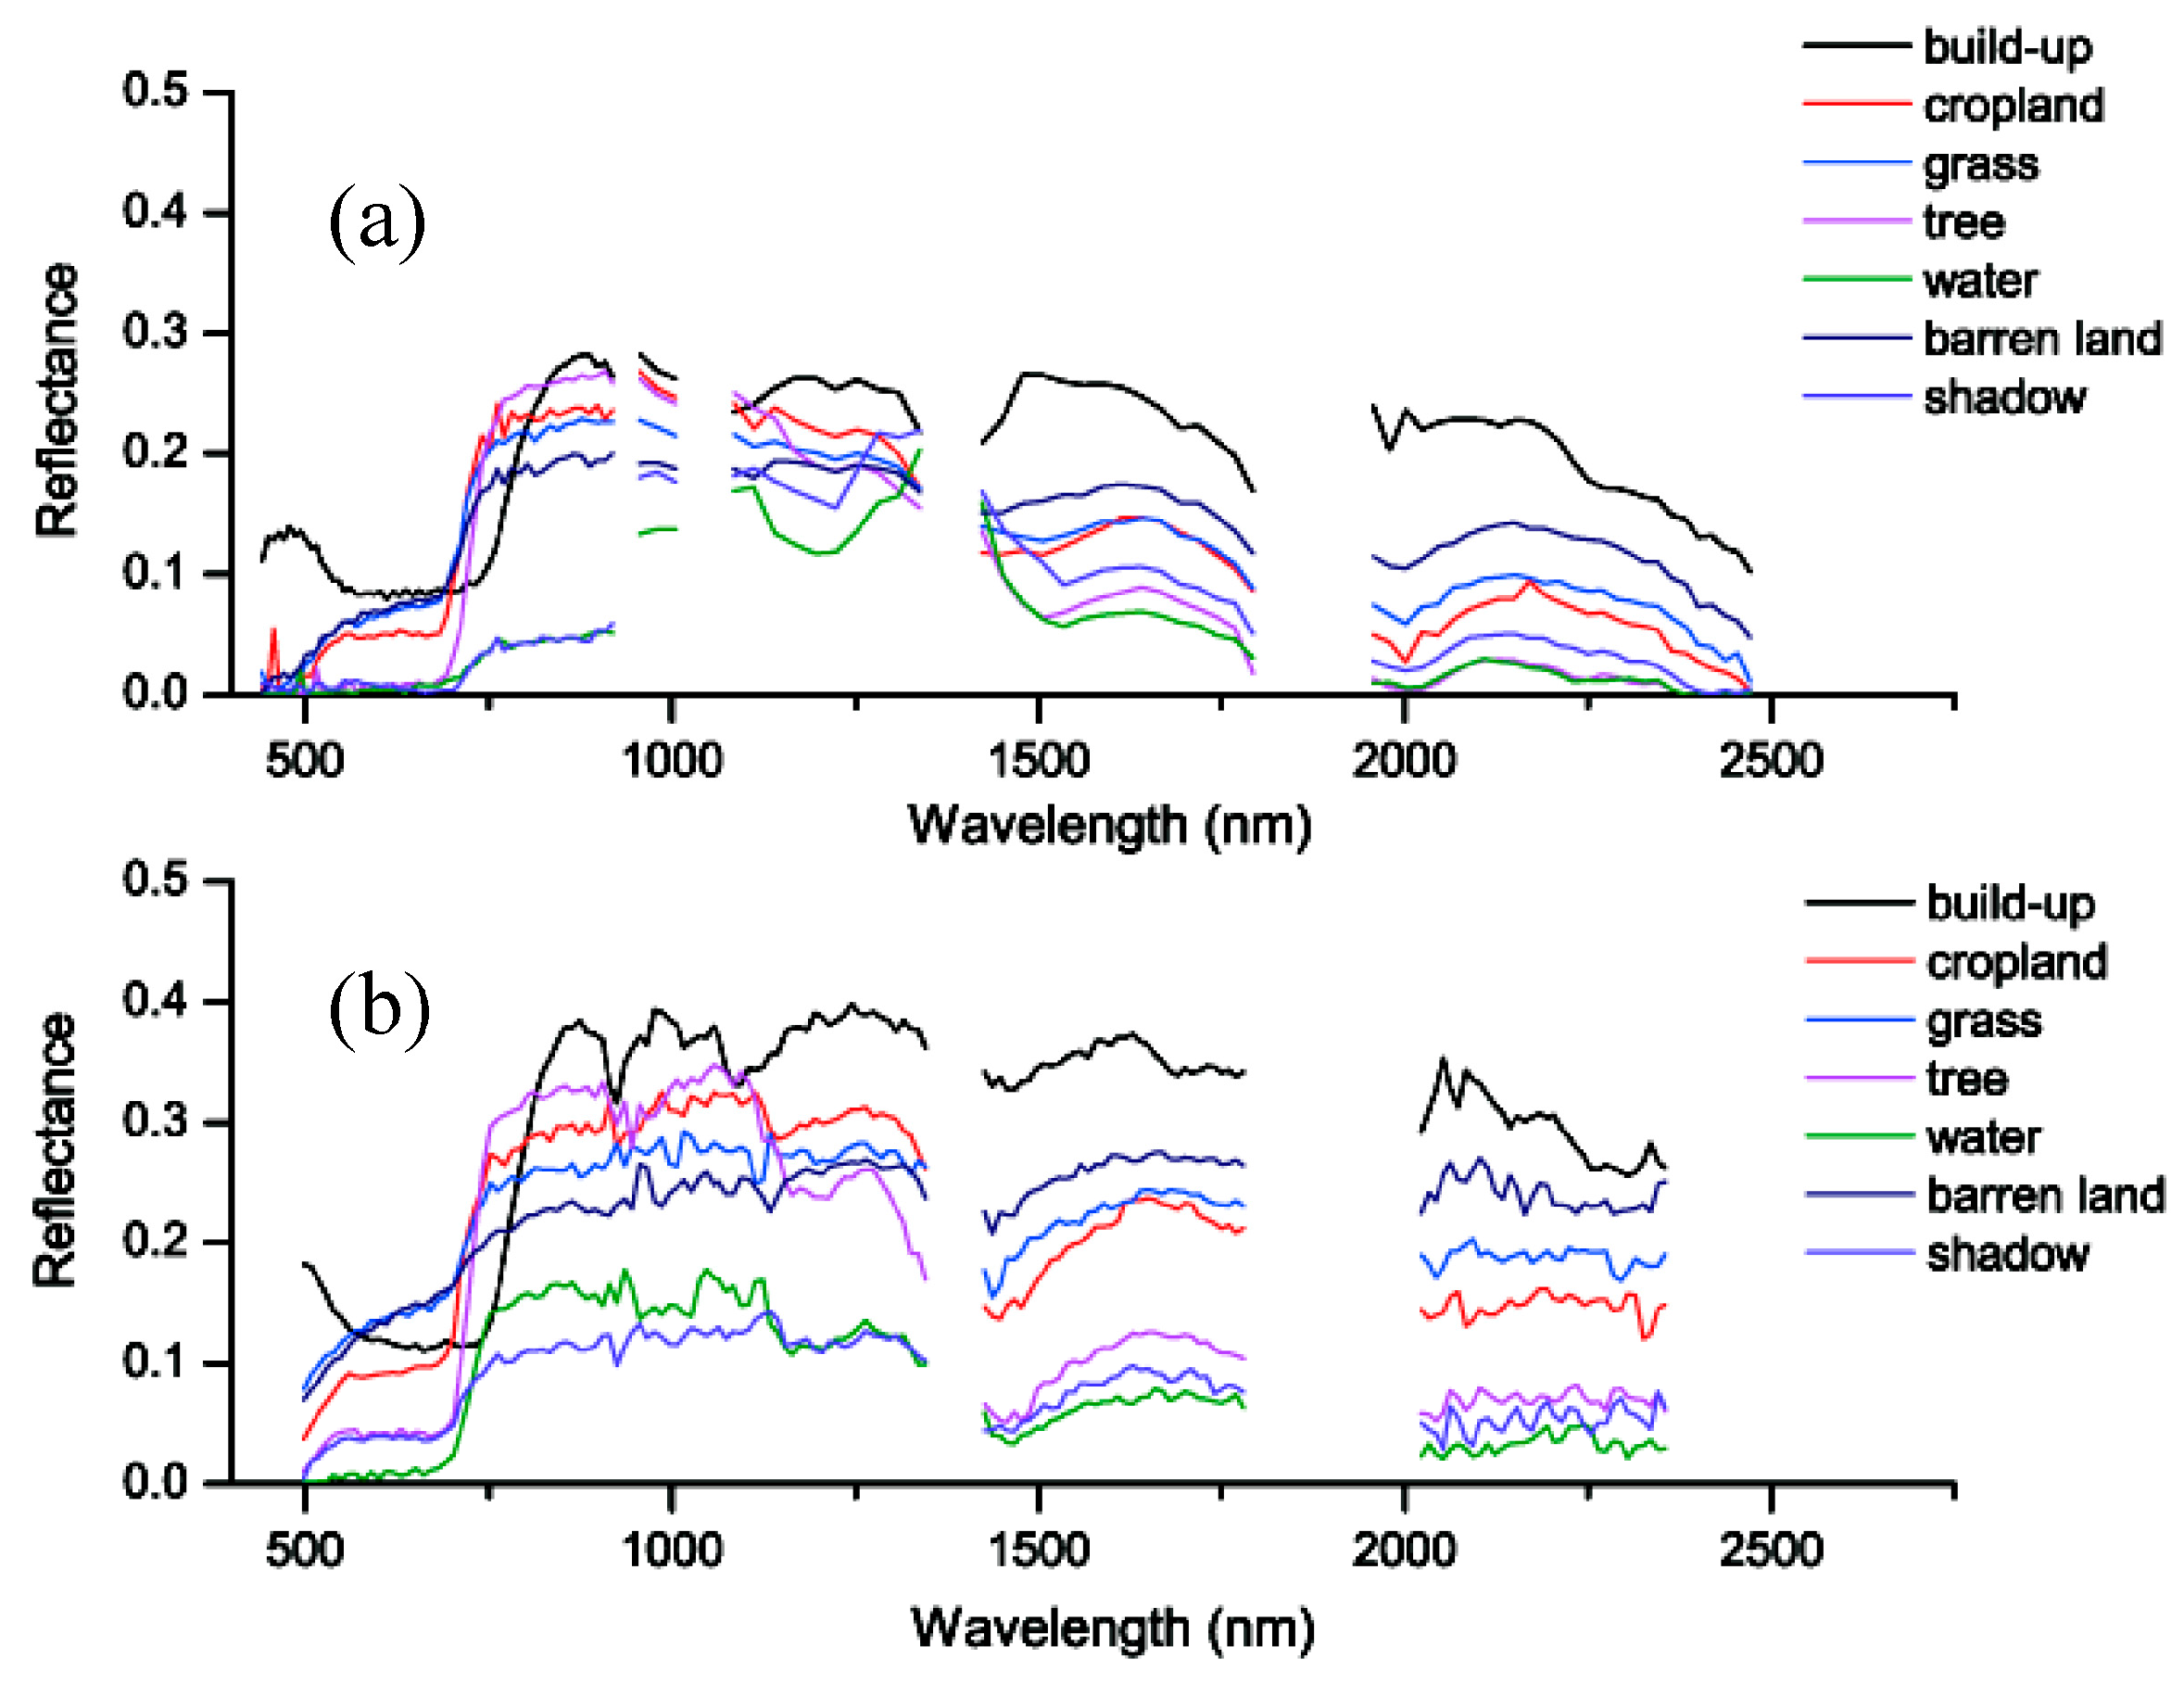
4.1. Spectral Analysis

The TG-1 spectra were visually compared to those of the Hyperion data. Figure 4 exhibits the collected typical spectral signatures of the different categories in TG-1 and Hyperion data. The spectral profiles between the two images show, basically, similar trends in terms of each class, although there is relatively significant difference in acquisition times and signal to noise ratios. For the spectral characteristics of TG-1 regarding vegetated cover (i.e., cropland, grass, and trees), a green peak and a red minimum at visible wavelengths (note that blue was not used here) were exhibited because of absorption due to chlorophyll. Additionally, a pronounced NIR shoulder due to internal leaf structure scattering and a decline in the SWIR region due to absorption by liquid water were also exhibited in Figure 4a. The spectral profile of barren land for TG-1 resembles grass at visible wavelengths; however, it was lower in the NIR and higher in the SWIR, which is partly due to the inclusion of sparsely-vegetated areas (grass in particular). Overall, the similarities between the spectra from TG-1 and Hyperion provide confidence that the TG-1 bands have the potential to discriminate among different urban land cover types.
To ensure that the sample data collected were distinguishable and separable, a commonly used metric based on Jeffries-Matusita (JM) distance was applied to check the spectral similarity of the selected samples [40,41]. This metric was calculated for the 21 possible combinations of the seven classes using the entire sampling dataset. The JM distances for the TG-1 image are in the range 1.944–2.000, which corresponds to a high degree of spectral separability among the seven land-cover types; whereas the JM distances for the Hyperion data are in the range of 1.849–2.000, which corresponds to a moderate-to-high separability, but clearly to a lesser degree in separability than the TG-1 image data.

4.2. Dimensionality Reduction Analysis

Stepwise discriminant analysis was used to reduce the dimensionality of the data as well as removing possible noise. Seventeen optimal bands were identified from the 111 processed TG-1 bands using SDA analysis. Of them, eight were at visible wavelengths, two at near-infrared wavelengths, and seven at short-wave infrared wavelengths. Twenty-seven optimal bands were identified from the 158 processed Hyperion bands. Of them, 12 were at visible wavelengths, five at near-infrared wavelengths, and 10 at shortwave infrared wavelengths.
To check whether any important information was lost by the selected optimum bands, the SVM classification results obtained using the selected optimal bands were compared to that obtained using all bands, according to [42]. For TG-1, the classification map using 17 bands matched 94.72% with the classification map using 111 bands; for Hyperion, the classification map using 27 bands matched 96.03% with the classification map using 158 bands. Since the classification results of both of the images were basically similar, the images with 17 and 27 bands for the TG-1 and Hyperion data, respectively, can be used for further classification.

4.3. Classification Analysis

4.3.1. Tuning of Algorithm Parameters

For the classifiers on the basis of the SVM algorithm, this study used a 10-fold cross-validation method carried out mainly with library LIBSVM [43,44] to select the appropriate input parameters. An optimal combination of input parameters ( C , γ ) was determined as that gave the highest accuracy. Finally, the result of this process set C = 100 , γ = 0.06 for the TG-1 data, and C = 100 , γ = 0.04 for the Hyperion data.
Of the parameters used for the hybrid approaches on the basis of image segmentation, selecting the appropriate scale parameters is the most critical part. In this work, optimal values for these scale parameters were tuned with an iterative trial-and-error approach that was widely employed by object-based image analysis. The values for image segmentation parameters used are listed in Table 3. It was observed that the scale parameters set for the TG-1 data were smaller than that for the Hyperion data. This is reasonable since that the resulting image objects of TG-1 data were sufficiently smaller to describe fine features of interest within the study area, such as trees dotted along a narrow channel, or grass scattered around a built-up area, cropland, or trees.

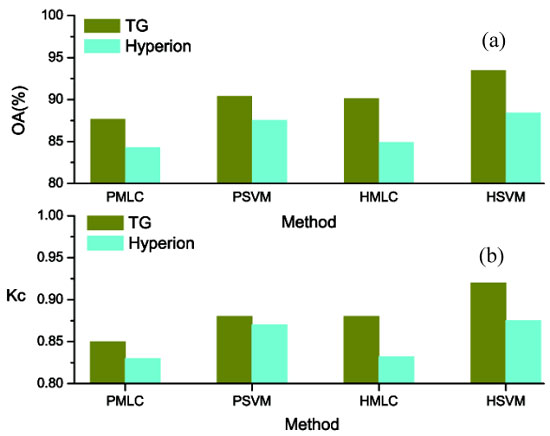
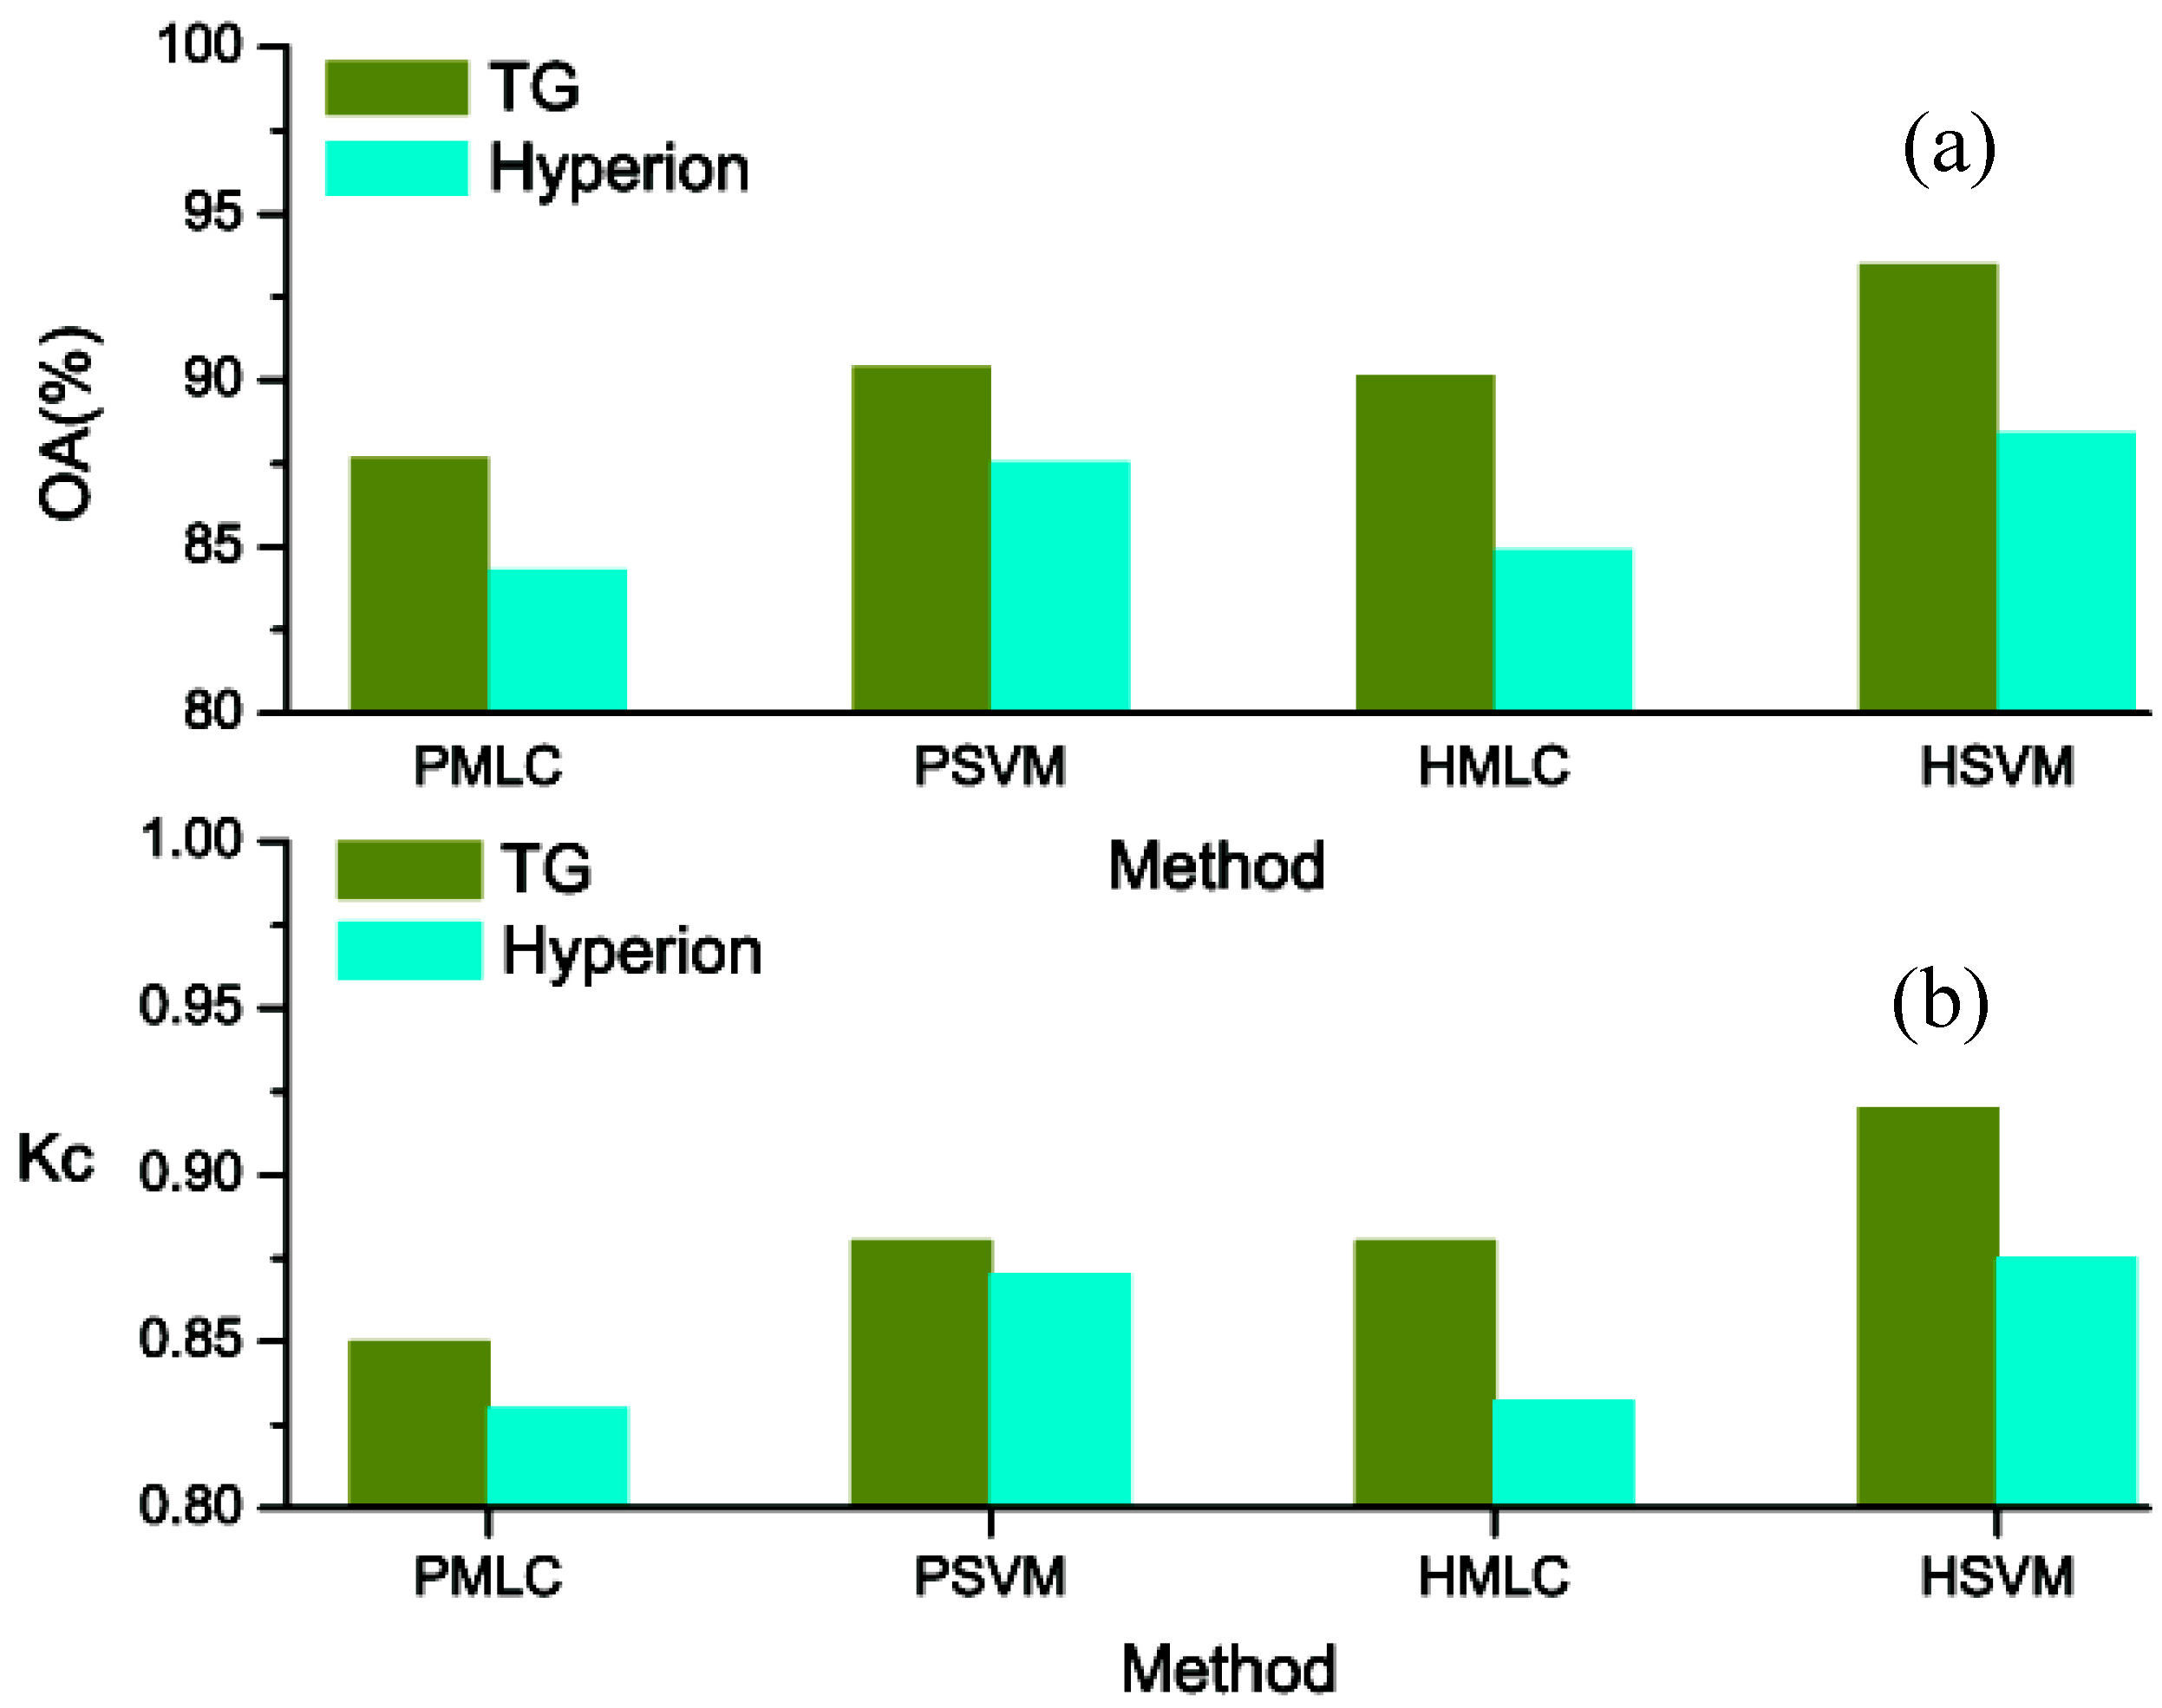
4.3.2. Comparison of the Two Hyperspectral Sensors’ Classifications

Spectra from these sets of 17 and 27 spectral bands were used for the image classification of TG-1 and Hyperion, respectively. The accuracy statistics from five-fold cross-validation are summarized in Figure 5.
Through the examination of the averaged value in OA and Kc from cross-validation, it was found that the pixel-based classification using TG-1 was slightly better than that of using Hyperion, both for MLC and SVM. The average OA value of TG-1 was 87.69% (with an average Kc of 0.85) and 90.43% (with an average Kc of 0.88) for PMLC and PSVM, respectively. By contrast, the average OA value of Hyperion was lower relative to the TG-1 data, which scored 84.33% (with an average Kc of 0.83) and 87.57% (with an average Kc of 0.87) for PMLC and PSVM, respectively.
Consistent with the results of pixel-based classification, TG-1 was also slightly better than that using the medium spatial resolution of the Hyperion images in hybrid classification for both MLC and SVM. The average value in OA using TG-1 data was of 90.17% (with an average Kc of 0.88) and 93.48% (with an average Kc of 0.92) for the HMLC and HSVM, respectively. Hyperion achieved an OA of 84.93% (with an average Kc of 0.83) for HMLC and 88.46% (with an average Kc of 0.88) for HSVM.
The pixel-based land-cover classifications having the best overall accuracy were further examined and the corresponding classification accuracy assessment is listed in Table 4. For PSVM classification, the best OA of TG-1 was 88.43% (with a best Kc of 0.86), which was slightly greater than that of Hyperion that achieved 85.51% (with a best Kc of 0.83). Compared to classification based on PMLC, the depictions of most land-cover types were approximately greater than or equal to 90% for PSVM classification concerning both the two sensors, except for grass and shadow. It can be seen from Table 4 that the producer’s accuracy for barren land and water were approximately constant for the TG-1 and Hyperion sensors. Specific differences between the TG-1 and Hyperion were also observed. The producer’s accuracy for built-up and trees was very high for TG-1, which was about 3% and 5% higher than those of Hyperion data. Furthermore, the producer’s accuracy for cropland was 81.03% and 89.66% for the Hyperion data using the PMLC and PSVM respectively, while the producer’s accuracy for cropland was 87.03% and 92.97% using TG-1 data. It should be noted that both sensors had poor performance on grass classification, with a producer’s accuracy of 77.96% and 85.48% for TG-1 (PMLC and PSVM, respectively) and that of 73.68% and 78.95% for the Hyperion data. Moreover, it was clearly visible that a high amount of isolated pixels existed for grassland in the pixel-based classifications. The producer’s accuracy of the water was high for the pixel-based classifier (more than 90%) for both the TG-1 and Hyperion, whereas the producer’s accuracy of the shadows was relatively low (less than 88%).
Table 5 listed the accuracy assessment corresponding to the hybrid land-cover classifications with the best overall accuracy. For hybrid classification, the best OA of TG-1 was 91.86% and 94.02% (with a best Kc of 0.90 and 0.93) for the HMLC and HSVM, respectively, which was greater than that of Hyperion, which achieved 86.91% and 90.4% (with a best Kc of 0.84 and 0.88). In general for the hybrid classification method, the producer’s accuracy for nearly all land-cover types was approximately equal to, or greater than, 90%, except for grass and shadow, which scored below 90%, obviously. The grassland achieved a producer’s accuracy of greater than 84% for TG-1 as well as less than 82% for Hyperion data. Similar trend was observed for built-up and cropland. The built-up area achieved a producer’s accuracy of greater than 95% for TG-1, but less than 90% for Hyperion data. Comparing TG-1 imagery with Hyperion imagery, the additional accuracies of 5.8% and 4.5% in producer’s accuracy were observed for HMLC and HSVM approaches, respectively.

4.3.3. Comparison of the Pixel-Based and Hybrid Approaches

From the statistical results from five-fold cross-validation, it was found that the hybrid approach could achieve more promising accuracy in land-cover classification relative to the pixel-based approach for both the TG-1 and Hyperion data. Specifically, the increased average OA of the hybrid approach, compared to pixel-based method, was of 2.5% and 3.1% (with an increased average Kc of 0.3 and 0.4) for MLC and SVM when using TG-1, and an increased average OA of 0.6% and 0.9% (with an increased average Kc of 0.03 and 0.06) for MLC and SVM when using Hyperion.
Consistent with the trend of averaged statistical values, the classification accuracies in terms of the best values for the hybrid method were also better than those for the pixel-based method. It was observed that the maps from the pixel-based classification contained some mistakenly identified pixels of classes, whereas those generated via hybrid classification did not appear obvious. In particular, unlike the conventional classical approaches, the hybrid method did consider the pixel-based spatial information, thus making it more attractive to characterize grass/cropland and impervious surfaces over the urban regions. Furthermore, the hybrid approach on land-cover classification achieved better classification accuracy relative to the pixel-based method for the TG-1 data (with the OA of 2.8% and Kc of 0.35, on average), as well as for the Hyperion data (with the OA of 1.1% and Kc of 0.05, on average). It should be noted that the hybrid approach exhibited much fewer isolated pixels than the pixel-based approach for the TG-1 data, while it was not that obvious for the Hyperion data. This can be attributed to the fact that the finer spatial resolution of the TG-1 data enables the hybrid classifier to make better use of the spatial information in addition to spectral information to aid in discriminating between spectrally-similar classes.

5. Discussion

5.1. Potential Contribution of TG-1 in Urban Classification

In recent years, satellite hyperspectral sensors have become widely used. However, the spatial resolution of these sensors remains relatively low, making them of limited use for detailed urban mapping. The TG-1 system is a novel satellite hyperspectral sensor with a much finer spatial resolution than previous systems, and is expected to open up new possibilities in tracking complex urban scenes. The present study attempted to thoroughly investigate this sensor for urban land-cover classification.
This study showed that the results with fine spatial resolution TG-1 were slightly better than the results with medium spatial resolution Hyperion data, for both the pixel-based and hybrid classification approaches. Compared with Hyperion data, TG-1 data showed an increase in average OA accuracy of 3.36% with PMLC, 2.86% with PSVM, 5.24% with HMLC, and 5.02% with HSVM. The discrepancies between the two hyperspectral data were associated with some uncertainties from overpass time difference, residual errors from atmospheric correction, and the difference in SNR. However, the most significant factor relating to these discrepancies was the sensor spatial resolution. Previous references, such as [45,46], have also indicated that fine spatial resolution remote sensing data can be advantageous in mapping land-cover, especially for the heterogeneous environments, through reducing within-pixel heterogeneity and increasing spectral separability. In addition, the fine spatial resolution of TG (10 m) could collect a larger number of reference pixels relative to Hyperion data for classifier training (see Table 2), and can thereby enhance the classification performance to some extent.

5.2. Classification Techniques Analysis

Although a variety of references [47,48,49] have compared the capability of using satellite hyperspectral data (i.e., Hyperion) with airborne hyperspectral data (i.e., AVIRIS and MIVIS), there are rare quantitative comparisons among different satellite hyperspectral data that have different spatial resolution. To facilitate understanding of the hyperspectral data for heterogeneous land mapping, further evaluation and comparison of different classifiers concerning different spatial resolutions is required [27]. The current research evaluated the performance of two different types of classifiers (pixel-based and hybrid), focusing on different spatial resolution satellite hyperspectral data, the fine spatial resolution satellite TG-1 (with 10 m) and the most widely used hyperspectral satellite EO-1 Hyperion (with 30 m).
This study demonstrates that the used hybrid method, which integrates a pixel-based and object-based segmentation approach, can be a valid alternative for pixel-based classification of the complex regions. This work confirms previous findings of [16,50], which suggest that pixel-based classifiers are more appropriate for medium spatial resolution image, whereas object-based classifiers are more effective for discriminating land-cover types from fine spatial resolution images. In particular, the present study further extends earlier work to a broad range of satellite hyperspectral data with relatively finer spatial resolution.
Similar to most other object-based approaches, the accuracy of hybrid classifiers is directly influenced by the performance of image segmentation. In the present study, Hyperion images did not have the ability to achieve good segmentation results due to their comparatively coarser spatial resolution, thus it is not surprising that its correspondingly improved ability was not significant as TG-1 images. Furthermore, current research demonstrates that the potential of fine spatial resolution satellite hyperspectral data in urban mapping can be relatively significant if implemented in an appropriate classifier, such as the hybrid method.

6. Conclusions

This study evaluated the performance of fine spatial resolution satellite hyperspectral data, Chinese TG-1, by a comparison with EO-1 Hyperion image data. Both pixel-based and hybrid approaches were investigated for mapping urban land coverage types, during approximately the same time period and at the same location in Beijing, China. The used hybrid method, which integrates the pixel-based classifier and the object-based segmentation approach, can provide an effective alternative to the conventional pixel-based methods for processing the satellite hyperspectral data, especially the fine spatial resolution TG-1 data. Comparing hybrid classifiers with pixel-based classifiers, an apparent improvement was observed for TG-1 imagery, whereas only a slight improvement was observed for Hyperion imagery. Furthermore, results demonstrated that the novel fine spatial resolution TG-1 image was slightly better than the medium spatial resolution Hyperion image in urban land cover extraction, both for pixel-based and hybrid approaches.
Overall, it can be concluded that the fine spatial resolution satellite hyperspectral data (i.e., TG-1) is promising in delineating complex urban scenes especially when using an appropriate classifier, such as the hybrid classifier. More importantly, this finding could provide a reference for evaluating a future satellite hyperspectral sensor, such as the Chinese GaoFen-5, which is scheduled to launch in 2016 and has a spatial resolution of about 10–20 m.

Acknowledgments

This work is supported by the Project of Natural Science Foundation of China (41272364). The authors would like to thank Technology and Engineering Center for Space Utilization, Chinese Academy of Sciences and China Manned Space Engineering Project of TianGong-1 Civil Utilization for providing georectified, radiometrically calibrated TG-1 data. The EO-1 satellite image was provided by the US Geological Survey. The authors also wish to thank the anonymous reviewers for their useful comments that improved the quality of the manuscript.

Author Contributions

Xueke Li and Kai Liu proposed and developed the research design, manuscript writing and results interpretation. Taixia Wu supervised all the work that has been done by the first author. Yao Li and Lifu Zhang revised the manuscript extensively.

Conflicts of Interest

The authors declare no conflict of interest.

References

  1. Tong, Q.; Xue, Y.; Zhang, L. Progress in hyperspectral remote sensing science and technology in China over the past three decades. IEEE J. Sel. Top. Appl. Earth Obs. Remote Sens. 2014, 7, 70–91. [Google Scholar] [CrossRef]
  2. Goetz, A.F.H. Three decades of hyperspectral remote sensing of the earth: A personal view. Remote Sens. Environ. 2009, 113, S5–S16. [Google Scholar] [CrossRef]
  3. Fan, F.; Deng, Y. Enhancing endmember selection in multiple endmember spectral mixture analysis (MESMA) for urban impervious surface area mapping using spectral angle and spectral distance parameters. Int. J. Appl. Earth Obs. Geoinf. 2014, 33, 290–301. [Google Scholar] [CrossRef]
  4. Falcone, J.A.; Gomez, R. Mapping impervious surface type and sub-pixel abundance using hyperion hyperspectral imagery. Geocarto Int. 2005, 20, 3–10. [Google Scholar] [CrossRef]
  5. Cavalli, R.M.; Fusilli, L.; Pascucci, S.; Pignatti, S.; Santini, F. Hyperspectral sensor data capability for retrieving complex urban land cover in comparison with multispectral data: Venice city case study (Italy). Sensors 2008, 8, 3299–3320. [Google Scholar] [CrossRef]
  6. Jia, M.; Zhang, Y.; Wang, Z.; Song, K.; Ren, C. Mapping the distribution of mangrove species in the core zone of mai po marshes nature reserve, Hong Kong, using hyperspectral data and high-resolution data. Int. J. Appl. Earth Obs. Geoinf. 2014, 33, 226–231. [Google Scholar] [CrossRef]
  7. Tang, J.; Liu, L.; Cheng, H.; Hu, S.; Duan, J. Long-term orbit prediction for TianGong-1 spacecraft using the mean atmosphere model. Adv. Space Res. 2015, 55, 1432–1444. [Google Scholar] [CrossRef]
  8. Landgrebe, D. Hyperspectral image data analysis. IEEE Signal Process. Mag. 2002, 19, 17–28. [Google Scholar] [CrossRef]
  9. Rocchini, D.; Balkenhol, N.; Carter, G.A.; Foody, G.M.; Gillespie, T.W.; He, K.S.; Kark, S.; Levin, N.; Lucas, K.; Luoto, M.; et al. Remotely sensed spectral heterogeneity as a proxy of species diversity: Recent advances and open challenges. Ecol. Inform. 2010, 5, 318–329. [Google Scholar] [CrossRef]
  10. Weng, Q. Remote sensing of impervious surfaces in the urban areas: Requirements, methods, and trends. Remote Sens. Environ. 2012, 117, 34–49. [Google Scholar] [CrossRef]
  11. Sun, X.; Zhang, L.; Yang, H.; Wu, T.; Cen, Y.; Guo, Y. Enhancement of spectral resolution for remotely sensed multispectral image. IEEE J. Sel. Top. Appl. Earth Obs. Remote Sens. 2015, 8, 2198–2211. [Google Scholar] [CrossRef]
  12. Yokoya, N.; Yairi, T.; Iwasaki, A. Coupled nonnegative matrix factorization unmixing for hyperspectral and multispectral data fusion. IEEE Trans. Geosci. Remote Sens. 2012, 50, 528–537. [Google Scholar] [CrossRef]
  13. Segl, K.; Roessner, S.; Heiden, U.; Kaufmann, H. Fusion of spectral and shape features for identification of urban surface cover types using reflective and thermal hyperspectral data. ISPRS J. Photogramm. Remote Sens. 2003, 58, 99–112. [Google Scholar] [CrossRef]
  14. Liu, T.; Yang, X. Mapping vegetation in an urban area with stratified classification and multiple endmember spectral mixture analysis. Remote Sens. Environ. 2013, 133, 251–264. [Google Scholar] [CrossRef]
  15. Powell, R.L.; Roberts, D.A.; Dennison, P.E.; Hess, L.L. Sub-pixel mapping of urban land cover using multiple endmember spectral mixture analysis: Manaus, Brazil. Remote Sens. Environ. 2007, 106, 253–267. [Google Scholar] [CrossRef]
  16. Blaschke, T. Object based image analysis for remote sensing. ISPRS J. Photogramm. Remote Sens. 2010, 65, 2–16. [Google Scholar] [CrossRef]
  17. Myint, S.W.; Gober, P.; Brazel, A.; Grossman-Clarke, S.; Weng, Q. Per-pixel vs. Object-based classification of urban land cover extraction using high spatial resolution imagery. Remote Sens. Environ. 2011, 115, 1145–1161. [Google Scholar] [CrossRef]
  18. He, Y.; Franklin, S.E.; Guo, X.; Stenhouse, G.B. Object-oriented classification of multi-resolution images for the extraction of narrow linear forest disturbance. Remote Sens. Lett. 2011, 2, 147–155. [Google Scholar] [CrossRef]
  19. Walter, V. Object-based classification of remote sensing data for change detection. ISPRS J. Photogramm. Remote Sens. 2004, 58, 225–238. [Google Scholar] [CrossRef]
  20. Li, X.; Meng, Q.; Gu, X.; Jancso, T.; Yu, T.; Wang, K.; Mavromatis, S. A hybrid method combining pixel-based and object-oriented methods and its application in Hungary using Chinese HJ-1 satellite images. Int. J. Remote Sens. 2013, 34, 4655–4668. [Google Scholar] [CrossRef]
  21. Yang, J.; He, Y.; Weng, Q. An automated method to parameterize segmentation scale by enhancing intrasegment homogeneity and intersegment heterogeneity. IEEE Geosci. Remote Sens. Lett. 2015, 12, 1282–1286. [Google Scholar] [CrossRef]
  22. Shackelford, A.K.; Davis, C.H. A combined fuzzy pixel-based and object-based approach for classification of high-resolution multispectral data over urban areas. IEEE Trans. Geosci. Remote Sens. 2003, 41, 2354–2363. [Google Scholar] [CrossRef]
  23. Malinverni, E.S.; Tassetti, A.N.; Mancini, A.; Zingaretti, P.; Frontoni, E.; Bernardini, A. Hybrid object-based approach for land use/land cover mapping using high spatial resolution imagery. Int. J. Geogr. Inf. Sci. 2011, 25, 1025–1043. [Google Scholar] [CrossRef]
  24. Jacquin, A.; Misakova, L.; Gay, M. A hybrid object-based classification approach for mapping urban sprawl in periurban environment. Landsc. Urban Plan. 2008, 84, 152–165. [Google Scholar] [CrossRef]
  25. Duro, D.C.; Franklin, S.E.; Dubé, M.G. A comparison of pixel-based and object-based image analysis with selected machine learning algorithms for the classification of agricultural landscapes using spot-5 HRG imagery. Remote Sens. Environ. 2012, 118, 259–272. [Google Scholar] [CrossRef]
  26. Tiangong-1 Service Platform for Promoting Space Utilization. Available online: http://www.msadc.cn/ (accessed on 10 October 2013).
  27. Petropoulos, G.P.; Kalaitzidis, C.; Vadrevu, K.P. Support vector machines and object-based classification for obtaining land-use/cover cartography from hyperion hyperspectral imagery. Comput. Geosci. 2012, 41, 99–107. [Google Scholar] [CrossRef]
  28. Li, X.; Wang, J.; Zhang, L.; Wu, T.; Yang, H.; Liu, K.; Jiang, H. A combined object-based segmentation and support vector machines approach for classification of TianGong-01 hyperspectral urban data. In Proceedings of the 2014 IEEE Geoscience and Remote Sensing Symposium, Quebec City, QC, Canada, 13–18 July 2014; pp. 1777–1780.
  29. Adler-Golden, S.M.; Matthew, M.W.; Bernstein, L.S.; Levine, R.Y.; Berk, A.; Richtsmeier, S.C.; Acharya, P.K.; Anderson, G.P.; Felde, J.W.; Gardner, J. Atmospheric correction for shortwave spectral imagery based on MODTRAN4. In Proceedings of the SPIE’s International Symposium on Optical Science, Engineering, and Instrumentation, San-Diego, CA, USA, 9–14 July 1999.
  30. Thenkabail, P.S. Optimal hyperspectral narrowbands for discriminating agricultural crops. Remote Sens. Rev. 2001, 20, 257–291. [Google Scholar] [CrossRef]
  31. Foody, G.M.; Mathur, A. A relative evaluation of multiclass image classification by support vector machines. IEEE Trans. Geosci. Remote Sens. 2004, 42, 1335–1343. [Google Scholar] [CrossRef]
  32. Dean, A.; Smith, G. An evaluation of per-parcel land cover mapping using maximum likelihood class probabilities. Int. J. Remote Sens. 2003, 24, 2905–2920. [Google Scholar] [CrossRef]
  33. Huang, C.; Song, K.; Kim, S.; Townshend, J.R.G.; Davis, P.; Masek, J.G.; Goward, S.N. Use of a dark object concept and support vector machines to automate forest cover change analysis. Remote Sens. Environ. 2008, 112, 970–985. [Google Scholar] [CrossRef]
  34. Melgani, F.; Bruzzone, L. Classification of hyperspectral remote sensing images with support vector machines. IEEE Trans. Geosci. Remote Sens. 2004, 42, 1778–1790. [Google Scholar] [CrossRef]
  35. Liu, K.; Su, H.; Zhang, L.; Yang, H.; Zhang, R.; Li, X. Analysis of the urban heat island effect in Shijiazhuang, china using satellite and airborne data. Remote Sens. 2015, 7, 4804–4833. [Google Scholar] [CrossRef]
  36. Liu, K.; Su, H.; Li, X.; Wang, W.; Yang, L.; Liang, H. Quantifying spatial-temporal pattern of urban heat island in beijing: An improved assessment using land surface temperature (LST) time series observations from LANDSAT, MODIS, and Chinese new satellite GaoFen-1. IEEE J. Sel. Top. Appl. Earth Obs. Remote Sens. 2016, 9, 2028–2042. [Google Scholar] [CrossRef]
  37. Baatz, M.; Schäpe, A. Multiresolution segmentation: An optimization approach for high quality multi-scale image segmentation. In Angewandte Geographische Informations-Verarbeitung XII; Herbert Wichmann Verlag: Heidelberg, Germany, 2000; pp. 12–23. [Google Scholar]
  38. Huang, C.; Davis, L.; Townshend, J. An assessment of support vector machines for land cover classification. Int. J. Remote Sens. 2002, 23, 725–749. [Google Scholar] [CrossRef]
  39. Lawrence, R.; Bunn, A.; Powell, S.; Zambon, M. Classification of remotely sensed imagery using stochastic gradient boosting as a refinement of classification tree analysis. Remote Sens. Environ. 2004, 90, 331–336. [Google Scholar] [CrossRef]
  40. Song, C.; Woodcock, C.E.; Seto, K.C.; Lenney, M.P.; Macomber, S.A. Classification and change detection using landsat tm data: When and how to correct atmospheric effects? Remote Sens. Environ. 2001, 75, 230–244. [Google Scholar] [CrossRef]
  41. Schmidt, K.; Skidmore, A. Spectral discrimination of vegetation types in a coastal wetland. Remote Sens. Environ. 2003, 85, 92–108. [Google Scholar] [CrossRef]
  42. George, R.; Padalia, H.; Kushwaha, S. Forest tree species discrimination in western Himalaya using EO-1 Hyperion. Int. J. Appl. Earth Obs. Geoinf. 2014, 28, 140–149. [Google Scholar] [CrossRef]
  43. Chang, C.-C.; Lin, C.-J. Training v-support vector regression: Theory and algorithms. Neural Comput. 2002, 14, 1959–1977. [Google Scholar] [CrossRef] [PubMed]
  44. Chang, M.-W.; Lin, C.-J. Leave-one-out bounds for support vector regression model selection. Neural Comput. 2005, 17, 1188–1222. [Google Scholar] [CrossRef]
  45. Zhang, C.; Xie, Z. Combining object-based texture measures with a neural network for vegetation mapping in the everglades from hyperspectral imagery. Remote Sens. Environ. 2012, 124, 310–320. [Google Scholar] [CrossRef]
  46. Belluco, E.; Camuffo, M.; Ferrari, S.; Modenese, L.; Silvestri, S.; Marani, A.; Marani, M. Mapping salt-marsh vegetation by multispectral and hyperspectral remote sensing. Remote Sens. Environ. 2006, 105, 54–67. [Google Scholar] [CrossRef]
  47. Pignatti, S.; Cavalli, R.M.; Cuomo, V.; Fusilli, L.; Pascucci, S.; Poscolieri, M.; Santini, F. Evaluating Hyperion capability for land cover mapping in a fragmented ecosystem: Pollino national park, Italy. Remote Sens. Environ. 2009, 113, 622–634. [Google Scholar] [CrossRef]
  48. Asner, G.P.; Heidebrecht, K.B. Imaging spectroscopy for desertification studies: Comparing AVIRIS and EO-1 Hyperion in Argentina DRYLANDS. IEEE Trans. Geosci. Remote Sens. 2003, 41, 1283–1296. [Google Scholar] [CrossRef]
  49. Roberts, D.; Dennison, P.E.; Gardner, M.E.; Hetzel, Y.; Ustin, S.L.; Lee, C.T. Evaluation of the potential of Hyperion for fire danger assessment by comparison to the airborne visible/infrared imaging spectrometer. IEEE Trans. Geosci. Remote Sens. 2003, 41, 1297–1310. [Google Scholar] [CrossRef]
  50. Blaschke, T.; Hay, G.J.; Kelly, M.; Lang, S.; Hofmann, P.; Addink, E.; Queiroz Feitosa, R.; van der Meer, F.; van der Werff, H.; van Coillie, F. Geographic object-based image analysis—towards a new paradigm. ISPRS J. Photogramm. Remote Sens. 2014, 87, 180–191. [Google Scholar] [CrossRef] [PubMed]
Figure 1. Study area located to the northwest of Beijing, China. In the lower row, (a) the false color EO-1 Hyperion image; and (b) the false color TG-1 image.
Remotesensing 08 00438 g001
Figure 2. The ground truth area is labelled in red; the background image is the composite pan-sharpened GF-1 image (the spatial resolution of 2 m) of June 2013 in RGB combination of band 3, band 2, and band 1.
Remotesensing 08 00438 g002
Figure 3. Overall process diagram of this research study.
Remotesensing 08 00438 g003
Figure 4. Comparison of different spectra reflectance of land-cover types obtained from TG-1 (a) and Hyperion (b), from the corresponding represented pure region.
Remotesensing 08 00438 g004
Figure 5. The average value calculated by five-fold cross validation method for the OA (a) and Kc (b) of the TG-1 and Hyperion images classified by using PMLC, PSVM, HMLC, and HSVM.
Remotesensing 08 00438 g005
Table 1. Characteristics of TG-1 and Hyperion data used in this study.
Sensor ParametersTG-1Hyperion
Band TypeVNIRSWIRVNIRSWIR
Bands646470172
Spatial Resolution (m)10203030
Bandwidth (nm)10231010
Spectral coverage (nm)400–10001000–2500355–1058852–2577
IFOV (°)0.0250.050.043
Swath width (km)107.5
Altitude (km)340705
Table 2. The seven spectral classes used for classification, and the number of pixels selected for each class using TG-1 and Hyperion sensors.
IDClassNo. of Samples
TG-1 PixelsHyperion Pixels
1Built-up1148391
2Cropland921288
3Grass932283
4Trees927288
5Water906307
6Barren land953399
7Shadow904276
Table 3. Parameter values used in multi-resolution segmentation algorithm.
Image Segmentation Parameters
Sensor TypeAlgorithmScaleColor/ShapeSmoothness/Compactness# of Objects
TG-1HMLC150.8/0.20.5/0.5116,541
HSVM12185,548
HyperionHMLC230.8/0.20.5/0.57669
HSVM1813,875
Table 4. Confusion matrices and associated pixel-based classifier accuracy with the best OA in regard to sensors of TG-1 and Hyperion *.
TG-1: Pixel-based, MLC (OA = 88.43%, Kc = 0.86)
Built-upCroplandGrassTreesWaterBarren landShadow
Pa91.387.0377.9695.1693.4187.3786.19
Ua90.1384.7485.887.1994.9791.2184.78
TG-1: Pixel-based, SVM (OA = 91.94%, Kc = 0.90)
Built-upCroplandGrassTreesWaterBarren landShadow
Pa91.392.9785.4894.6296.795.2687.29
Ua93.3391.4986.4190.2696.1791.8894.05
Hyperion: Pixel-based, MLC (OA = 85.51%, Kc = 0.83)
Built-upCroplandGrassTreesWaterBarren landShadow
Pa88.4681.0373.6889.6690.1686.6787.5
Ua94.5283.9372.4185.2596.4985.2579.03
Hyperion: Pixel-based, SVM (OA = 89.71%, Kc = 0.88)
Built-upCroplandGrassTreesWaterBarren landShadow
Pa88.4689.6678.9591.3895.0896.6787.62
Ua97.1885.2583.386.8992.0686.5796.08
* OA = Overall accuracy; Pa = Producer’s accuracy; Ua = User’s accuracy; Kc = Kappa coefficient.
Table 5. Confusion matrices and associated hybrid classifier accuracy with the best OA in regard to sensors of TG-1 and Hyperion *.
TG: Hybrid MLC (OA = 91.86%, Kc = 0.90)
Built-upCroplandGrassTreesWaterBarren landShadow
Pa95.6590.2783.8794.6297.891.0588.95
Ua91.2986.0893.9885.8595.796.1195.83
TG: Hybrid SVM (OA = 94.02%, Kc = 0.93)
Built-upCroplandGrassTreesWaterBarren landShadow
Pa96.9695.6890.3293.5596.1596.3288.4
Ua95.7190.3194.3890.1696.1595.8195.81
Hyperion: Hybrid MLC (OA = 86.91%, Kc = 0.84)
Built-upCroplandGrassTreesWaterBarren landShadow
Pa89.7484.4875.4489.6690.1688.3389.29
Ua92.1187.572.8888.1493.2291.3881.97
Hyperion: Hybrid SVM (OA = 90.4%, Kc = 0.88)
Built-upCroplandGrassTreesWaterBarren landShadow
Pa89.7491.3882.4691.3895.0896.6785.71
Ua97.2288.3382.4692.9892.0687.8890.56
* OA = Overall accuracy; Pa = Producer’s accuracy; Ua = User’s accuracy; Kc = Kappa coefficient.

