
Remote Sensing-Based Exploration of Structurally-Related Mineralizations around Mount Isa, Queensland, Australia


Abstract
:
1. Introduction
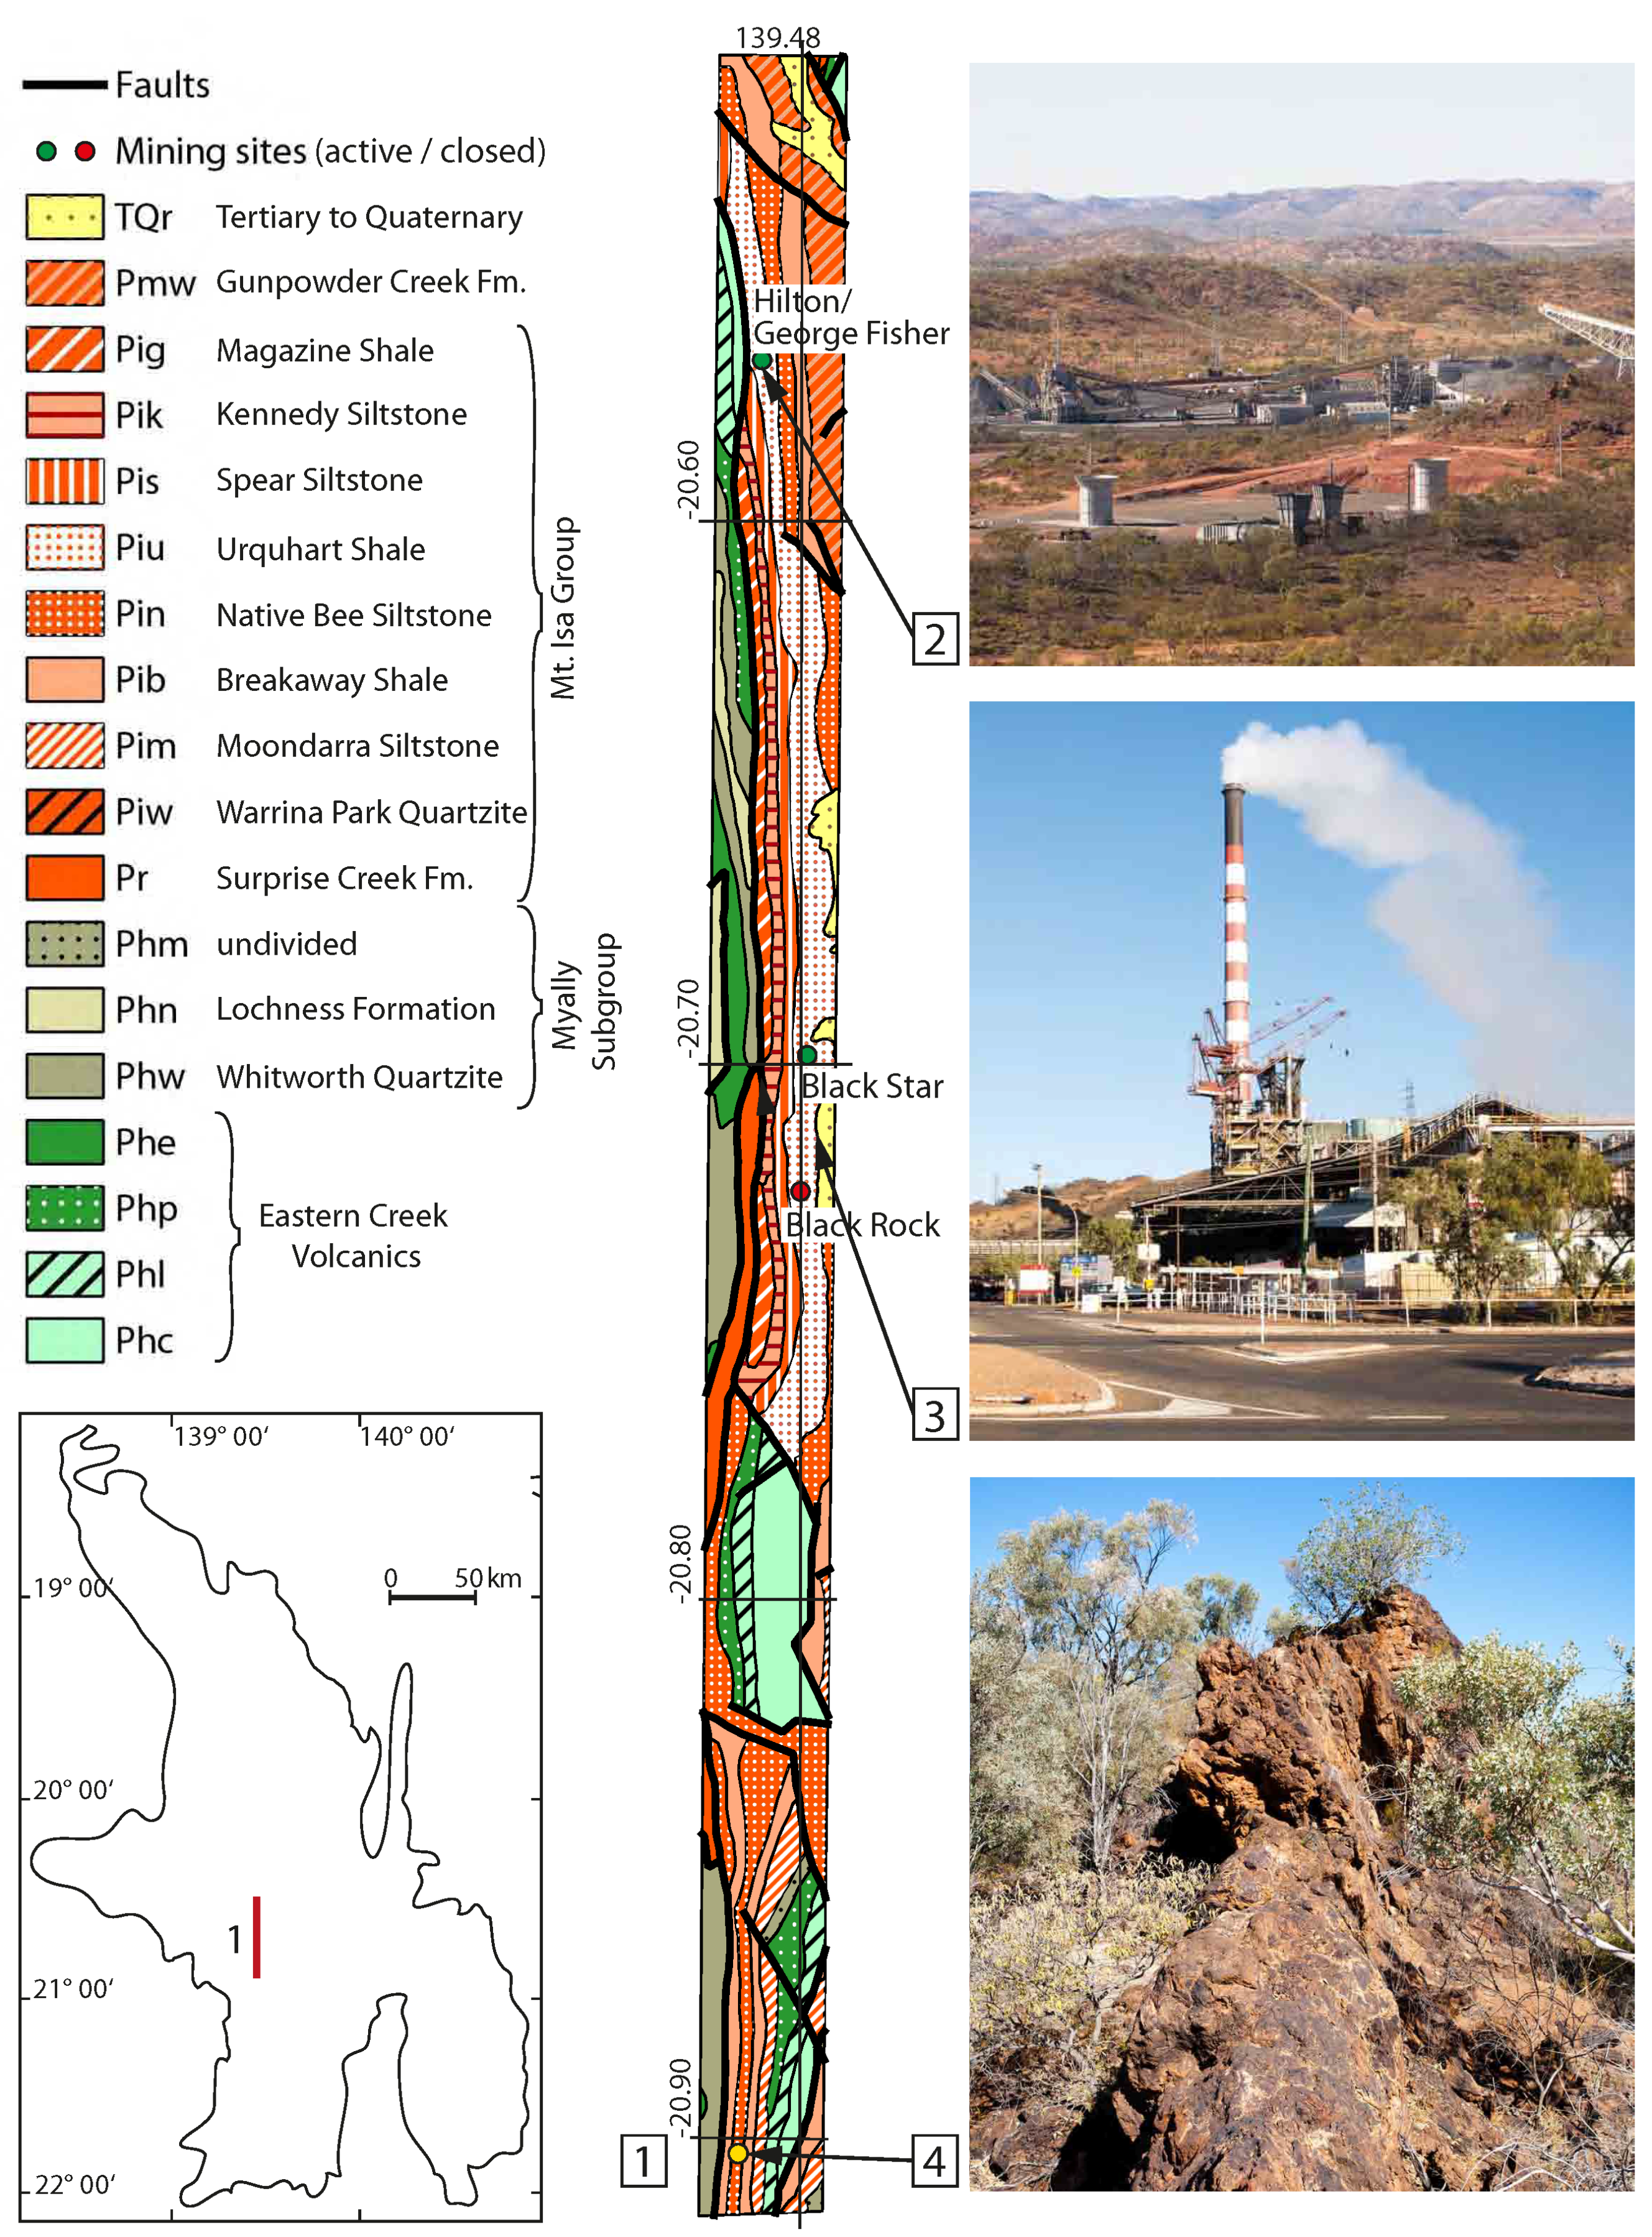
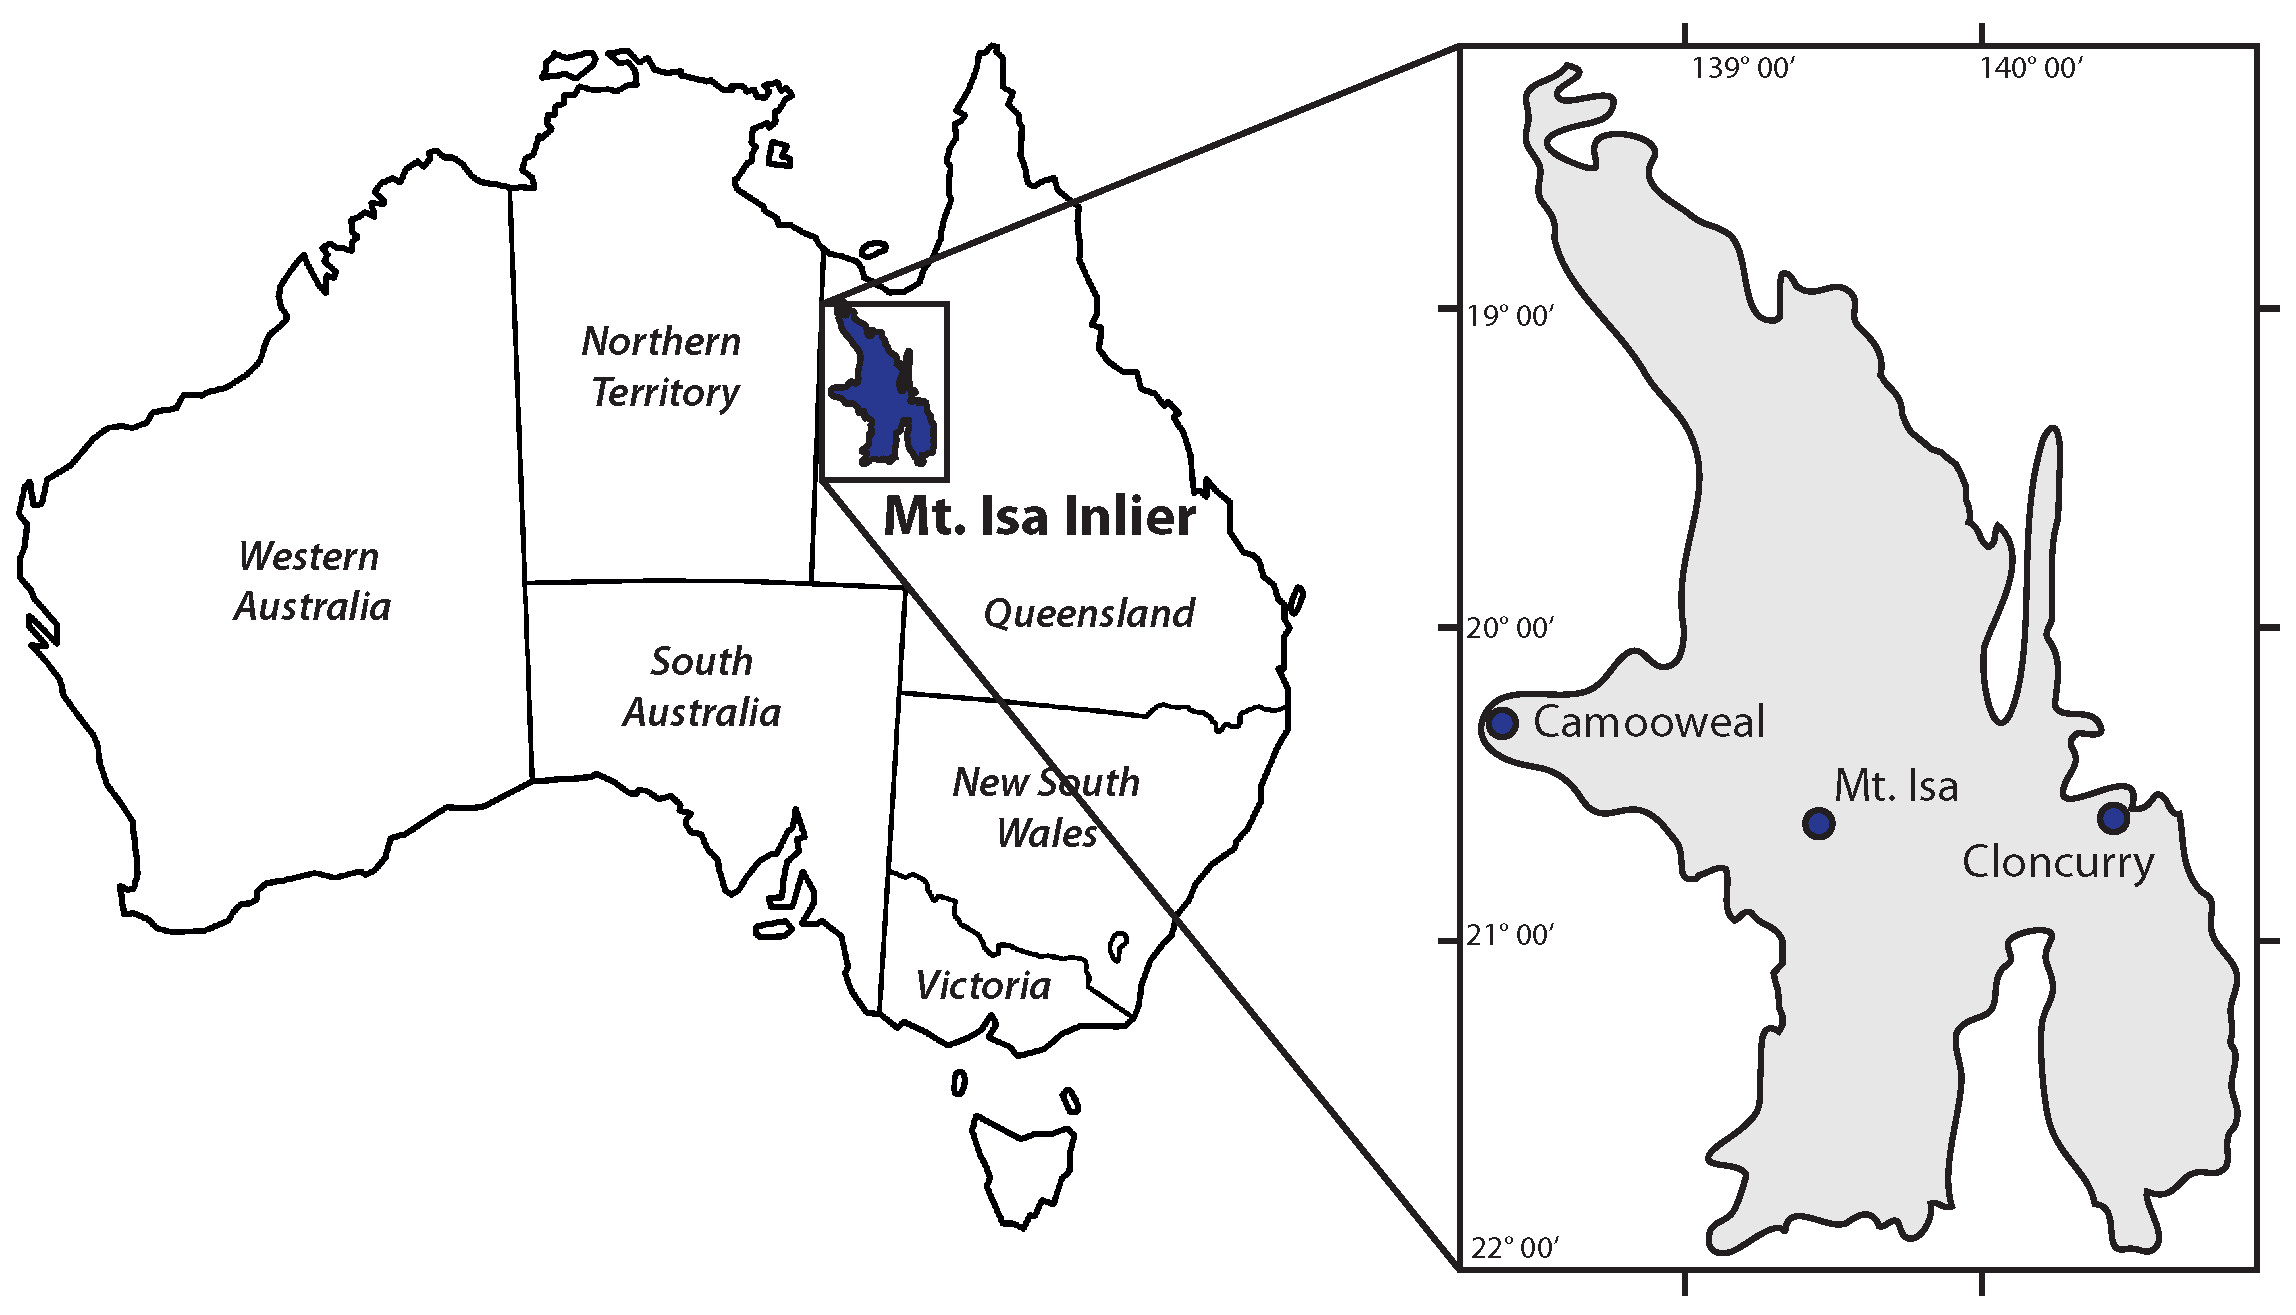
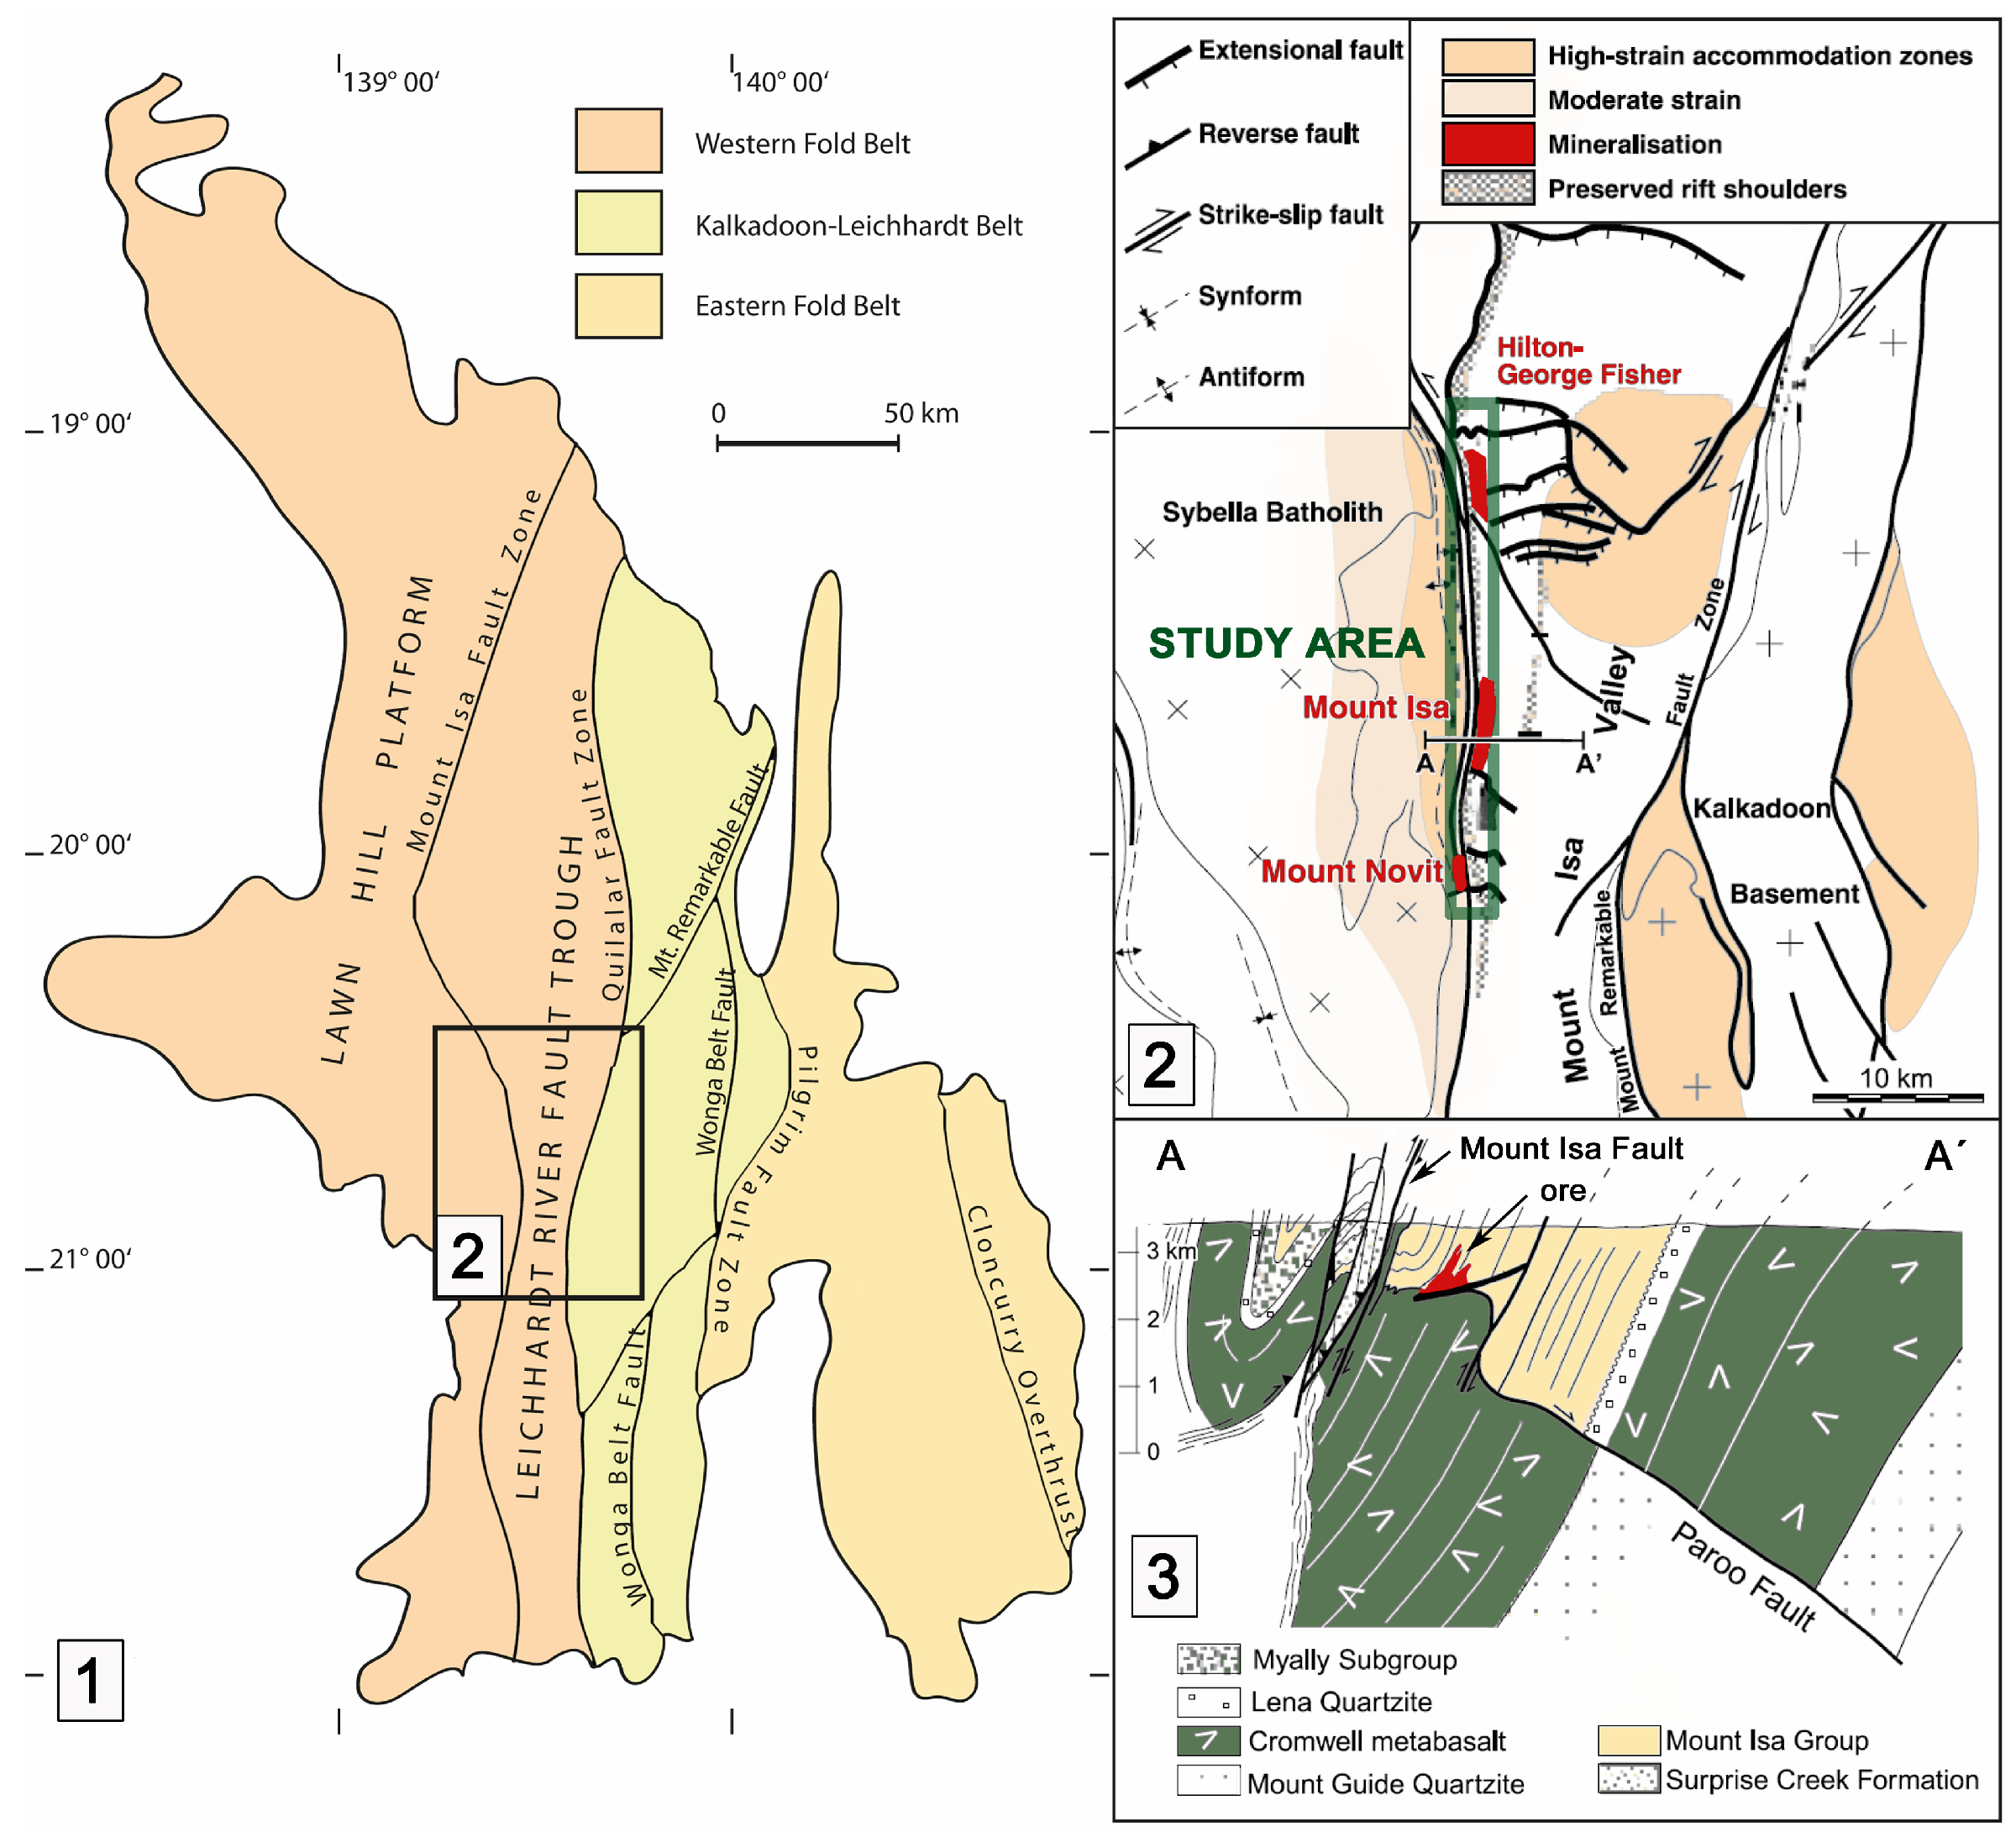
2. Study Area
3. Regional Geology
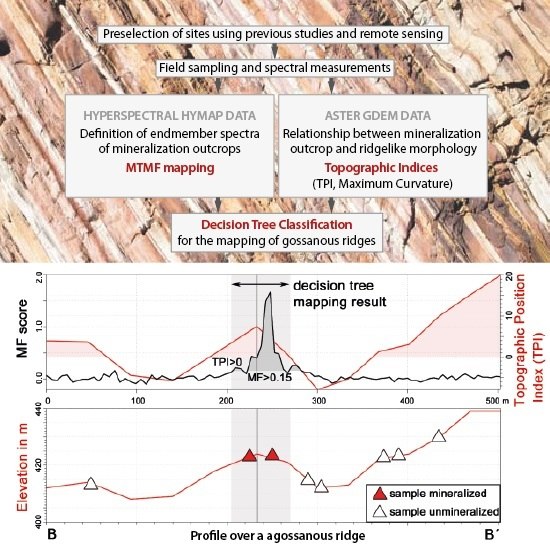
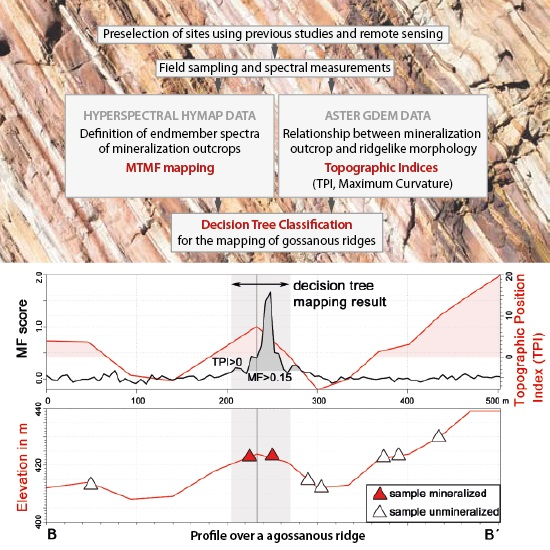
4. Used Data and Methods
4.1. Hyperspectral Data
4.1.1. Sensor and Data Characteristics
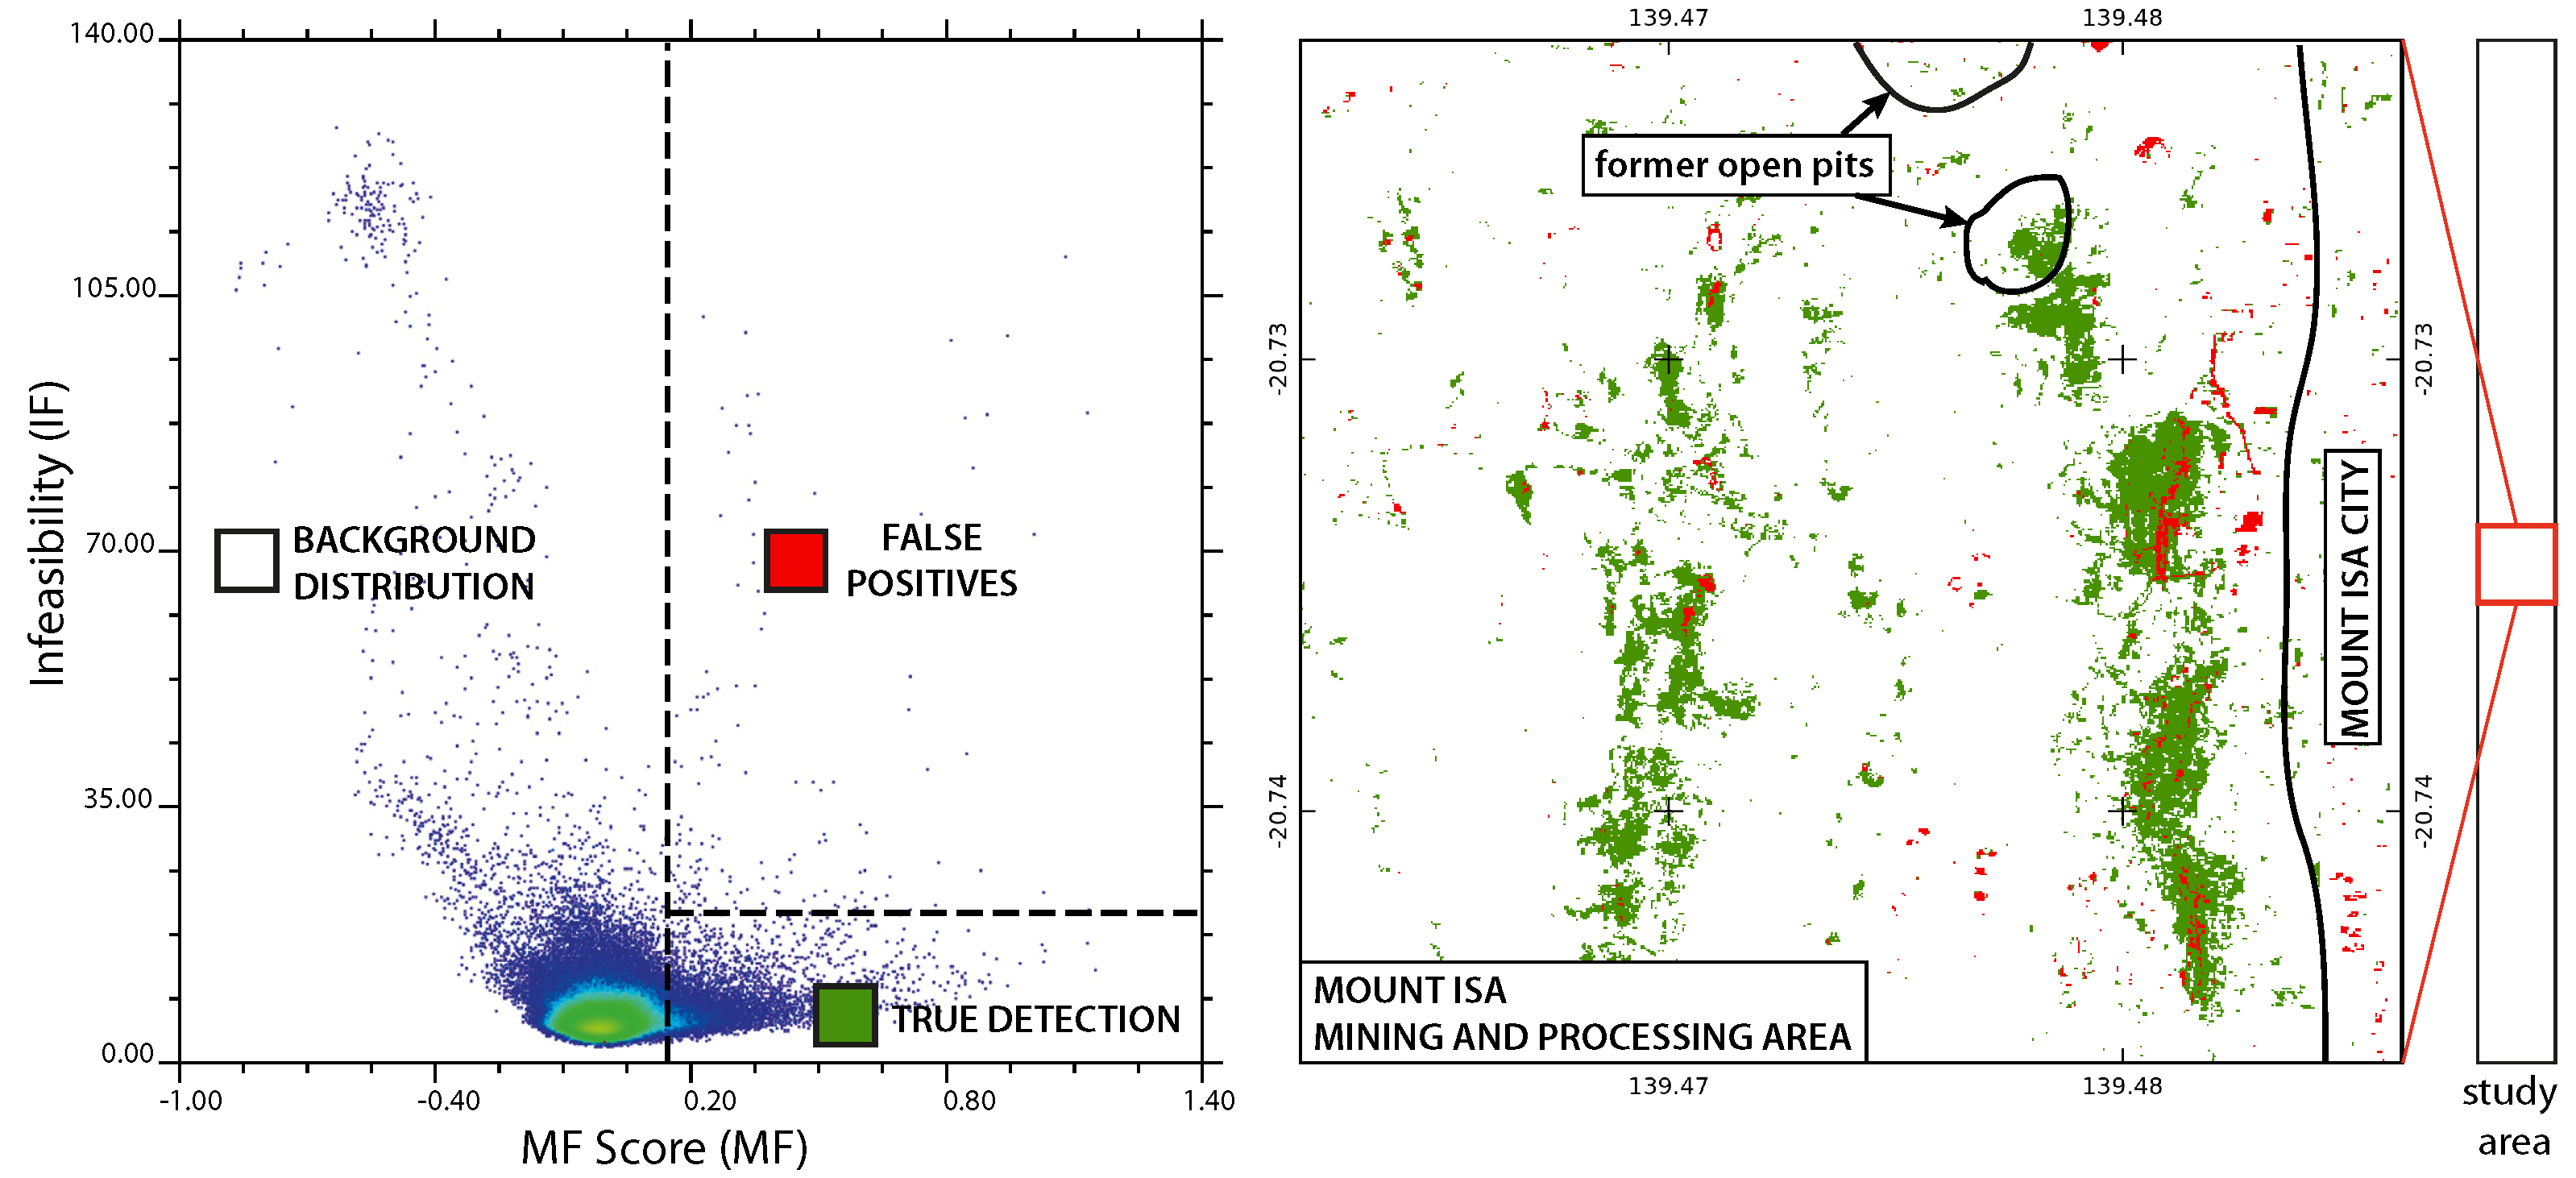
4.1.2. Mixture Tuned Matched Filtering
4.2. Geomorphological Data
4.2.1. Topographic Position Index
4.2.2. Maximum Curvature
4.3. Definition of Threshold Values
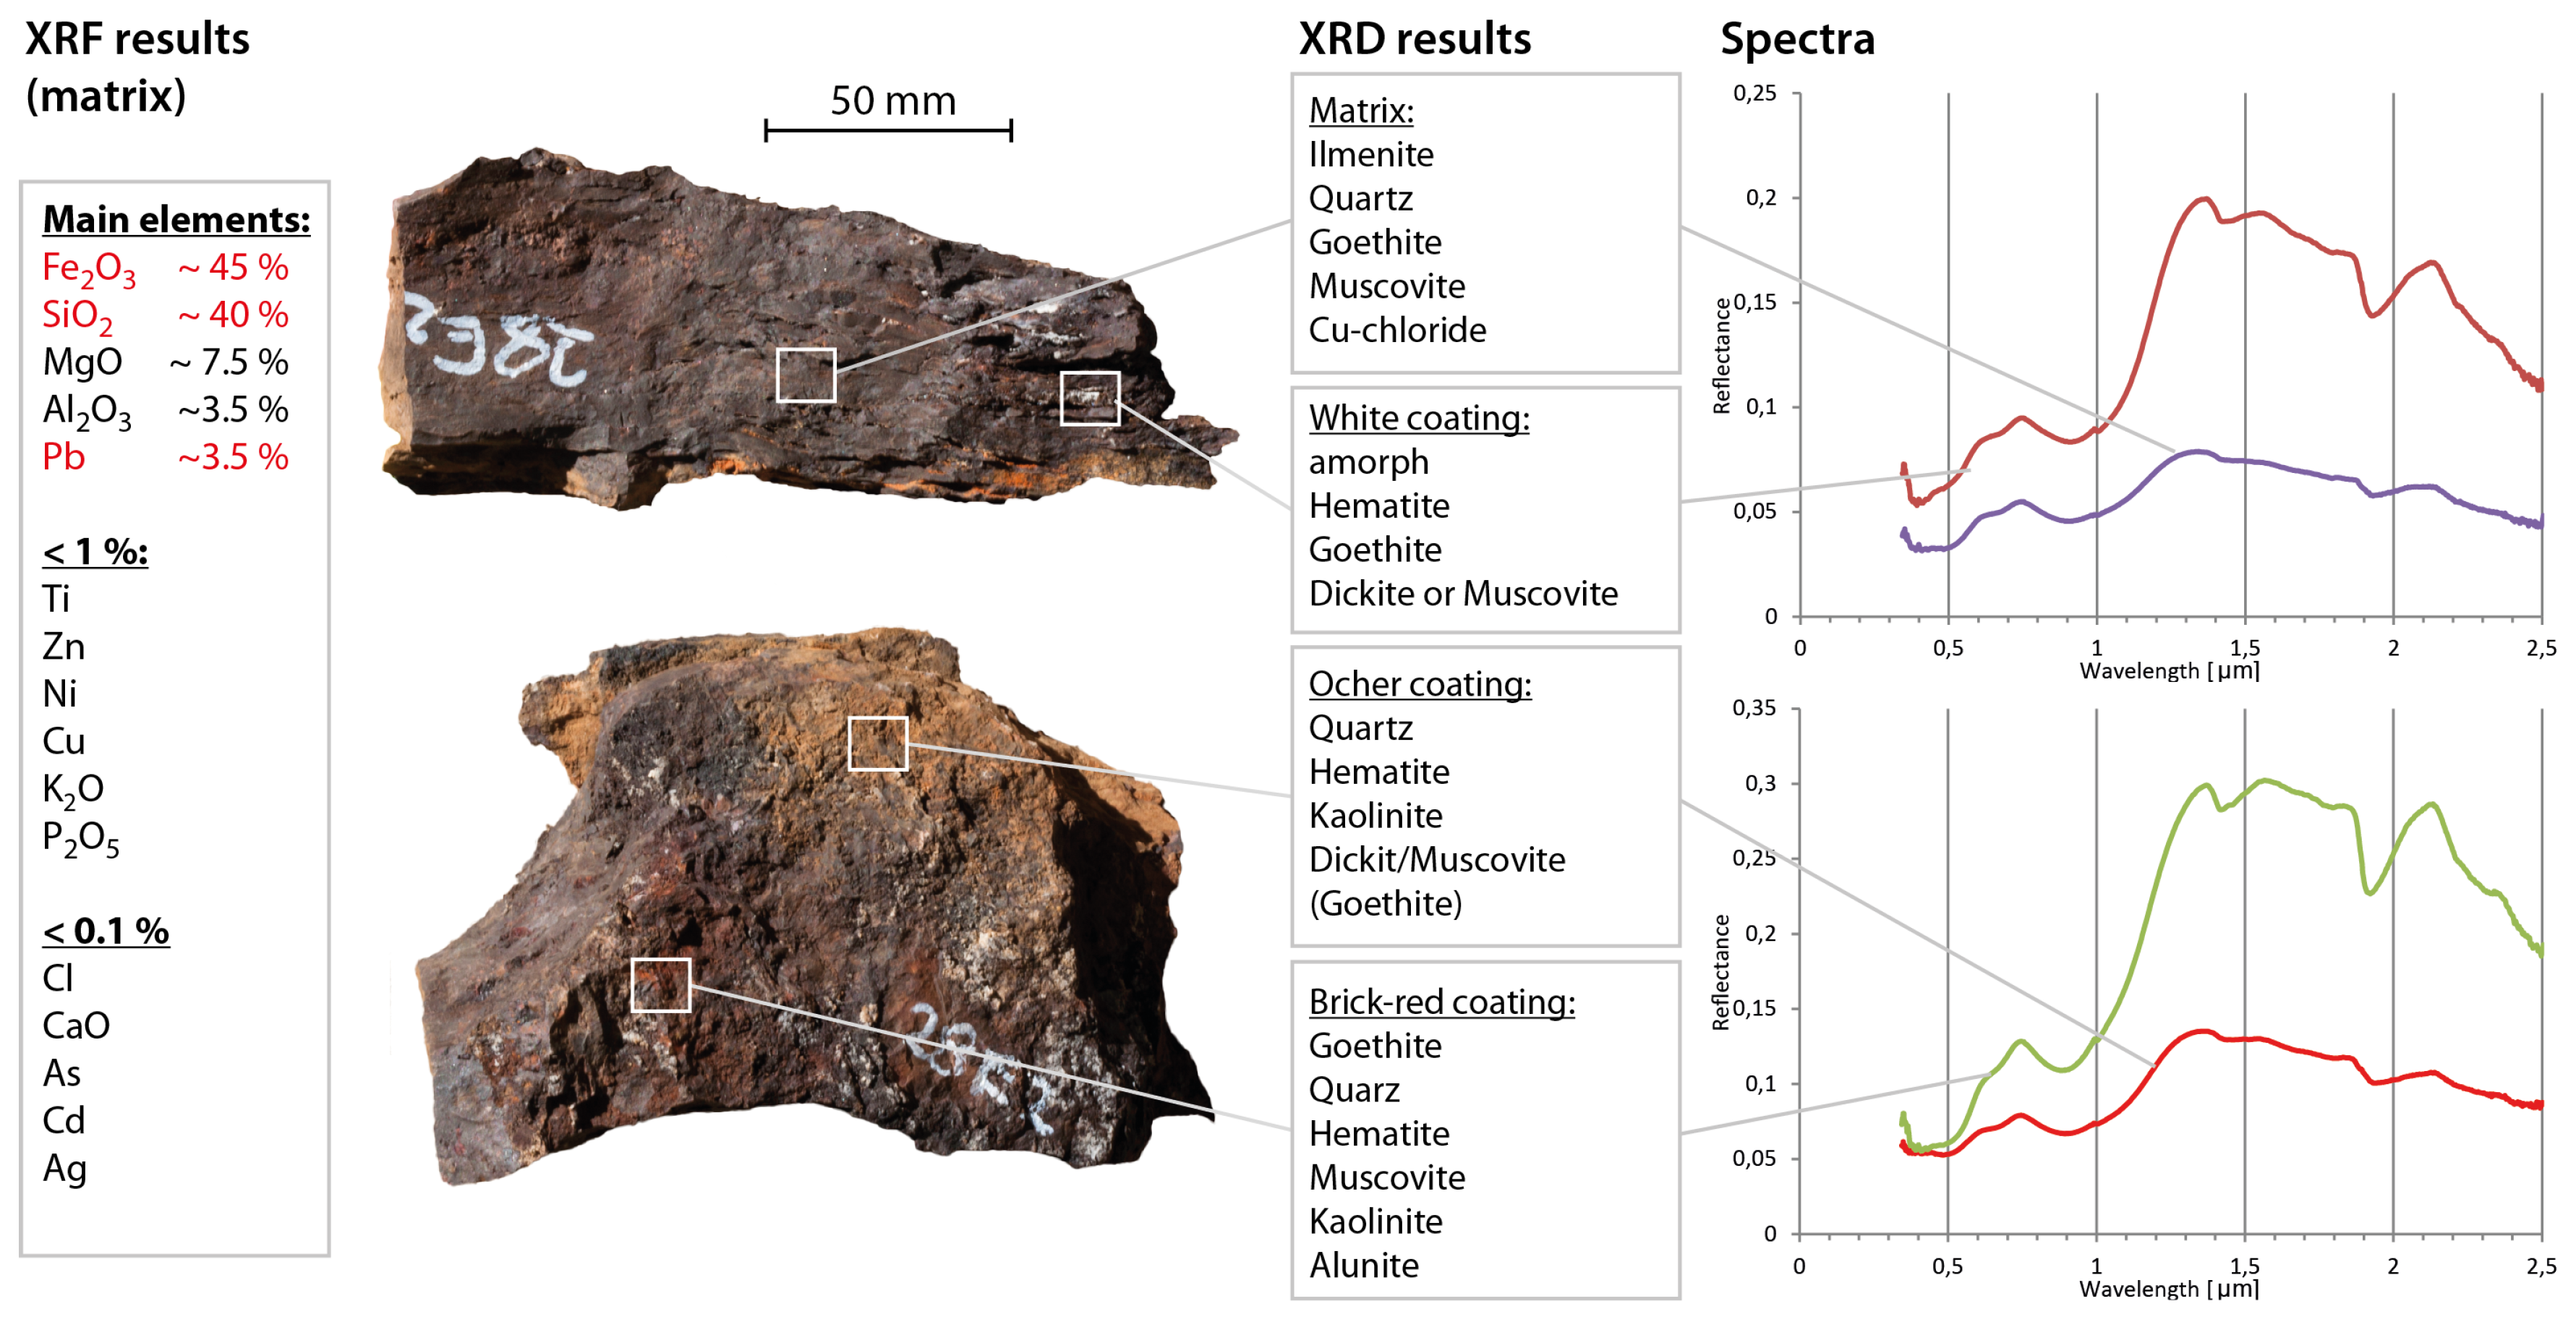
4.4. X-Ray Diffraction and Fluorescence Spectroscopy
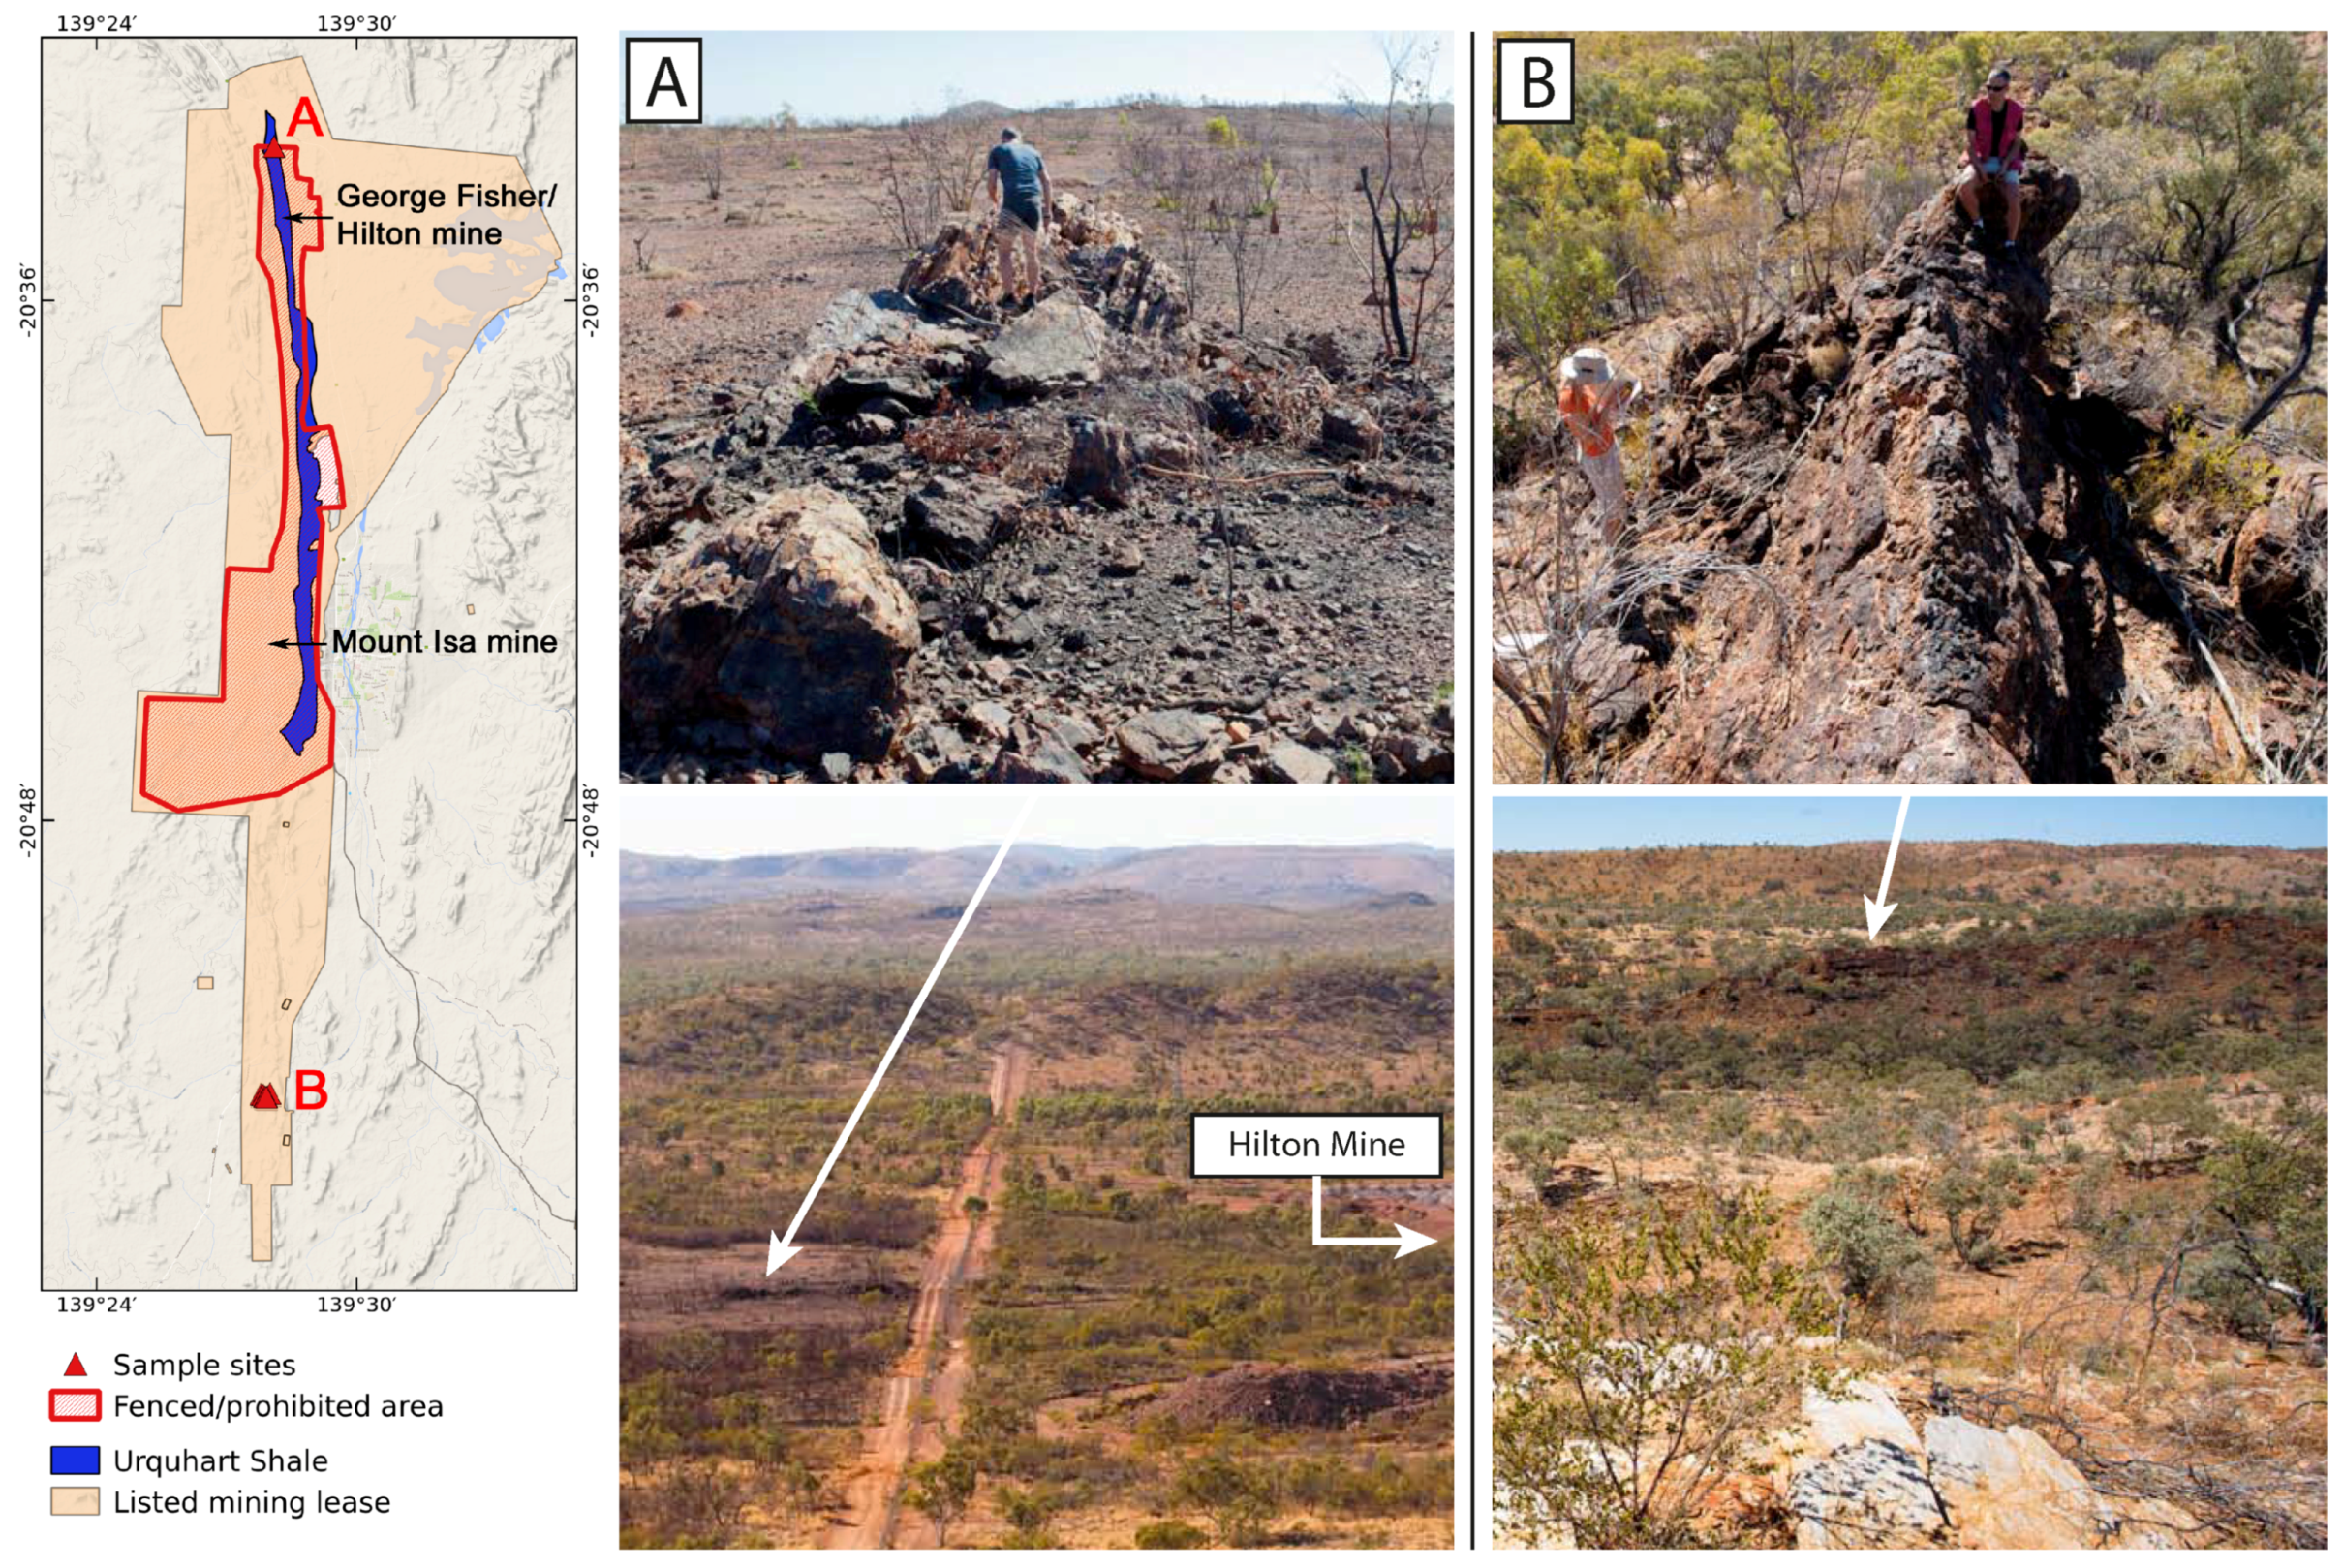
5. Preparation and Fieldwork
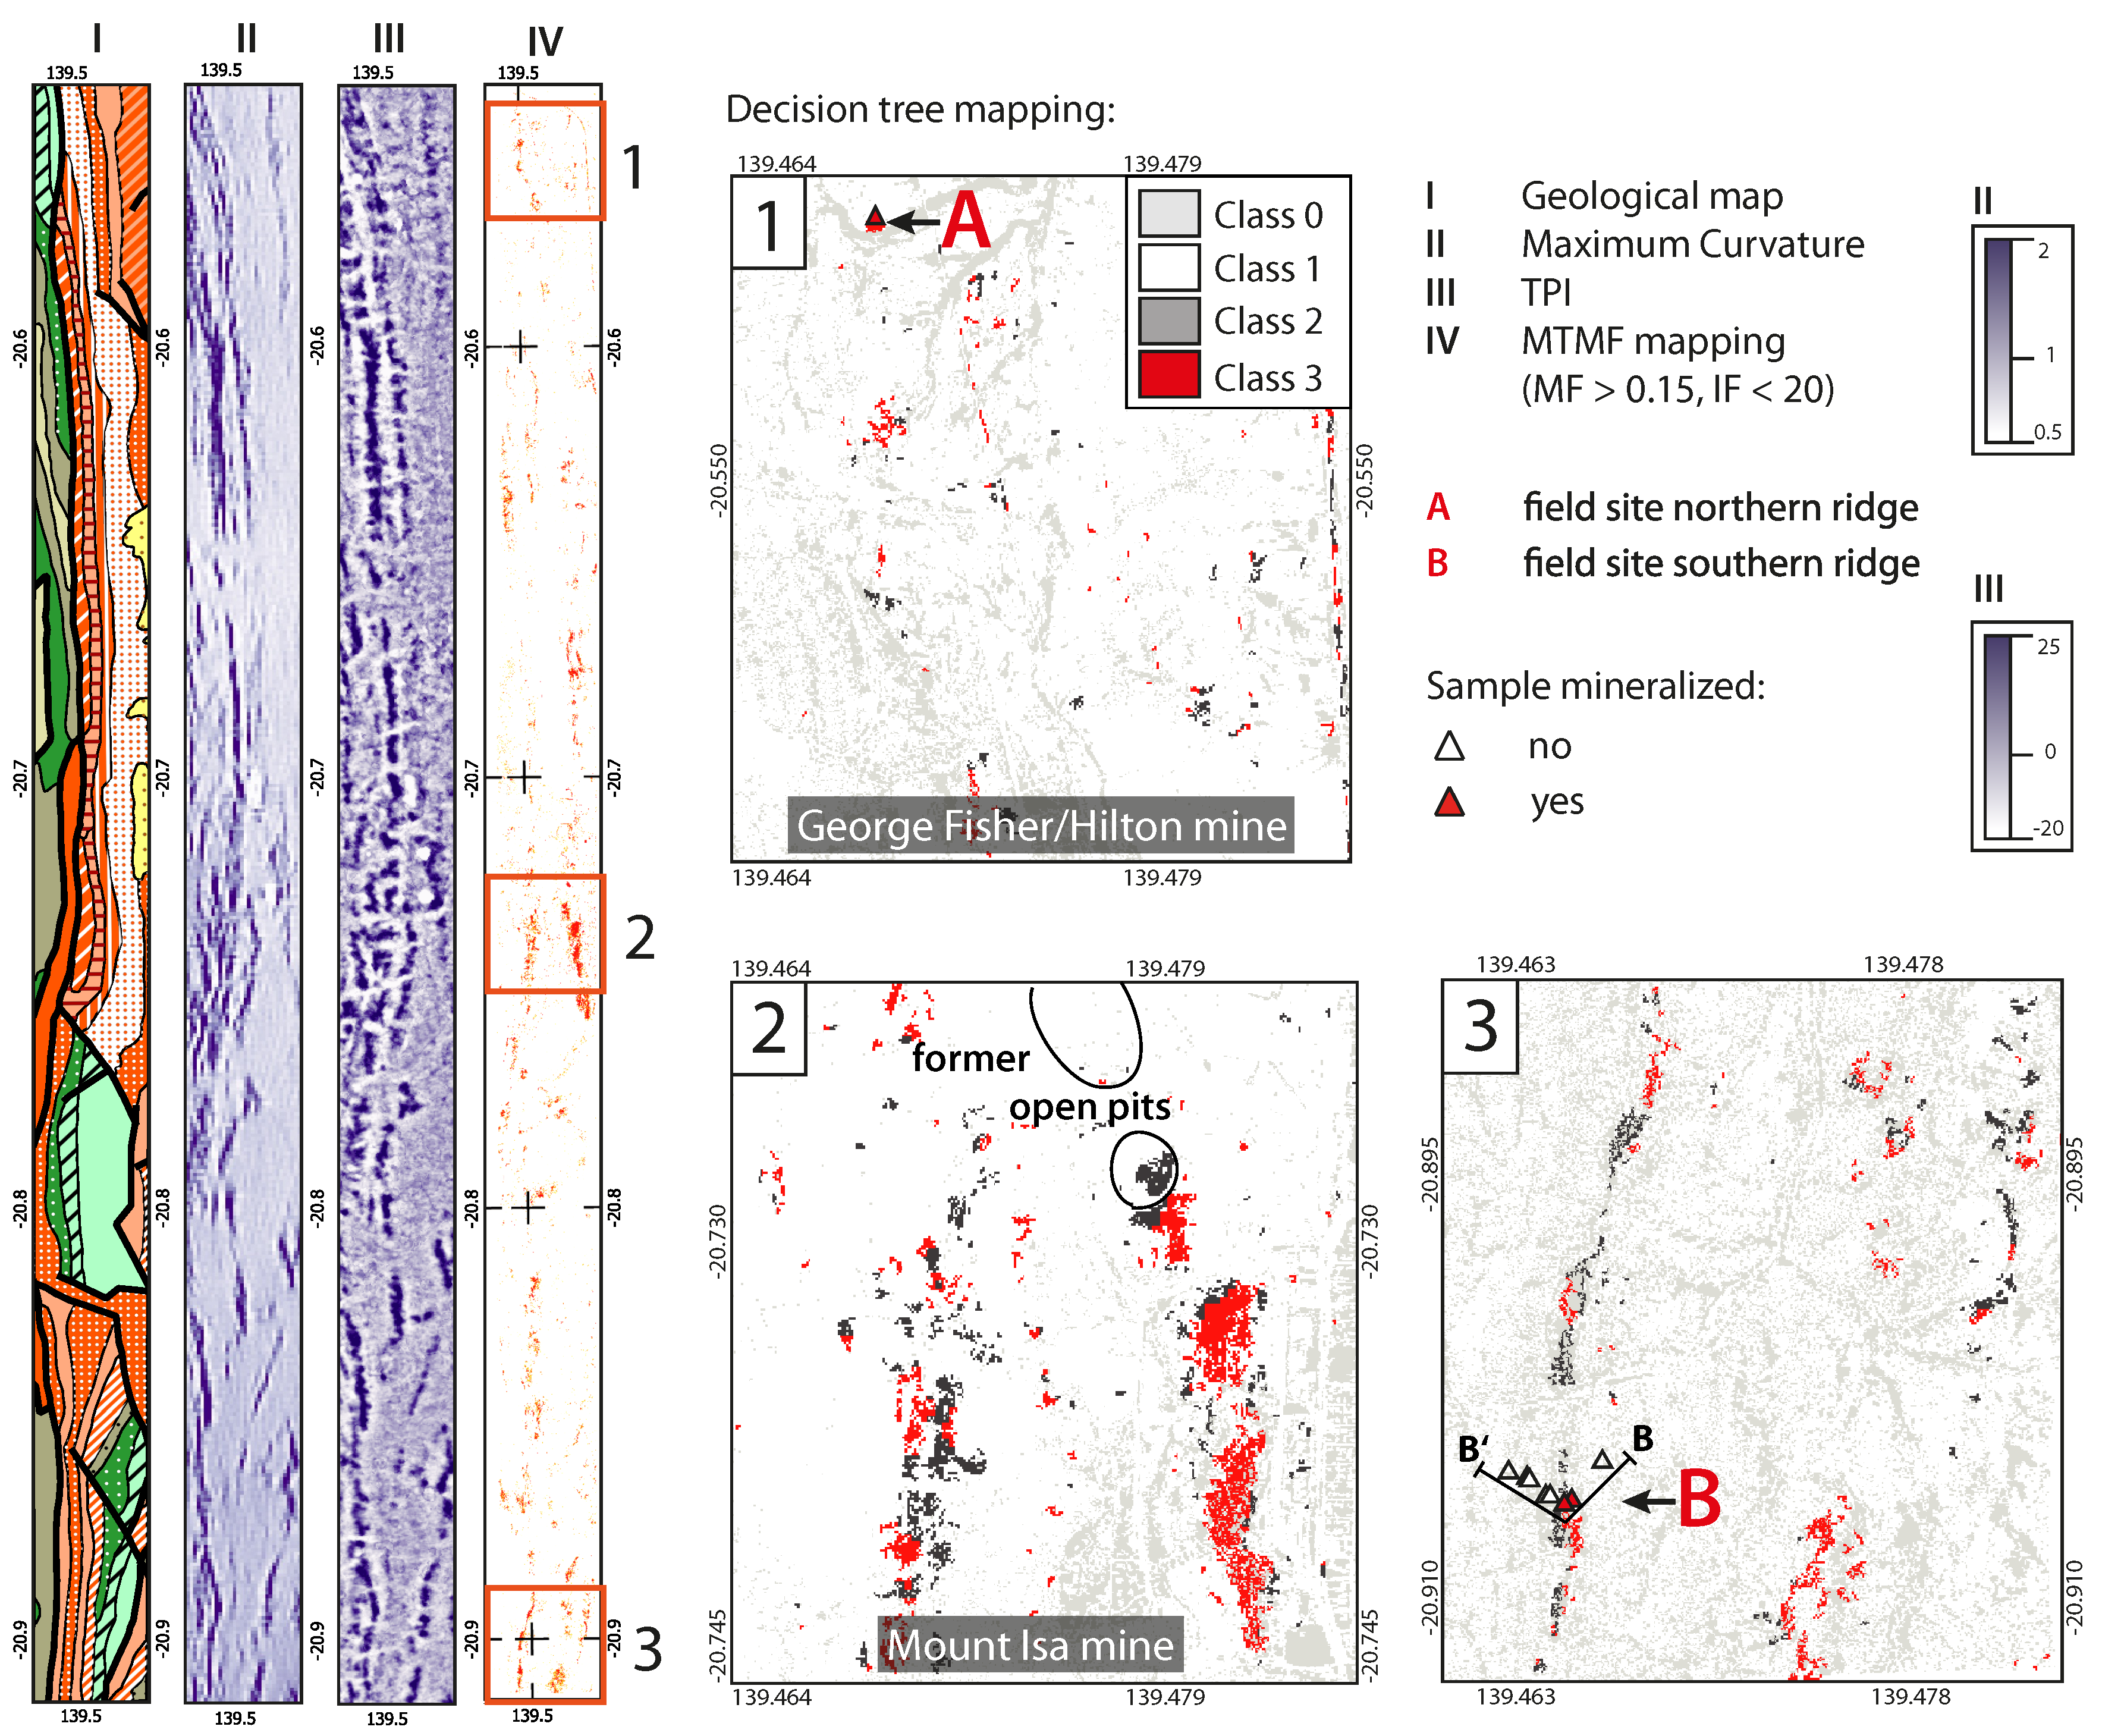
6. Results
7. Discussion
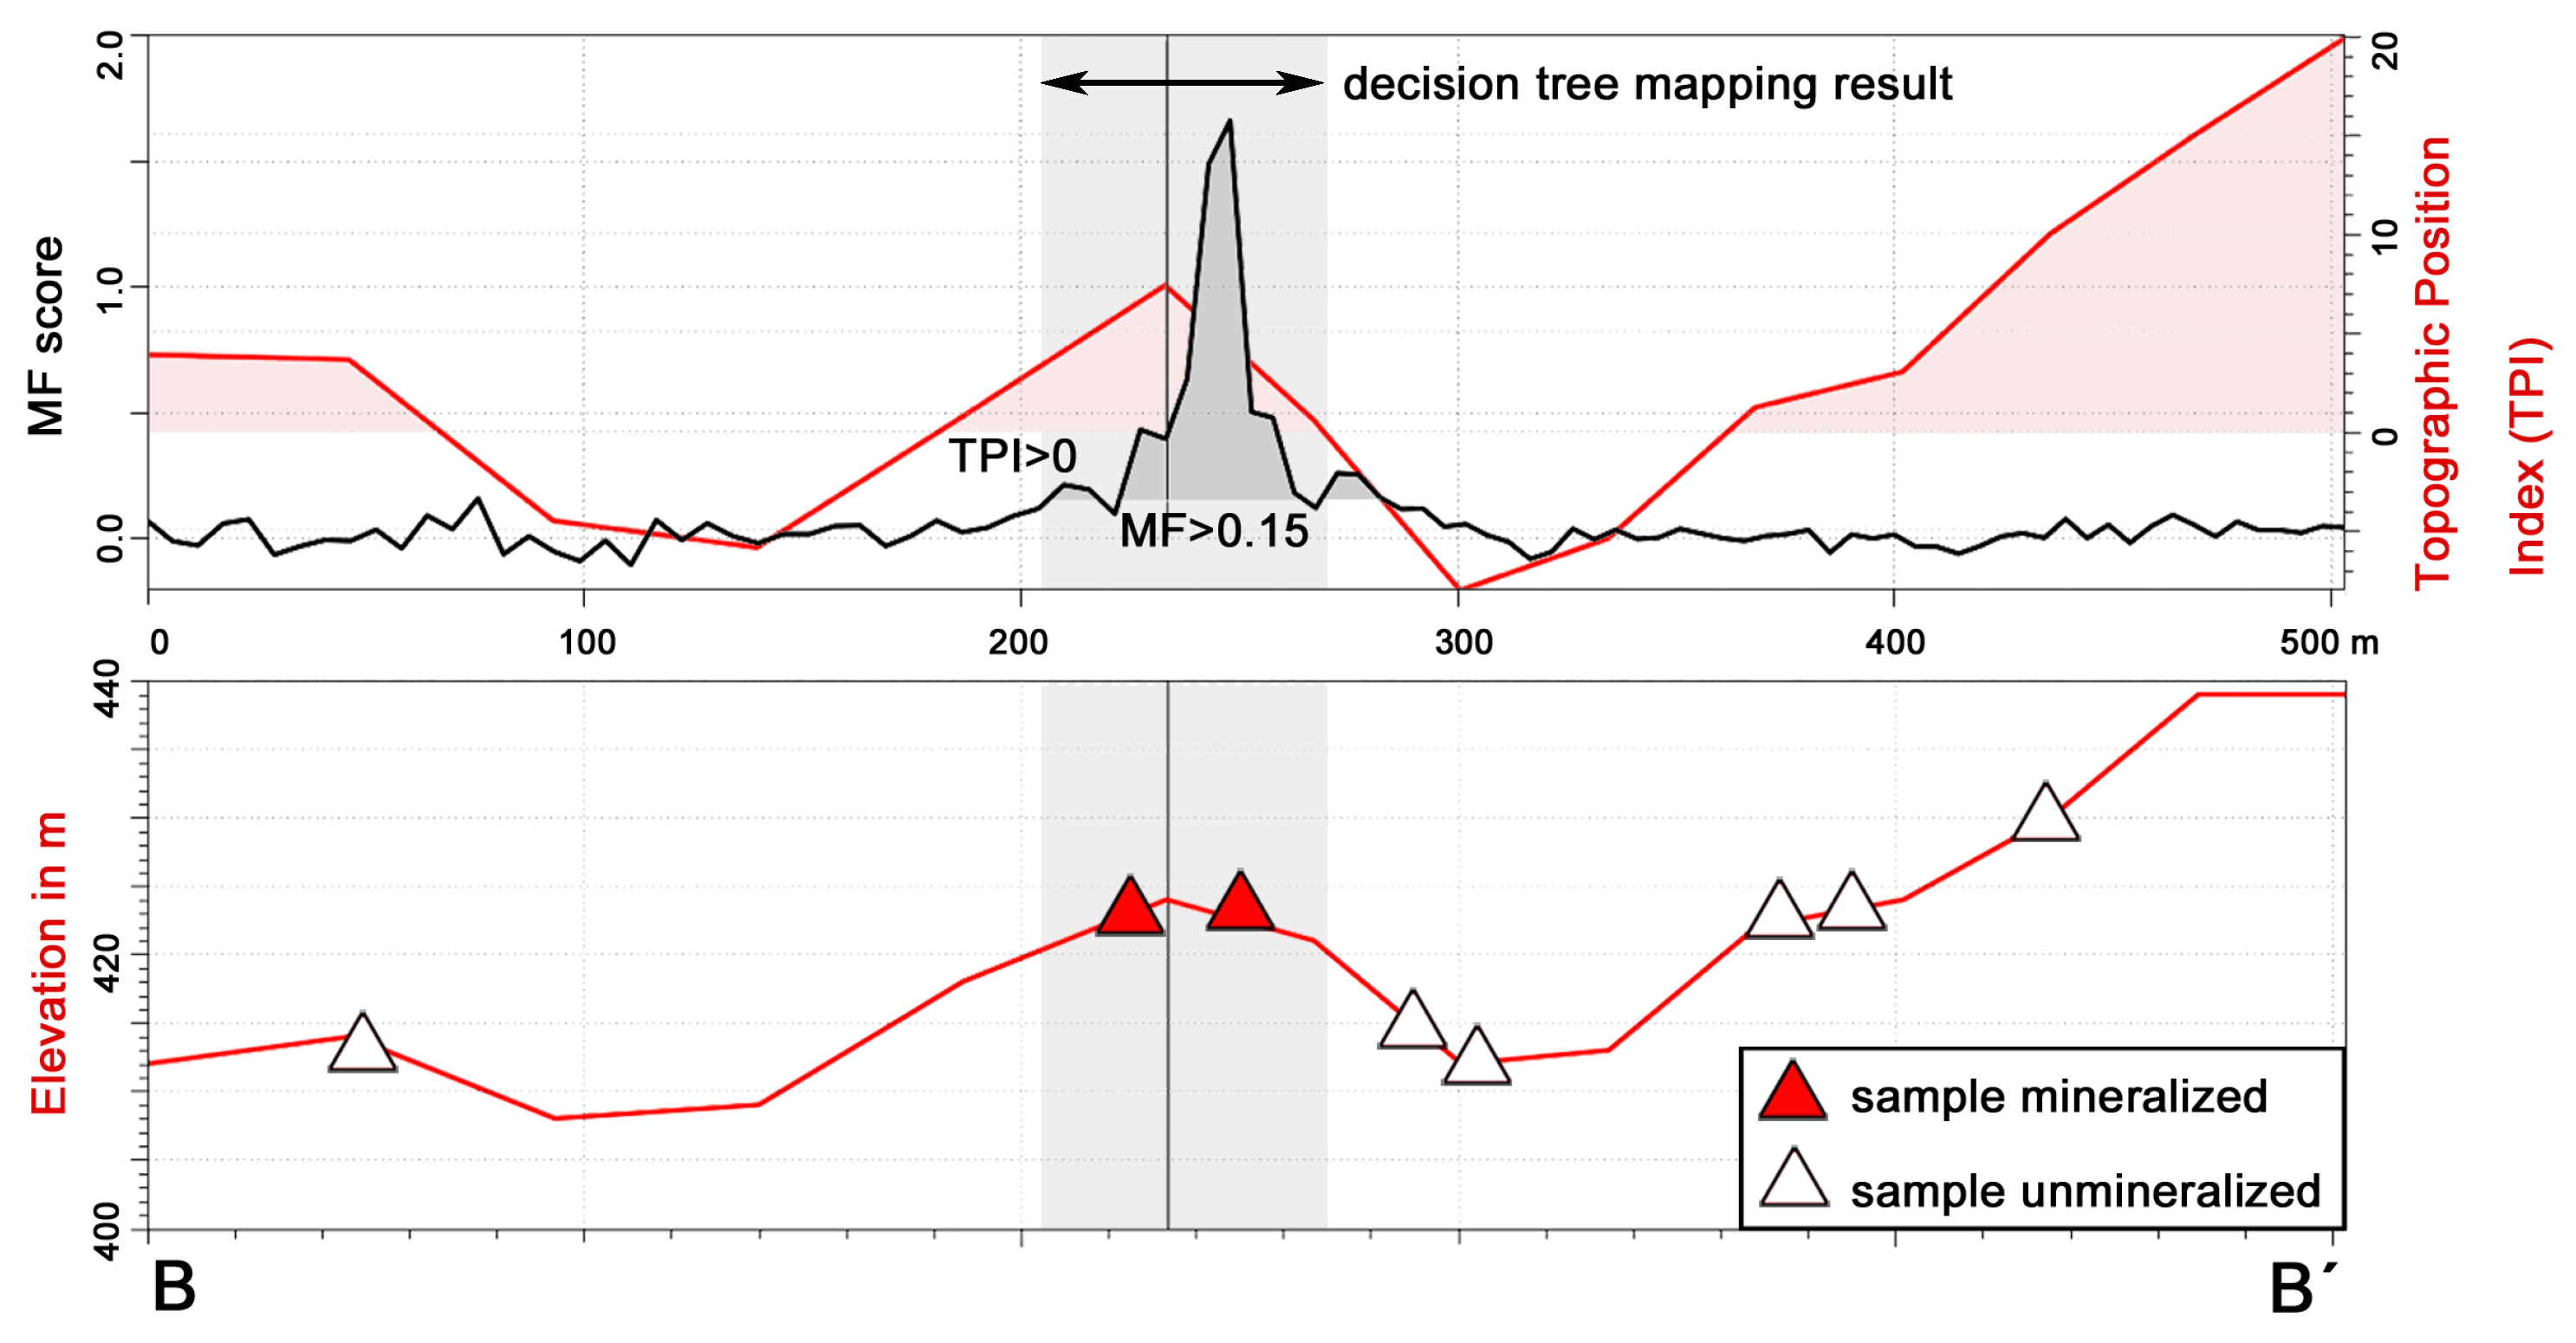
7.1. Validation
7.2. Regional Outcomes
7.3. Methodological Outcomes
8. Conclusions
Acknowledgments
Author Contributions
Conflicts of Interest
References
- Bedini, E. Mapping lithology of the Sarfartoq carbonatite complex, southern West Greenland, using HyMap imaging spectrometer data. Remote Sens. Environ. 2009, 113, 1208–1219. [Google Scholar] [CrossRef]
- Brown, A.J.; Cudahy, T.J.; Walter, M.R. Hydrothermal alteration at the Panorama Formation, North Pole Dome, Pilbara Craton, Western Australia. Precambrian Res. 2006, 151, 211–223. [Google Scholar] [CrossRef]
- Laukamp, C.; Cudahy, T.; Thomas, M.; Jones, M.; Cleverley, J.S.; Oliver, N.H. Hydrothermal mineral alteration patterns in the Mount Isa Inlier revealed by airborne hyperspectral data. Aust. J. Earth Sci. 2011, 58, 917–936. [Google Scholar] [CrossRef]
- Hussey, M.C. HyMap Survey Processing Report: Musgrave Ranges, South Australia, January 2012. Hy Vista Corp. 2012. Available online: https://sarigbasis.pir.sa.gov.au/WebtopEw/ws/samref/ sarig1/image/DDD/GDP00002% 20R1.pdf (accessed on 7 December 2014). [Google Scholar]
- Azizi, M.; Saibi, H.; Cooper, G. Mineral and structural mapping of the Aynak-Logar Valley (Eastern Afghanistan) from hyperspectral remote sensing data and aeromagnetic data. Arabian J. Geosci. 2015, 8, 10911–10918. [Google Scholar] [CrossRef]
- Bersi, M.; Saibi, H.; Chabou, M. Aerogravity and remote sensing observations of an iron deposit in Gara Djebilet, southwestern Algeria. J. Afr. Earth Sci. 2016, 116, 134–150. [Google Scholar] [CrossRef]
- Blake, D.H. Geology of the Mount Isa Inlier and environs, Queensland and Northern Territory; Bureau of Mineral Resources, Geology and Geophysics Bulletin; Australian Govt. Pub. Service: Canberra, Australia, 1987; Volume 225. [Google Scholar]
- Grondijs, H.F.; Schouten, C. A study of the Mount Isa ores [Queensland, Australia]. Econ. Geol. 1937, 32, 407–450. [Google Scholar] [CrossRef]
- Conaghan, E.L.; Hannan, K.W.; Tolman, J. Mount Isa Cu and Pb-Zn-Ag deposits, NW Queensland Australia; Cooperative Research Centre for Landscape Environments and Mineral Exploration: Canberra, Australia, 2003; Available online: http://crcleme.org.au/RegExpOre/MtIsa.pdf (accessed on 7 December 2014).
- Forrestal, P.J. Mount Isa and Hilton Silver-Lead-Zinc Deposits. In Geology of the Mineral Deposits of Australia and Papua New Guinea; Hughes, F.E., Ed.; The Australasian Institute of Mining and Metallurgy: Melbourne, Australia, 1990; pp. 927–934. [Google Scholar]
- Stewart, A.J.; Blake, D.H. Detailed Studies of the Mount Isa Inlier; Australian Govt. Pub. Service: Canberra, Australia, 1992; Volume 243. [Google Scholar]
- Wilde, A.R. Mount Isa copper orebodies: Improving predictive discovery. Aust. J. Earth Sci. 2011, 58, 937–951. [Google Scholar] [CrossRef]
- Cudahy, T.; Jones, M.; Thomas, M.; Laukamp, C.; Caccetta, M.; Hewson, R.; Rodger, A.; Verrall, M. Next Generation Mineral Mapping: Queensland Airborne HyMap and Satellite ASTER Surveys 2006–2008; CSIRO Exploration & Mining Report P2007/364; CSIRO Exploration and Mining: Perth, Australia, 2008. [Google Scholar]
- Yang, K.; Huntington, J.F.; Quigley, M.; Scott, K.; Mason, P. Mapping the effects of regional metamorphism and hydrothermal alteration in the Mount Isa Valley, Queensland, Australia, using airborne hyperspectral data. In Proceedings of the 2003 IEEE International Geoscience and Remote Sensing Symposium, Toulouse, France, 21–25 July 2003; pp. 1555–1557.
- Laukamp, C.; Cudahy, T.; Cleverley, J.S.; Oliver, N.H.S.; Hewson, R. Airborne hyperspectral imaging of hydrothermal alteration zones in granitoids of the Eastern Fold Belt, Mount Isa Inlier, Australia. Geochem.: Explor. Environ. Anal. 2011, 11, 3–24. [Google Scholar] [CrossRef]
- Perera, K.; Moore, D.; Tateishi, R.; Apan, A.; McDougall, K. Mapping Queensland land cover accordong to FAO LCCS using multi-source spatial data. Int. Arch. Photogramm. Remote Sens. Spat. Inform. Sci. 2010, 38, 742–747. [Google Scholar]
- Etheridge, M.A.; Rutland, R.W.R.; Wyborn, L.A.I. Orogenesis and tectonic process in the early to middle Proterozoic of northern Australia. In Proterozic Lithospheric Evolution; Geodynamics Series; Kröner, A., Ed.; American Geophysical Union: Washington, DC, USA, 1987; Volume 17, pp. 131–147. [Google Scholar]
- Weil, A.J. Mine geology, Mount Isa. In Proceedings of the Field Conference: Mount Isa, Mary-Kathleen Area, 10–12 June 1967; pp. 20–23.
- Smith, W.D. The broader aspects of secondary mineralization at Mount Isa, Queensland. Proc. Australas. Inst. Min. Metall. 1966, 217, 33–38. [Google Scholar]
- Betts, P.G.; Lister, G.S. Geodynamically indicated targeting strategy for shale-hosted massive sulphide Pb-Zn-Ag mineralisation in the Western Fold Belt, Mt Isa terrane. Aust. J. Earth Sci. 2002, 49, 985–1010. [Google Scholar] [CrossRef]
- Taylor, G.; Scott, K. Evaluation of gossans in relation to lead-zinc mineralisation in the Mount Isa Inlier, Queensland. BMR J. Aust. Geol. Geophys. 1982, 7, 159–180. [Google Scholar]
- Perkins, W.G. A Study of the Nature, Timing, and Processes in the Mount Isa Lead-Zinc Orebodies; Their Relationship to Adjacent Copper Ore-Bodies and The Lead-Zinc Systems at Mc Arthur River, Hilton, and Mount Novit. Ph.D. Thesis, James Cook University of North Queensland, Queensland, Australia, 1996. [Google Scholar]
- Wilson, I.H.; Grimes, K.G.; Derrick, G.M. Cloncurry, Queensland, 1:250 000 Geological Series Map: Sheet SF/54-02; Geological Survey of Queensland: Brisbane, Australia, 1983. [Google Scholar]
- Grimes, K.G.; Hutton, L.J.; Wilson, I.H. Mount Isa, Queensland, 1:250 000 Geological Series Map: Sheet SF/54-02, 2nd ed.; Bureau of Mineral Resources, Canberra & Geological Survey of Queensland: Brisbane, Australia, 1987. [Google Scholar]
- Clark, R.N. Chapter 1: Spectroscopy of Rocks and Minerals, and Principles of Spectroscopy. In Manual of Remote Sensing; Rencz, A.N., Ed.; John Wiley and Sons: New York, NY, USA, 1999; Volume 3, pp. 3–58. [Google Scholar]
- Cocks, T.; Jenssen, R.; Stewart, A.; Wilson, I.; Shields, T. The HYMAP airborne hyperspectral sensor: The system, calibration and performance. In Presented at the 1st EARSeL Workshop on Imaging Spectrocopy, Zürich, Switzerland, 6–8 October 1998.
- Harsanyi, J.C.; Chang, C. Hyperspectral image classification and dimensionality reduction: An orthogonal subspace projection approach. IEEE Trans. Geosci. Remote Sens. 1998, 32, 779–785. [Google Scholar] [CrossRef]
- Mundt, J.T. Partial unmixing of hyperspectral imagery: Theory and methods. In Proceedings of the American Society for Photogrammetry and Remote Sensing—ASPRS Annual Conference 2007: Identifying Geospatial Solutions, Tampa, FL, USA, 7–11 May 2007; Volume 2, pp. 440–451.
- Weiss, A.D. Topographic Position and Landforms Analysis. In Presented at ESRI Users Conference, San Diego, CA, USA, 2001.
- Reu, J.D.; Bourgeois, J.; Bats, M.; Zwertvaegher, A.; Gelorini, V.; Smedt, P.D.; Chu, W.; Antrop, M.; Maeyer, P.D.; Finke, P.; et al. Application of the topographic position index to heterogeneous landscapes. Geomorphology 2013, 186, 39–49. [Google Scholar]
- Wood, J. The Geomorphological Characterization of Digital Elevation Models. Ph.D. Thesis, University of Leicester, Department of Geography, Leicester, UK, 1996. [Google Scholar]
- Rouse, J.W.J.; Haas, R.H.; Schell, J.A.; Deering, D.W. Monitoring the Vernal Advancement and Retrogradation (Green Wave Effect) of Natural Vegetation; Progress Report RSC 1978-1; Texas A&M University Remote Sensing Center: College Station, TX, USA, 1973. [Google Scholar]
- Queensland Government, Department of Natural Resources and Mines. Queensland Spatial Catalogue, Mining Leases—Queensland 2015. Available online: http://www.qldspatial.information.qld.gov.au (accessed on 28 August 2015).


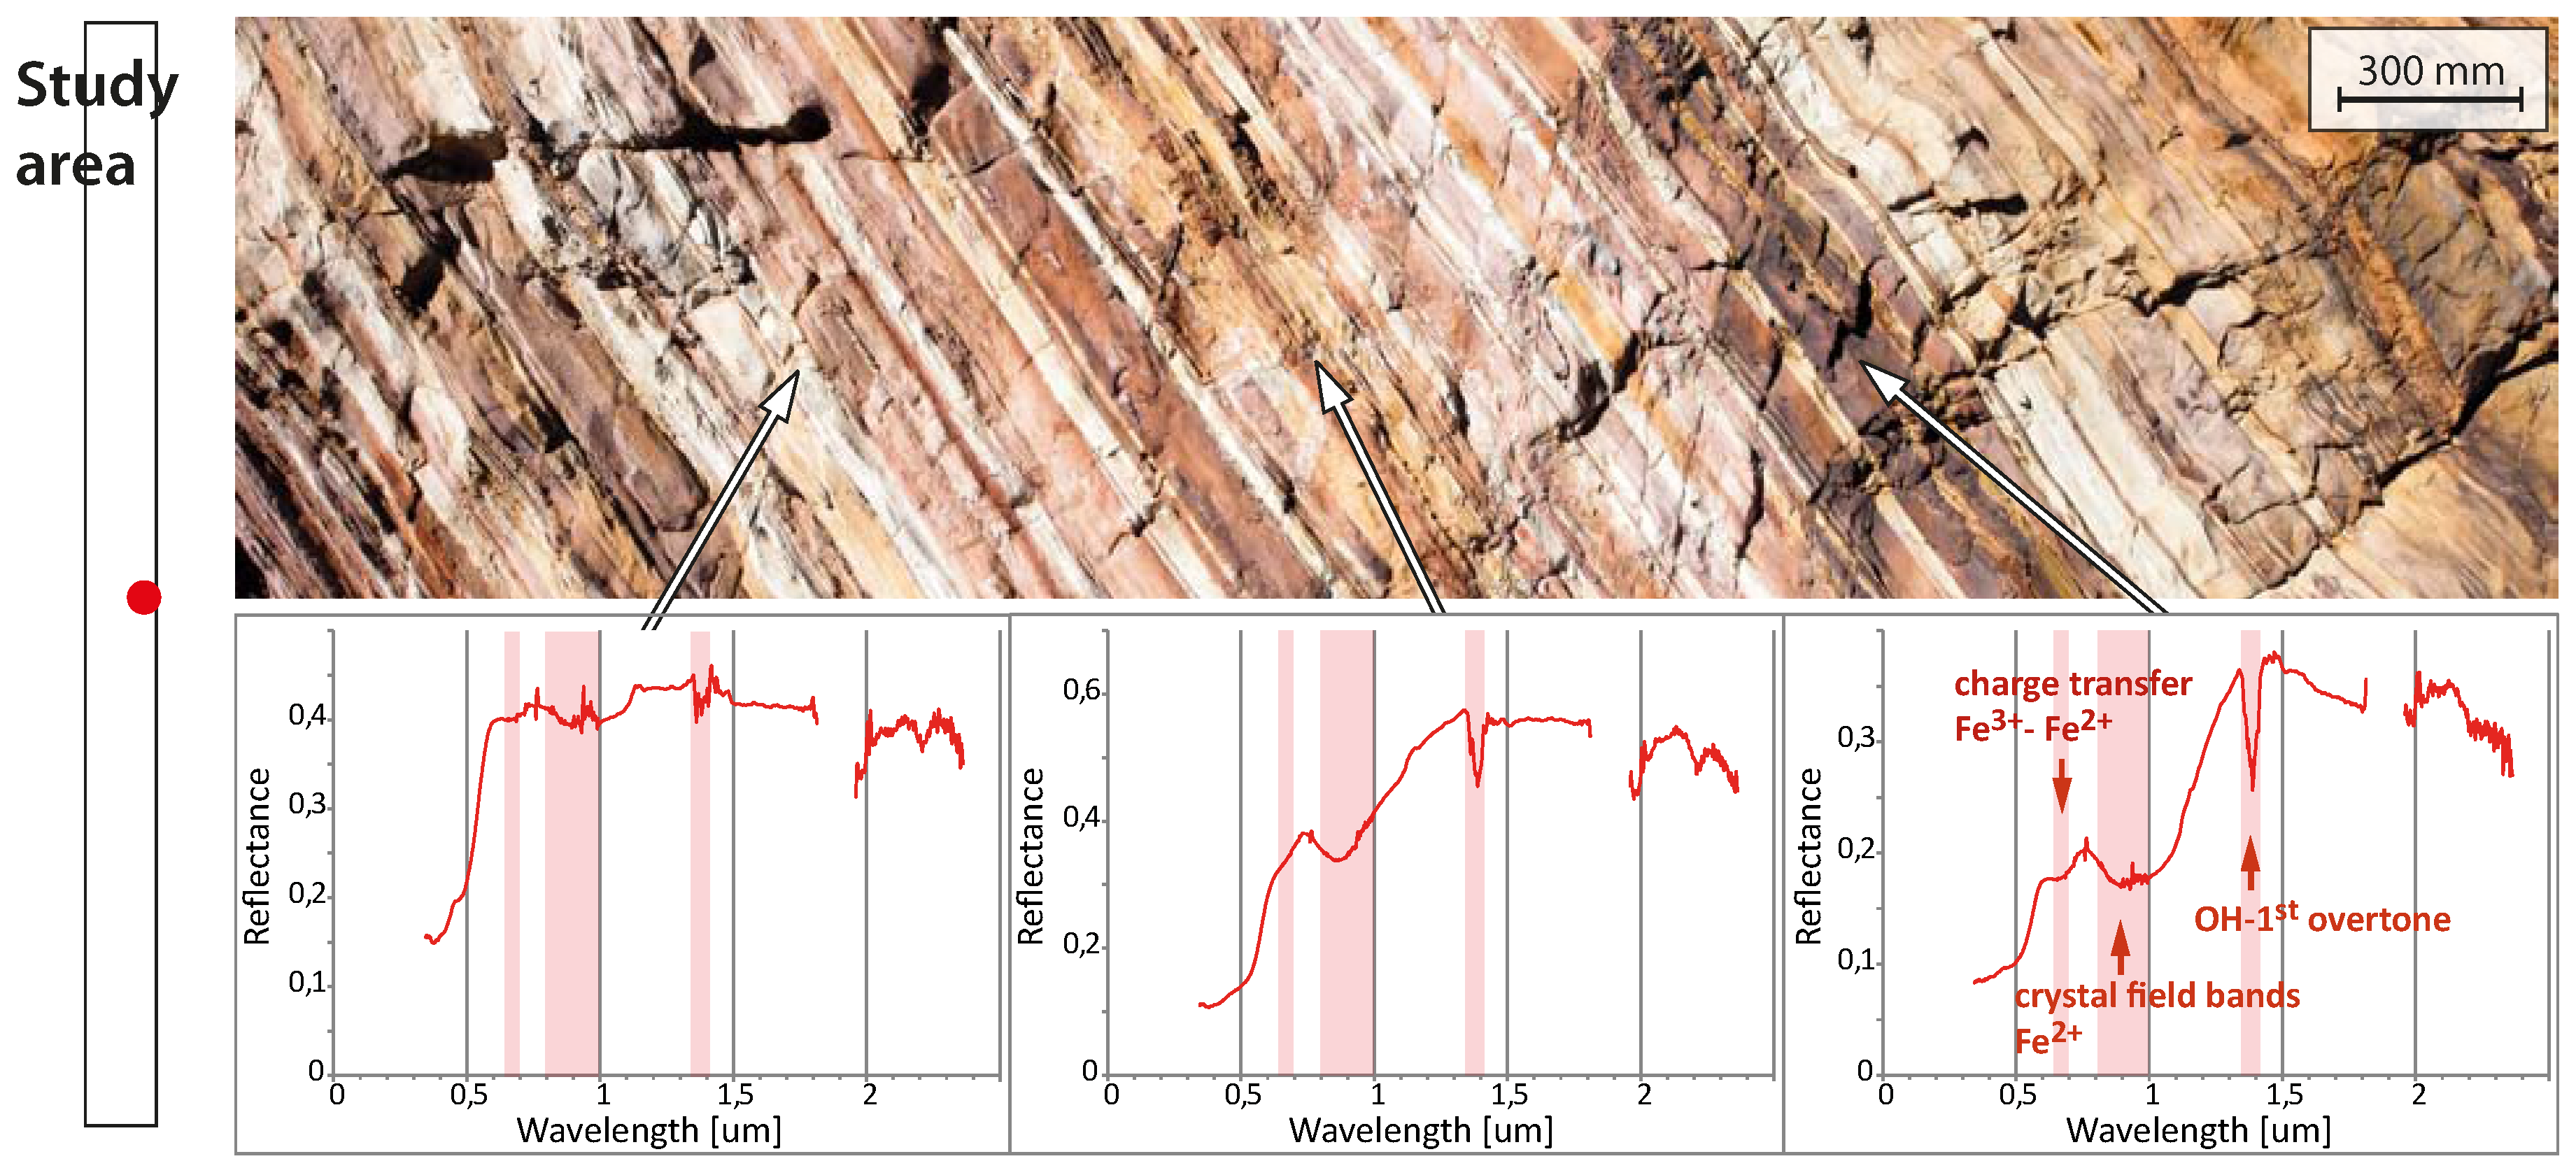
| Wavelength Range (nm) | HyMap Bands | Enhanced Material |
|---|---|---|
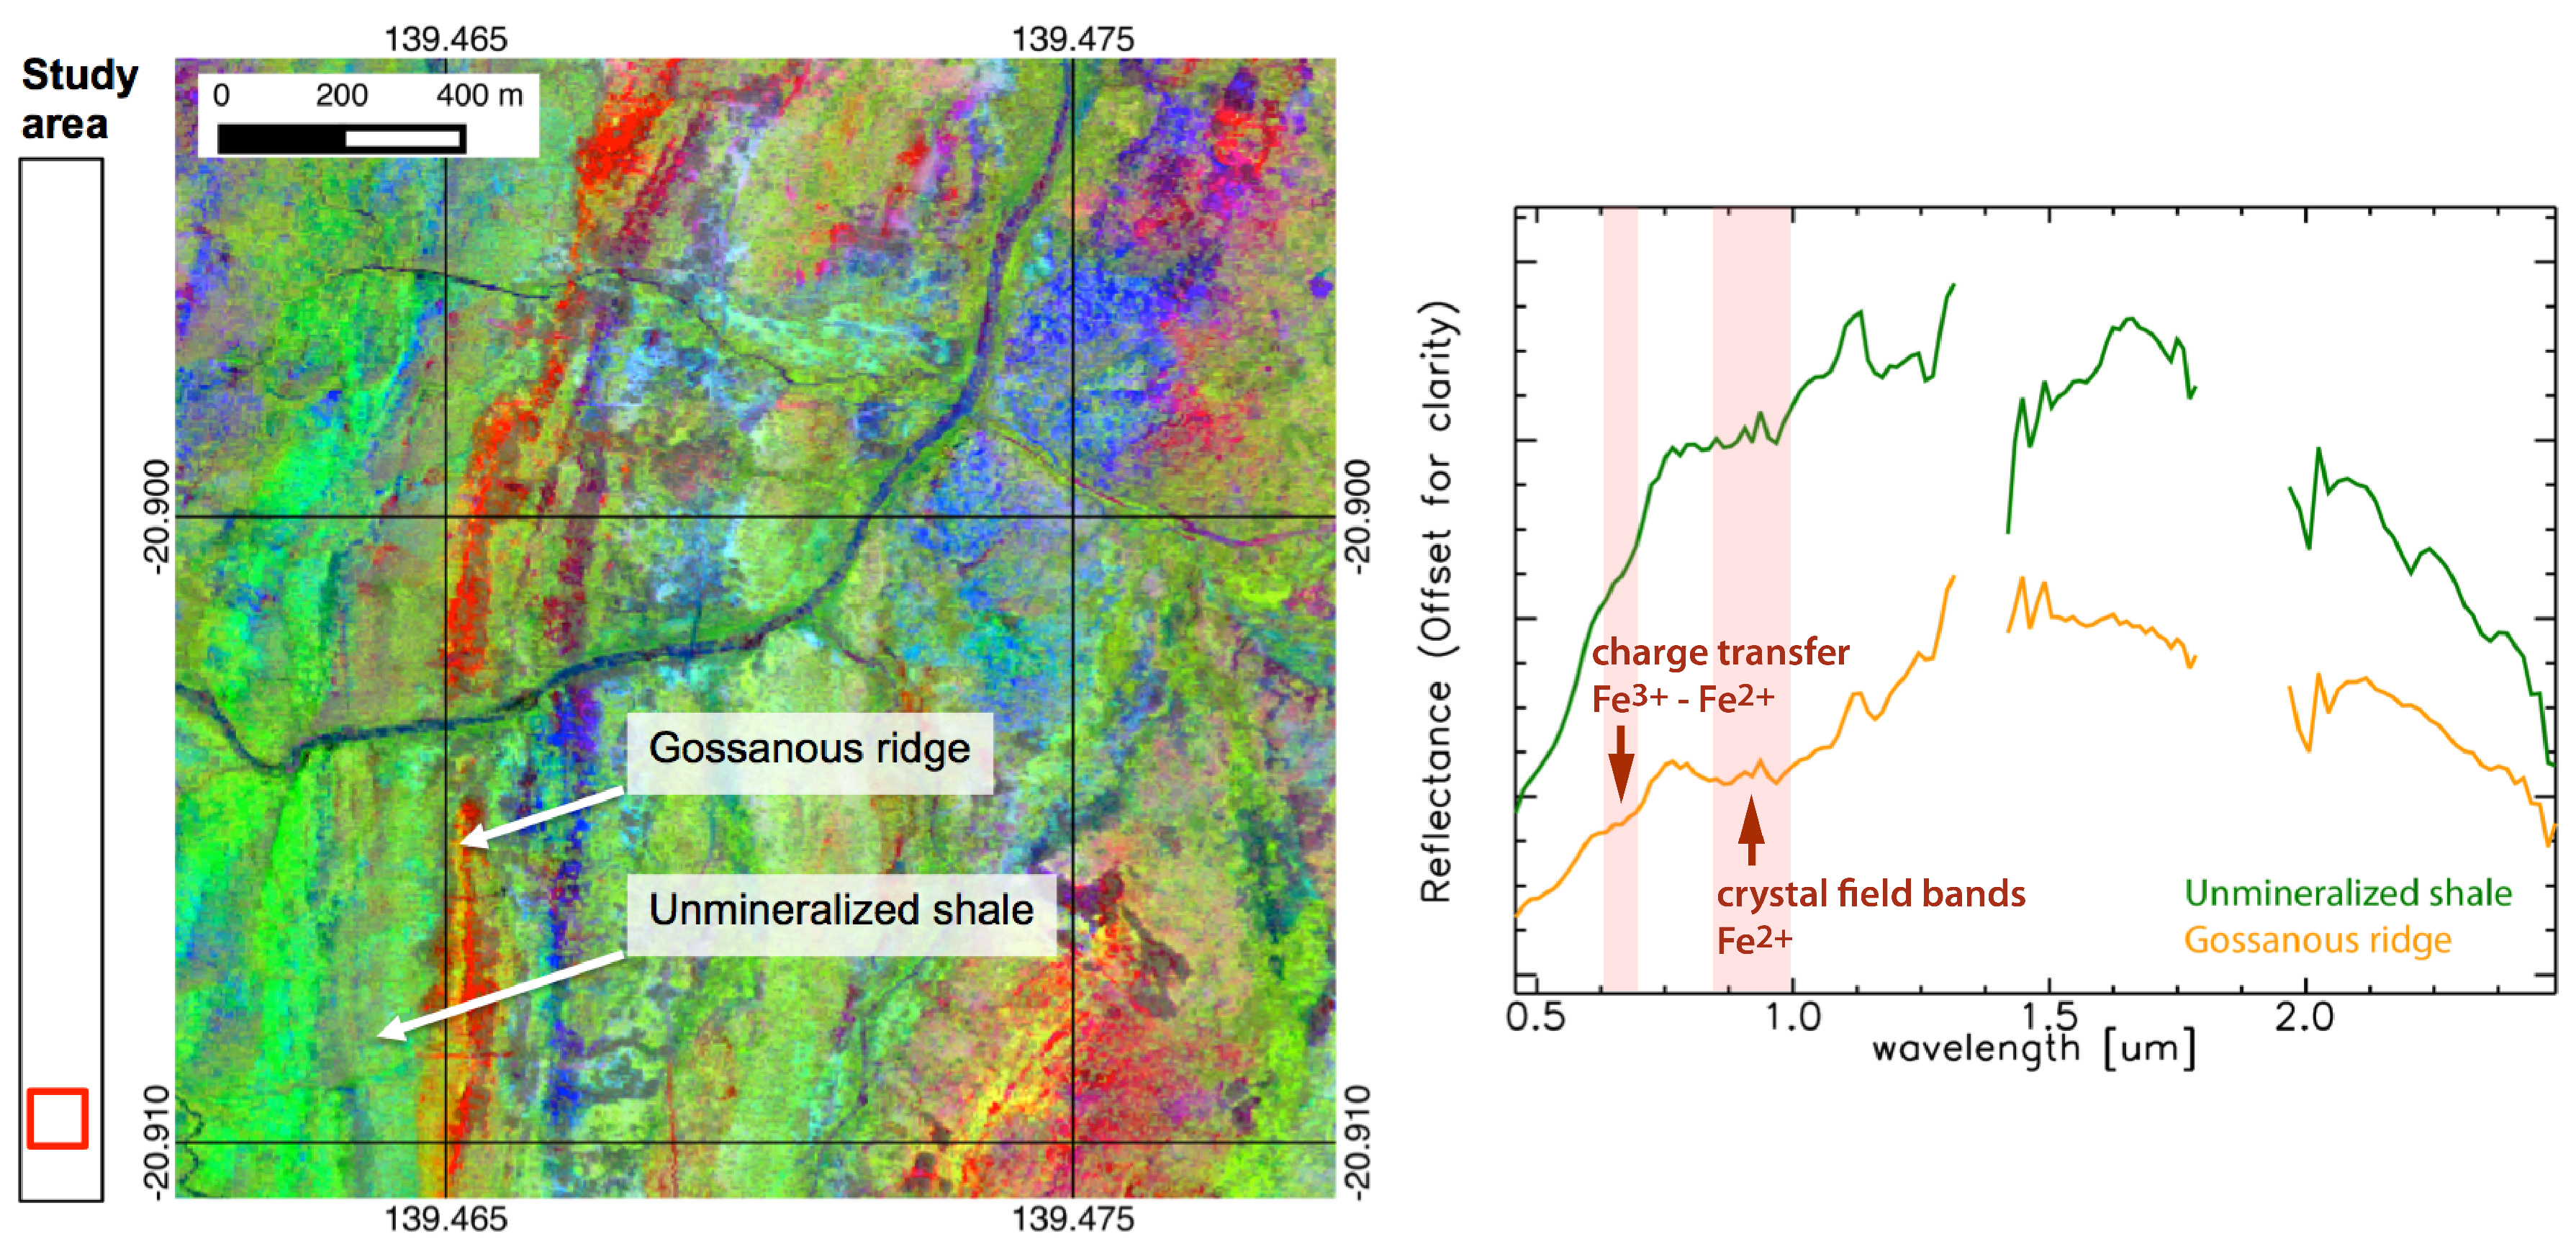
| 550–750 | 8–14 | charge transfer Fe3+-Fe2+ |
| 800–1000 | 25–39 | crystal field bands Fe2+ |
| 1350–1400 | band gap | OH- first overtone |
| 1850–1950 | band gap | H20 |
| 2252 | 111 | AlFe3+-OH combination |
| 2300 | 114 | Fe3+-OH combination |
| 2346 | 117 | Mg-OH combination |
© 2016 by the authors; licensee MDPI, Basel, Switzerland. This article is an open access article distributed under the terms and conditions of the Creative Commons Attribution (CC-BY) license (http://creativecommons.org/licenses/by/4.0/).
Share and Cite
Jakob, S.; Gloaguen, R.; Laukamp, C. Remote Sensing-Based Exploration of Structurally-Related Mineralizations around Mount Isa, Queensland, Australia. Remote Sens. 2016, 8, 358. https://doi.org/10.3390/rs8050358
Jakob S, Gloaguen R, Laukamp C. Remote Sensing-Based Exploration of Structurally-Related Mineralizations around Mount Isa, Queensland, Australia. Remote Sensing. 2016; 8(5):358. https://doi.org/10.3390/rs8050358
Chicago/Turabian StyleJakob, Sandra, Richard Gloaguen, and Carsten Laukamp. 2016. "Remote Sensing-Based Exploration of Structurally-Related Mineralizations around Mount Isa, Queensland, Australia" Remote Sensing 8, no. 5: 358. https://doi.org/10.3390/rs8050358