1. Introduction
Sinkholes, which often form in karst environments underlain by evaporite or cavernous carbonate rocks, have been considered a “hidden threat” to human life, infrastructures, and properties [
1]. The Delaware Basin of West Texas and Southeast New Mexico, in the southwest part of the Permian Basin, contains one of the greatest accumulations of evaporites in the United States [
2]. Sinkholes in West Texas have developed from the dissolution of these subsurface evaporite deposits that come in contact with fresh groundwater [
3]. In addition, anthropogenic activities for oil/gas exploration (brine well) and solution mining (salt, potash) have accelerated the expansion of underground dissolution cavities [
4].
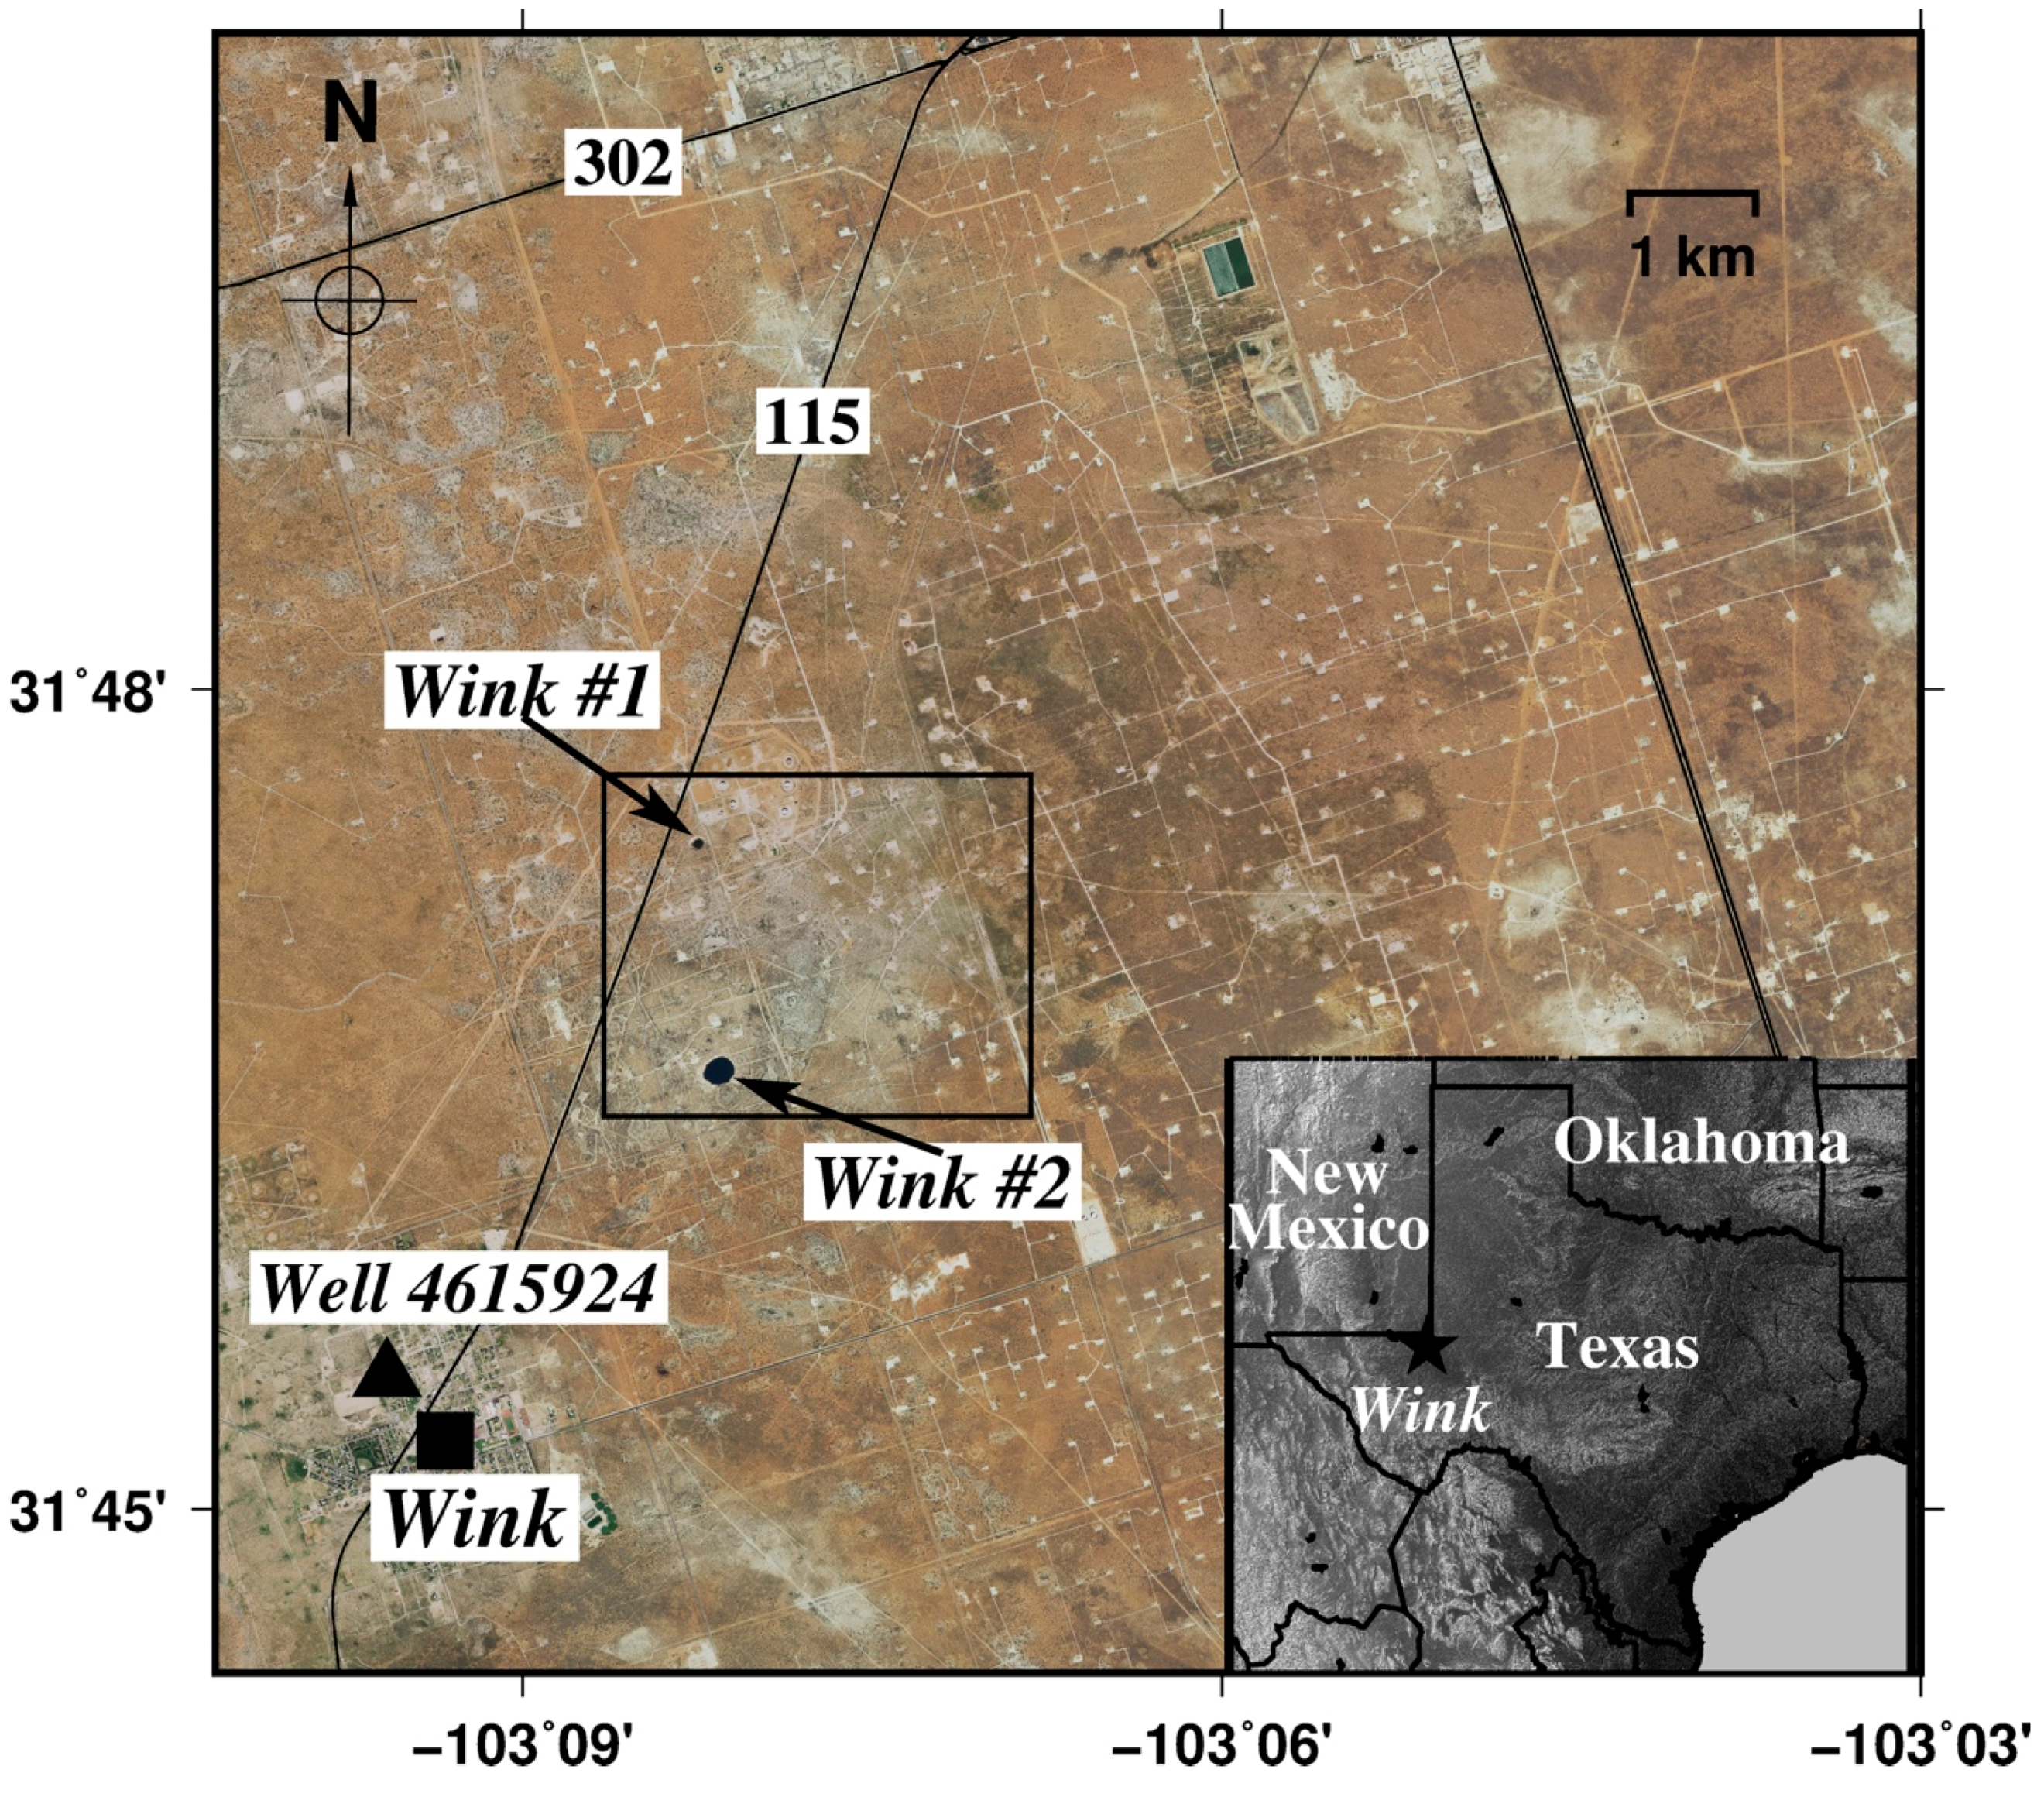
The first sinkhole in Wink, Texas, Wink Sink #1 (
Figure 1), formed on 3 June 1980 near the abandoned Hendricks oil well 10-A. The second sinkhole (Wink Sink #2,
Figure 1) developed on 21 May 2002, centered on the water-supply well (Gulf WS-8) [
5] about 1500 m south of Wink Sink #1. The Salado Formation, a thick sequence of interbedded halite and anhydrite, is about 260 m thick beneath the Wink sinkholes. The formation has been naturally influenced by the dissolution of the Salado salt units, but the petroleum activity from 1926 to 1964 around the Wink sinkholes has been suspected to be a trigger that accelerated the dissolution of the underlying salt bed [
4]. The oil field activity included the injection of water into boreholes drilled through the Salado formation and because the older drilling technology that was used did not prevent water from leaking outside the cemented casting, a large dissolution cavity in the subsurface developed. The cavity then grew and migrated upward and resulted in the formation of the Wink sinkholes after successive roof failures [
6].
The sequential depression in the evaporite might not be easily spotted at the surface before collapse occurs, and, therefore, sinkhole formation has previously been unpredictable [
1]. However, identifying depressions in areas underlain by soluble rocks can help predict potential sinkhole development in Wink. A spaceborne solution is necessary to continuously monitor these potentially hazardous areas through detection of the precursory surface deformation that leads to sinkhole development and observations of the ground depression in existing sinkholes. In our study, we first demonstrated the capability of Sentinel-1A datasets to map the sinkhole deformations from multi-temporal acquisitions, and analyzed two-dimensional (horizontal, vertical) time-series deformation for the Wink sinkholes using satellite radar remote sensing techniques and comparing the results with local groundwater levels during summer months.
2. Methods
We detected the ground subsidence in Wink sinkholes, using InSAR techniques, e.g., [
7]. InSAR has been proven to be a powerful tool for monitoring these sinkhole precursors and post-event deformation in the Dead Sea, Israel [
8,
9,
10,
11], Bayou Corne, Louisiana, USA [
12], New Mexico [
13], and Ebro Valley, Spain [
14,
15]. Ground subsidence around the sinkholes in Wink, Texas, was measured using a single InSAR image, along with field gravity observations by Paine
et al. [
16]. Despite the success of these previous studies, monitoring sinkhole deformation through InSAR techniques is still challenging, due to the low spatial resolution of synthetic aperture radar (SAR) sensors. The sinkholes in Wink are usually small-sized (<~100 m in width) compared to other geohazards, such as earthquakes or volcanism, so they occupy only a few pixels in a SAR image and could, therefore, be misinterpreted as noise or errors in InSAR processing. Furthermore, measuring time-series deformation in sinkhole-prone areas from multi-track spaceborne SAR data has not been fully adopted for understanding sinkhole formation.
Sentinel-1A is the latest generation of C-band radar satellites from the European Space Agency (ESA). Launched in April 2014, Sentinel-1A became operational in late 2014 and has extended the continuity of radar data that began with ESA’s ERS-1/-2 and Envisat. Sentinel-1A’s revisit time of 12 days is dramatically improved with respect to ERS and Envisat missions, which will enhance InSAR coherence in general. Sentinel-1A has four different operational modes: (i) strip map (SM); (ii) interferometric wide swath (IW); (iii) extra wide swath (EW); (iv) wave (WV) modes [
17,
18]. The background mode of Sentinel-1A operation is the interferometric wide swath mode, which provides a wide coverage of 250 km with a medium resolution of 5 m and 20 m in range and azimuth directions, respectively [
17,
18]. Sentinel-1A is the first radar mission that provides data freely to users with a very low latency [
18].
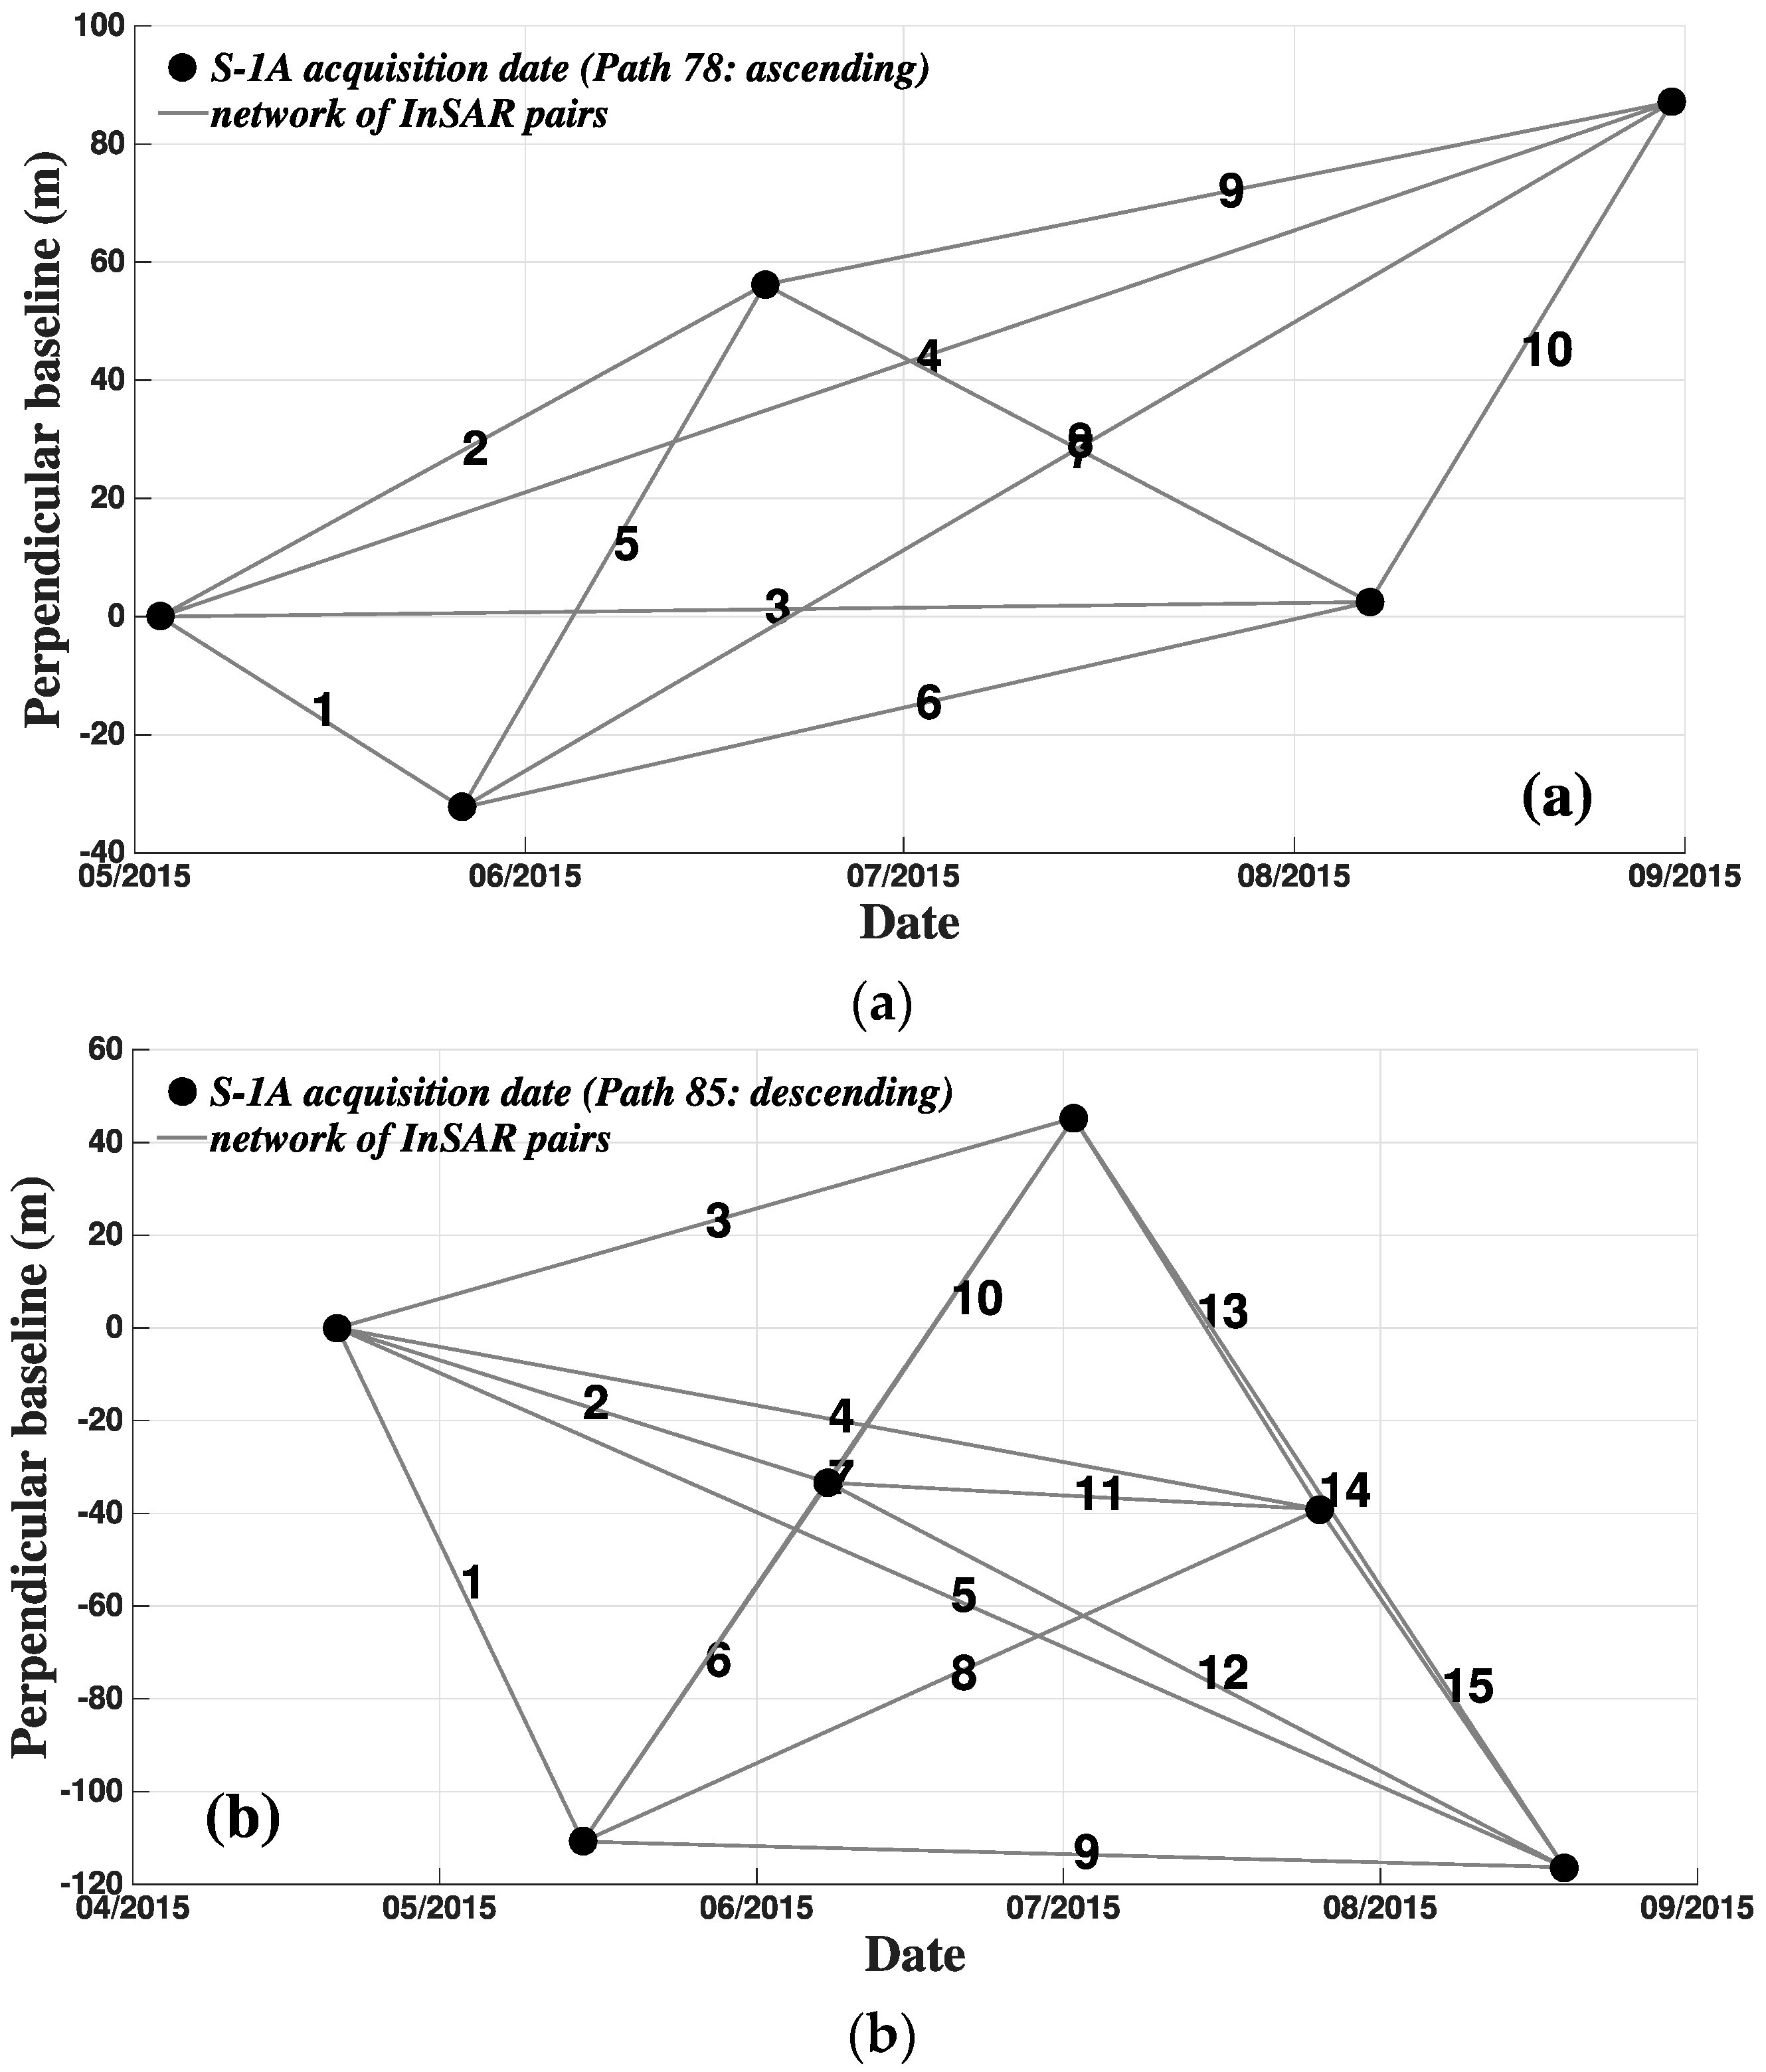
For this study, we have processed five ascending (
Figure 2a), and six descending (
Figure 2b), Sentinel-1A IW-mode datasets, collected between April and August 2015 over the Wink area. Ten and 15 InSAR pairs from ascending and descending modes, which has less than a 200 m perpendicular baseline (
Figure 2a,b). The Sentinel-1A images allow us to monitor the progression of the Wink sinkholes with dense temporal acquisitions of 12 days or less. The Sentinel-1A data from both ascending and descending tracks offer an opportunity to observe 2D (east-west and vertical) deformation [
19]. We process the Sentinel-1A images using the multidimensional small baseline subset (MSBAS) technique, which has the capability to compute 2D time-series deformation from ascending and descending tracks [
20,
21]. The 2D (east-west, up-down) time-series deformation maps using multi-track InSAR datasets can be obtained from the inverse of the following matrix:
where θ, φ, and
Bp are the azimuth angle (−12.8 (ascending), −167.2 (descending) degrees), the incidence angle (33.8 degrees), and the perpendicular baseline (unit: m, see in
Figure 2a,b), respectively,
A is a matrix constructed from the time interval between consecutive SAR acquisitions, λ is a regularization parameter,
I is an identity matrix,
VE and
VU are the east-west and vertical components of the ground deformation rate vector, Δ
h is the topography error (not significant because our study area is flat), and Φ is the observed (unwrapped) interferometric phase (more details can be found in [
21]). ERS-1/2 and Envisat images were also explored to map precursory and ongoing deformation in Wink #1 and #2 sinkholes, but the InSAR coherence was not maintained due to geometrical and temporal decorrelation and the two C-band SAR data could not be employed for our analysis. Compared to ERS-1/2 and Envisat, Sentinel-1A has the advantage to image the deforming areas with frequent acquisitions and detect the surface features without a strong smoothing (a large multi-look factor).
3. Observations
If the ground deformation near the Wink sinkholes consists of a purely vertical component, the interferograms calculated from ascending and descending tracks should be almost identical to that observed over the Dead Sea by Baer
et al. [
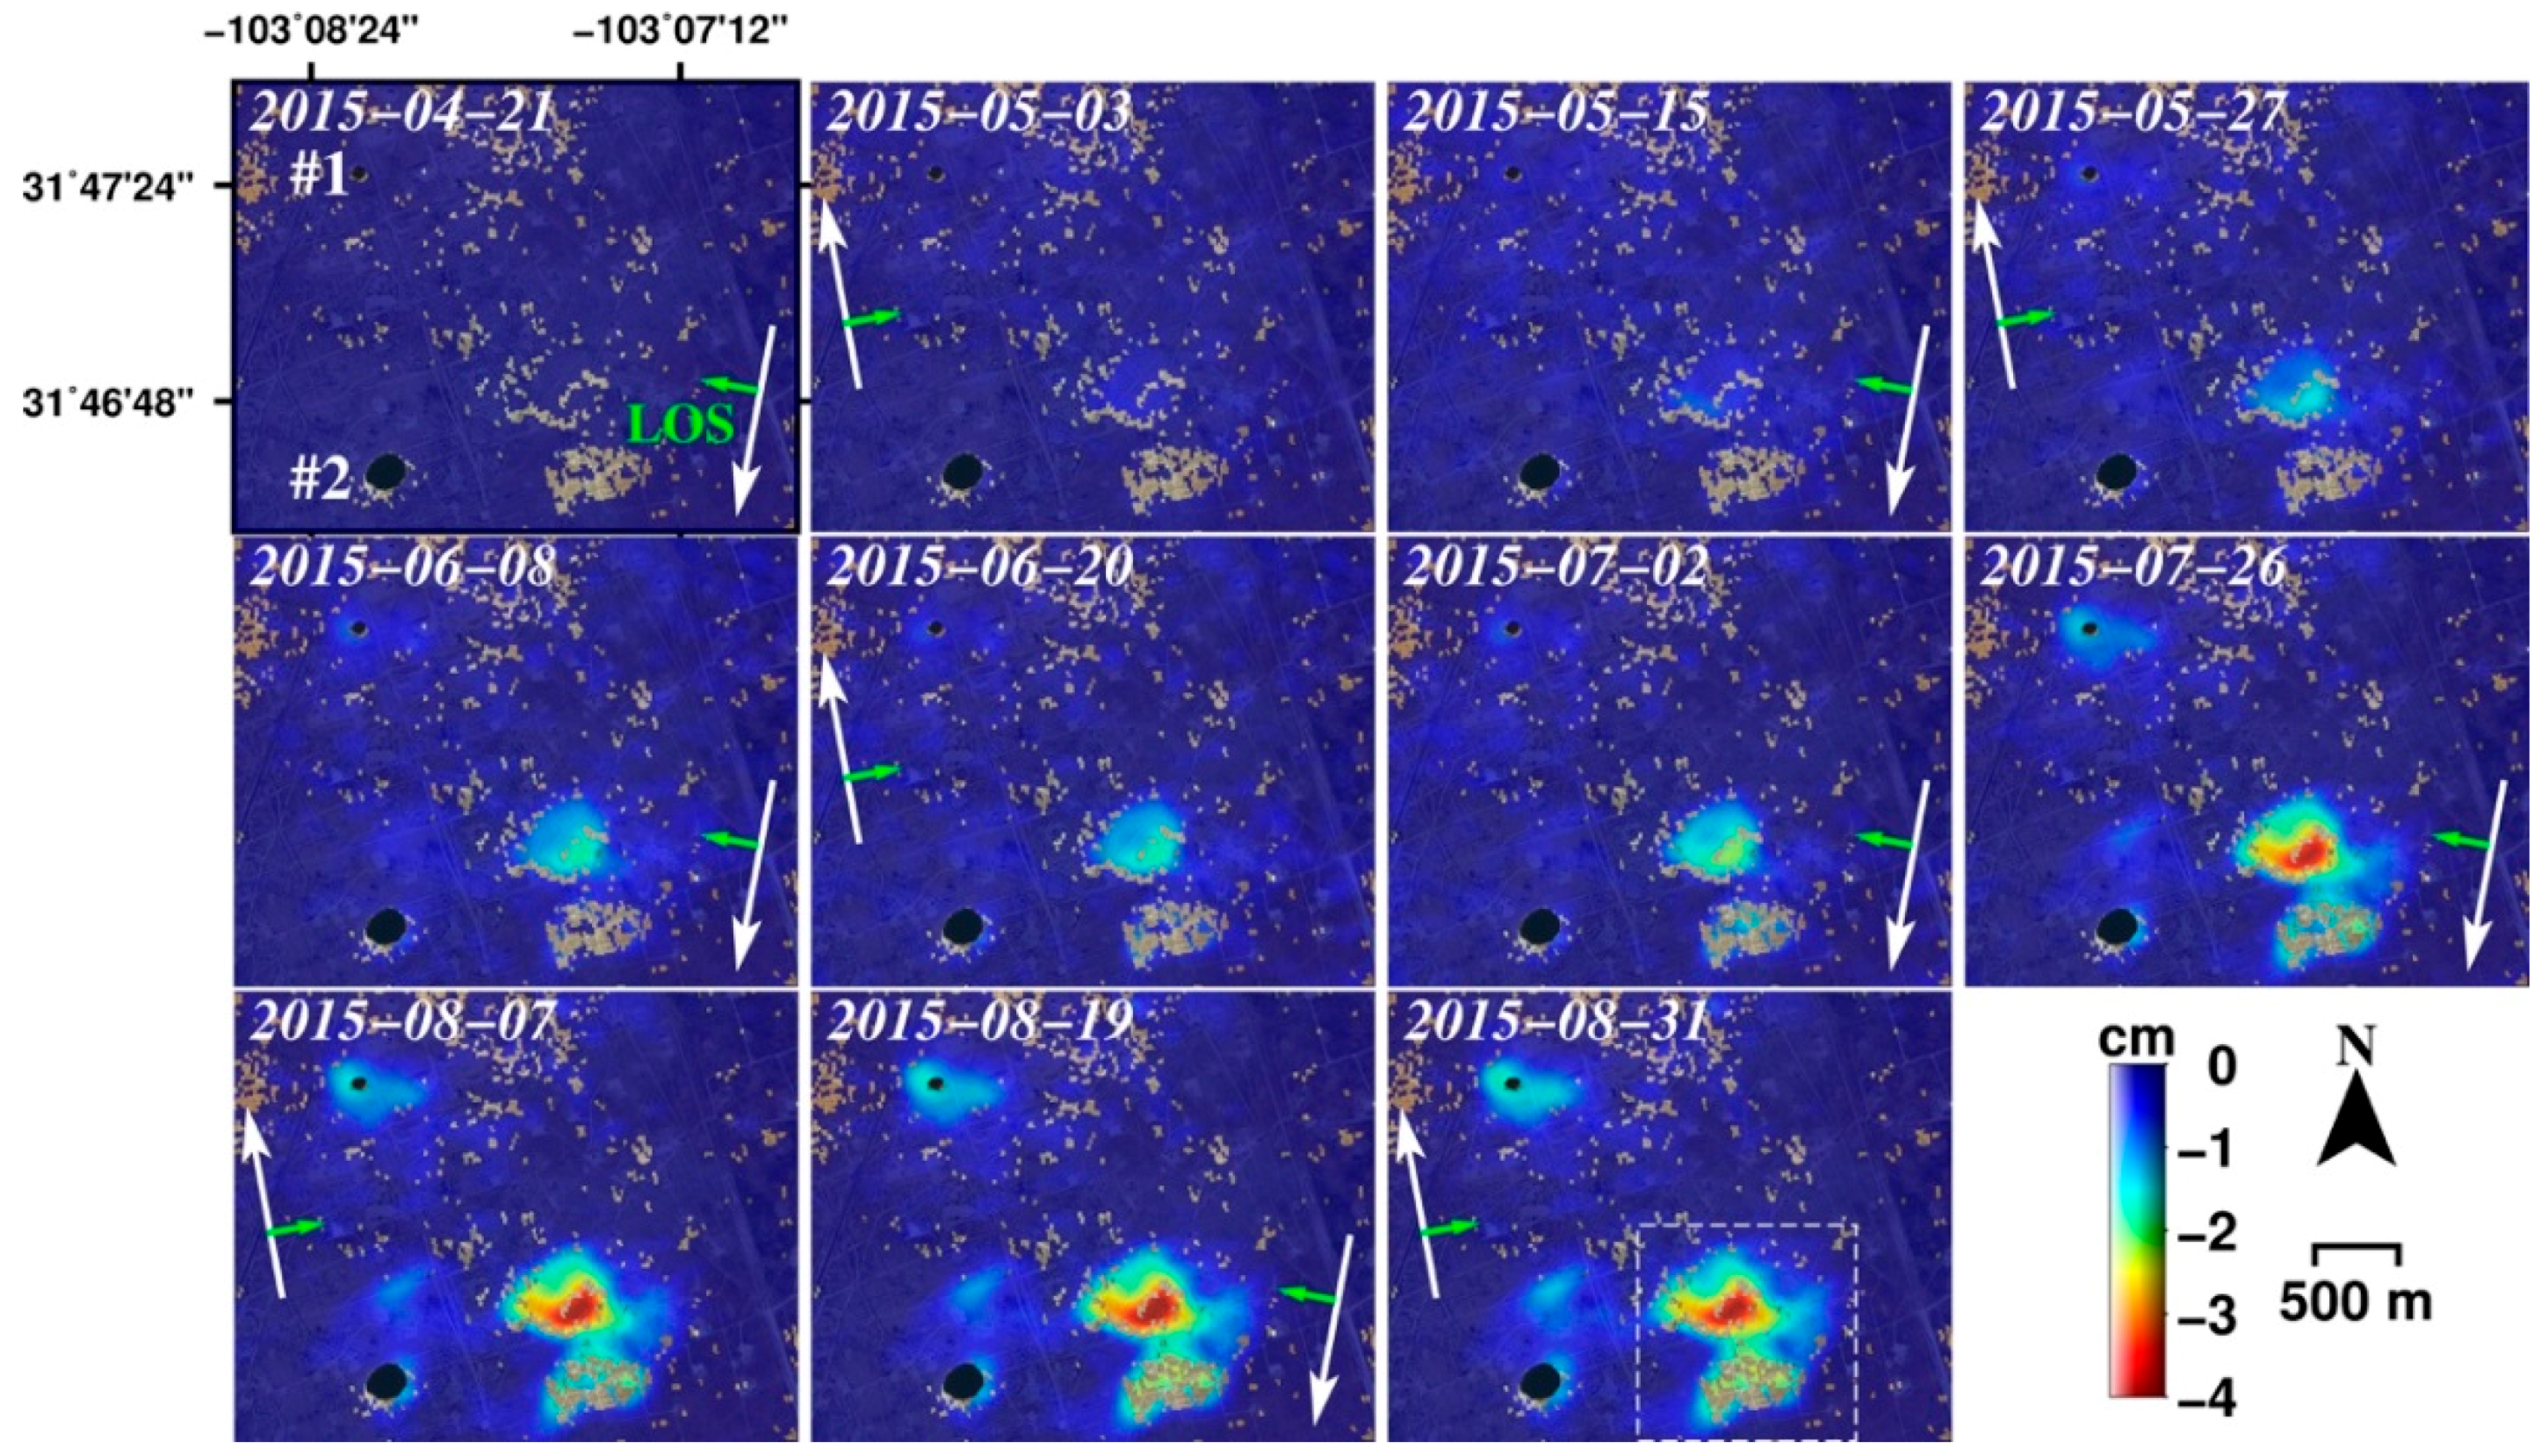
8], assuming that the incidence angles of two SAR acquisition modes are the same. In contrast, the interferograms from two Sentinel-1A tracks over Wink exhibit a difference in fringe pattern, indicating that horizontal deformation is affecting the observed line-of-sight (LOS) deformation in individual interferograms. Results from the MSBAS processing indicate that the vertical deformation is the most dominant component in ground deformation around Wink sinkholes, ~80% of LOS InSAR measurements. Time-series vertical deformation at each SAR acquisition date from 21 April to 31 August (
Figure 3) indicating that the area around the existing sinkholes is not stable, most likely due to the dissolution of interbedded salt deposits. Even though Wink #1 collapsed in 1980, its neighboring areas are still subsiding and the sinkhole continues to expand. Wink #2 collapsed in 2002, and is not experiencing subsidence as large as that seen at Wink #1, but it also exhibits depression associated with the ongoing expansion of the underground cavity. The region 1 km northeast of Wink #2 displays the maximum subsidence of ~4 cm in four months, but surficial depression has been observed over a large area to the north and the east of the sinkhole [
3,
5]. The ongoing expansion of Wink sinkholes has been confirmed and reported by the local authorities [
22], and it caused displacements around sinkholes and slumps into developed sinkholes.
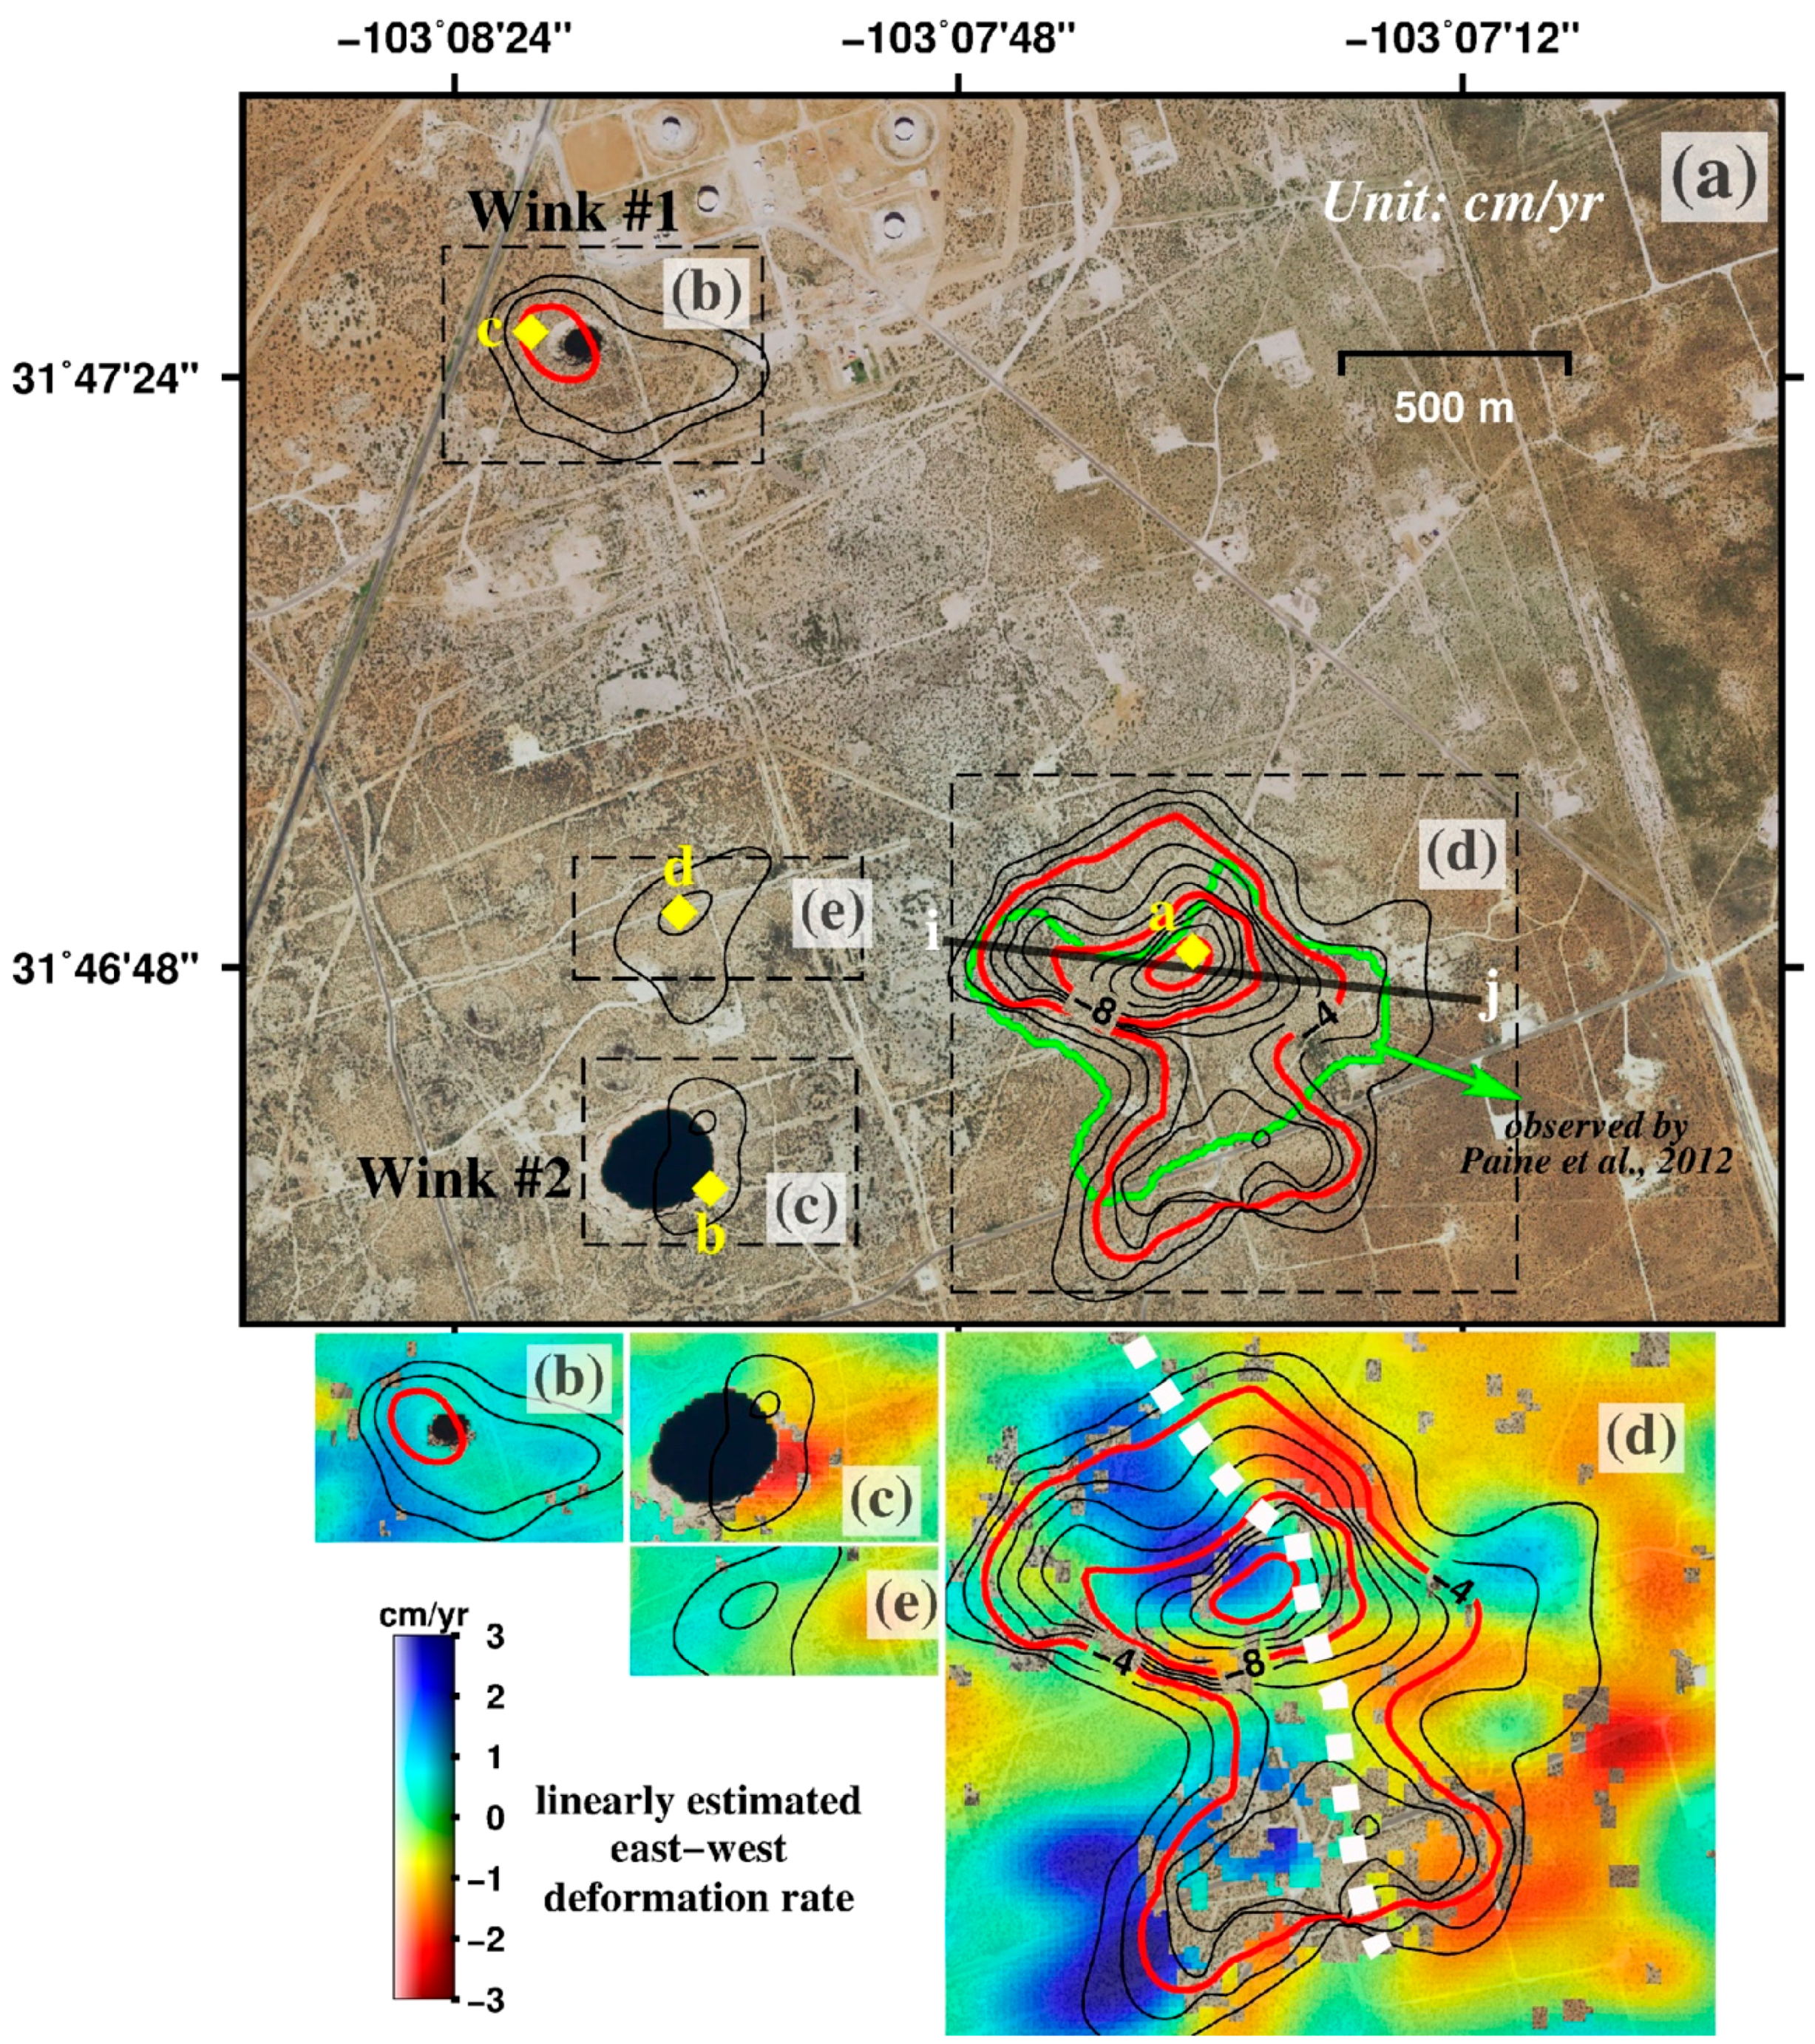
The contour map (
Figure 4a) of estimated vertical deformation rate (cm/year) from our time-series analysis demonstrates which area is subsiding. The oval-shaped deformation (500 m wide) around Wink #1 (b in
Figure 4) reaching up to 4 cm/year can be related to successive roof failure of the underlying dissolution cavity, resulting in the current 110 m-diameter sinkhole being expanded. The Wink #2 area (c in
Figure 4) is relatively stable compared to Wink #1, but the eastern side of the sinkhole continues to subside as much as ~3 cm/year. The maximum subsidence happens in (d) area (d in
Figure 4), at a rate of up to ~13 cm/year. Paine
et al. [
16] observed the deformation (green polygon in
Figure 4a) in the same area between January and July, 2007. The deforming area has significantly been stretched in dimensions. The enlarged deformation could be an alarming precursor to the potential future development of hazards in the vicinity. Region (e) (
Figure 4) 400 m north of Wink #2 is also influenced by ~3 cm/year subsidence along the road transporting oil field activities.
Positive and negative values in horizontal deformation (
Figure 4b–e) represent eastward and westward movements, respectively. Estimated horizontal deformation rates in Wink #1 (
Figure 4b) and (e) region (
Figure 4e) are minor (<1 cm/year) compared to those of vertical deformation. However, the eastern side of Wink #2 (
Figure 4c) reaches 3 cm/year of westward movement, and the developed sinkhole has been filled with soil sediment and slumps. More obvious horizontal deformation is occurring in (d) region (
Figure 4d). Its western side generally is moving eastward while the eastern part moves mostly westward. The opposite horizontal movements in (d) region agree with the overall subsidence pattern that peaks at the boundary of sign changes in the horizontal motion (white dashed line in
Figure 4d). The precursory deformation in Bayou Corne, Louisiana, USA [
12] before collapse was primarily horizontal movement of the sidewall collapse in the salt dome cavern and the vertical deformation was insignificant. In contrast, even though both horizontal and vertical deformations are observed at (d) region, the vertical component is the dominant one. Moreover, the sinkhole in Louisiana was activated months prior to collapse, but the deformation in (d) region has been reported for years (at least since 2009 in Paine
et al. [
16]) and the sinkhole collapse has not cropped out yet. This suggests a different mechanism that takes effect on the area underlain by a deep-seated salt bed.
4. Discussion
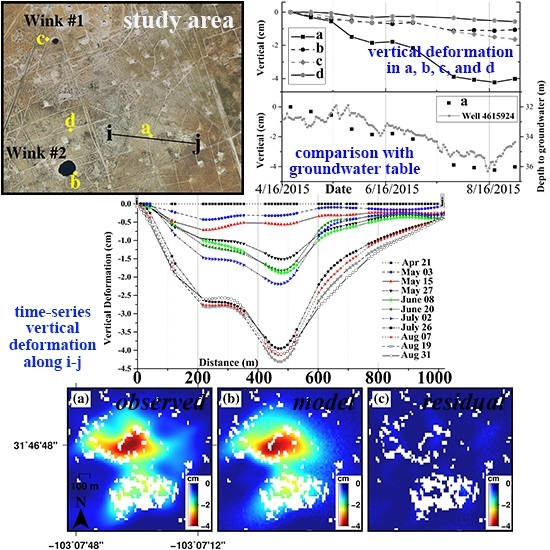
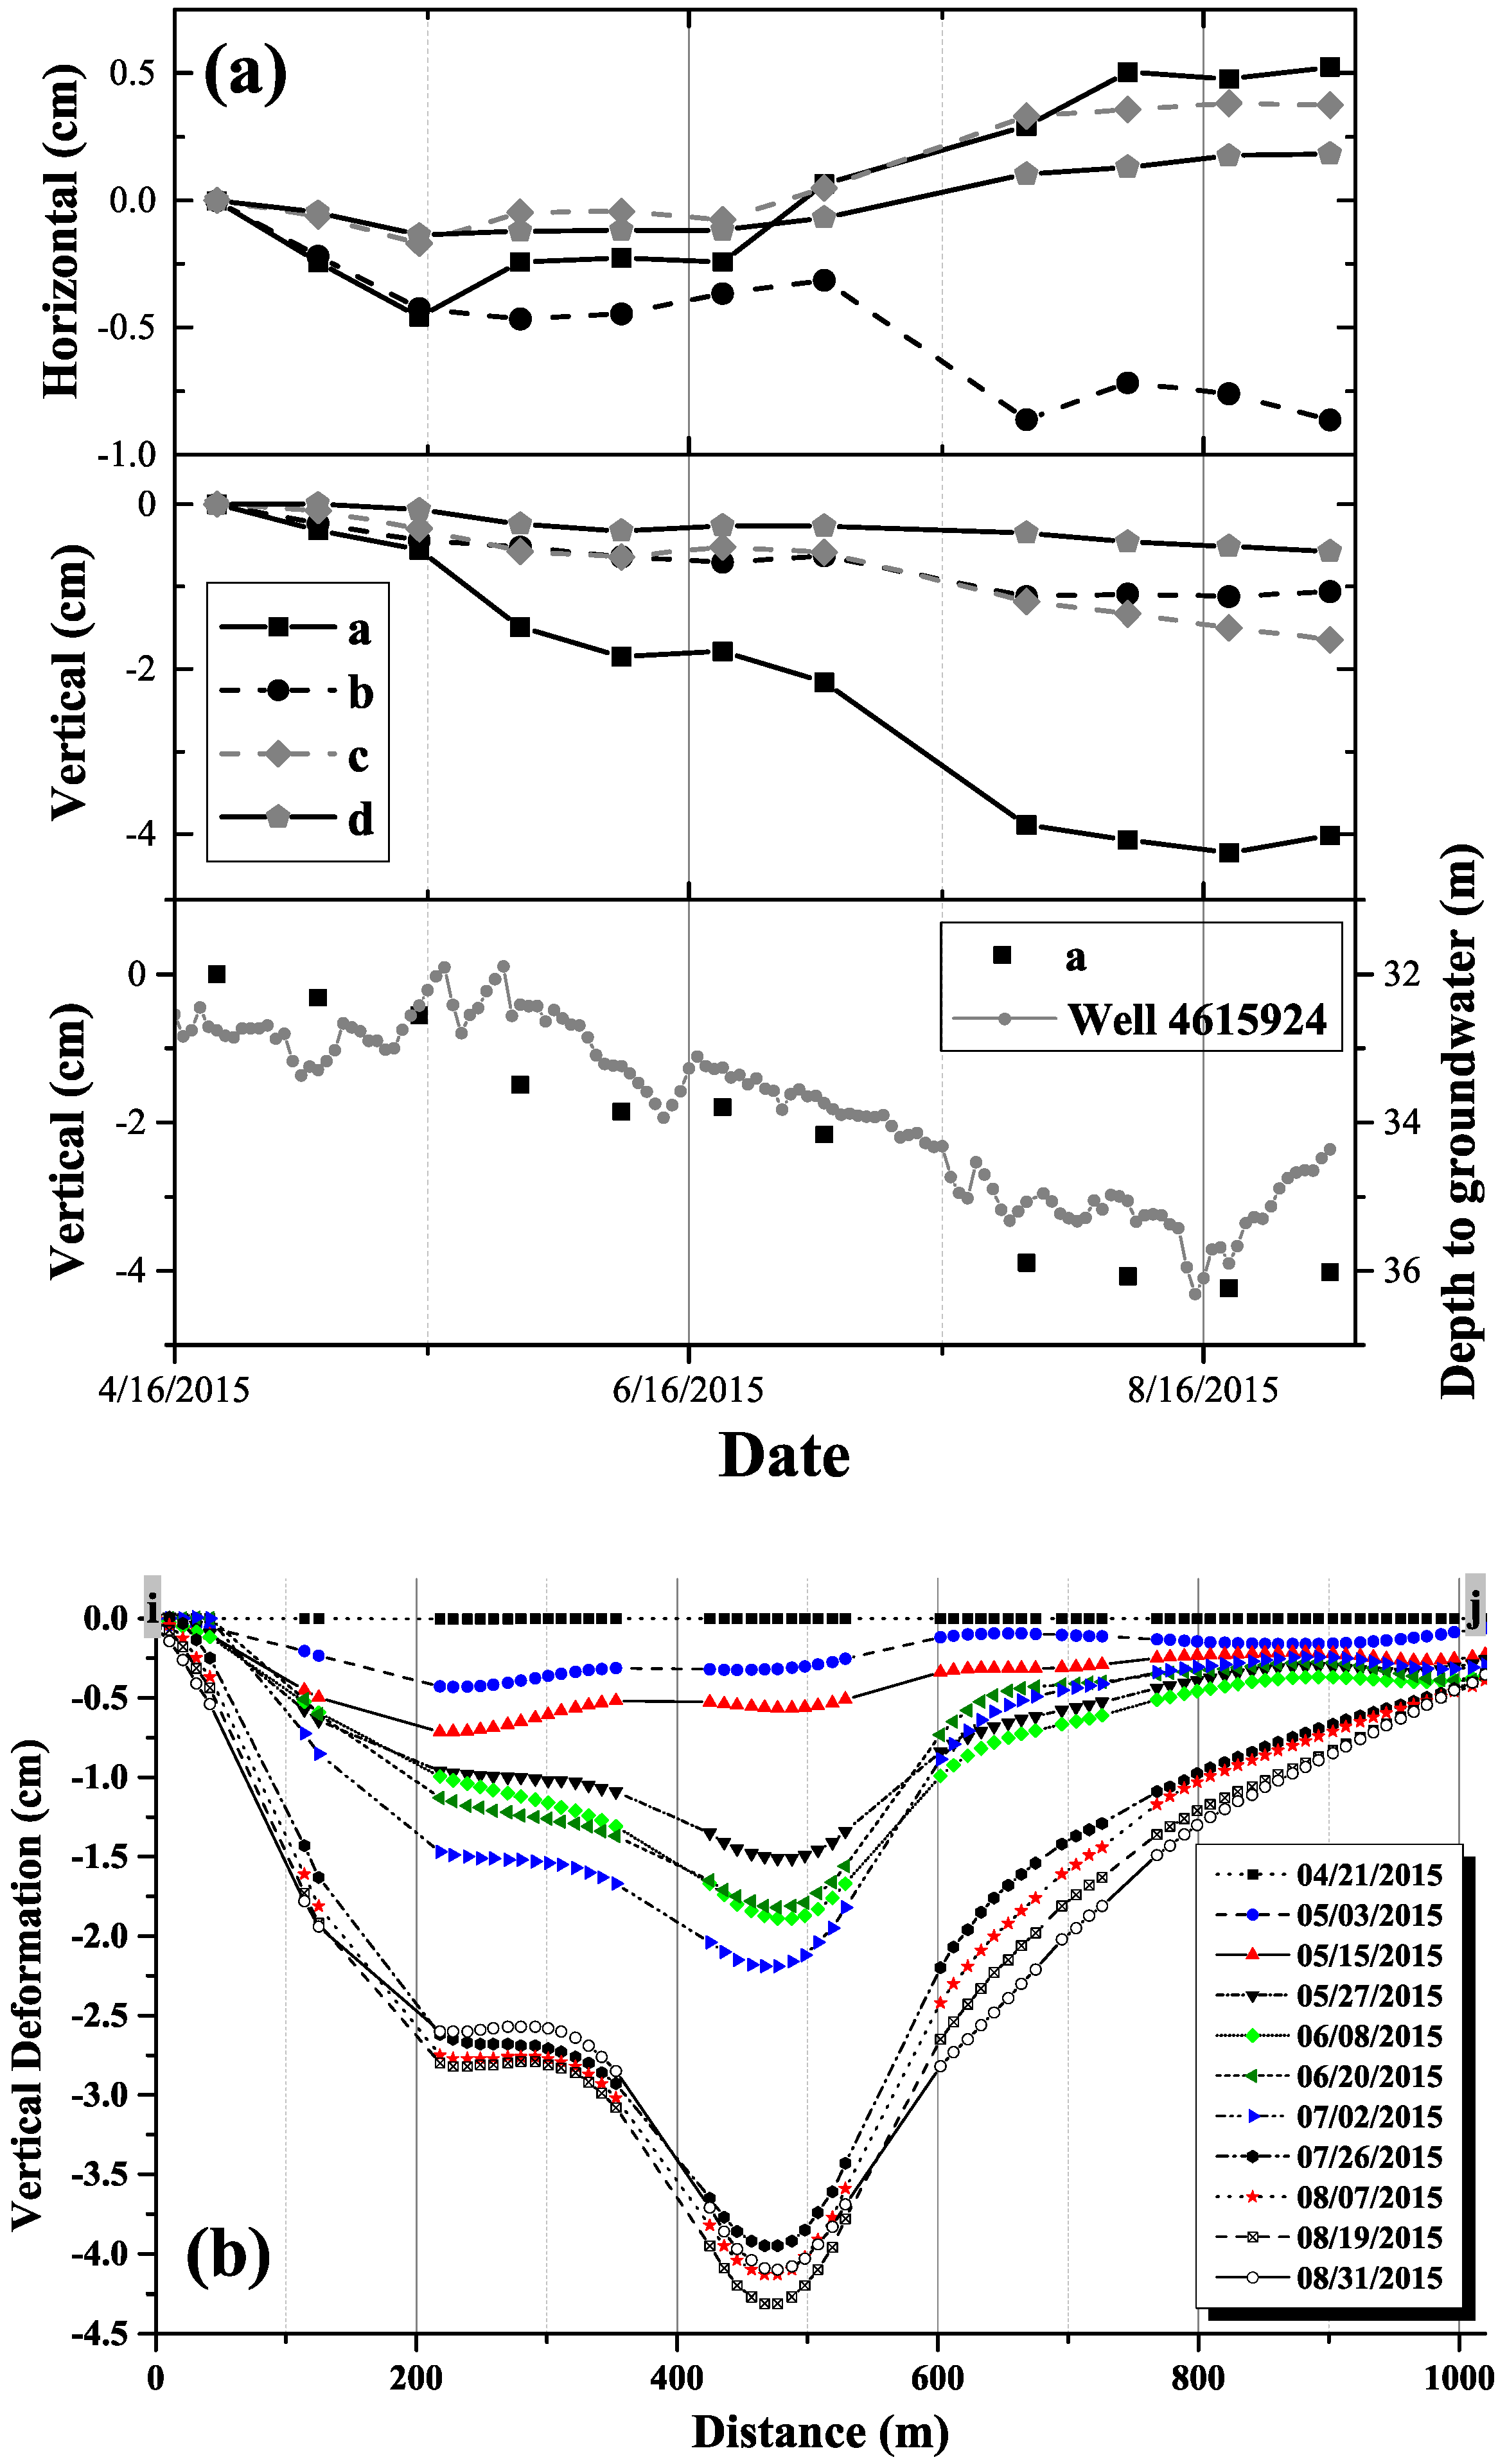
Cumulative time-series horizontal deformation plots in points a, b, c, and d in
Figure 4a show that all locations, except point b, are moving eastward during the time period from late April to August 2015 (
Figure 5a). Moreover, their vertical deformations are all subsidence varying from ~4 cm at point a to ~1 cm at points b, c, and d. Profiles of cumulative vertical deformation along a line i–j (
Figure 5b) highlight the spatiotemporal development of ground depression. Generally, the (d) region continues to subside by ~4 cm for four months, but the largest change of ground deformation happened between 2 July and 26 July and the maximum subsidence at the peak (bottom) of the deformed area occurred on 19 August. Comparing our results with groundwater level measurements at well No. 4,615,924 (bottom in
Figure 5a), the time period is juxtaposed with days of low groundwater level. The groundwater well is located 3 km from our study area (
Figure 1), so the seasonal variations at the well are likely similar to those of the groundwater at the Wink sinkholes. The ground subsidence correlates with the change of groundwater level, implying that this surficial instability is closely related to the groundwater table (bottom in
Figure 5a). This relationship between groundwater and surficial depression in sinkhole-prone areas has been observed in Arizona and Nevada [
23], where the groundwater decline in sinkholes is considered to be the possible cause of ground depression due to the soil consolidation and the loss of buoyant support of materials [
1].
The oil production facilities near the Wink sinkholes (Hendricks well 3-A, Gulf water supply well WS-8) have been inactive for decades [
4], and the current anthropogenic activities, which initially accelerated the dissolution, might not be contributing to this ongoing subsidence. Instead, the natural depression due to the seasonal variation of groundwater is expected to be the primary influence on the subsidence, because the groundwater level in Wink, Texas declines during the summer from high heat and low precipitation. It is interesting to note that, after mid-August, the groundwater recharges to previous levels and the bottom and western part of profile i–j (
Figure 5b) is observed to be slightly uplifted from mid-August to 31 August. The momentary uplift could be the result of increased buoyant support of subsurface sediments [
1], but over time this recharge of the groundwater level and additional inflow of freshwater during periods of high precipitation (winter in Wink, TX, USA) can result in the acceleration of the salt dissolution, which produces subsidence.
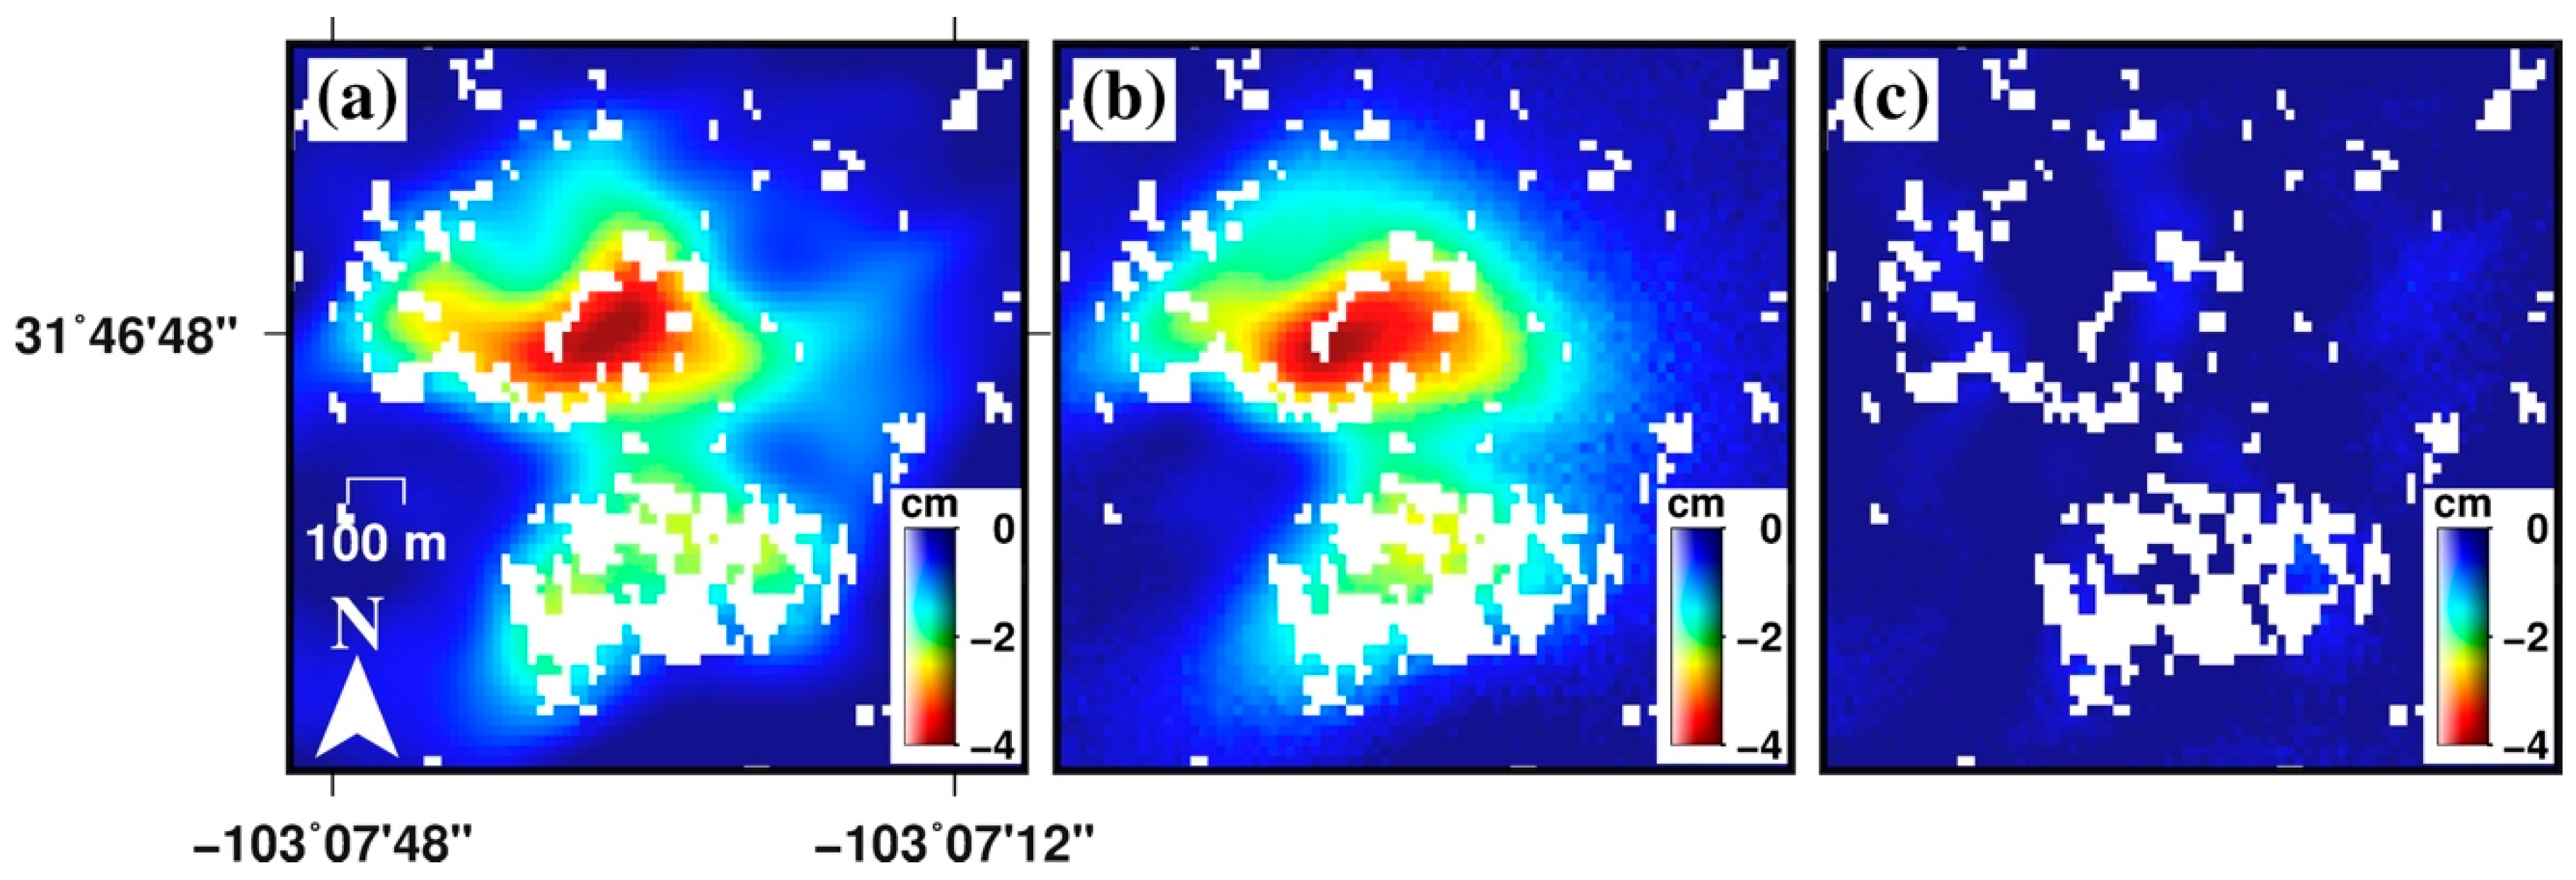
We modeled the sinkhole deformation to explain the subsurface process and, thereby, the overall subsidence pattern above the underground cavity, using the Okada formulation for motions on a distributed set of rectangular dislocation sources within a homogenous elastic half-space [
24]. The best-fitting models were searched over the grid and the best fitting parameters were defined by the root mean square (RMS) misfit from the residuals (observed data model) [
25]. The final cumulative vertical deformation map (
Figure 6a) was used to solve the inverse problem based on the simple elastic displacement (cavity roof deflation) model with a planar array of closing cracks [
26]. We fixed a source depth to 500 m, because a salt layer is bedded [
27,
28] and the cavity was supposed to be open at the depth. Although a single-source model could not find an adequate fit, a two-source model, assuming that two (rectangular-shaped) subsurface cavities were developed, could better describe the behavior of the sinkhole deformation. One source with a rectangular dislocation (120 × 10 m) below the largest deformation is directed toward 30° counter-clockwise from north, and another source with a dimension of 80 × 10 m, 180 m apart from first, is aligned in the direction of 20° clockwise from north. Then, we could find the best-fitting 3-D solution (
Figure 6b) with RMS of 0.18 cm (
Figure 6c). Considering multi-layers with elasto-plasticity may improve the modeling of sinkhole deformation, but our model is based on a pure elastic deformation and elaborates the roof deflation above two cavities.
The sinkhole formation is explained well by the schematic figure [
4,
5,
27,
28] (
Figure 7). A large depression in (d) region (
Figure 7), detected by InSAR techniques, could be explained by two theories. In one theory, the collapse of sinkholes damaged the stability of the ground surface in the vicinity of Wink #2, and weakened soil formation that could lead to continuing and growing subsidence in this region (
Figure 7). As the dissolution cavity beneath Wink #2 grows in the salt bed, the ground depression and its deforming area increases due to weakening of the earth supporting. In another theory, the extensive dissolution of the salt bed beneath Wink #2 and (d) region could cause a large depression related to the formation of a caprock-sagging sinkhole. Progressive dissolution of evaporites is accompanied by continuous flexure of the overlying strata [
1]. Therefore, in the case of caprock-sagging sinkholes, the cavities in (d) region, associated with sinkhole collapse, are not necessarily developed beneath the sagging rocks, but the subsidence process due to the dissolution of evaporites produces caprock-sagging sinkholes and the bending of the strata involves horizontal shortening that may be counterbalanced through the development of discrepant horizontal deformation at margins (
Figure 4d) [
15]. The sagging without roof failure can be a major difference with nearby Wink #1 and #2 sinkholes. The sinkholes did not crop out yet, but the gravitational loading will harm the local roads, as well as oil facilities, as the local news article reported cracks in the highway and fissures near oil tanks [
29].
5. Conclusions
A sinkhole collapse can be severe under natural conditions, but it could be catastrophic in urban settings or at oil/gas exploration facilities. Unfortunately, there have been a limited amount of solutions to continuously monitor areas of sinkhole formation, and to measure ground deformation in the vicinity of existing sinkholes. Our time-series InSAR technique based on the near real-time availability of open-source SAR data from the Sentinel-1 satellite provides the capability to estimate horizontal (east-west) and vertical deformation of the Wink sinkholes from ascending and descending Sentinel-1A datasets. The dense spatiotemporal spaceborne solution could detect the continuous subsidence and the enlargement of the existing sinkholes due to the ongoing collapse of the underlying dissolution cavities. Additionally, during this study the maximum subsidence (~14 cm/year) was observed in the northeastern area of Wink #2, and the extent of the subsidence has significantly expanded since the region was last studied in 2009.
The oil production near the Wink sinkholes peaked from 1920 to 1950 and the drilling, completion, and plugging procedures were suggested to have caused the acceleration of the dissolution of the salt beds. However, based on the comparison of our time-series measurements and groundwater levels, the groundwater decline during summer likely contributed to the increased ground subsidence in the area east of Wink #2. The sinkhole formation and subsidence were initially triggered by the anthropogenic activities, but the natural dissolution associated with the seasonal variation of groundwater is considered to be the primary influence on Wink sinkholes. Our study suggests the existence of marginal horizontal deformation in the subsiding area. From vertical and horizontal deformation, the enlarging Wink sinkholes could influence the ground depression or there could be caprock-sagging sinkhole resulting from the salt dissolution. The subsidence may not be directly related to the sinkhole collapse, but the expansion of the subsiding area could be alarming for future sinkhole development in the vicinity of Wink. Furthermore, we modelled the sinkhole deformation with two sets of distributed dislocation sources, and concluded that the ground depression at sinkholes can be numerically and analytically explained by the elastic contraction of cavities.
A firm understanding of sinkhole formation and ground subsidence throughout our time-series InSAR analysis could play a significant role on evaluating any future sinkhole hazards and alerting civilians and oil companies of the possible risks. Moreover, while our InSAR observations were obtained for a limited period, the long-term measurements from Sentinel-1A, ALOS-2 PALSAR-2, and spotlight TerraSAR-X will allow us to capture the seasonal deformation at high resolution and monitor the evolution and precursory deformation of Wink sinkholes.


