Article

A Rainfall Model Based on a Geographically Weighted Regression Algorithm for Rainfall Estimations over the Arid Qaidam Basin in China

1
Institute of Geographic Science and Natural Resources Research, Chinese Academy of Science, Beijing 100101, China
2
Environmental Quality Comprehensive Assessment Department, China National Environmental Monitoring Center, Beijing 100012, China
*
Authors to whom correspondence should be addressed.
These authors contributed equally to this work.
Remote Sens. 2016, 8(4), 311; https://doi.org/10.3390/rs8040311
Submission received: 22 October 2015 / Revised: 20 March 2016 / Accepted: 31 March 2016 / Published: 8 April 2016

Abstract

:
Accurate rainfall estimations based on ground-based rainfall observations and satellite-based rainfall measurements are essential for hydrological and environmental modeling in the Qaidam Basin of China. We evaluated the accuracy of daily and monthly scale Tropical Rainfall Measuring Mission (TRMM) rainfall products in the Qaidam Basin. A Geographically Weighted Regression (GWR) was used to estimate the spatial distribution of the TRMM product error using altitude and geographical latitude and longitude as independent variables. Finally, a rainfall model was developed by combining ground-based and satellite-based rainfall measurements, and the model precision was validated with a cross-validation method based on rainfall gauge measurements. The TRMM precipitation observations may contain errors compared with the ground-measured precipitation, and the error for daily data was higher than that for monthly data. A time series of TRMM rainfall measurements at the same location showed errors at certain time intervals. The ground-based and satellite-based rainfall GWR model improved the error in the TRMM rainfall products. This rainfall estimation model with a 1-km spatial resolution is applicable in the Qaidam Basin in which there is a sparse network of rainfall gauges, and is significant for spatial investigations of hydrology and climate change.

1. Introduction

Accurate estimations of rainfall distribution are critical for hydrological and environmental models [1]. They are also crucial for statistically evaluating meteorological conditions and the influence of various factors on environmental change [2,3]. Directly measuring rainfall from rain gauges is the most accurate way to determine site-scale precipitation. However, point rainfall measurements only represent the average rainfall over an area, and the uncertainty of these measurements is determined by the density of rain gauges [
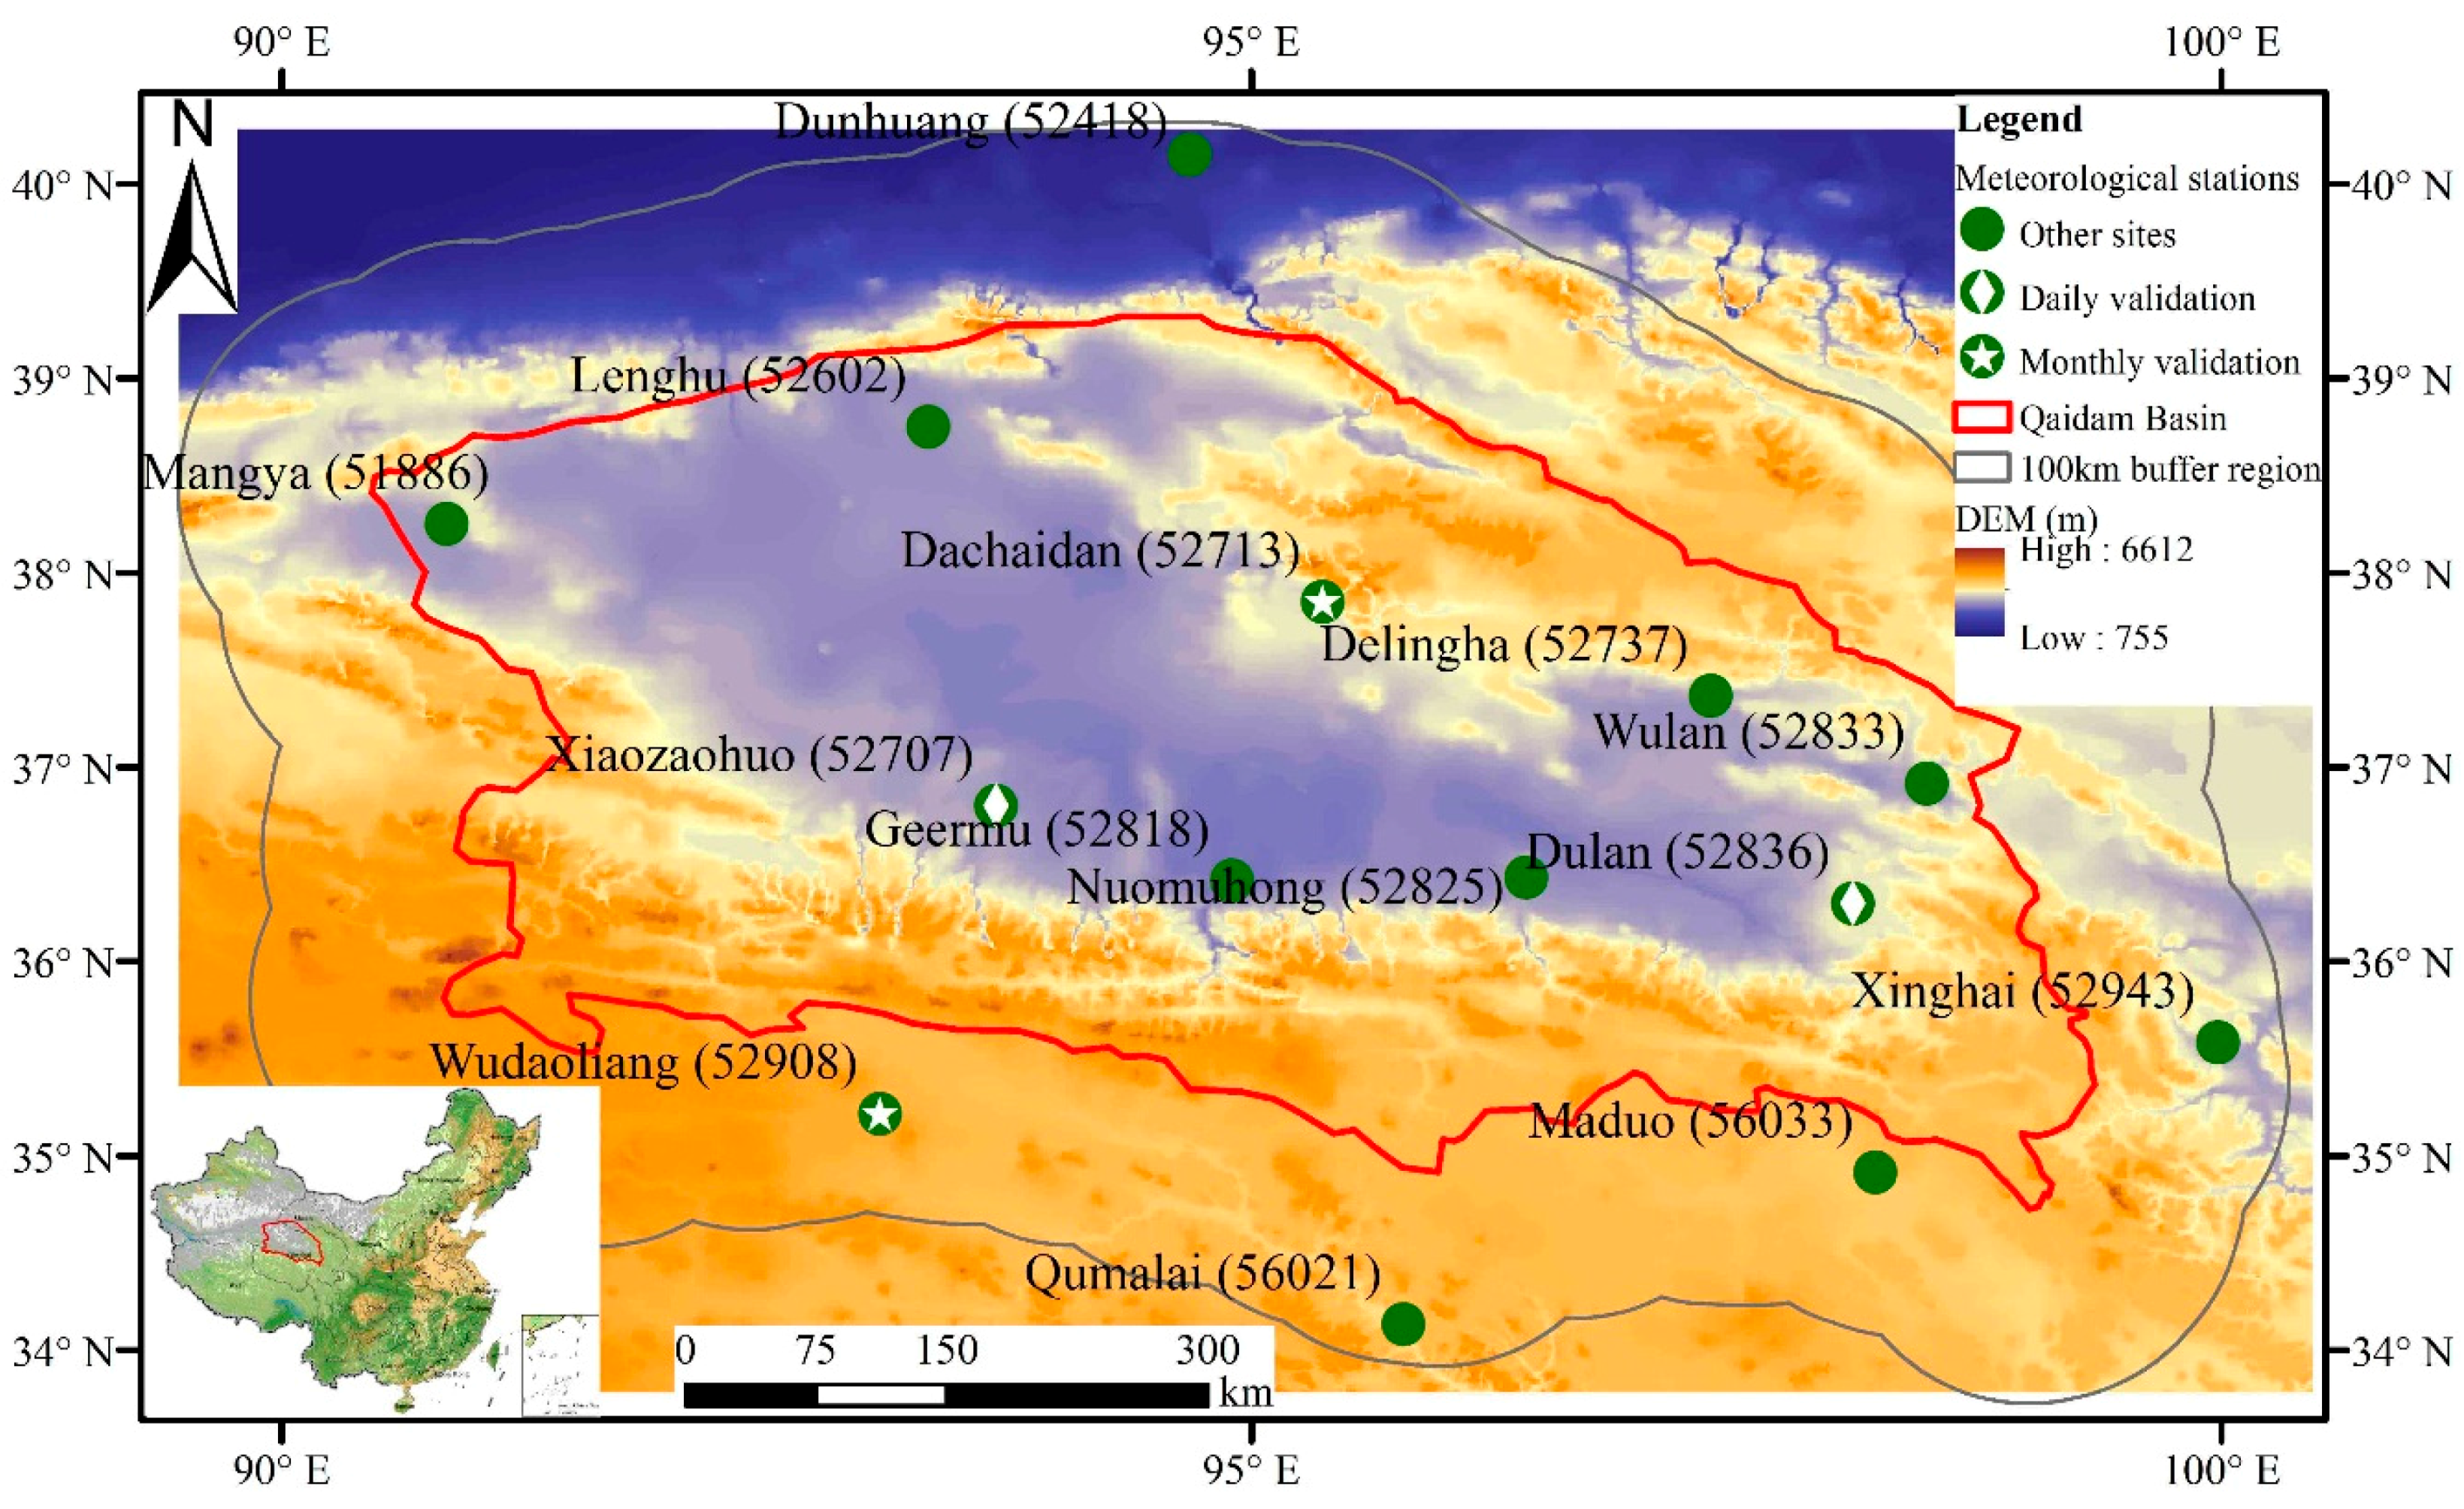
4]. There is a sparse network of rain gauges (14 meteorological sites) in the Qaidam Basin of China, which covers about 260,000 km2. Rainfall distribution in this region is typically estimated based on this network of rain gauges, and is thus subject to a large degree of uncertainty. Moreover, the accuracy of rain gauge-based measurements is strongly affected by the complex spatial and temporal variability of rainfall at a specific locations [5]. Because of high altitude, desert, and harsh weather conditions, it is difficult to expand the network of rain gauges in the Qaidam Basin. Therefore, accurate estimations of rainfall distribution in combination with ground-based rainfall observations and other data sources is essential in uninhabited regions including the desert, high mountains, and plateau in and around the Qaidam Basin.
Satellite-based techniques are another way to achieve regional rainfall measurements [6,7,8,9,10]. Compared with ground-based measurements, satellite-based methods provide rainfall estimations at much finer temporal and spatial resolutions [11]. The advantages of satellite-based rainfall measurements mitigate some of the problems associated with ground-based rainfall gauges [12]. Among the existing satellite-based global rainfall products, Tropical Rainfall Measuring Mission (TRMM) estimates are the most widely used rainfall products [13,14,15,16]. Since its launch in 1997, TRMM has provided critical precipitation measurements in tropical and subtropical regions of the planet [17]. Numerous studies have applied and evaluated TRMM rainfall data for environmental and meteorological research [18,19,20,21,22].
The spatial distribution of rainfall has dual characteristics; it is a combination of continuity and discontinuity, as well as of certainty and randomness [12,23]. The inevitable impacts of environmental factors give rise to the complex spatial variability of rainfall. This is the basic reason for zonal rainfall distributions. The bottom mat condition is another important factor impacting the spatial distribution of rainfall; in particular, topography has the most significant influence of rainfall spatial distribution [24]. Continental plateaus (for example, the Tibetan Plateau in China) and large mountains influence regional circulation patterns, thereby affecting large-scale rainfall distributions. The non-stationary relationship between precipitation and altitude has been confirmed by many statistical analyses and numerical experiments [25,26,27].
Due to the complex characteristics of rainfall spatial variability and its numerous influential factors, it is difficult to exactly estimate the spatial distribution of rainfall [28]. Conventional methods for estimating rainfall distributions are based on gauges and employ spatial interpolations. Thus far, there are at least 10 types of rainfall spatial interpolation methods [29,30], and these can be divided into two categories. The first type is based on ground-based rainfall measurements only. The rainfall at a specific location is estimated from gauges at many adjacent sites without considering the impacts of geographical position, topography, and other factors. Geographical spatial interpolation algorithms such as the Spline, Ordinary Kriging, and Inverse Distance Weighting techniques are typical representative methods [31,32]. The second type of spatial estimation method combines ground-based rainfall measurements with major influential factors such as geographical position and topography [32,33]. For example, the regression-based Parameter-elevation Relationships on Independent Slopes Model (PRISM) uses point data, a Digital Elevation Model (DEM), other spatial datasets, and an encoded spatial climate knowledge base to estimate precipitation at various time scales [34]. The PRISM dataset was shown to accurately represent spatial precipitation patterns. However, linear climate–elevation relationship regression methods and station-weighting functions still need to be evaluated for high quality precipitation estimations.
Satellite-based rainfall data cannot accurately represent local rainfall distributions [12]. However, rainfall estimations from ground-based measurements also contain obvious uncertainty in areas with sparse networks of rainfall gauges. Merging ground-based and satellite-based rainfall measurements improves the accuracy of rainfall distribution measurements [4,12,28]. The TRMM product 3B42RT(V7) (Hereafter 3B42RT) is a precipitation product that integrates information from both ground-based and satellite-based rainfall measurements [13,14,19,22,35].
As summarized by Kidd and Huffman (2011) and Kidd and Levizzani (2011), there have been a number of efforts to improve the accuracy of rainfall estimation models [36,37], including instantaneous rainfall estimations using neural network analysis [38] and rainfall estimations based on a combination of satellite infrared and lightning information [39]. The Food and Agriculture Organization (FAO) of the United Nations has also attempted to develop and improve satellite rainfall estimation methods [40]. Studies on combined radar–gauge rainfall measurements began in the 1970s [41,42]. Since then, significant progress has been made in combined gauge–satellite rainfall distribution estimations [43,44]. However, a consistent definition for “Rainfall Blending” does not exist in meteorological or hydrological fields. There are two basic methods for merging gauge and satellite rainfall data. The first is a simple globally averaged calibration. However, due to the influence of land surface conditions and rainfall types, this method cannot reflect the non-stationary spatial relationship between satellite rainfall observations or ground-based gauge measurements and actual rainfall. Therefore, local estimation methods such as the Geographically Weighted Regression algorithm (GWR) [27], Objective Analysis (OA), Optimum Interpolation (OI), the variation method, geo-statistics [45], adaptive kernel density estimation [46], and condition fusion are widely used for regional rainfall estimations.
Geographically Weighting Regression (GWR) is a robust algorithm that has been successfully used in spatial rainfall analyses. GWR can theoretically integrate geographical location, altitude, and other factors for spatial rainfall estimations, and reflects the non-stationary spatial relationship between these factors and rainfall [27,32,47,48]. Based on GWR, Xu et al. (2015, [27]) developed a new satellite-based monthly precipitation downscaling algorithm based on the non-stationary relationship between precipitation and NDVI and DEM. The study showed that the downscaled precipitation datasets performed better than traditional downscaling algorithms over the eastern Tibetan Plateau and the TianShan Mountains. In this research, precipitation was regressed using the non-stationarity of the relationship between TRMM and NDVI, DEM based on GWR. The ground-based precipitation measurements were not used as a variable to generate the background rainfall conditions before the precipitation estimation [27]. The GWR rainfall model has only been applied in local areas or small watersheds with concentrated networks of rainfall gauges, and research is lacking in regions with sparsely distributed gauges. Furthermore, rainfall varies among different climatic regions, and GWR applications require further study in arid or desert regions such as the Qaidam Basin in China [47].
The aim of the present study is to merge ground-based and satellite-based rainfall measurements for accurate spatial rainfall estimations in the Qaidam Basin of China, which has a sparse network of rainfall gauges. First, the 3B42RT rainfall product was evaluated on both daily and monthly scales. Then, a spatial rainfall fusion technique combining ground-based and satellite-based measurements was established based on the GWR algorithm and applied to daily and monthly scale spatial rainfall estimations. The accuracy of the rainfall distribution estimations was evaluated by comparing the results to ground-based rain gauge observations and conventional satellite-based rainfall measurements. This study will improve regional rainfall estimations based on 3B42RT data along with rain gauge observations in arid or desert regions, and strengthen our understanding of the relationship between 3B42RT data and rain gauge measurements in this region.

2. Study Area and Data

2.1. Study Area

The Qaidam Basin (90°16′E–99°16′E, 35°00′N–39°20′N), a type of plateau basin, is located in the northwest of Qinghai Province and surrounded by the Kunlun Mountains, Altun Mountains, and Qilian Mountains. The boundary of the Qaidam Basin used in our study was determined according to the terrain features of the basin, including parts of Qinghai and Gansu Province. The Qaidam Basin is 800 km long from east to west, 300 km wide from north to south, and has an area of 257,768 km2. The basin is located in a crescent valley formed by mountains and plateaus. It has an altitude of over 3000 m and is the highest of China’s four largest basins. The basin has a plateau continental climate and is characterized by drought. The annual precipitation in the Qaidam Basin is 200 mm in the southeast, and this has progressively decreased to 15 mm in the northwest. The relative air humidity in this basin typically ranges from 30% to 40% but can reach less than 5%. The average annual temperature is low, and the wind power is strong, causing a harsh natural environment. Most of the land in this area is classified as arid desert, and the main soil types are salify desert soil and gypsum desert soil. Due to scarce precipitation, large temperature differences, and strong wind, desertification and salinization in the basin are obvious and the environment is fragile. The Qaidam Basin is the area of the Qinghai Tibet Plateau that is most sensitive to climate change.

2.2. Data

2.2.1. 3B42RT Data

The TRMM is a joint U.S. and Japan satellite mission for monitoring tropical and subtropical precipitation and estimating the associated latent heat. Rainfall measuring instruments on the TRMM satellite include a Precipitation Radar (PR), an electronic scanning radar operating at 13.8 GHz; TRMM Microwave Image (TMI), a nine-channel passive microwave radiometer; a visible and infrared scanner (VIRS); and a five-channel visible/infrared radiometer. The purpose of the 3B42 algorithm is to produce TRMM-adjusted merged-infrared (IR) precipitation and Root-Mean-Square (RMS) precipitation-error estimates. In this study, we used the dataset version 7 (3B42RT) from 1 January 2001 to 31 December 2013 with a spatial resolution of 0.25° × 0.25°. The 3B42RT combination is computed from 50°N–S every 3 h from the 3B40RT (High Quality) and 3B41RT (Variable Rainrate) fields.

2.2.2. Meteorological and Digital Elevation Data

The monthly and daily precipitation data were obtained from the basic and standard surface meteorological stations in the study area. About 14 years of monthly and daily meteorological data (2000–2013) were acquired from the China Meteorological Data Network [49]. The quality of the raw data was strictly controlled and inspected during the production process. To improve the precision of the precipitation distribution estimations, a 100-km buffer surrounding the study area was established and 14 meteorological sites were selected to construct the precipitation distribution model (Figure 1). DEM with a 1-km spatial resolution was used because it is directly related to the precipitation distribution. The DEM was derived from the “China Western Environment and Ecology Science Data Center” [50].

3. Methodology

3.1. Precipitation Spatial Estimation Model Development

Satellite-based measurements provide spatially continuous but inaccurate precipitation estimates, whereas ground-based precipitation observations provide accurate but spatially discontinuous information. Accurate continuous precipitation distribution estimations can be generated by merging satellite-based and ground-based precipitation data. Assuming P   is the real precipitation field for a region, P o is the observed precipitation field formed by n observation sites, and P b is the precipitation background field (or initial evaluation field), the relationship among these variables can be described as:
P o ( i ) P b ( i ) + e b ( i ) ,   i = 1 ,   2 ,   ,   n
where e b ( i ) is the precipitation background error and observation error at the observation site i, and the mathematical expectation for the precipitation background error and observation error is 0. Therefore, the precipitation background error can be estimated using the difference between the actual precipitation measurements and background value as:
e b ( j ) = f [ P o ( 1 ) P b ( 1 ) ,   P o ( 2 ) P b ( 2 ) ,   ,   P o ( n ) P b ( n ) ]
where e ^ b ( j ) is the precipitation background error at position j without including ground-based measurements, and P o ( 1 ) P b ( 1 ) ,   P o ( 2 ) P o ( 2 ) ,     ,     P o ( n ) P o ( n ) represent the differences between observed precipitation values and background values at n points with actual precipitation measurements. GWR was used to estimate the precipitation distributions. The results can be calculated by adding the precipitation background value and the estimated precipitation background field error using GWR:
P ( j ) = P b ( j ) + e b ( j ) = P b ( j ) + f [ P o ( 1 ) P b ( 1 ) ,   P o ( 2 ) P b ( 2 ) ,   ,   P o ( n ) P b ( n ) ]
where P ( j ) is the precipitation at point j without including ground-based precipitation measurements, and P b ( j ) is the satellite-based background precipitation value at j .
The temporal scales of data from the meteorological stations are daily and monthly. The daily ground-based rainfall measurements included total precipitation from 8:00 P.M. on the previous day to 8:00 P.M. on the current day, and monthly precipitation was calculated as the sum of the daily precipitation. The 3B42RT data were strictly controlled for quality, and values with poor quality or missing samples were eliminated from the dataset. The three-hour 3B42RT data were used to derive the daily and monthly precipitation background values. To calculate the daily 3B42RT precipitation data, three-hour 3B42RT data were taken from the last observation on the previous day to the first seven observations on the current day. Monthly 3B42RT was calculated as the sum of the daily precipitation.

3.2. GWR Model

GWR is an extension of the common linear regression model. GWR directly builds a relationship between location and parameters using spatial x, y coordinates, as well as the local fitting relationship between the dependent variable and independent variables. GWR also can integrate multiple factors to fit the dependent variable. As a robust tool to describe spatial heterogeneity, the regression coefficients in GWR are not based on global information; rather, they vary with location, which is generated by a local regression estimation using sub-sampled data from the nearest neighboring observations. The principle of GWR is as follows:
y i = β 0 ( μ i , ν i ) + i = 1 n β j ( μ i , ν i ) x i j + ε i ,   i = 1 ,   2... ,   m ;   j = 1 ,   2 ,   ... ,   n
where y i ;   x i 1 ,   x i 2 ,     ,     x i j are the observation coefficients between the dependent variable y and independent variable x j at the geographical position ( μ i ,   v i ) , μ i represents longitude,   v i represents latitude, and β j ( μ i ,   v i ) represents unknown parameters at the observation site ( μ i ,   v i ) , which can also be recognized as n unknown parameters. By selecting elevation as the independent variable, a GWR model was established based on the precipitation background error at the weather station and actual precipitation measurements. ε i represents independent identically distributed random errors in region i in accordance with the spherical disturbance hypothesis such that the mean value is 0 and the variance is σ 2 and independent, normally assumed to follow a distribution of N (0, σ 2 ).
To solve the mathematical problem, a local regression model was built using the actual observation site i and its adjacent observation samples. The spatial distance decay weight matrix w i j reflects the differences between adjacent observation values and point i . GWR comprehensively considers the local autocorrelation of the dependent variable and its cross-correlation with the independent variables, and both are used for spatial estimations. The spatial autocorrelation of the dependent variable is described by the weight matrix, whereas the cross-correlations between the dependent variable and independent variables are reflected by the local regression index. The self-adaption function (similar to the Gauss truncation function) was used to adapt and adjust the bandwidth and to optimize the spatial weight matrix:
w i j = { [ 1 ( d i j / b ) 2 ] ,   when   d i j b 0 ,   when   d i j > b
where d i j is the distance between j and i , and b is the bandwidth. The cross-validation method was used to determine the optimal bandwidth b . The b value corresponding to the minimum value of cross-validation is the optimal bandwidth.
C V = 1 n i = i n [ y i y ^ i ( b ) ] 2
where C V is the cross-validation result, and y i and y ^ j are the estimated and observed values at site i , respectively. The parameter y ^ i which represents the self-observation site i , is eliminated during the regression parameter estimation process, whereas only other observation sites are used within the range of bandwidth b .
In our study, the differences between ground-based and satellite-based precipitation observations at 14 meteorological sites were calculated. Then, the GWR model was used to estimate the spatial distribution of the difference values, and elevation was selected as an independent variable with significant influence on the spatial distribution of precipitation. Finally, an estimated error value was added to the satellite-derived precipitation background value to calculate the spatial precipitation.

3.3. Accuracy Evaluation

The cross-validation method was used to evaluate the accuracy of the GWR model. There are 14 meteorological sites in and around the study area. All samples from January 2001 to November 2013 at one site were used as the validation data, and samples from the other 13 sites were used to generate the GWR model. The cross-validation process was repeated 14 times, with each of the subsamples from one site used exactly once as validation data. The results from the 14 meteorological sites were then used to produce the estimation.
Quantitative and classification indicators were used to evaluate the consistency between ground-based and satellite-based precipitation observations. Quantitative indicators included Absolute Error, Mean Absolute Error, Relative Deviation, Systematic Relative Deviation, and Correlation Coefficient. The principles of the indicators are as follows:
E i = S i O i ,   i = 1 ,   2 ,   ... ,   n
A E i = | S i O i | ,   i = 1 ,   2 ,   ... ,   n
M E = i = 1 n E i / n
M A E = i = 1 n A E i / n
B I A S = M E / O ¯
A B I A S = M A E / O ¯
r = i = 1 n ( S i S ¯ ) ( O i O ¯ ) / i = 1 n ( S i S ¯ ) 2 i = 1 n ( O i O ¯ ) 2
R M S E = i = 1 n ( S i O i ) 2 / n
where i and n are the observation site and site number in study area, respectively; S i and O i are the precipitation fitting value and ground-based observation value, respectively, and S ¯ and O ¯ are the corresponding mean values; E i and A E i are the Error and Absolute Error at site i , respectively; M E and M A E are the Mean Error and Mean Absolute Error at the meteorological sites, respectively; B I A S and A B I A S are the relative values of M E and M A E , named Relative Deviation and Systematic Relative Deviation, respectively; and r is the Correlation Coefficient between the fitted precipitation value and the observed value.
The skill index was used to assess the improvement or reduction in the accuracy of the precipitation fusion scheme compared to others. The formulas are as follows:
S I M A E = 1   M A E 2 / M A E 1
S I r = { r 2 / r 1 1 ,  if   r 1 > 0   1- r 2 / r 1 ,  if   r 1 < 0
where M A E 1 and M A E 2 are the mean Absolute Errors of the two precipitation distribution estimation schemes being compared, and r 1 and r 2 are the Correlation Coefficients of the two schemes. Theoretically, the ranges of S I M A E and S I C C are ( , 1) and ( , + ) , respectively. The threshold values of S I M A E and S I r are both 0, which is used to determine whether the estimation accuracy for the fusion scheme is improved compared to the reference plan. Values of S I M A E and SIr greater than 0 indicate that the precipitation estimation accuracy is improved for the fusion scheme, and the improvement degree is proportional to the S I M A E and S I r values. Lower S I M A E and S I r values correspond to reduced precipitation estimation accuracy and a larger degree of reduction.
The accuracy evaluations of the daily and monthly scale precipitation estimations were separately implemented. The raw 0.25° × 0.25° 3B42RT data were resampled to 1 km × 1 km using the B-Spline method, and then used to generate the merging GWR precipitation model. Moreover, the raw and resampled 3B42RT data were used to compare and analyze the accuracy and effect of the GWR model. These steps will help to determine whether the merging GWR model accounted for the error in the 3B42RT rainfall products.

4. Results and Discussion

4.1. Daily Precipitation Distribution Estimations

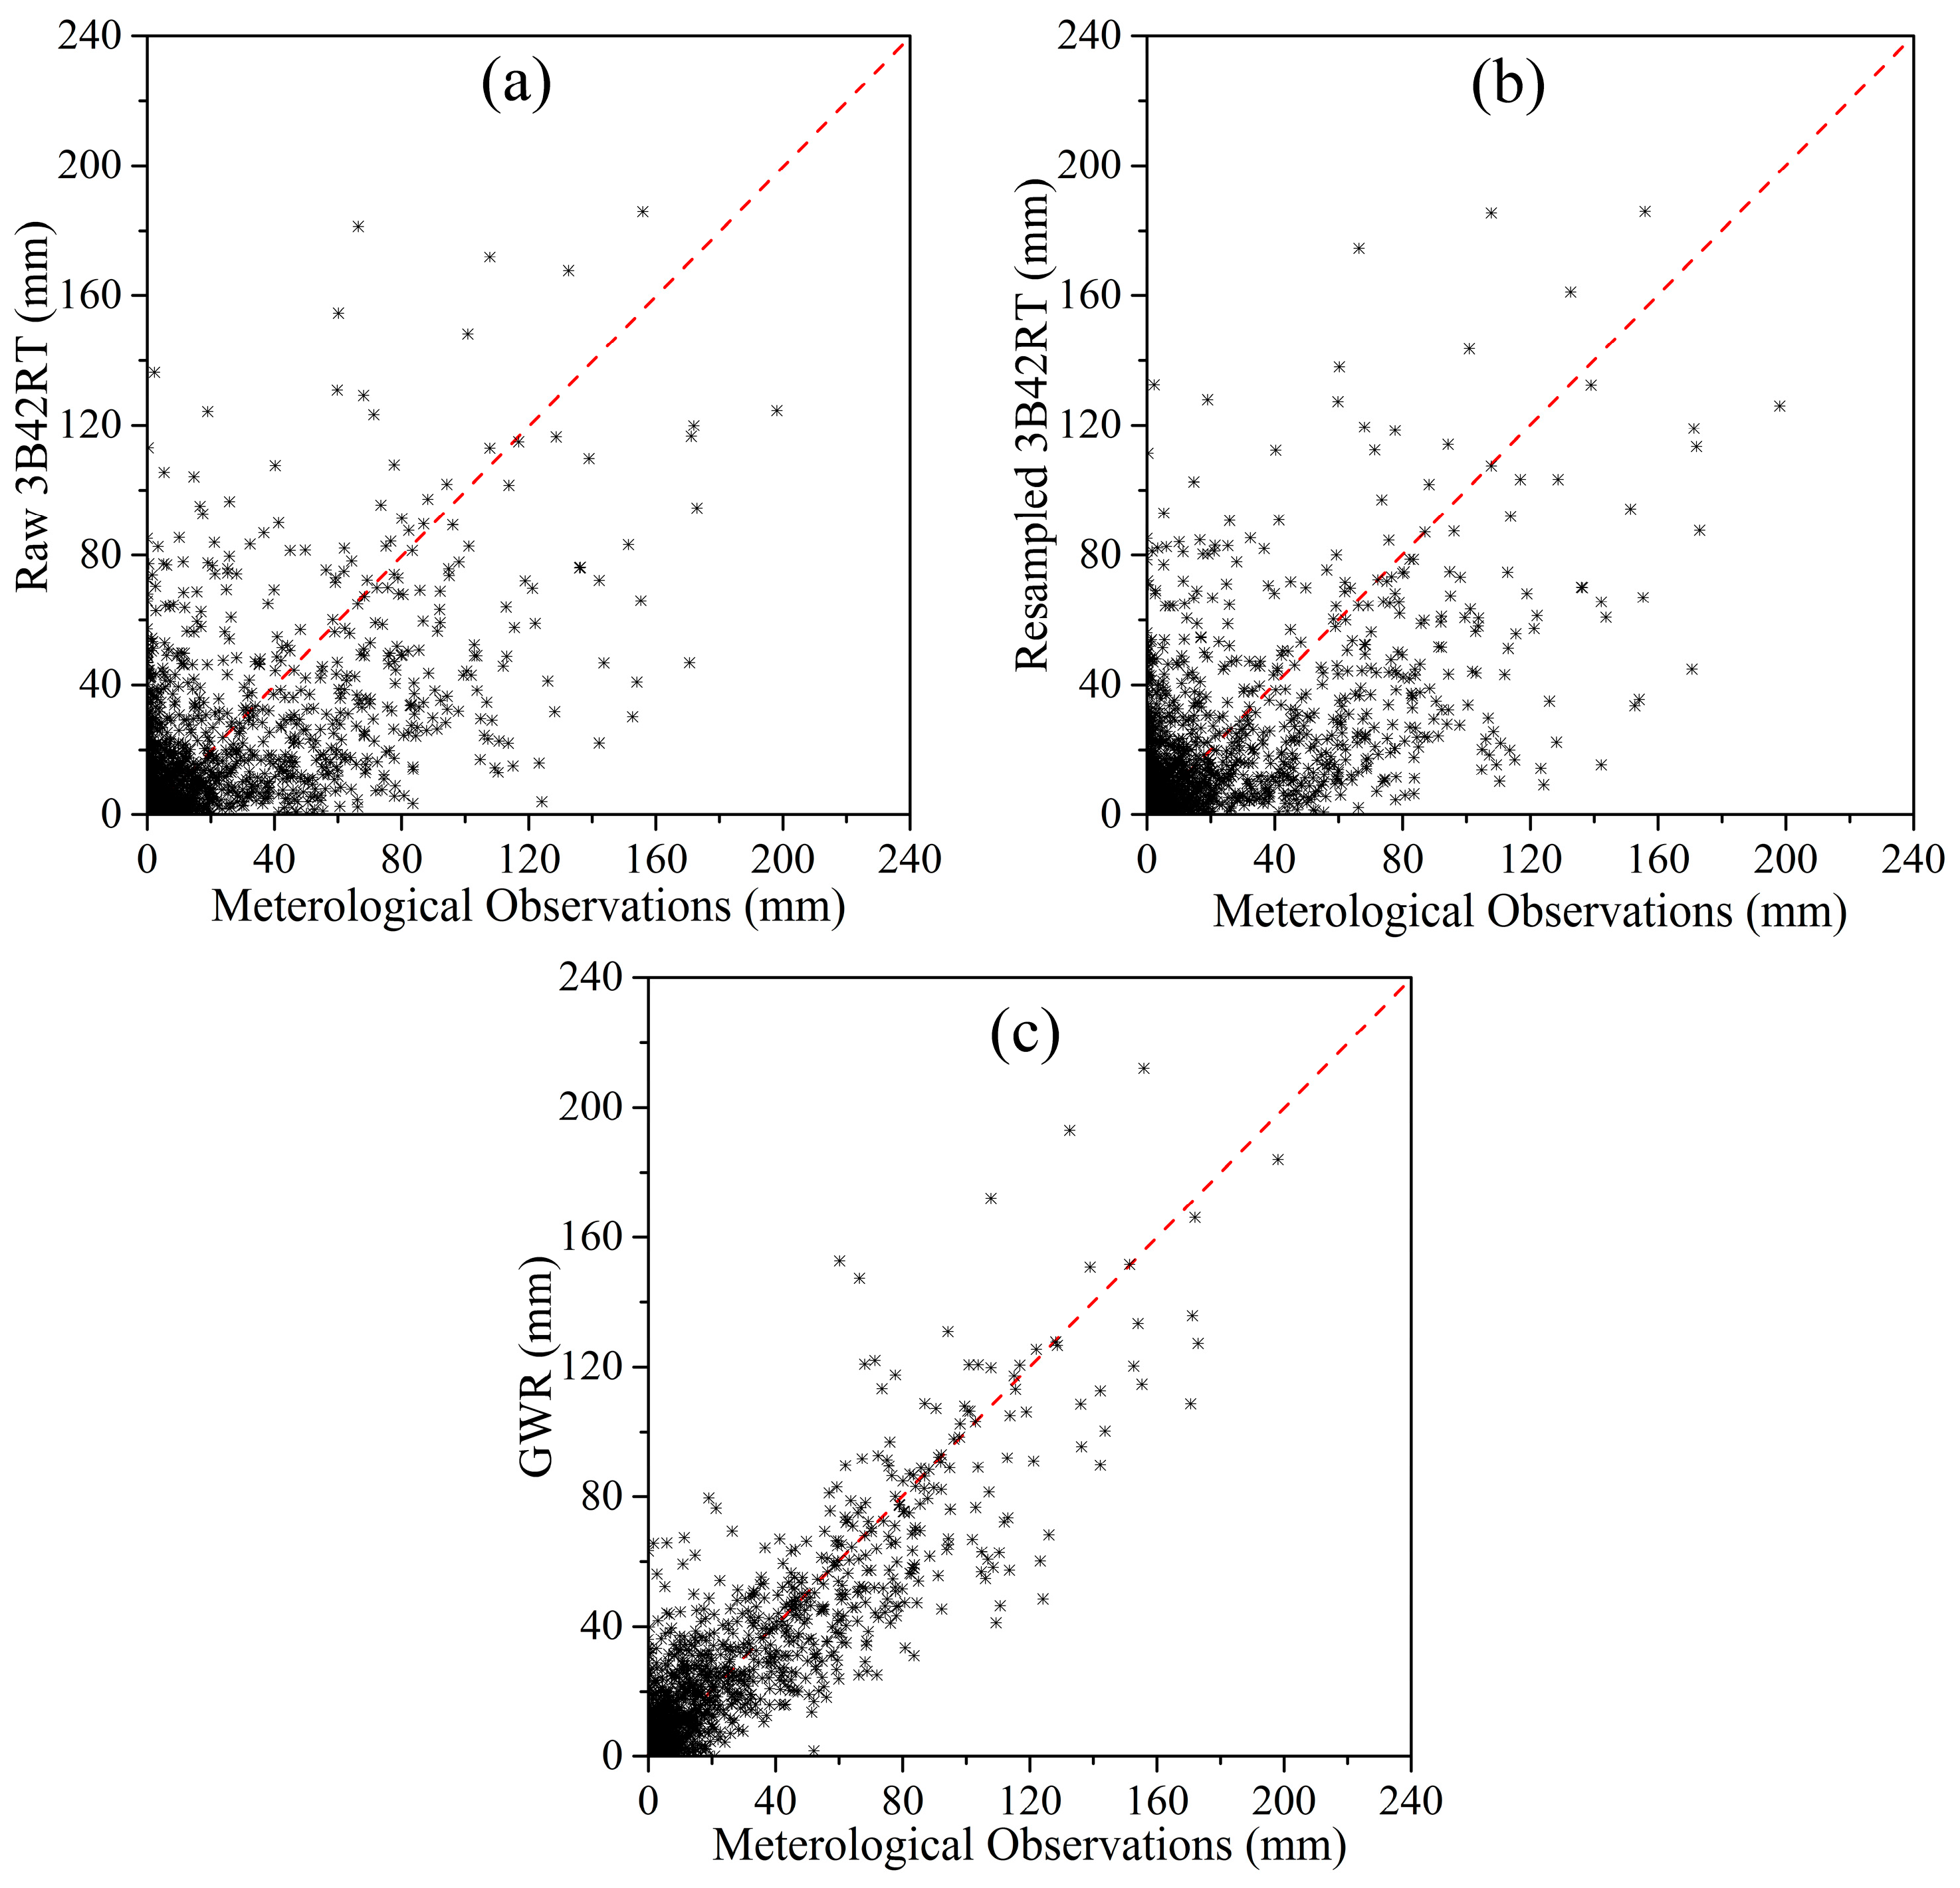
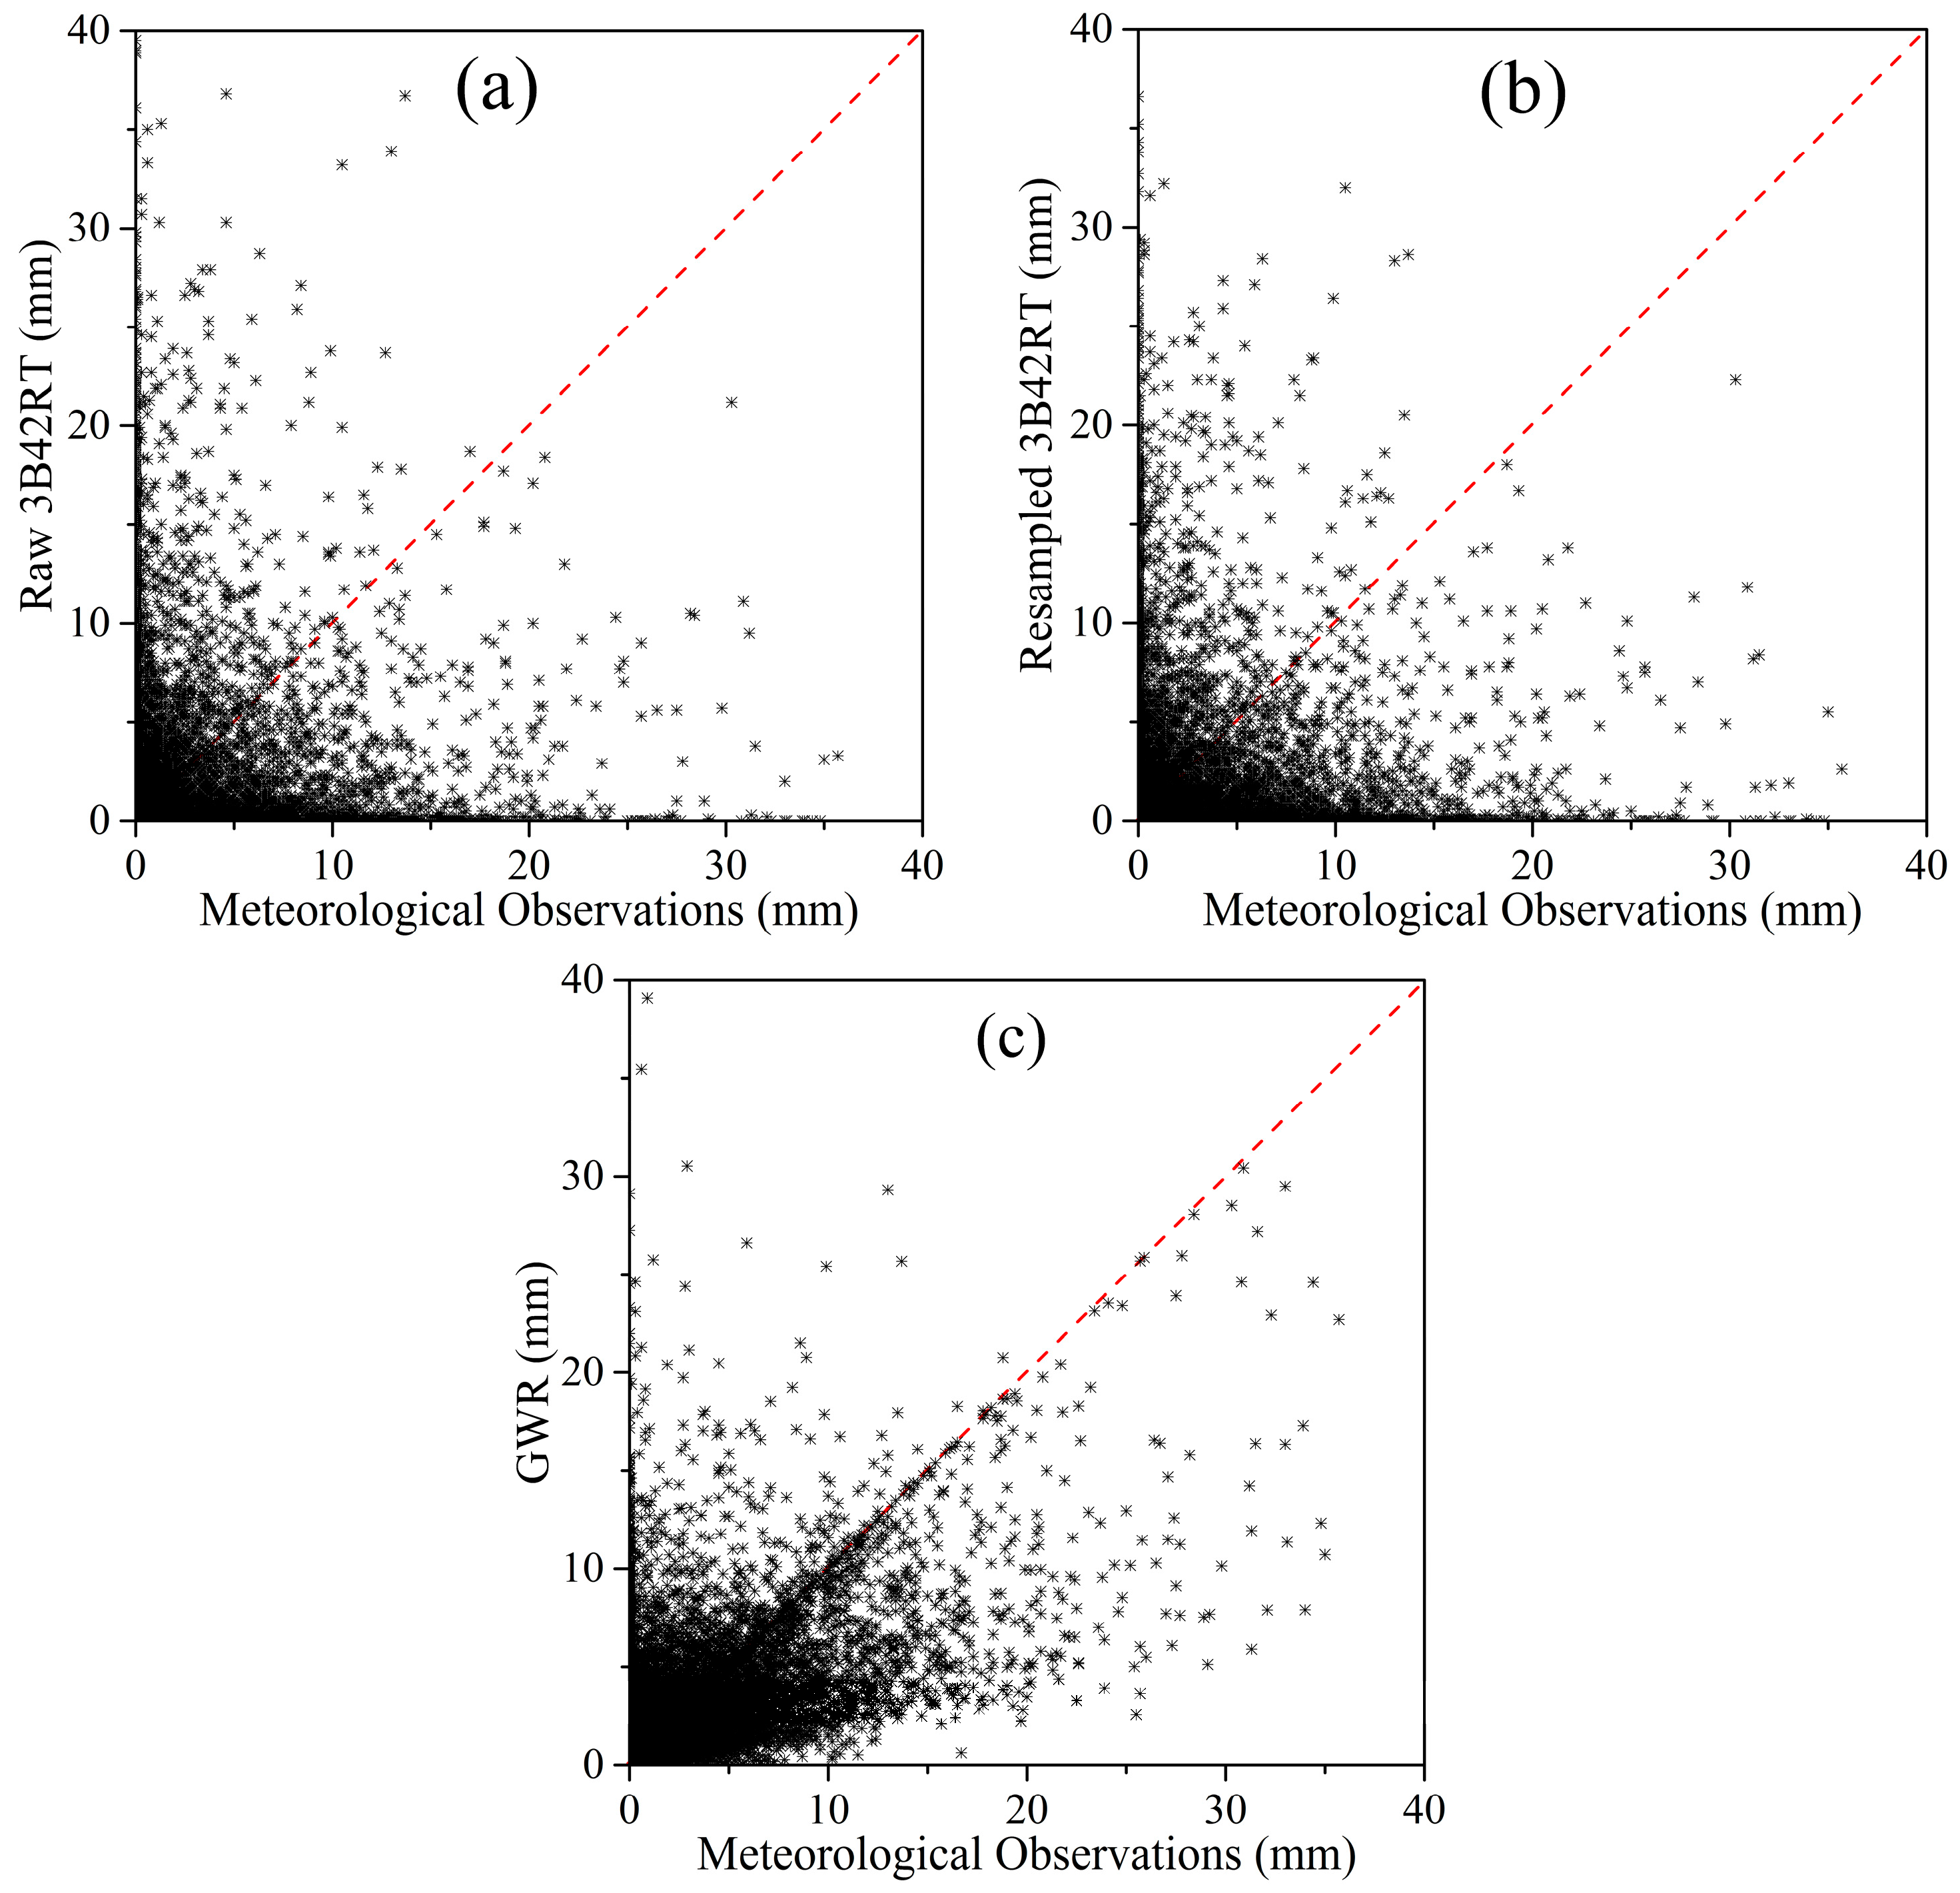
Scatter plots between the daily ground-based precipitation observations and raw (0.25° × 0.25°), resampled (1 km × 1 km) 3B42RT data and precipitation estimated with the GWR model from all sites between January 2001 and October 2013 are shown in Figure 2.
The correlation between GWR-estimated and ground-based precipitation measurements (Figure 2c) was improved compared with the raw and resampled 3B42RT data (Figure 2a,b). The scatter plots of raw and resampled 3B42RT vs. ground-measured precipitation were similar (Figure 2a,b). The correlation between raw and resampled 3B42RT data and ground measurements was low. These results indicate that at a daily scale, 3B42RT precipitation observations may contain error compared with ground-measured precipitation. The convergence of scattered points between the raw and resampled 3B42RT data and ground-measured precipitation was not obvious (Figure 2a,b). However, the precision of GWR-estimated precipitation obviously improved, as shown in Figure 2c.
For the similar accuracy of raw and resampled 3B42RT data, the GWR accuracy was evaluated compared to the resampled 3B42RT data. Correlation coefficients, root mean square error, mean error, and mean absolute error were used to evaluate the accuracy of precipitation estimated with the GWR model and 3B42RT interpolation method (Table 1).
Through a comparative analysis, it was found that the estimation accuracy of the GWR method was greater than that of the resampled 3B42RT observation. The GWR estimated precipitation was significantly correlated with the actual precipitation, with a correlation coefficient of 0.6538 (p ≤ 0.01). However, the correlation coefficient between the resampled 3B42RT data and actual precipitation was only 0.1587 (p ≤ 0.01). The root mean square error for the GWR model was 1.63, compared with 2.57 for the resampled 3B42RT observation. Correspondingly, the mean absolute error (0.52) for the GWR model was lower than that for the resampled 3B42RT observation (0.78), with a relative mean absolute error of 1.01 compared to 1.52, respectively. The mean error for the GWR model was slightly higher than that for the resampled 3B42RT observation, with a value of 0.10 compared to −0.03, respectively.
Skill indices were used to assess the improvement in the accuracy of the GWR model compared to resampled 3B42RT data (Table 2). The precipitation estimation accuracy was significantly improved with the GWR model compared with the resampled 3B42RT data based on correlation coefficients and relative mean absolute error. The skill index of the correlation coefficient was 3.12 (0.35 of the relative mean absolute error).
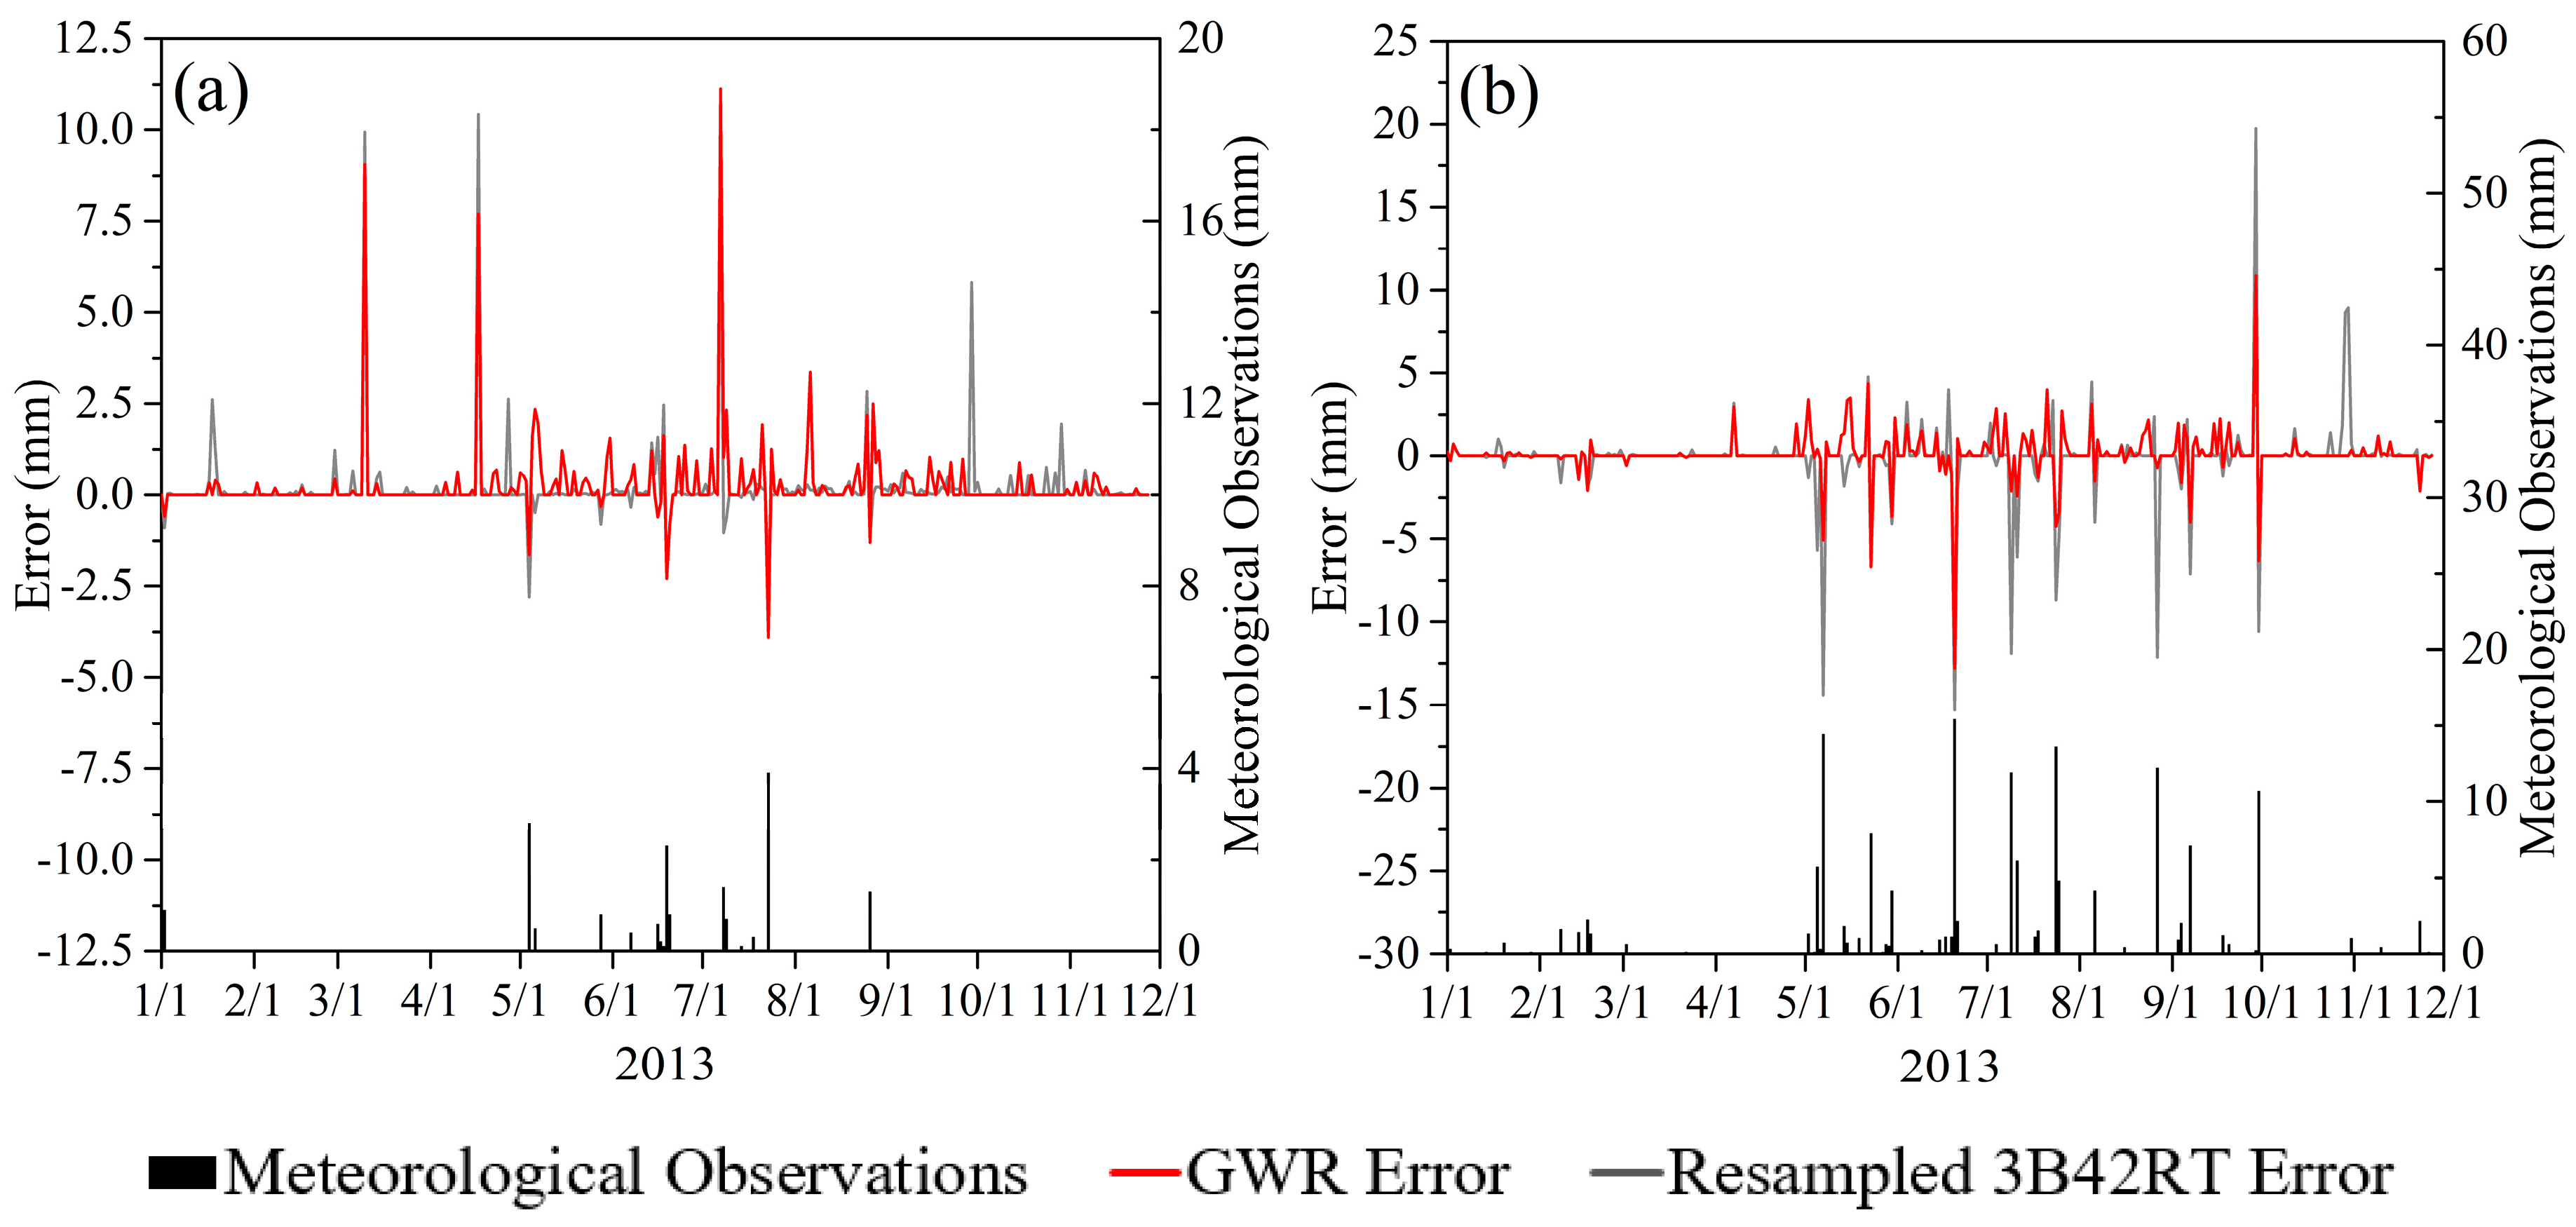
This study employed two randomly selected meteorological observation points (Xiaozaohuo (52707) and Dulan (52836)). A time series of the GWR results, 3B42RT data, and actual precipitation was extracted from January to November 2013 to evaluate the relationships between them, as shown in Figure 3.
Using resampled 3B42RT precipitation to reflect the spatial distribution did not improve the estimations, but precipitation estimated with the GWR model was well correlated with the ground-based measurements (Figure 3a). During months with the high rainfall (May–August), the 3B42RT observations were significantly lower than the actual precipitation (Figure 3b). However, during months with low rainfall (January–April and September–October), several main rainfall events observed by 3B42RT were not recorded through ground-based measurement. This indicates that the 3B42RT observations overestimated precipitation. The GWR precipitation estimates accounted for the underestimated precipitation observations during May–August, and the overestimated precipitation was corrected during January–April and September–October. The annual rainfall distribution estimated with the GWR model was consistent with ground observations, showing that rainfall was highest during summer. The GWR-estimated precipitation at Dulan was similar with the results at Xiaozaohuo, indicating the consistency of the results. The 3B42RT observations did not reflect actual rainfall events, whereas the GWR estimations were more consistent with the actual conditions, especially in September.
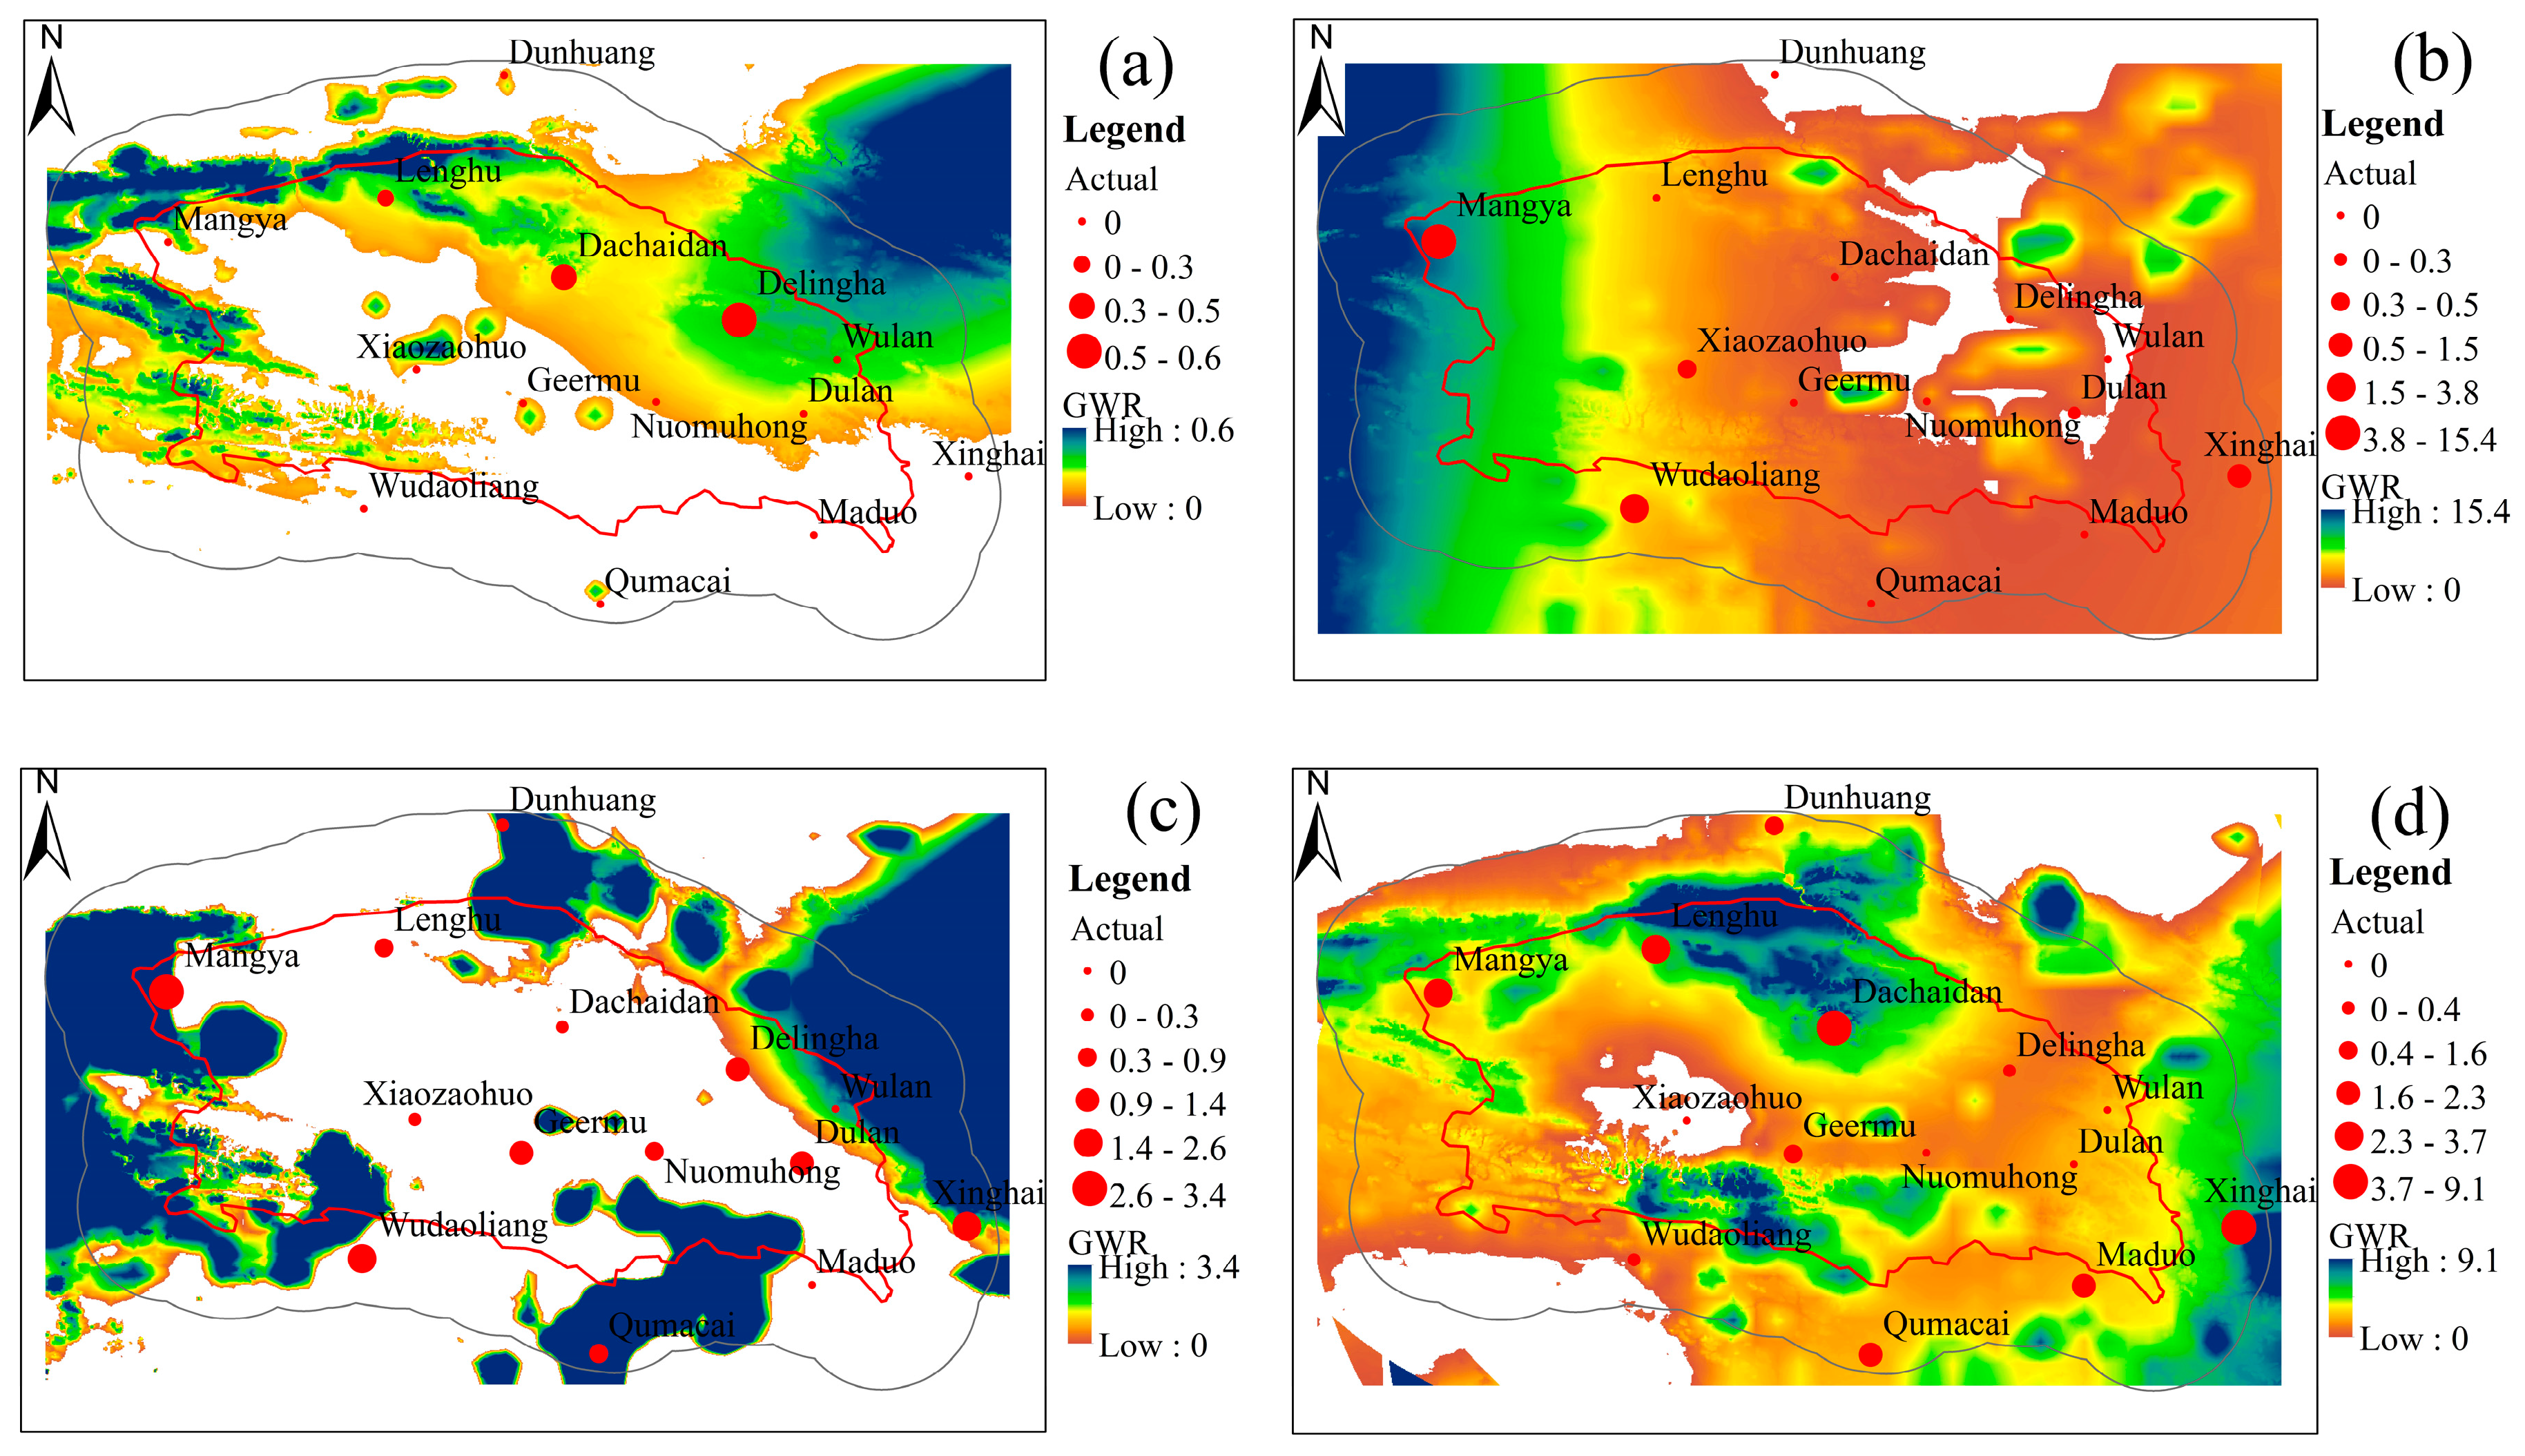
The typical dates with precipitation in spring, summer, autumn, and winter in 2013 were used to compare the GWR-estimated precipitation spatial distribution with the actual precipitation observed at meteorological sites (Figure 4).
In general, there was consistent correlation between the estimated and actual precipitation. In areas with more precipitation, the actual precipitation was also large, and vice-versa. The degree of correlation between the estimated and actual precipitation in the study area was better than that of the surrounding region. This was mainly due to the scarcity of meteorological sites in the surrounding region, which resulted in lower accuracy of GWR model (Figure 4b,c). Because of the difference between 3B42RT data and ground-based rainfall measurements in some regions, there were some discrepancies between the GWR results and actual precipitation.

4.2. Monthly Precipitation Distribution Estimations

Raw and resampled 3B42RT data and meteorological data extracted from all sites between January 2001 and October 2013 were used to analyze the corresponding relationships between the 3B42RT observations, GWR-estimated precipitation, and ground-based precipitation measurements. Figure 5 shows scatter plots of the raw (0.25° × 0.25°) and resampled 3B42RT data (1 km × 1 km), GWR estimated precipitation (1 km × 1 km), and ground-measured precipitation.
The scatter plots of raw and resampled 3B42RT vs. ground-measured precipitation were similar. The correlation between the 3B42RT data and meteorological observations was higher on a monthly scale than on a daily scale (Figure 5a,b). However, the distribution of scattered points between raw, resampled 3B42RT, and ground-measured precipitation showed a fan-shaped distribution and the correlation was low (Figure 5a,b). The correlation between GWR-estimated and ground-based precipitation measurements (Figure 5c) obviously improved compared with the raw and resampled 3B42RT data (Figure 5a,b). A convergence was obvious between the GWR-estimated and actual precipitation measurements (Figure 5c). These results indicate that the estimation accuracy for the GWR model significantly improved compared to the original and resampled 3B42RT data.
To evaluate the accuracy of raw and resampled 3B42RT data, the difference in accuracy among the GWR model results and resampled 3B42RT data was compared, as shown in Table 3.
The GWR model, which integrates satellite-based observations with precipitation observations and elevation information, produced more accurate monthly scale precipitation estimates than the resampled 3B42RT data. The correlation coefficient, root mean square error, mean error, and mean absolute error were all improved. The correlation coefficient between GWR-estimated precipitation and actual precipitation observations was 0.8910 (p ≤ 0.01), whereas that between the resampled 3B42RT data and actual precipitation observations was 0.5749 (p ≤ 0.01). The root mean square error for the GWR model was 12.47, compared with 23.10 for the resampled 3B42RT observation. The mean error and mean absolute error of the GWR-estimated precipitation were 0.38 and 6.83, respectively, both obviously higher than the corresponding values based on the resampled 3B42RT (−0.99 and 13.53, respectively). The mean absolute error of the GWR model was only half that of the original 3B42RT data.
Table 4 shows that the GWR model had higher precipitation estimation accuracy than the resampling 3B42RT method. The skill indices of the GWR model were all over 0. The skill index of the correlation coefficient was 0.55, indicating that the precipitation estimation accuracy of the GWR model was greater than that of the resampled 3B42RT data. The skill index of the mean absolute error was 0.49, indicating that the estimation error was also improved with the GWR model compared to the resampled 3B42RT data.
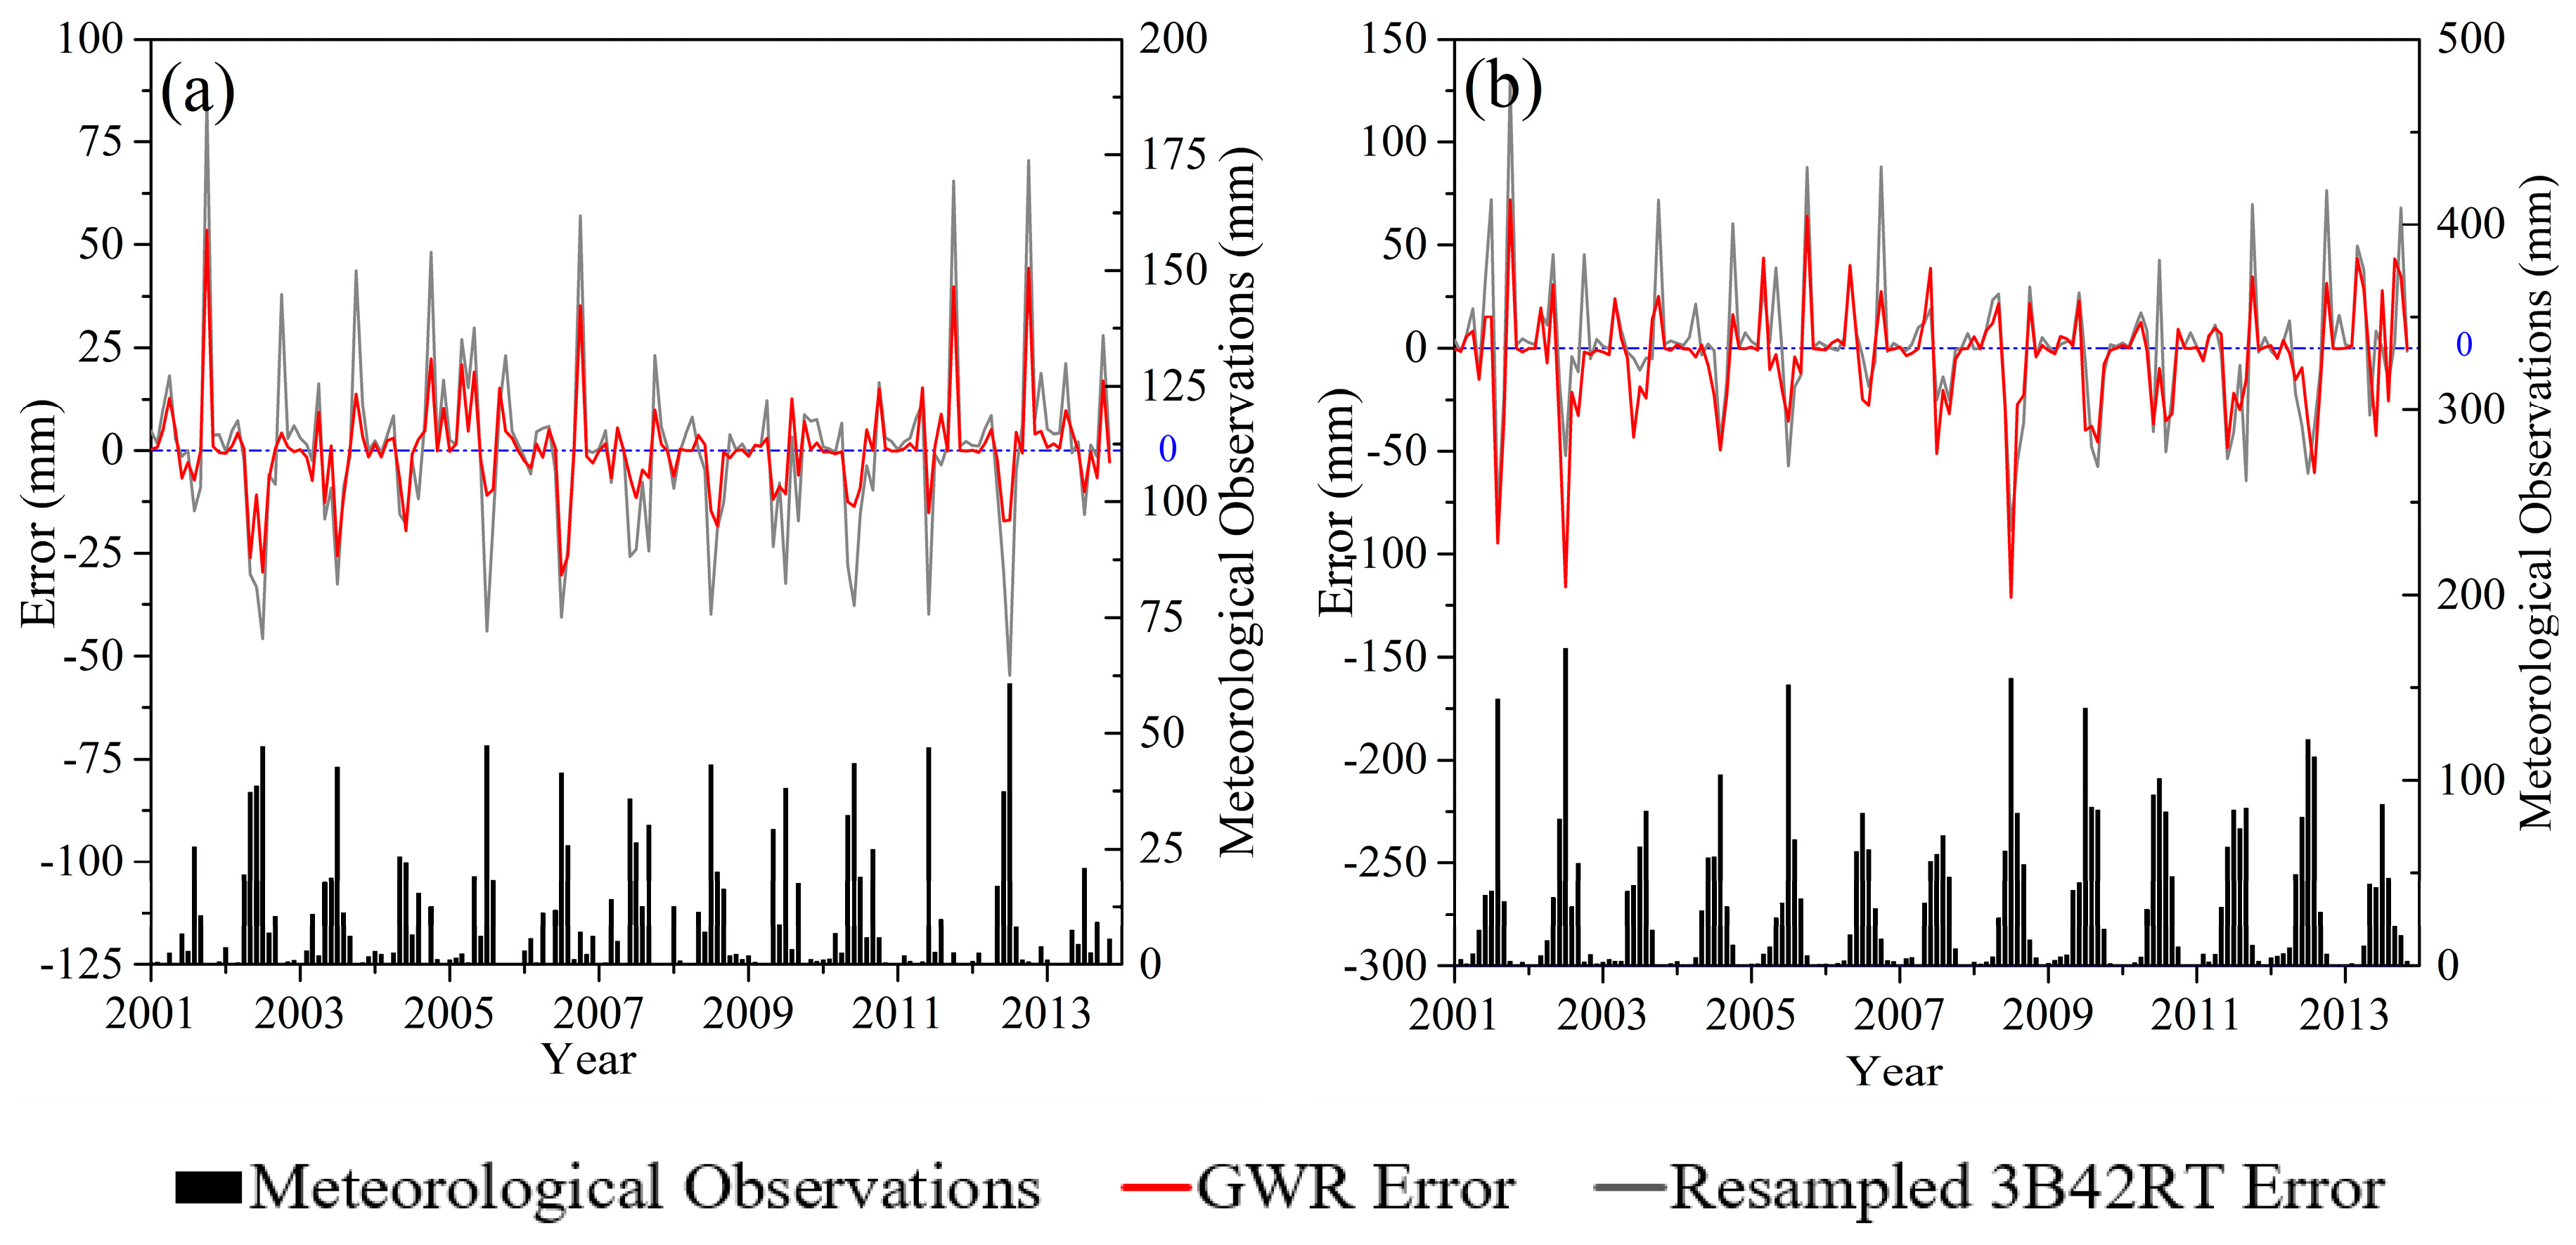
This study employed two randomly selected meteorological observation points (Dachaidan (52713) and Wudaoliang (52908)). A time series of the GWR results and actual precipitation was extracted from January 2001 to November 2013 to evaluate the relationship between them, as shown in Figure 6.
Based on the trends in the time series of the three precipitation values, the 3B42RT precipitation was generally lower than the ground-based precipitation observations. The difference between the 3B42RT data and actual precipitation varied over the years. The 3B42RT observations were generally higher than the ground-based measurements before 2007, and the difference between the two was greater than 10 mm in 2001, 2004, and 2006. During 2008–2010, the 3B42RT values were generally lower than the actual precipitation, with extreme values typically 20 mm lower than the actual precipitation. The difference between extreme 3B42RT and actual observation values during 2011–2013 was the same as that before 2008.
The difference between GWR-estimated and actual precipitation was lower that between the 3B42RT data and actual precipitation. The 3B42RT data overestimated precipitation before 2008, whereas the GWR model results were better correlated with the actual precipitation. Moreover, the 3B42RT data underestimated precipitation during 2008–2010, but this was accounted for in the GWR model, and the 3B42RT-derived precipitation accuracy was effectively improved during this period. The precipitation estimation accuracy during 2011–2013 was similar to that before 2008. The GWR-estimated precipitation values were more accurate compared with the 3B42RT data.
The accuracy of precipitations estimates made by the GWR model at Wudaoliang was less than that at Dachaidan. This may be because the difference between the 3B42RT observations and actual precipitation was reduced at Wudaoliang compared to Dachaidan. Precipitation was neither over or underestimated at Wudaoliang during the study period from January 2001 to November 2013. A good relationship existed between the 3B42RT and actual precipitation data at this site. In spite of this, the relationship between the GWR results and actual precipitation was improved, whereas that with the resampled 3B42RT data did not change. The correlation between GWR-estimated and actual precipitation was obviously improved compared with the original 3B42RT data.
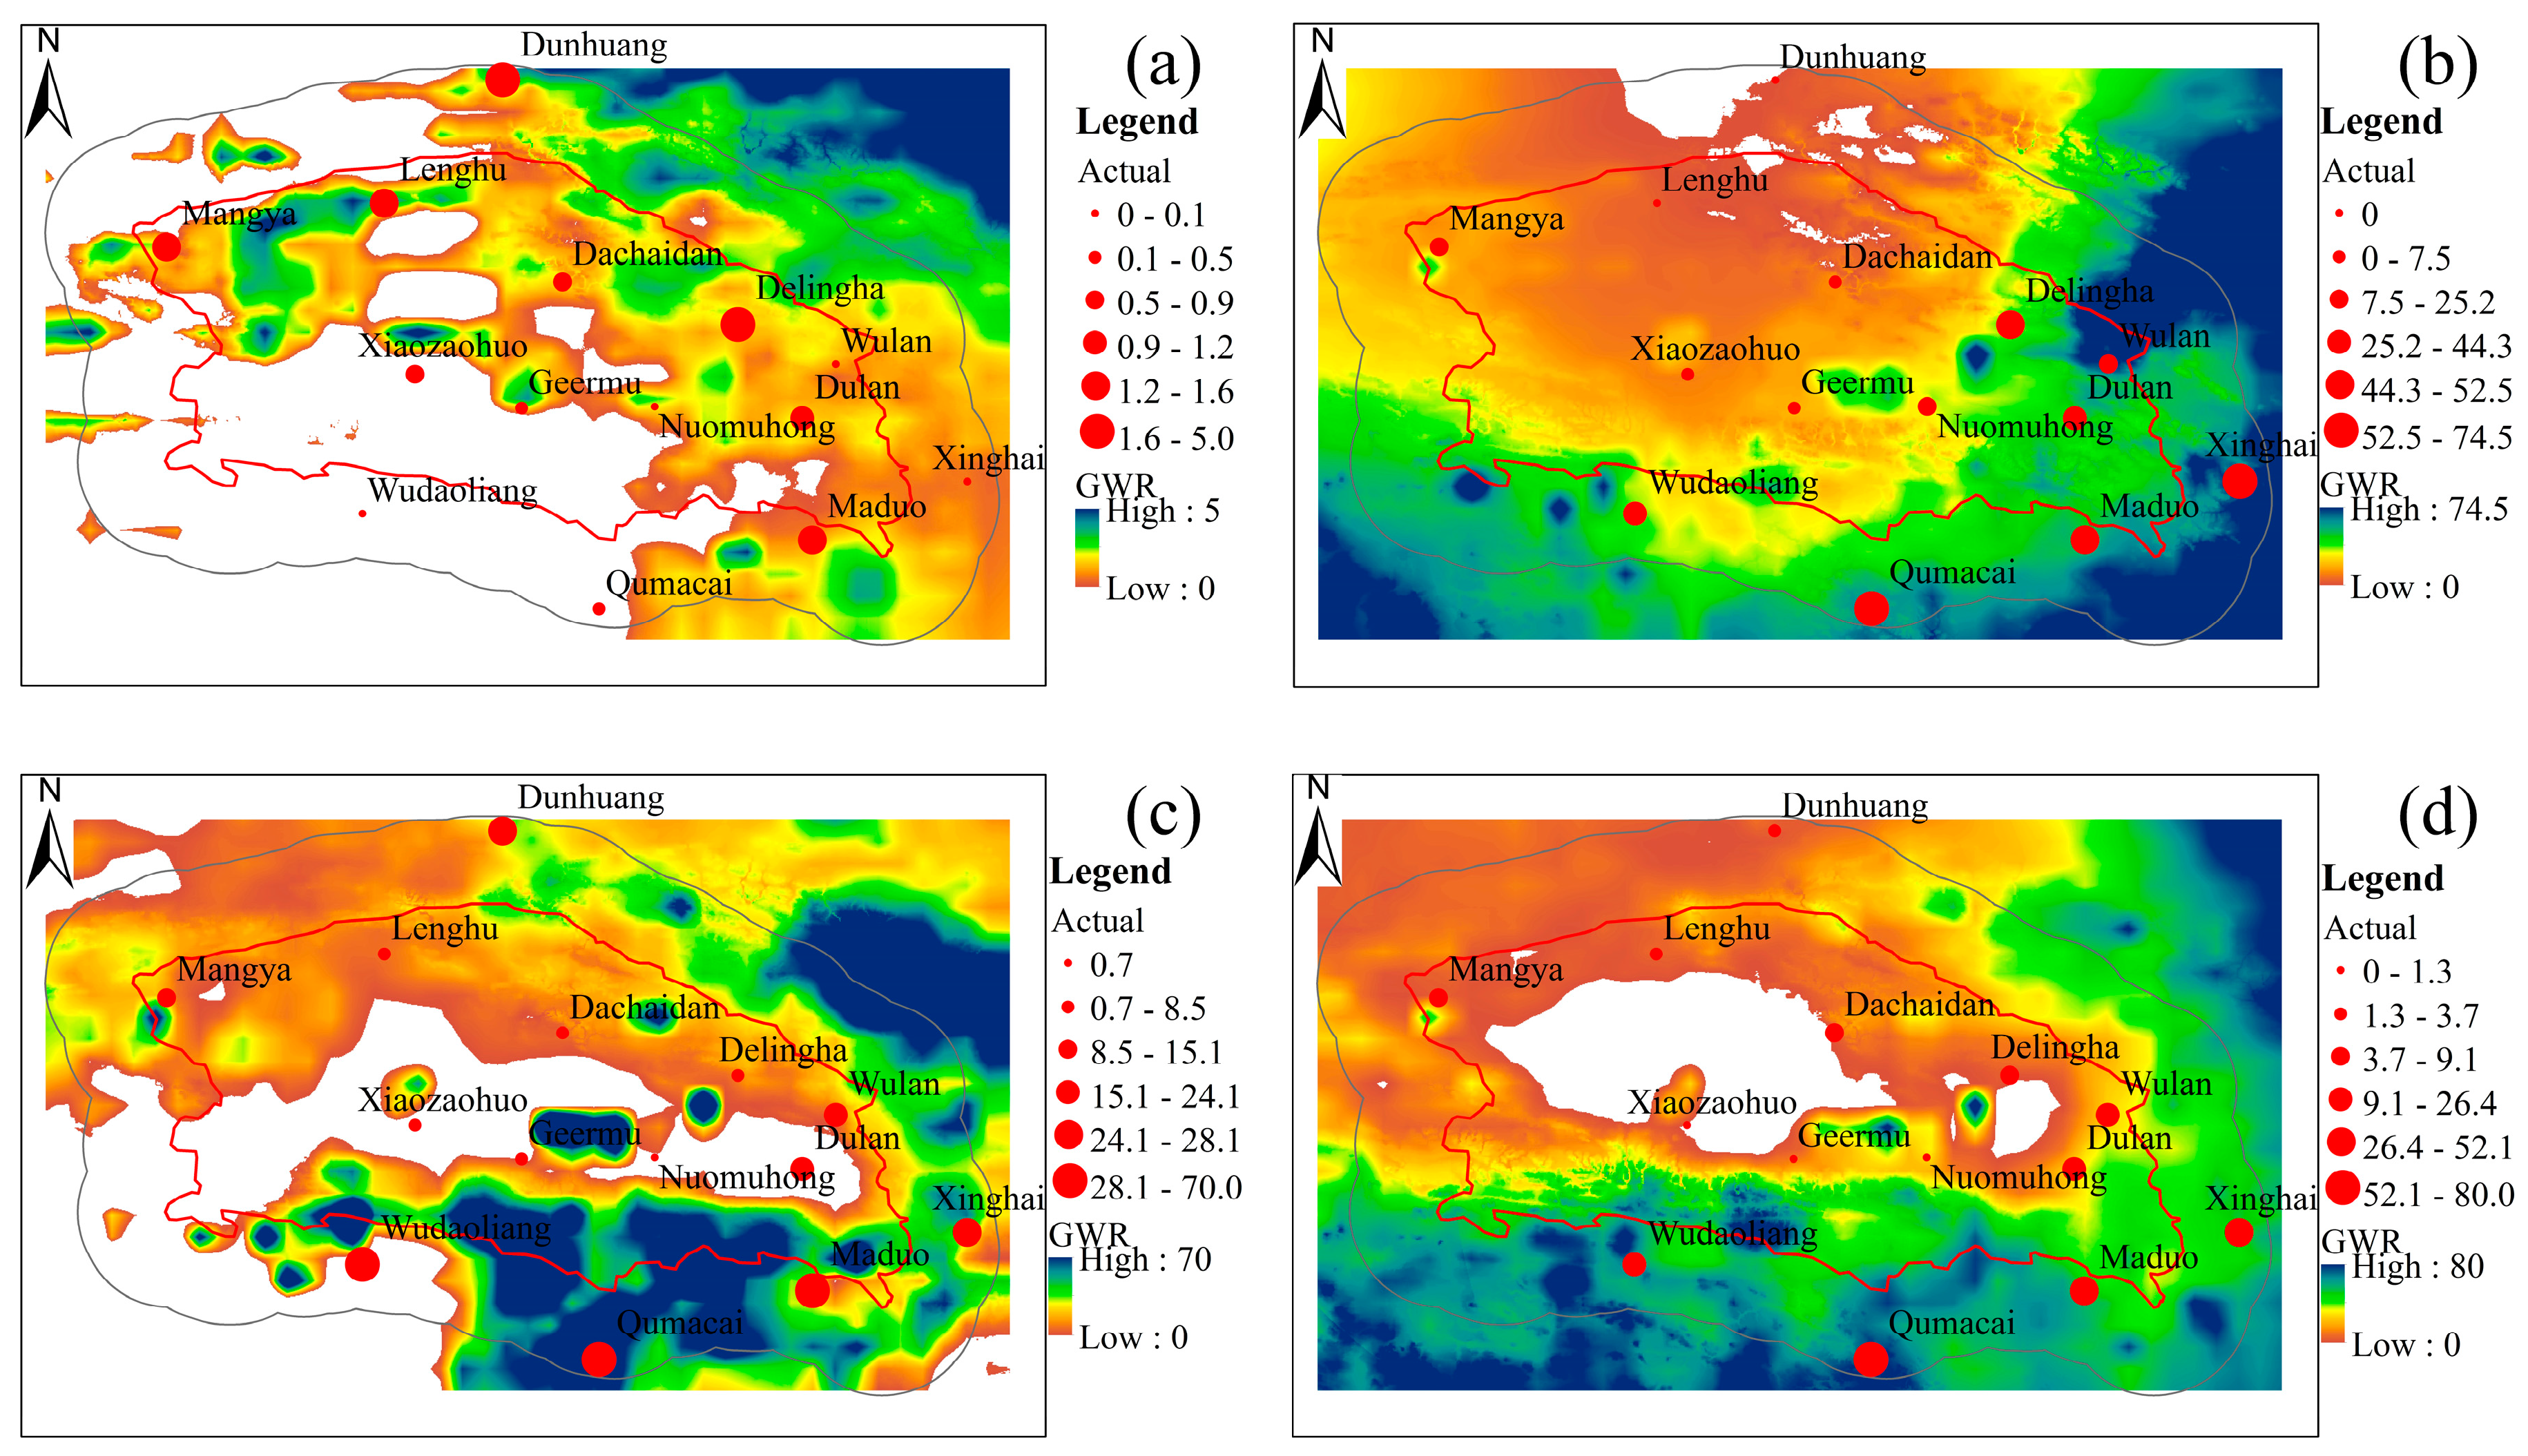
Typical months were selected in spring, summer, autumn, and winter to evaluate the corresponding relationship between the monthly GWR model results and actual precipitation measurements (Figure 7). The spatial precipitation distribution was accurately estimated by the GWR model, which integrated satellite-based precipitation observations and ground-based rainfall measurements. The GWR-estimated spatial precipitation distribution was consistent with the actual rainfall distribution. Compared with the daily GWR results, the correlation between the actual monthly rainfall and monthly GWR results was better than that between the daily GWR results and daily rainfall observations (Figure 4). The precipitation distribution characteristic determined by the GWR model in study area showed that the rainfall in the central Qaidam Basin was lower than that in the eastern and southern areas of the basin (Figure 7b,d). High-value pixels in the 3B42RT data differed from those in the surrounding region, which may have affected the accuracy of the GWR model (Figure 7a,c). Due to the lack of ground meteorological sites, it was difficult to inspect and correct the 3B42RT values. In the future, other data sources should be integrated into the GWR model to improve the precipitation spatial estimation results.

5. Discussion

GWR is a robust algorithm that has been successfully used in spatial rainfall analyses. GWR can theoretically integrate geographical location, altitude, and other factors for spatial rainfall estimations, and reflects the non-stationary spatial relationship between these factors and rainfall. Compared with other traditional precipitation merging models, GWR not only has higher precision, but it can also easily explain the spatial distribution characteristics of precipitation. GWR is based on kernel regression and local smoothing. It relates the spatial autocorrelation of precipitation and the non-stationary spatial relationship between these factors and rainfall to achieve the final precipitation distribution.
As found in our research, the ground-based and satellite-based GWR model improved the correlation between in-situ rainfall observations and remotely sensed rainfall measurements in the Qaidam Basin. However, rainfall varies among different climatic regions, and GWR applications require further study in other arid or desert regions. Although the precipitation merging GWR model improved the precipitation estimation accuracy, it has non-uniform and local difference characteristics. The GWR model accuracy differed at various locations, as shown by the temporal and spatial validation results. Further research and development of the GWR model is currently being conducted.
Furthermore, there are too few rain gauge stations in the study area to achieve high-quality daily rainfall estimations. Hu (2013) used GWR to investigate the effect of station network density on the GWR precipitation model in the Ganjiang River Basin. There is no doubt that the local accuracy of the GWR precipitation model is higher in study areas with more intensive rain gauge station networks. When the ground gauge density is lower than ~1300 km2 per gauge, the estimation accuracy varies dramatically with gauge number; whereas, if the density is above ~380 km2 per gauge, the accuracy is insensitive to gauge numbers variation. When the gauge network density is below ~2500 km2 per gauge, the accuracy of spatial precipitation estimations obtained by data merging is gradually improved compared to those obtained by traditional interpolation methods based on only ground observations [47].
The Qaidam Basin is 800 km long from east to west, 300 km wide from north to south, and has an area of 257,768 km2. Along with weather stations in the buffer zone, the gauge network density in the Qaidam Basin is about 18,412 km2 per gauge, far below 2500 km2 per gauge. The sparse gauge network density had a great impact on the accuracy of the GWR model. However, in this case, the accuracy of the spatial precipitation estimation obtained by data merging may be greater than that obtained by traditional interpolation methods based on only ground observations.

6. Conclusions

A GWR model was developed to derive rainfall distribution estimations from ground-based and satellite-based rainfall measurements. Prior to this study, the 3B42RT product accuracy of daily and monthly scale rainfall data has been evaluated based on rain gauge measurements. The accuracy of the GWR model was validated.
Both daily and monthly 3B42RT productions may contain errors compared to in-situ rainfall observations. The accuracy of the monthly 3B42RT products was slightly higher than that of the daily scale products. The ground-based and satellite-based GWR model improved the correlation between in-situ rainfall observations and remotely sensed rainfall measurements in the Qaidam Basin. The correlation coefficients between GWR estimated precipitation and in-situ rainfall observations at daily and monthly scales were 0.6538 and 0.8910, with root mean square errors of 1.63 and 12.47, respectively. The GWR model accounted for the error in the 3B42RT rainfall products.
Temporally, the annual seasonal rainfall distribution derived from the GWR model was generally consistent with the actual rainfall distribution, although the accuracy varied among sites. Spatially, the monthly rainfall estimation accuracy of the GWR model was higher than that of the daily scale results. However, the GWR model accuracy differed among locations due to error in the 3B42RT data.
The GWR model integrates ground-based and satellite-based measurements, and thus is applicable in the Qaidam Basin, in which there is a sparse network of rainfall gauges. The model results with a 1-km spatial resolution can achieve precipitation assessments in remote areas, which is valuable for spatial simulations of hydrological conditions and climate change.
Further research and development of the GWR model is currently being conducted. The current model merges ground-based rainfall observations, 3B42RT rainfall products, altitude, and geographical location information. A model that combines surface observations, 3B42RT and elevation data, and other observed precipitation data (e.g., the impact of radar and land cover types) will help to further improve the accuracy of precipitation distribution estimations. Estimations made by the GWR model over various time scales also need to be further studied. In this study, the accuracy of the GWR model was validated through the cross validation method and randomly selected meteorological sites. A more comprehensive validation method should be investigated to ensure the effectiveness of rainfall estimations. The PRISM dataset was shown to be an accurate representation of spatial climate patterns. Further research and validation of the GWR model should include comparisons with PRISM to investigate its suitability for different regions and time scales. In addition, our GWR rainfall model did not take the temporal correlation of rainfall into account. Spatial–temporal interpolation/modeling (the ensemble Kalman filtering, fixed rank filtering, etc.) will be applied to the Qaidam Basin in future research.

Acknowledgments

This work was supported by the Important Science & Technology Specific Projects of Qinghai Province (2014-NK-A4-1) and the National Natural Science Foundation of China (41501556). The authors would like to thank Ruijing Jia for her helpful editorial work, and the reviewers of the manuscript for their helpful comments. We are also grateful to the NASA Goddard Space Flight Center, Mesoscale Atmospheric Processes Laboratory, and China Meteorological Data Sharing Service System for providing the 3B42RT and meteorological data used in our research.

Author Contributions

Lei Zhou carried out the research under the guidance of Aifeng Lv. Both authors contributed to the preparation of the paper through their review, editing and comments.

Conflicts of Interest

The authors declare that there are no conflicts of interest.

References

  1. Woldemeskel, F.M.; Sivakumar, B.; Sharma, A. Merging gauge and satellite rainfall with specification of associated uncertainty across Australia. J. Hydrol. 2013, 499, 167–176. [Google Scholar] [CrossRef]
  2. Tarpanelli, A.; Franchini, M.; Brocca, L.; Camici, S.; Melone, F.; Moramarco, T. A simple approach for stochastic generation of spatial rainfall patterns. J. Hydrol. 2012, 472–473, 63–76. [Google Scholar] [CrossRef]
  3. Ma, X.; He, Y.; Xu, J.; van Noordwijk, M.; Lu, X. Spatial and temporal variation in rainfall erosivity in a Himalayan watershed. CATENA 2014, 121, 248–259. [Google Scholar] [CrossRef]
  4. Chappell, A.; Renzullo, L.J.; Raupach, T.H.; Haylock, M. Evaluating geostatistical methods of blending satellite and gauge data to estimate near real-time daily rainfall for Australia. J. Hydrol. 2013, 493, 105–114. [Google Scholar] [CrossRef]
  5. Ren, Z.; Li, M. Errors and correction of precipitation measurements in China. Adv. Atmos. Sci. 2007, 24, 449–458. [Google Scholar] [CrossRef]
  6. Tan, M.L.; Ibrahim, A.L.; Duan, Z.; Cacknell, A.P.; Chaplot, V. Evaluation of six high-resolution satellite and ground-based precipitation products over Malaysia. Remote Sens. 2015, 7, 1504–1528. [Google Scholar] [CrossRef]
  7. Qin, Y.; Chen, Z.; Shen, Y.; Zhang, S.; Shi, R. Evaluation of satellite rainfall estimates over the Chinese Mainland. Remote Sens. 2014, 6, 11649–11672. [Google Scholar] [CrossRef]
  8. Krakauer, N.; Pradhanang, S.; Lakhankar, T.; Jha, A. Evaluating satellite products for precipitation estimation in mountain regions: A case study for nepal. Remote Sens. 2013, 5, 4107–4123. [Google Scholar] [CrossRef]
  9. Guo, H.; Chen, S.; Bao, A.; Hu, J.; Gebregiorgis, A.; Xue, X.; Zhang, X. Inter-comparison of high-resolution satellite precipitation products over Central Asia. Remote Sens. 2015, 7, 7181–7211. [Google Scholar] [CrossRef]
  10. Gebere, S.; Alamirew, T.; Merkel, B.; Melesse, A. Performance of high resolution satellite rainfall products over data scarce parts of Eastern Ethiopia. Remote Sens. 2015, 7, 11639–11663. [Google Scholar] [CrossRef]
  11. Gebremichael, M.; Anagnostou, E.N.; Bitew, M.M. Critical steps for continuing advancement of satellite rainfall applications for surface hydrology in the Nile River Basin. J. Am. Water Resour. Assoc. 2010, 46, 361–366. [Google Scholar] [CrossRef]
  12. Jeniffer, K.; Su, Z.; Woldai, T.; Maathuis, B. Estimation of spatial–temporal rainfall distribution using remote sensing techniques: A case study of Makanya catchment, Tanzania. Int. J. Appl. Earth Obs. Geoinf. 2010, 12, S90–S99. [Google Scholar] [CrossRef]
  13. Chen, C.; Yu, Z.; Li, L.; Yang, C. Adaptability evaluation of TRMM satellite rainfall and its application in the Dongjiang River Basin. Procedia Environ. Sci. 2011, 10, 396–402. [Google Scholar] [CrossRef]
  14. Pombo, S.; de Oliveira, R.P. Evaluation of extreme precipitation estimates from TRMM in Angola. J. Hydrol. 2015, 523, 663–679. [Google Scholar] [CrossRef]
  15. Yaduvanshi, A.; Srivastava, P.K.; Pandey, A.C. Integrating TRMM and MODIS satellite with socio-economic vulnerability for monitoring drought risk over a tropical region of India. Phys. Chem. Earth 2015, 83–84, 14–27. [Google Scholar] [CrossRef]
  16. Xue, X.; Hong, Y.; Limaye, A.S.; Gourley, J.J.; Huffman, G.J.; Khan, S.I.; Dorji, C.; Chen, S. Statistical and hydrological evaluation of TRMM-based multi-satellite precipitation analysis over the Wangchu Basin of Bhutan: Are the latest satellite precipitation products 3B42V7 ready for use in ungauged basins? J. Hydrol. 2013, 499, 91–99. [Google Scholar] [CrossRef]
  17. Precipitation Measurement Missions. Available online: http://pmm.nasa.gov/TRMM/mission-overview (accessed on 22 October 2015).
  18. Liu, Z. Comparison of precipitation estimates between version 7 3-hourly TRMM Multi-satellite Precipitation Analysis (TMPA) near-real-time and research products. Atmos. Res. 2015, 153, 119–133. [Google Scholar] [CrossRef]
  19. Liu, Z. Comparison of versions 6 and 7 3-hourly TRMM Multi-satellite Precipitation Analysis (TMPA) research products. Atmos. Res. 2015, 163, 91–101. [Google Scholar] [CrossRef]
  20. Sahoo, A.K.; Sheffield, J.; Pan, M.; Wood, E.F. Evaluation of the tropical rainfall measuring mission multi-satellite precipitation analysis (TMPA) for assessment of large-scale meteorological drought. Remote Sens. Environ. 2015, 159, 181–193. [Google Scholar] [CrossRef]
  21. Shrivastava, R.; Dash, S.K.; Hegde, M.N.; Pradeepkumar, K.S.; Sharma, D.N. Validation of the TRMM Multi Satellite Rainfall Product 3B42 and estimation of scavenging coefficients for 131I and 137Cs using TRMM 3B42 rainfall data. J. Environ. Radioact. 2014, 138, 132–136. [Google Scholar] [CrossRef] [PubMed]
  22. Mantas, V.M.; Liu, Z.; Caro, C.; Pereira, A.J.S.C. Validation of TRMM Multi-satellite Precipitation Analysis (TMPA) products in the Peruvian Andes. Atmos. Res. 2015, 163, 132–145. [Google Scholar] [CrossRef]
  23. Schellart, A.N.A.; Shepherd, W.J.; Saul, A.J. Influence of rainfall estimation error and spatial variability on sewer flow prediction at a small urban scale. Adv. Water Resour. 2012, 45, 65–75. [Google Scholar] [CrossRef]
  24. Brunsdon, C.; McClatchey, J.; Unwin, D.J. Spatial variations in the average rainfall–altitude relationship in Great Britain: An approach using geographically weighted regression. Int. J. Climatol. 2001, 21, 455–466. [Google Scholar] [CrossRef]
  25. Emmanuel, I.; Andrieu, H.; Leblois, E.; Janey, N.; Payrastre, O. Influence of rainfall spatial variability on rainfall-runoff modelling: Benefit of a simulation approach? J. Hydrol. 2015, 531, 337–348. [Google Scholar] [CrossRef]
  26. Arnaud, P.; Bouvier, C.; Cisneros, L.; Dominguez, R. Influence of rainfall spatial variability on flood prediction. J. Hydrol. 2002, 260, 216–230. [Google Scholar] [CrossRef]
  27. Xu, S.; Wu, C.; Wang, L.; Gonsamo, A.; Shen, Y.; Niu, Z. A new satellite-based monthly precipitation downscaling algorithm with non-stationary relationship between precipitation and land surface characteristics. Remote Sens. Environ. 2015, 162, 119–140. [Google Scholar] [CrossRef]
  28. Gairola, R.M.; Prakash, S.; Pal, P.K. Improved rainfall estimation over the Indian monsoon region by synergistic use of Kalpana-1 and rain gauge data. Atmósfera 2015, 28, 51–61. [Google Scholar] [CrossRef]
  29. Jha, S.K.; Zhao, H.; Woldemeskel, F.M.; Sivakumar, B. Network theory and spatial rainfall connections: An interpretation. J. Hydrol. 2015, 527, 13–19. [Google Scholar] [CrossRef]
  30. Muzylo, A.; Llorens, P.; Valente, F.; Keizer, J.J.; Domingo, F.; Gash, J.H.C. A review of rainfall interception modelling. J. Hydrol. 2009, 370, 191–206. [Google Scholar] [CrossRef]
  31. Nikolopoulos, E.I.; Borga, M.; Creutin, J.D.; Marra, F. Estimation of debris flow triggering rainfall: Influence of rain gauge density and interpolation methods. Geomorphology 2015, 243, 40–50. [Google Scholar] [CrossRef]
  32. Di Piazza, A.; Conti, F.L.; Noto, L.V.; Viola, F.; la Loggia, G. Comparative analysis of different techniques for spatial interpolation of rainfall data to create a serially complete monthly time series of precipitation for Sicily, Italy. Int. J. Appl. Earth Obs. Geoinf. 2011, 13, 396–408. [Google Scholar] [CrossRef]
  33. De Coning, E. Optimizing satellite-based precipitation estimation for nowcasting of rainfall and flash flood events over the South African domain. Remote Sens. 2013, 5, 5702–5724. [Google Scholar] [CrossRef]
  34. Daly, C.; Halbleib, M.; Smith, J.I.; Gibson, W.P.; Doggett, M.K.; Taylor, G.H.; Curtis, J.; Pasteris, P.P. Physiographically sensitive mapping of climatological temperature and precipitation across the conterminous United States. Int. J. Climatol. 2008, 28, 2031–2064. [Google Scholar] [CrossRef]
  35. Huffman, G.J.; Bolvin, D.T.; Nelkin, E.J.; Wolff, D.B.; Adler, R.F.; Gu, G.; Hong, Y.; Bowman, K.P.; Stocker, E.F. The TRMM Multisatellite Precipitation Analysis (TMPA): Quasi-global, multiyear, combined-sensor precipitation estimates at fine scales. J. Hydrometeorol. 2007, 8, 38–55. [Google Scholar] [CrossRef]
  36. Kidd, C.; Huffman, G. Global precipitation measurement. Meteorol. Appl. 2011, 18, 334–353. [Google Scholar] [CrossRef]
  37. Kidd, C.; Levizzani, V. Status of satellite precipitation retrievals. Hydrol. Earth Syst. Sci. 2011, 15, 1109–1116. [Google Scholar] [CrossRef]
  38. Lazri, M.; Ameur, S.; Mohia, Y. Instantaneous rainfall estimation using neural network from multispectral observations of SEVIRI radiometer and its application in estimation of daily and monthly rainfall. Adv. Space Res. 2014, 53, 138–155. [Google Scholar] [CrossRef]
  39. Xu, W.; Adler, R.F.; Wang, N.-Y. Combining satellite infrared and lightning information to estimate warm-season convective and stratiform rainfall. J. Appl. Meteorol. Climatol. 2014, 53, 180–199. [Google Scholar] [CrossRef]
  40. Dinku, T.; Alessandrini, S.; Evangelisti, M.; Rojas, O. A description and evaluation of FAO satellite rainfall estimation algorithm. Atmos. Res. 2015, 163, 48–60. [Google Scholar] [CrossRef]
  41. Sasaki, Y. Some basic formulas in numerical variation analysis. Mon. Weather Rev. 1970, 98, 875–883. [Google Scholar] [CrossRef]
  42. Ninomiya, K.; Akiyama, T. Objective analysis of heavy rainfalls based on radar and gauge measurement. J. Meteorol. Soc. Jpn. 1978, 50, 206–210. [Google Scholar]
  43. Rabiei, E.; Haberlandt, U. Applying bias correction for merging rain gauge and radar data. J. Hydrol. 2015, 522, 544–557. [Google Scholar] [CrossRef]
  44. Berndt, C.; Rabiei, E.; Haberlandt, U. Geostatistical merging of rain gauge and radar data for high temporal resolutions and various station density scenarios. J. Hydrol. 2014, 508, 88–101. [Google Scholar] [CrossRef]
  45. Seo, D.J. Real-time estimation of rainfall fields using radar rainfall and rain gage data. J. Hydrol. 1998, 208, 37–52. [Google Scholar] [CrossRef]
  46. Li, M.; Shao, Q. An improved statistical approach to merge satellite rainfall estimates and raingauge data. J. Hydrol. 2010, 385, 51–64. [Google Scholar] [CrossRef]
  47. Hu, Q. Rainfall Spatial Estimation Using Multi-Source Information and Its Hydrological Application; Tsinghua University: Beijing, China, 2013. (In Chinese) [Google Scholar]
  48. Kamarianakis, Y.; Feidas, H.; Kokolatos, G.; Chrysoulakis, N.; Karatzias, V. Evaluating remotely sensed rainfall estimates using nonlinear mixed models and geographically weighted regression. Environ. Model. Softw. 2008, 23, 1438–1447. [Google Scholar] [CrossRef]
  49. China Meteorological Data Network. Available online: http://data.cma.cn (accessed on 27 August 2015).
  50. Science Data Center for Cold and Arid Region. Available online: http://westdc.westgis.ac.cn (accessed on 22 October 2015).
Figure 1. Study area.
Remotesensing 08 00311 g001
Figure 2. Scatter plots between raw 3B42RT and ground-measured precipitation (a); resampled 3B42RT and ground-measured precipitation (b); and GWR-estimated and ground-measured precipitation (c) on a daily scale.
Remotesensing 08 00311 g002
Figure 3. Estimated precipitation errors by GWR and resampled 3B42RT vs. ground-based Observations at: Xiaozaohuo (a); and Dulan (b).
Remotesensing 08 00311 g003
Figure 4. GWR-estimated daily precipitation spatial distribution in study area on: 22 January (a); 6 May (b); 17 June (c); and 17 September (d) 2013.
Remotesensing 08 00311 g004
Figure 5. Scatter plots between raw 3B42RT and ground-measured precipitation (a); resampled 3B42RT and ground-measured precipitation (b); and GWR-estimated and ground-measured precipitation (c) on a monthly scale.
Remotesensing 08 00311 g005
Figure 6. Estimated precipitation errors for the GWR and resampled 3B42RT vs. ground-based observations at: (a) Dachaidan; and (b) Wudaoliang.
Remotesensing 08 00311 g006
Figure 7. GWR-estimated monthly spatial precipitation distribution in study area in January (a); May (b); June (c); and September (d) 2013.
Remotesensing 08 00311 g007
Table 1. Precipitation estimation accuracy.
Evaluation MethodCorrelation CoefficientRMSEMean ErrorRelative Mean ErrorMean Absolute ErrorRelative Mean Absolute Error
3B42RT0.1587 **2.57−0.03−0.060.781.52
GWR0.6538 **1.630.100.190.521.01
** 0.01 significance level; RMSE, Root Mean Square Error.
Table 2. Estimation accuracy of precipitation distribution estimated with GWR compared with resampled 3B42RT data.
Skill Indices S I r S I M A E
Value3.120.35
Table 3. Precipitation distribution estimation accuracy of the GWR model.
Evaluation MethodCorrelation CoefficientRMSEMean ErrorRelative Mean ErrorMean Absolute ErrorRelative Mean Absolute Error
3B42RT0.5749 **23.10−0.99−0.0613.530.87
GWR0.8910 **12.470.380.026.830.44
** 0.01 significance level; RMSE represent Root Mean Square Error.
Table 4. Skill index of the GWR model compared to the original 3B42RT data.
Skill Indices S I r S I M A E
Value0.550.49

