Article

The Impact of Forest Density on Forest Height Inversion Modeling from Polarimetric InSAR Data

School of Geosciences and Info-Physics, Central South University, Changsha 410083, China
*
Author to whom correspondence should be addressed.
Remote Sens. 2016, 8(4), 291; https://doi.org/10.3390/rs8040291
Submission received: 14 December 2015 / Revised: 14 March 2016 / Accepted: 21 March 2016 / Published: 29 March 2016
(This article belongs to the Special Issue Remote Sensing of Vegetation Structure and Dynamics)

Abstract

:
Forest height is of great significance in analyzing the carbon cycle on a global or a local scale and in reconstructing the accurate forest underlying terrain. Major algorithms for estimating forest height, such as the three-stage inversion process, are depending on the random-volume-over-ground (RVoG) model. However, the RVoG model is characterized by a lot of parameters, which influence its applicability in forest height retrieval. Forest density, as an important biophysical parameter, is one of those main influencing factors. However, its influence to the RVoG model has been ignored in relating researches. For this paper, we study the applicability of the RVoG model in forest height retrieval with different forest densities, using the simulated and real Polarimetric Interferometric SAR data. P-band ESAR datasets of the European Space Agency (ESA) BioSAR 2008 campaign were selected for experiments. The test site was located in Krycklan River catchment in Northern Sweden. The experimental results show that the forest density clearly affects the inversion accuracy of forest height and ground phase. For the four selected forest stands, with the density increasing from 633 to 1827 stems/Ha, the RMSEs of inversion decrease from 4.6 m to 3.1 m. The RVoG model is not quite applicable for forest height retrieval especially in sparsely vegetated areas. We conclude that the forest stand density is positively related to the estimation accuracy of the ground phase, but negatively correlates to the ground-to-volume scattering ratio.

Graphical Abstract

1. Introduction

Forest height, as one part of the vertical structure information, is an important element to the quantitative analysis of the carbon cycle on a global or local scale. It is also helpful to reconstruct the accurate forest underlying terrain from the digital surface model (DSM) [1]. Originated from SAR technology, Polarimetric SAR interferometry (PolInSAR), is an all-time, all-weather, and strongly penetrative means of forest height obtaining. In addition, by combining polarimetric and interference information, PolInSAR is not only sensitive to the height and motion of scatterers, but also to structure, direction, texture, and dielectric constant of scatterers [2,3,4,5]. Compared with single channel Interferometric SAR (InSAR), we can separate volume scattering from surface scattering by using information from different coherence channels. This is one of the main advantages of PolInSAR and the key to estimate forest height. To retrieve forest height from the PolInSAR data, it is necessary to establish a scattering model that can combine forest biophysical parameters with the PolInSAR data. In 1996, the random-volume-over-ground (RVoG) model was firstly utilized to relate the forest biophysical parameters to the InSAR data [6,7,8]. Now it has become a widely used vegetation scattering model to retrieve forest height from PolInSAR data [9,10,11,12,13,14,15,16,17]. The RVoG model depicts the scattering process of forest scene as a random volume over ground [9]. In the past few years, this model has been developed to improve the accuracy of forest height inversion, such as the RVoG + TD model considering temporal decorrelation [18,19,20,21,22], the RVoG+CFF model [23] considering canopy-fill-factor, and the S-RVoG model [24,25] considering the slope of topography.
The RVoG model is characterized by having many independent physical parameters including parameters of SAR system and factors of the forest. Any change of these parameters will influence the results of forest height retrieval, which reflect the applicability of the RVoG model in forest height inversion [9]. Forest density, as a biophysical parameter of vegetation, is important to the RVoG model and forest height retrieval. Many researchers point out that the interferometric phase and coherence are sensitive to the vegetation height and density variations, which makes a challenge for forest parameters inversion [3,6,8,9]. Lavalle et al. [26] investigate the correlation of interferometric coherence with forest height, canopy density, and terrain slope. Garestier et al. [14] demonstrated that the performance of a pine forest height inversion with X-band HH and HV data was more dependent on the forest density than that at lower frequencies. However, the influence of forest density to the RVoG model on forest height inversion has not been studied systematically in current research. Here, we studied the impact of the forest density to the forest height inversion with the RVoG model from PolInSAR data.
At present, the six-dimension nonlinear iterative algorithm [9] and the three-stage inversion process [27] have been proposed to invert the RVoG model. The six-dimension nonlinear iterative algorithm brings heavy computation burden and difficulty in obtaining the initial parameters of forest height retrieval. Thus, the three-stage inversion process became the main method to retrieve forest height because of its steady result, strong applicability, and short calculation time.

2. The Random-Volume-Over-Ground (RVoG) Model and Three-Stage Height Inversion Method

The RVoG model simplifies the vegetation structure to be a two-layer structure including the canopy layer and ground layer. The canopy layer is considered as an isotropic medium, which means the attenuation process of electromagnetic wave can be expressed by the mean wave extinction that is constant. Without temporal de-correlation and signal-to-noise ratio (SNR) de-correlation, the complex interferometric coherence based on the RVoG model can be expressed as:
γ ( ω ) = e j ϕ 0 γ v + μ ( ω ) 1 + μ ( ω )
where the ground-to-volume scattering ratio μ ( ω ) is related to ω , a three-component unitary complex vector representing some kind of polarization state, ϕ 0 is the ground phase, and the volume coherence γ v based on RV model is a function of forest height h v and extinction σ , defined as
γ v = 0 h v e 2 σ z cos θ e j k z z d z 0 h v e 2 σ z cos θ d z
σ represents the mean wave extinction in the medium, θ is the incidence angle, and k z is the vertical wavenumber of the interferometer [9,27]. In the RVoG model, the vegetation structure function is to obey exponential distribution, defined as Equation (3):
f ( z ) = e 2 σ z cos θ
The three-stage height inversion method contains the following three key steps [27]:
Firstly, a total least square line fitting of the complex coherence with different polarizations in a complex plane: The optional complex coherence could be the linear polarizations (HH, HV, VH, and VV) or the Pauli-basis polarizations (HH+VV and HH−VV). In some cases, the coherence sets of the linear polarizations gather together. It is difficult to get a good fitted line. Therefore, some optimized coherence channels are good choices for improving the linearity of the coherence sets [28,29]. For example, the phase diversity (PD) coherence optimization can get two coherence values with maximum (PDH) and minimum (PDL) phases [29].
Secondly, the ground phase ϕ 0 estimation: There are two interactions between the fitted line and the unit circle of the complex plane. The ground phase is determined by the one closer to the polarization with more ground contributions, such as HH-VV or PDL.
Finally, the forest height estimation: It is determined by the coherence of volume scattering with highest phase center, such as HV or PDH. Then, a lookup table (LUT) is calculated, which contains the values of volume coherence with all possible mean extinction coefficients and forest heights. By minimizing the difference between the LUT and the volume coherence, we can get the solution of the mean extinction coefficient and forest height. The forest height can be calculated by using this solution and the estimated ground phase.

3. The Simulated Datasets and Real P-Band E-SAR Data

3.1. The Simulated Datasets

A set of forest stands was simulated with PolSARpro simulator provided by ESA for free [30]. The simulator could provide polarimetric interferometric SAR datasets with a high level of realism. The main parameters of the simulated data are shown in Table 1. In this experiment, the tree number per hectare was considered the forest stand density, which ranged from 100 stems/Ha to 900 stems/Ha. For the different forest stands simulated with PolSARpro, the density is mutative and the rest main parameters were constant. For analyzing the impact of forest density under different height, three groups of datasets with a reference height of 10 m, 14 m, and 18 m were simulated.

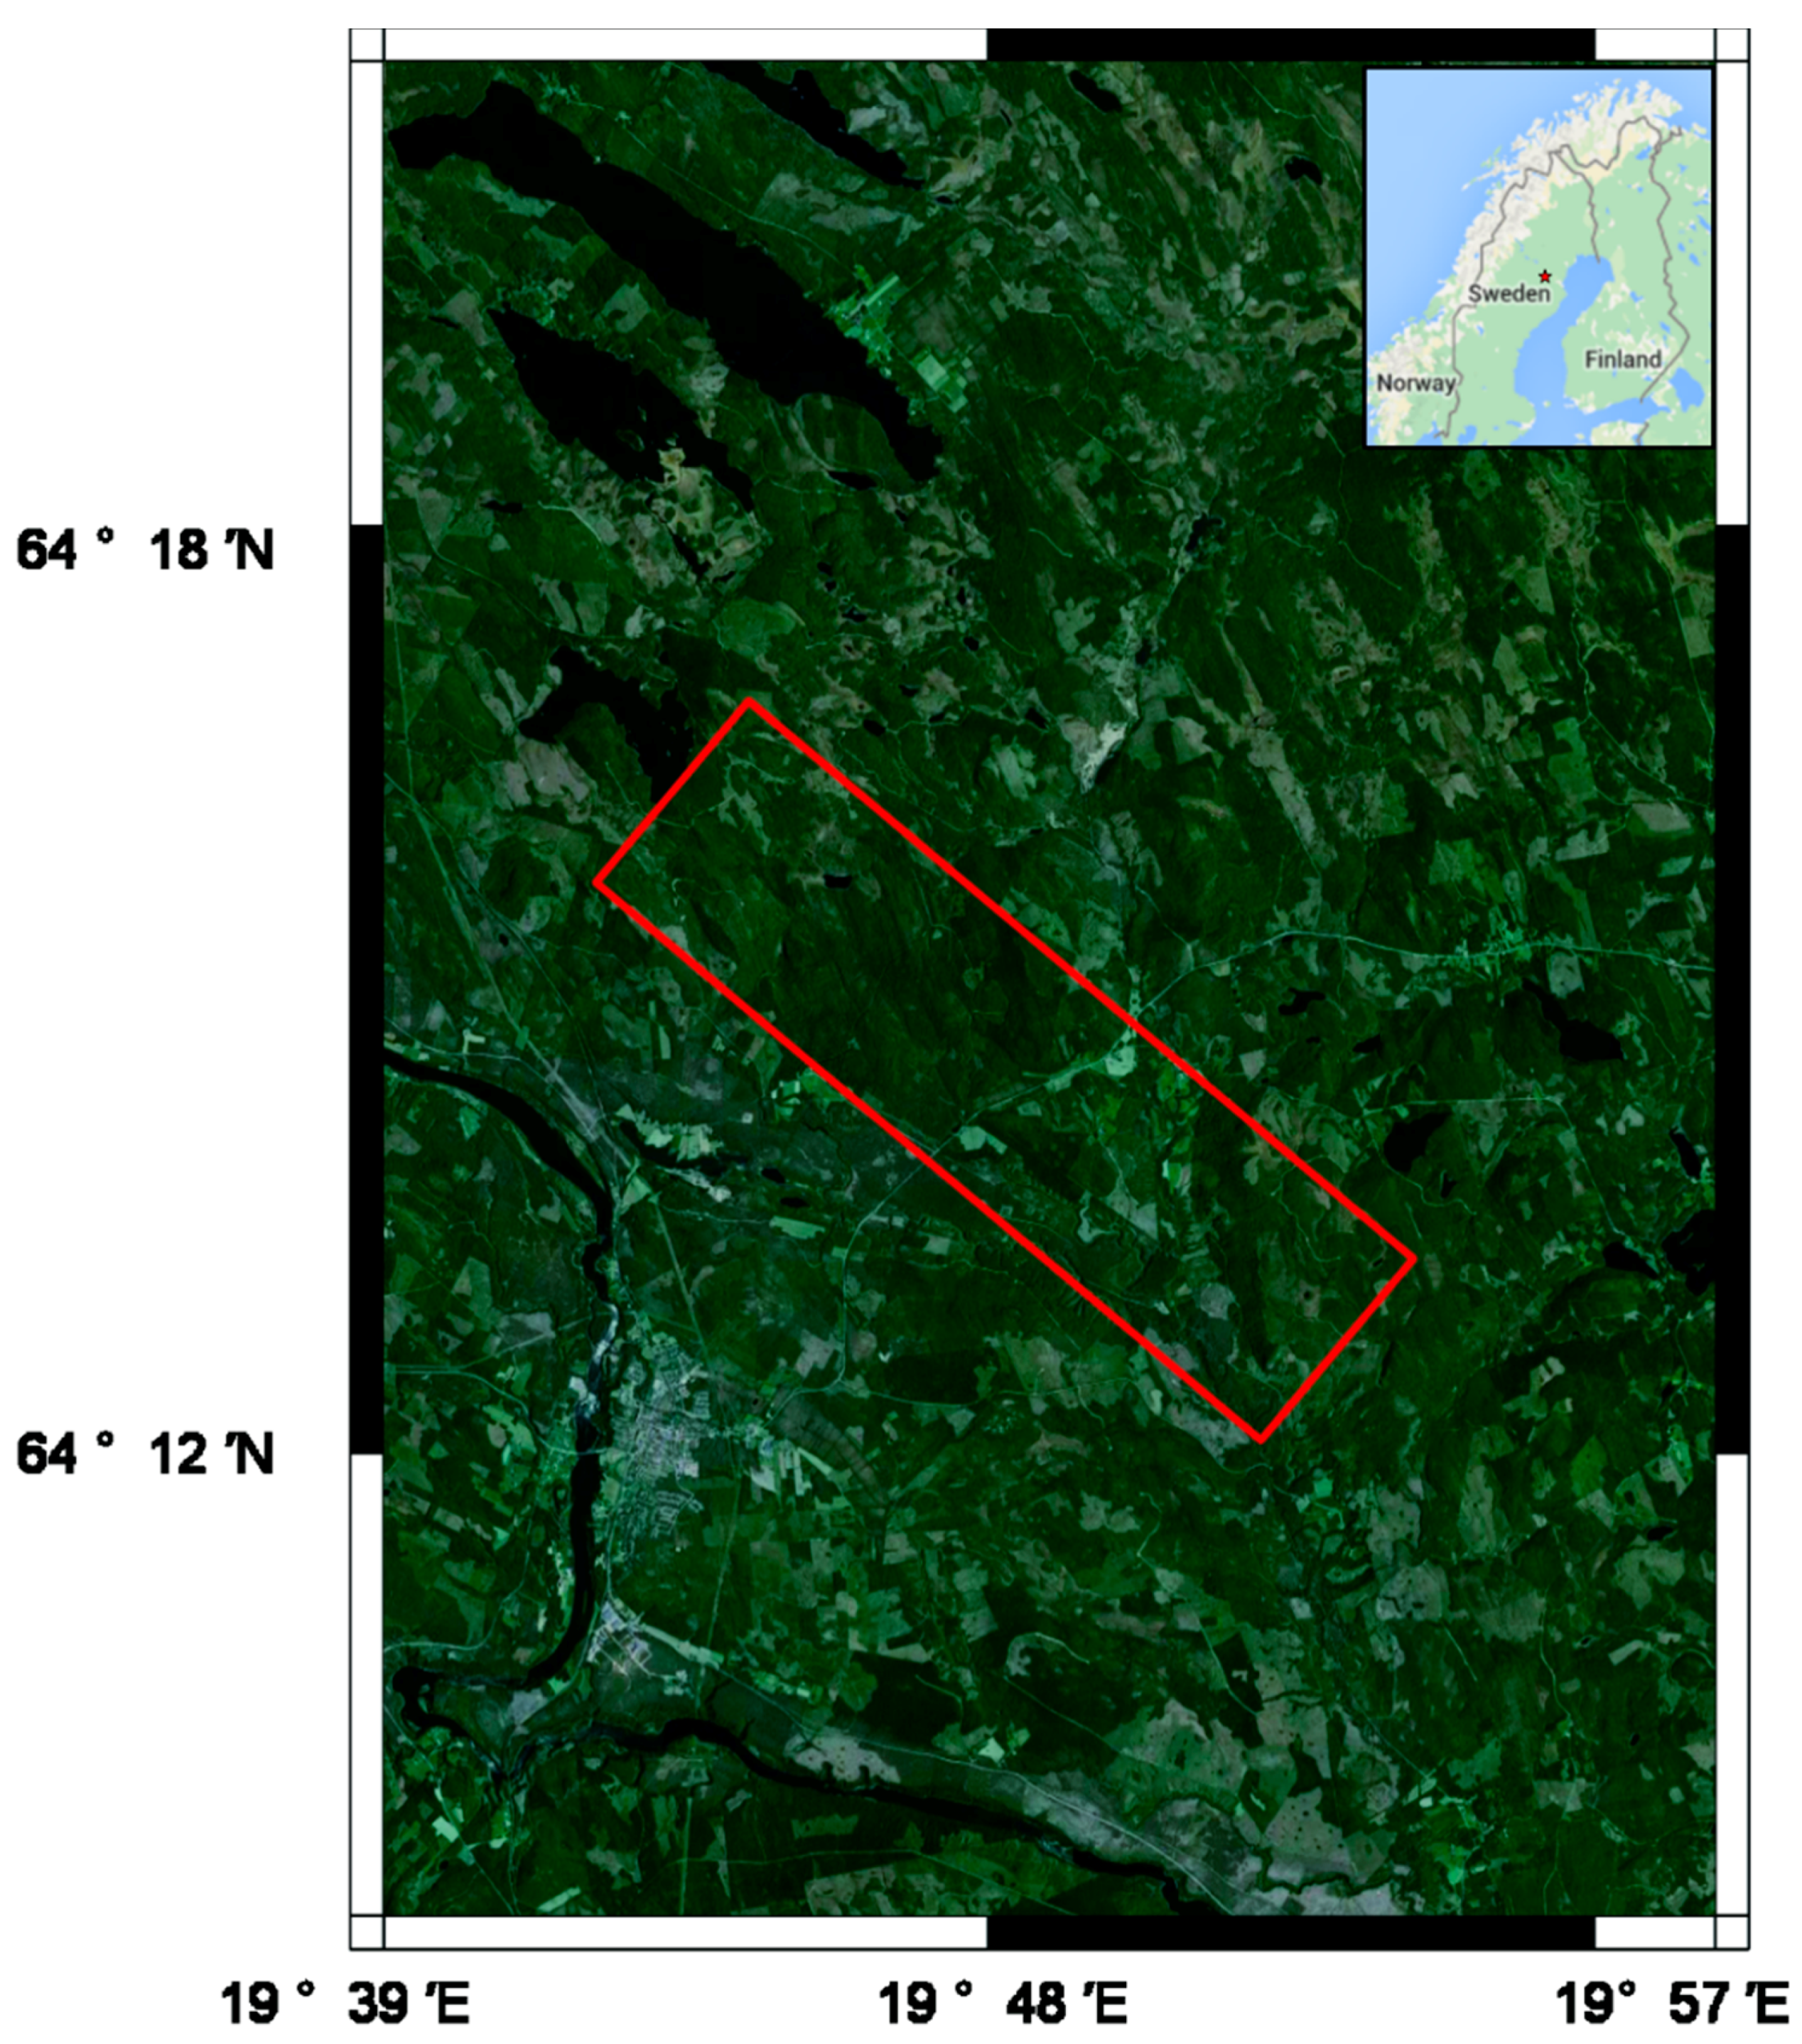
3.2. The Real P-Band ESAR Data

We also selected two real P-band E-SAR data acquired in the framework of the ESA BioSAR 2008 campaign for experiments [31]. The aim of this campaign was to investigate topographic effects on boreal forest biomass retrieval by PolInSAR data [32,33]. The main radar data sources of the BioSAR 2008 campaign were acquired by DLR’s airborne E-SAR system. The test site mapped by E-SAR is located in Krycklan River catchment of the Vindeln municipality in Northern Sweden (see Figure 1), where the elevation changes from 150 m to 400 m. The test site was dominated with mixed coniferous forest, but studded with a small amount of broad-leaved forest. In addition, forest height measured by Light Detection and Ranging (LiDAR) was available at the test site, which could serve as a reference. Many researchers have used these datasets for the study of biomass estimation, forest height inversion, and forest vertical structure retrieval [34,35,36]. The selected two P-band E-SAR data were acquired on 14 October 2008 with a time interval of about 33 min. The spatial baseline was about 24 m.

4. Experimental Results and Analysis

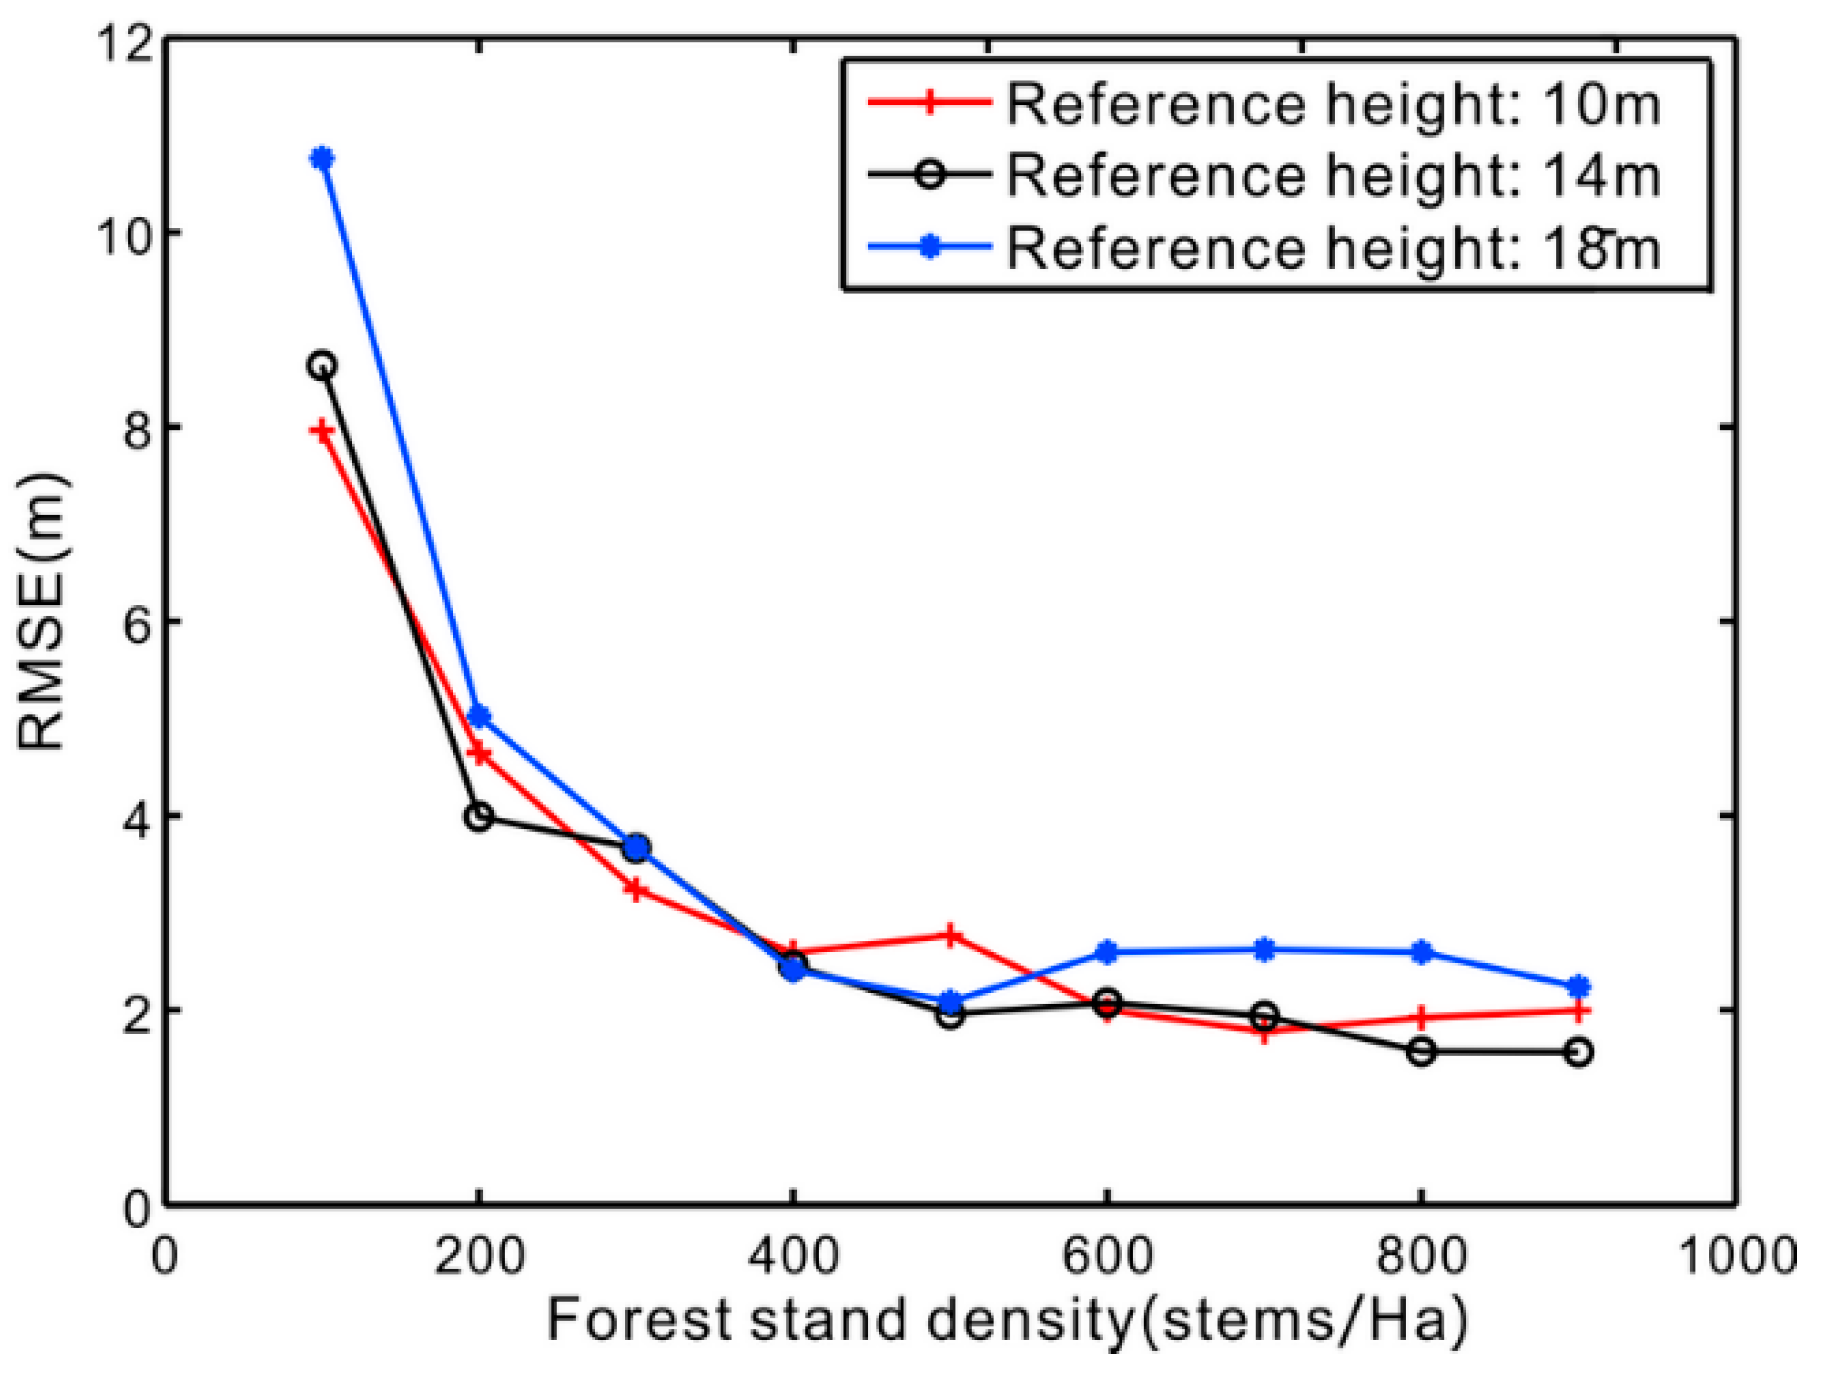
4.1. Results and Analysis of the Simulated Datasets

After applying the three-stage height inversion method to the simulated datasets, we acquire the root mean square error (RMSE) of inversed height for different forest stand density with a reference height of 10 m, 14 m, and 18 m. As shown in Figure 2, all the RMSEs of the three groups of results indicate an obvious decreasing trend with the increasing forest density. The decreasing RMSE indicates the increasing accuracy of forest height inversion. For the sparse forests (e.g., the stand density smaller than 400 stems/Ha), the height inversion errors become larger. The main reason is that the sparse vegetation cannot be assumed as a random volume. When forest stand density increases to a certain degree, it is no longer the main factor affecting the accuracy of forest stand height. However, there are still about 2 m of underestimated errors because the phase center of HV channel is located in the canopy rather than at the top of the forest [14].
In addition, the ground-to-volume scattering ratio is another important factor affecting the application of the RVoG model, which can be defined as Equation (4):
μ ( ω ) = ω H T G r o u n d ω ω H T C a n o p y ω
where T G r o u n d and T C a n o p y are the echo signal intensity of ground and vegetation layer, respectively [27]. Therefore, we needed to study the relationship between forest density and ground-to-volume scattering ratio. Based on the simulated data, we can estimate the ground-to-volume scattering ratio of the HV coherence channel for different densities by using the six-dimension nonlinear iterative algorithm. The HV coherence channel is substituted into Equation (1) for forest height retrieval. By comparing the average ground-to-volume scattering ratio for different forest stand density, we found that there is a negative correlation between forest density and ground-to-volume scattering ratio, which is shown in Figure 3.
For sparse vegetation, the electromagnetic wave easily penetrated the vegetation layer and reached the ground. The echo signal intensity of ground was stronger than that of the vegetation layer. In this case, the corresponding ground-to-volume scattering ratio μ ( ω ) was larger, although smaller for dense vegetation. However, to simplify the algorithm of the traditional three-stage inversion process, it was assumed that the ground-to-volume scattering ratio is null for the intersection point inside the unit circle of interferometric coherence. Thus, Equation (1) can be simplified as:
γ ( ω ) = e j ϕ 0 γ v
In fact, to satisfy the assumption above, the minimum ground-to-volume scattering ratio related to coherence channel should be small—the smaller, the better. Generally, the eligible coherence channels are HV, PDH, etc. Assuming other factors are constant, the ground-to-volume scattering ratio will decrease with the increasing forest stand density (see Figure 3), and vice versa. This is beneficial to forest height estimation. The estimation accuracy of forest height, however, was sensitive to the change of ground-to-volume scattering ratio, and the minimum ground-to-volume scattering ratio needed to be less than −10 dB to secure the height accuracy of around 10% [27].
In short, with different forest densities, ground-to-volume scattering ratio has an obvious influence to the estimation accuracy of forest height. In sparse vegetation areas, the application of the RVoG model is limited in forest height retrieval.

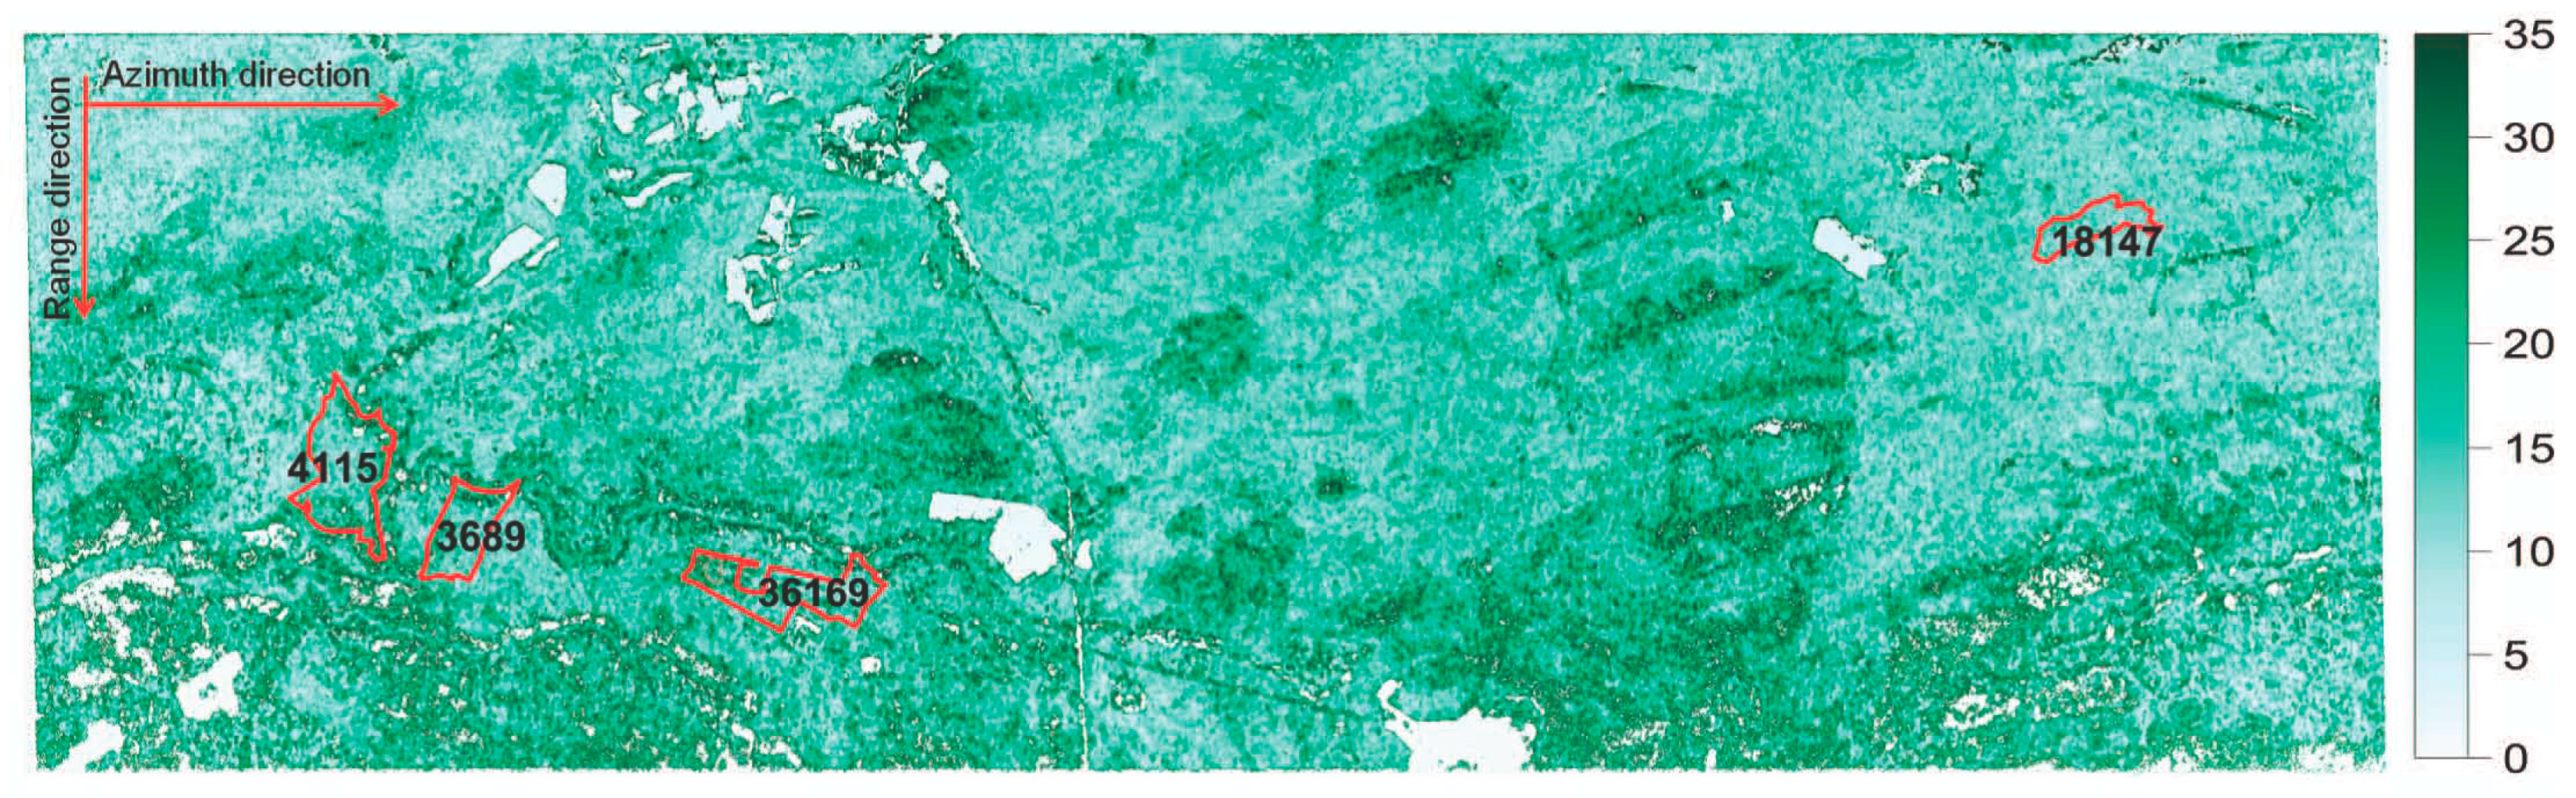
4.2. Results of P-Band E-SAR Datasets

Due to the good penetration of P-band, the coherences of all the linear polarimetric channels contain a certain degree of the contributions from canopy, trunk, and ground. In consequence, the coherence set is characterized by high ellipticity, which makes it difficult to measure the ground phase with the total least square (TLS) linear fit [25]. Furthermore, it seems impossible to obtain a polarization without ground contributions at P-band, which makes it hard to estimate the pure volume coherence accurately. In order to improve the accuracy of forest height retrieval, phase diversity (PD) coherence optimization was introduced in the experiment using real data [29]. The result of forest height retrieval for the entire test site can be found in Figure 4.
In the experiment using real data, we also took the tree number per hectare as the forest density. In the simulated experiment, the type and height of different forest stands were set as constants, which ensured that the forest density can be calculated accurately by tree number per hectare. When using real data, however, different forest stands have different heights, and a single forest stand may have different forest types. Thus, we could not acquire the forest density by calculating the number of trees per unit.
In order to guarantee the reliability of the experimental results, we selected appropriate forest stands (forest stand numbers 3689, 4115, 18147, and 4115 shown in Figure 4), which were pure coniferous forest, and with the heights ranging from 17 m to 21 m. Comparing the height estimated in the experiment with the result from LiDAR, we could obtain the accuracy of forest stand height by the three-stage inversion method. Table 2 lists the result.
Comparison of the height of all four forest stands (see Table 2) shows their RMSEs ranging from 3.1 m to 4.6 m. Further, the higher the density was, the smaller the RMSE would be. This result verifies the experimental conclusion from the simulated data.

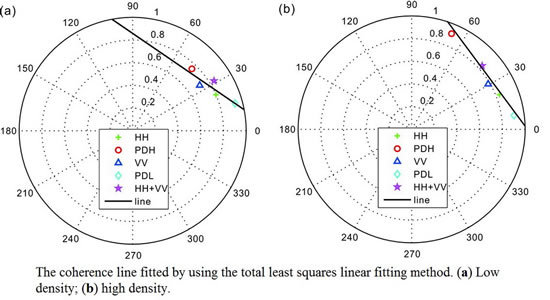
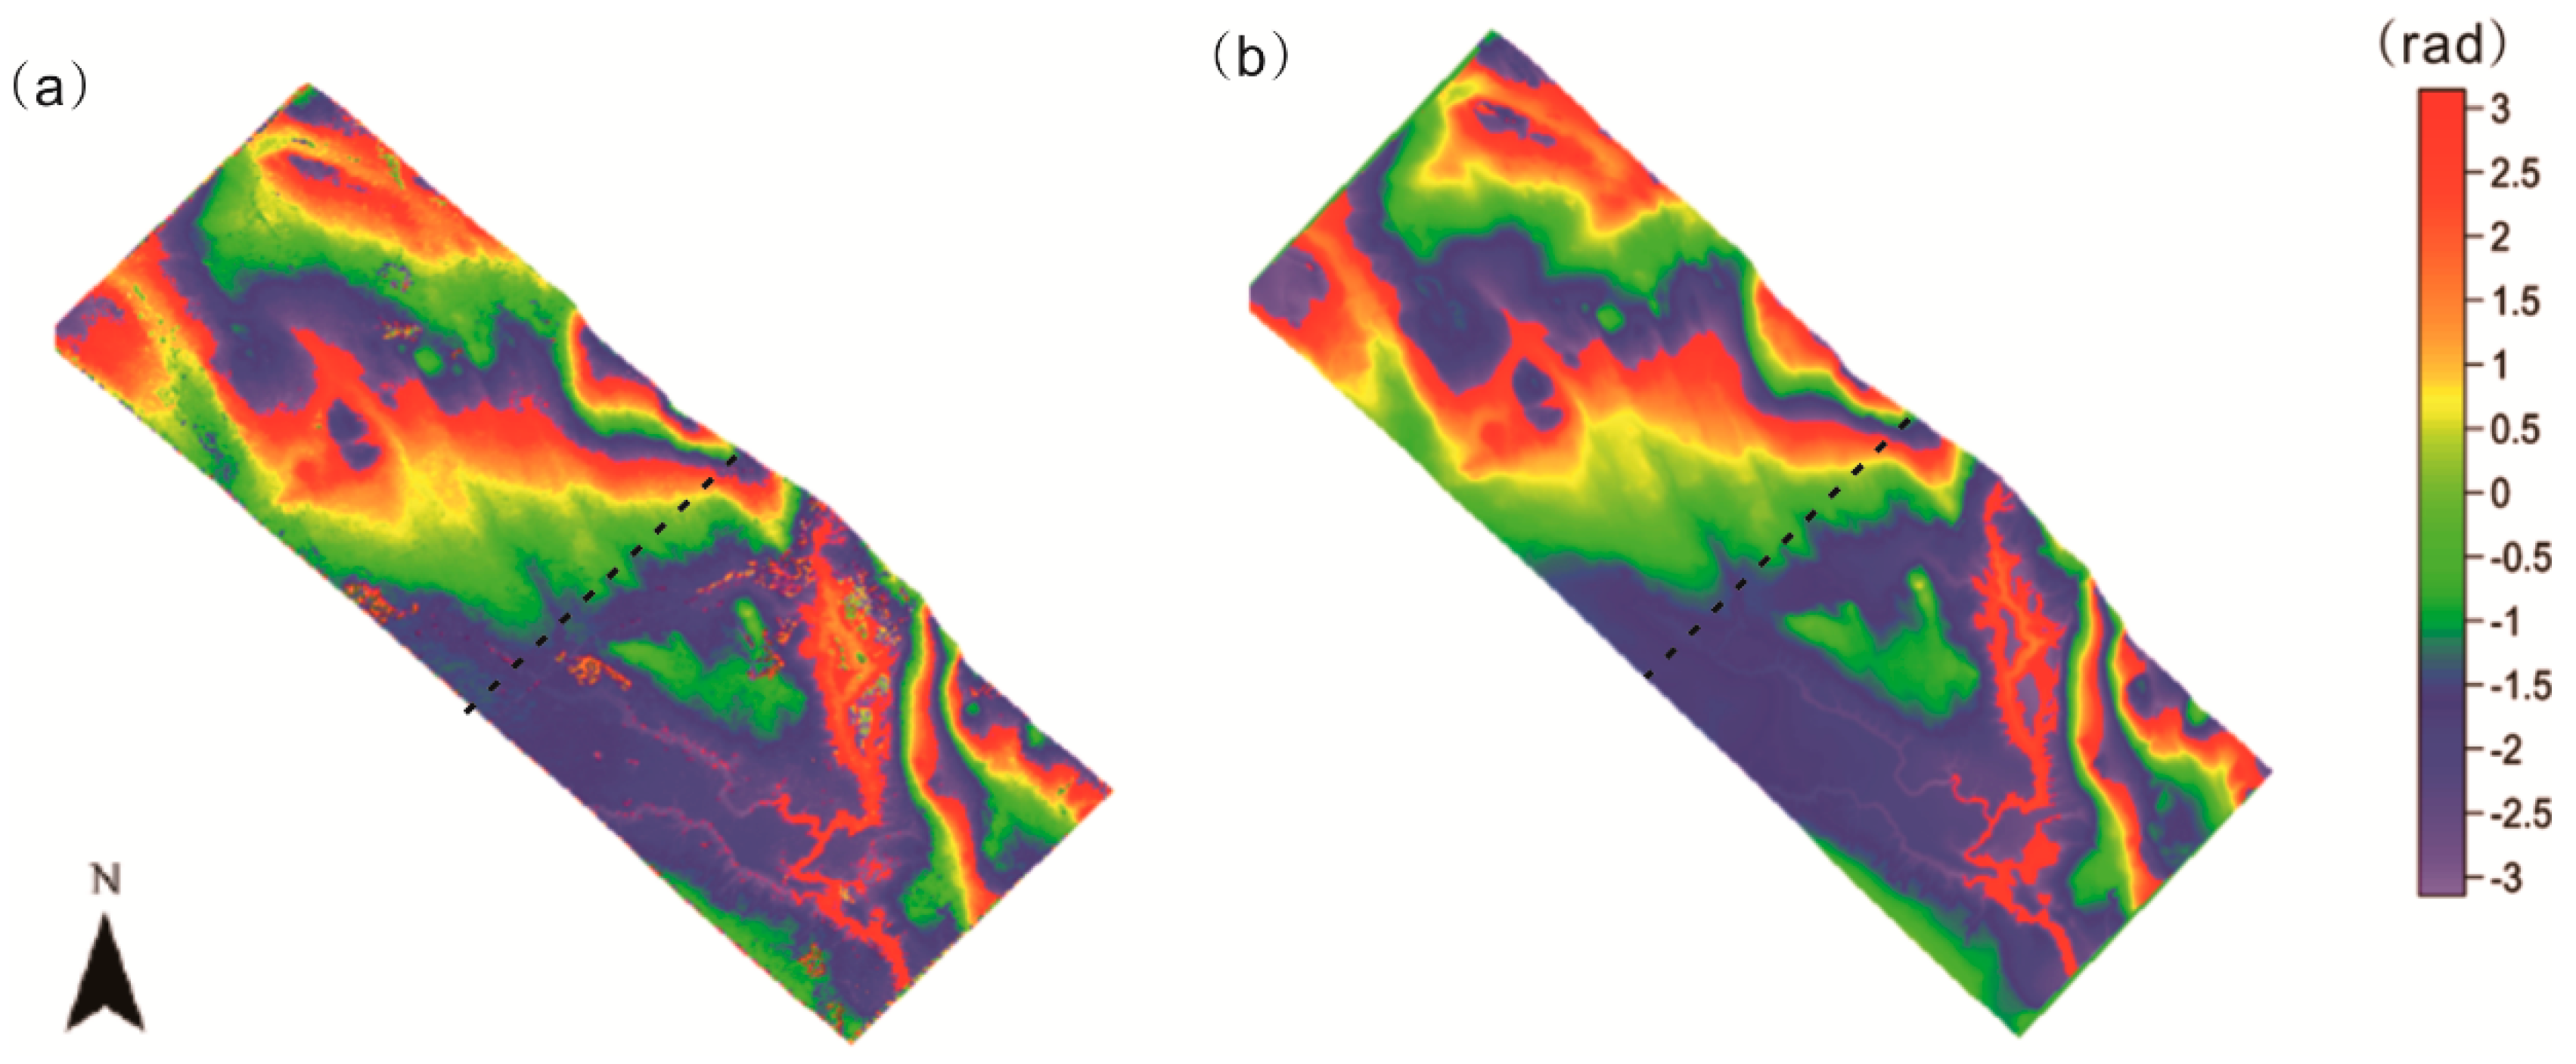
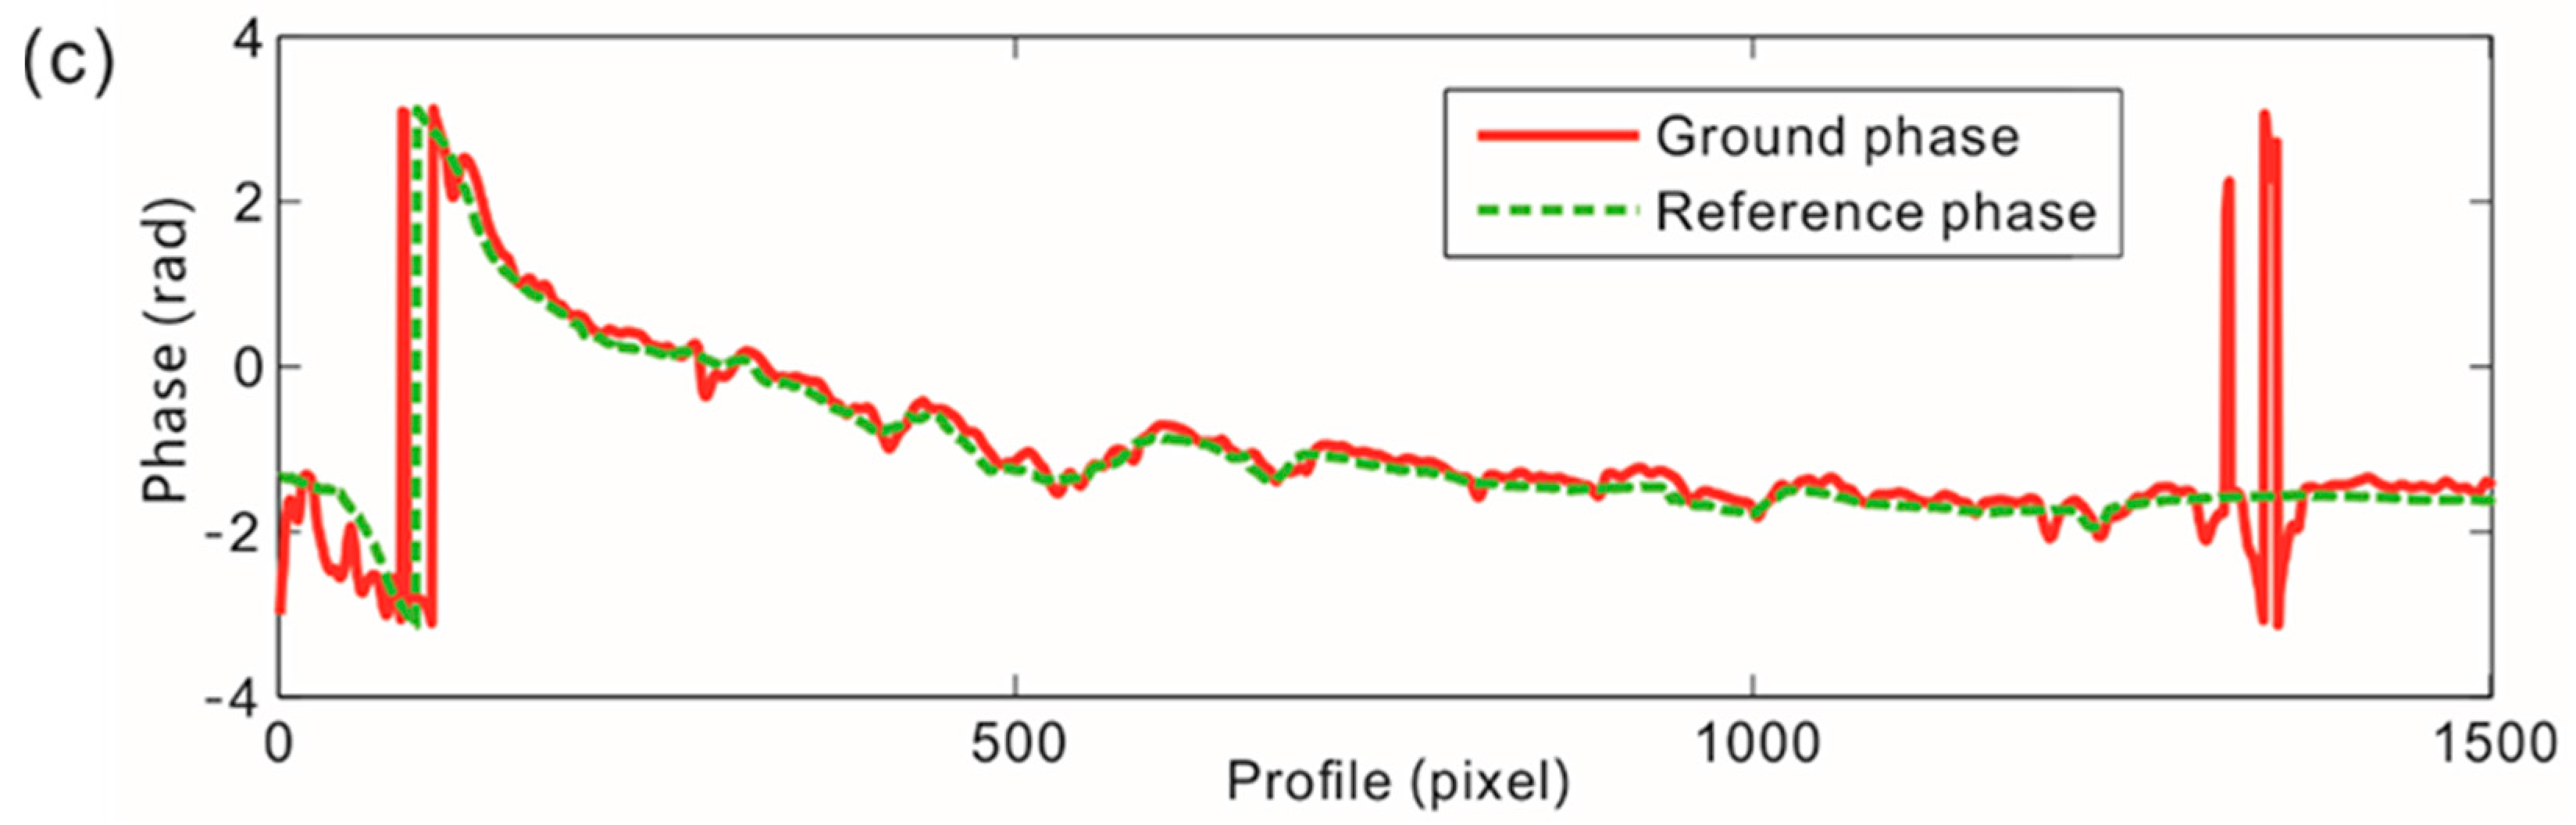
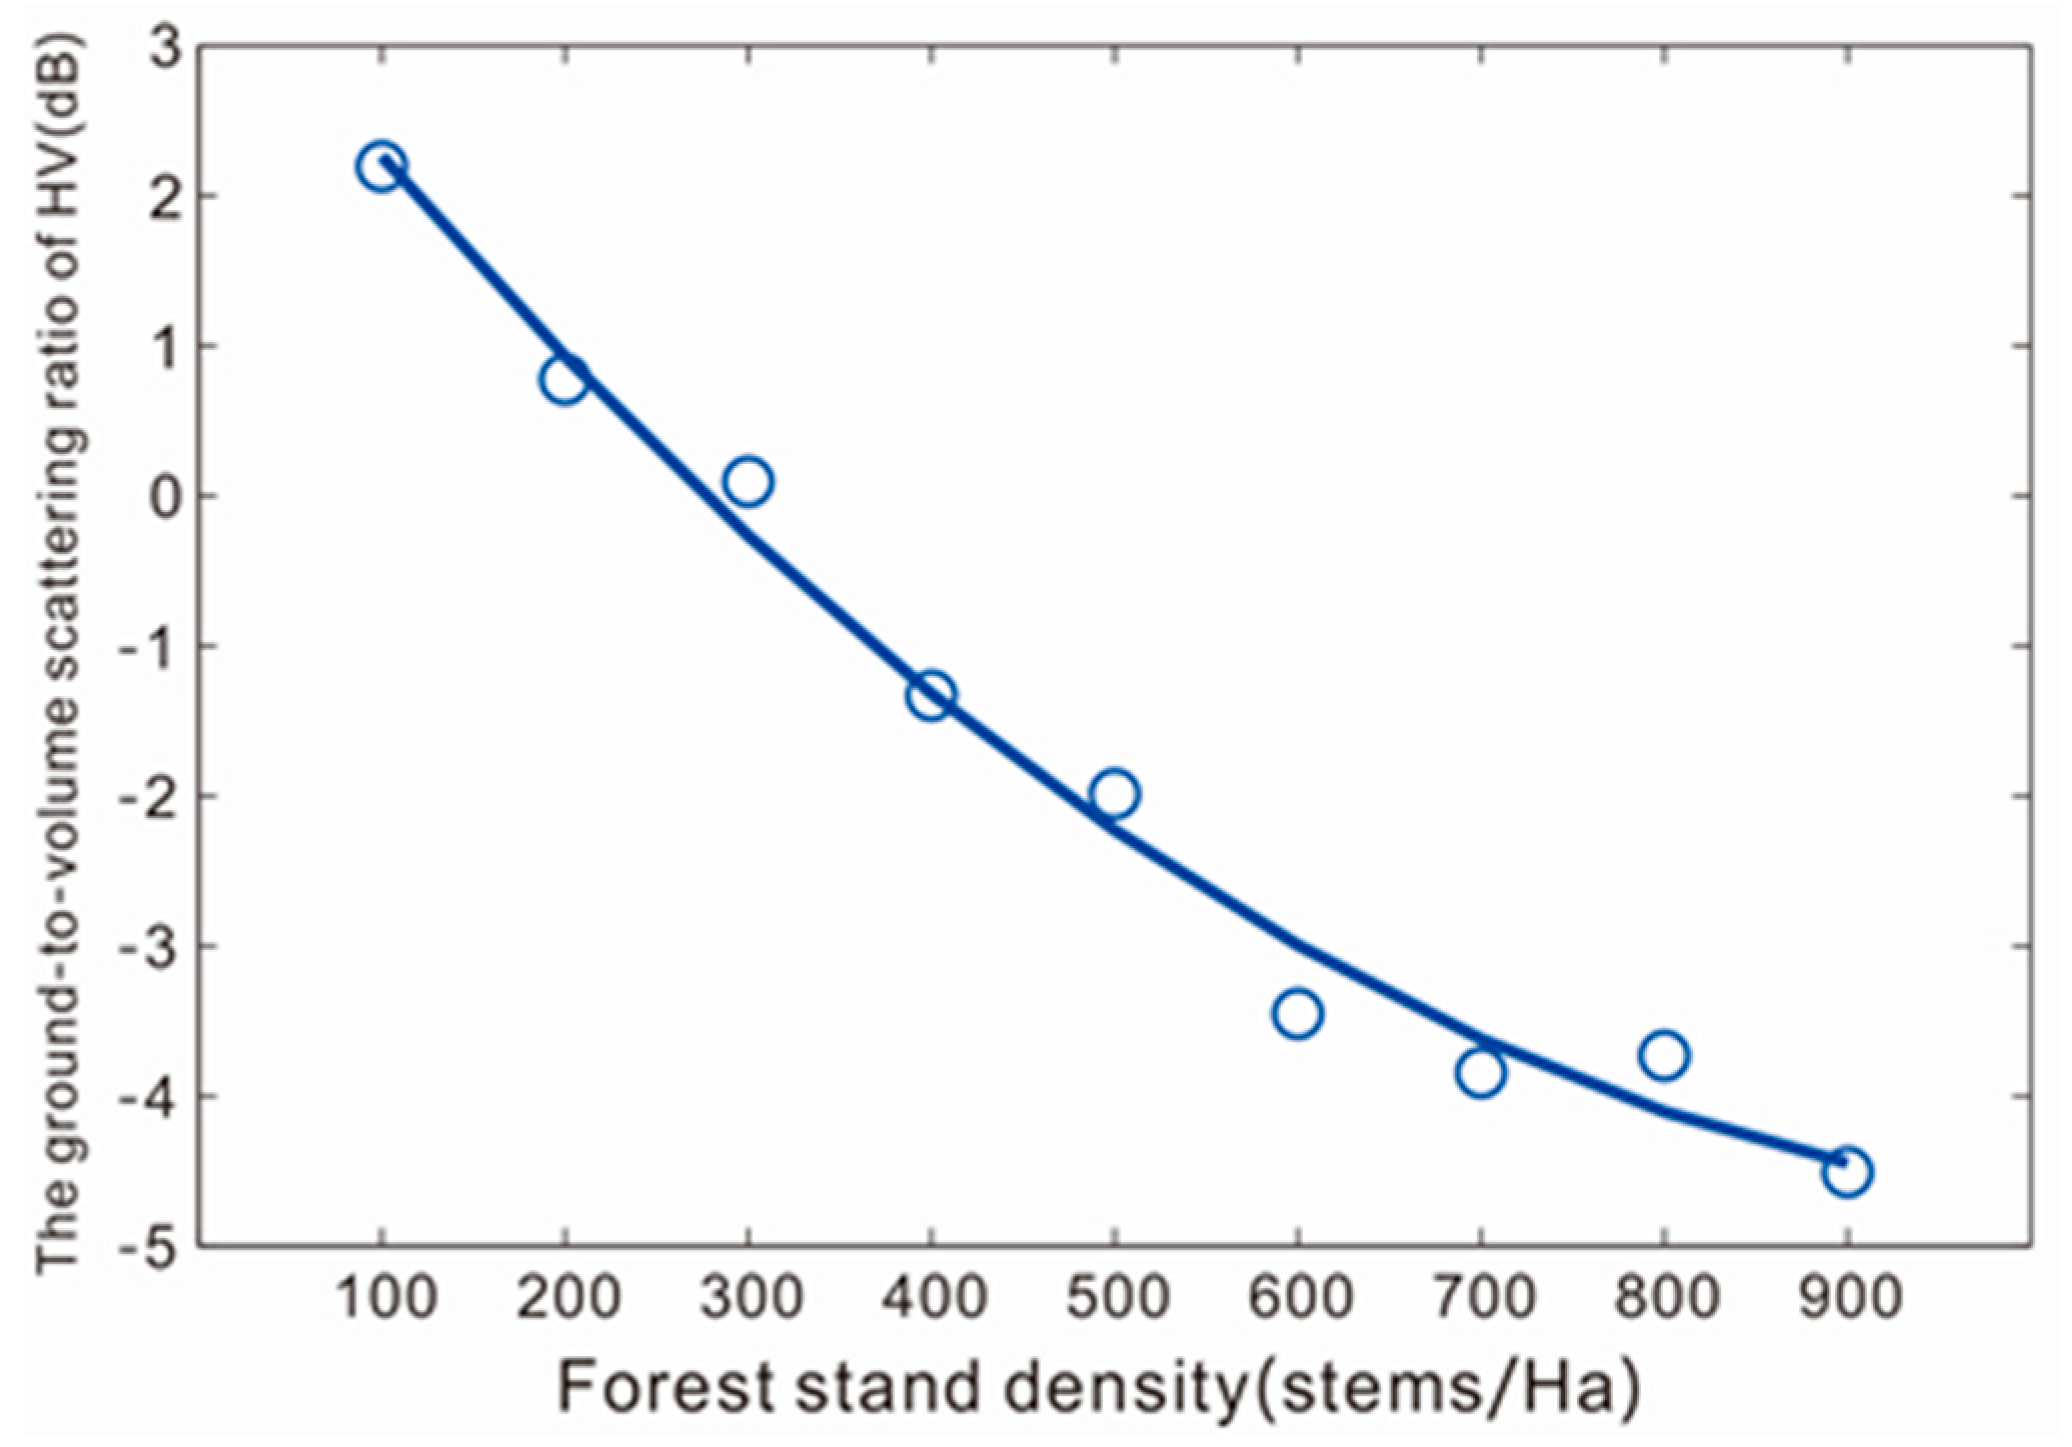
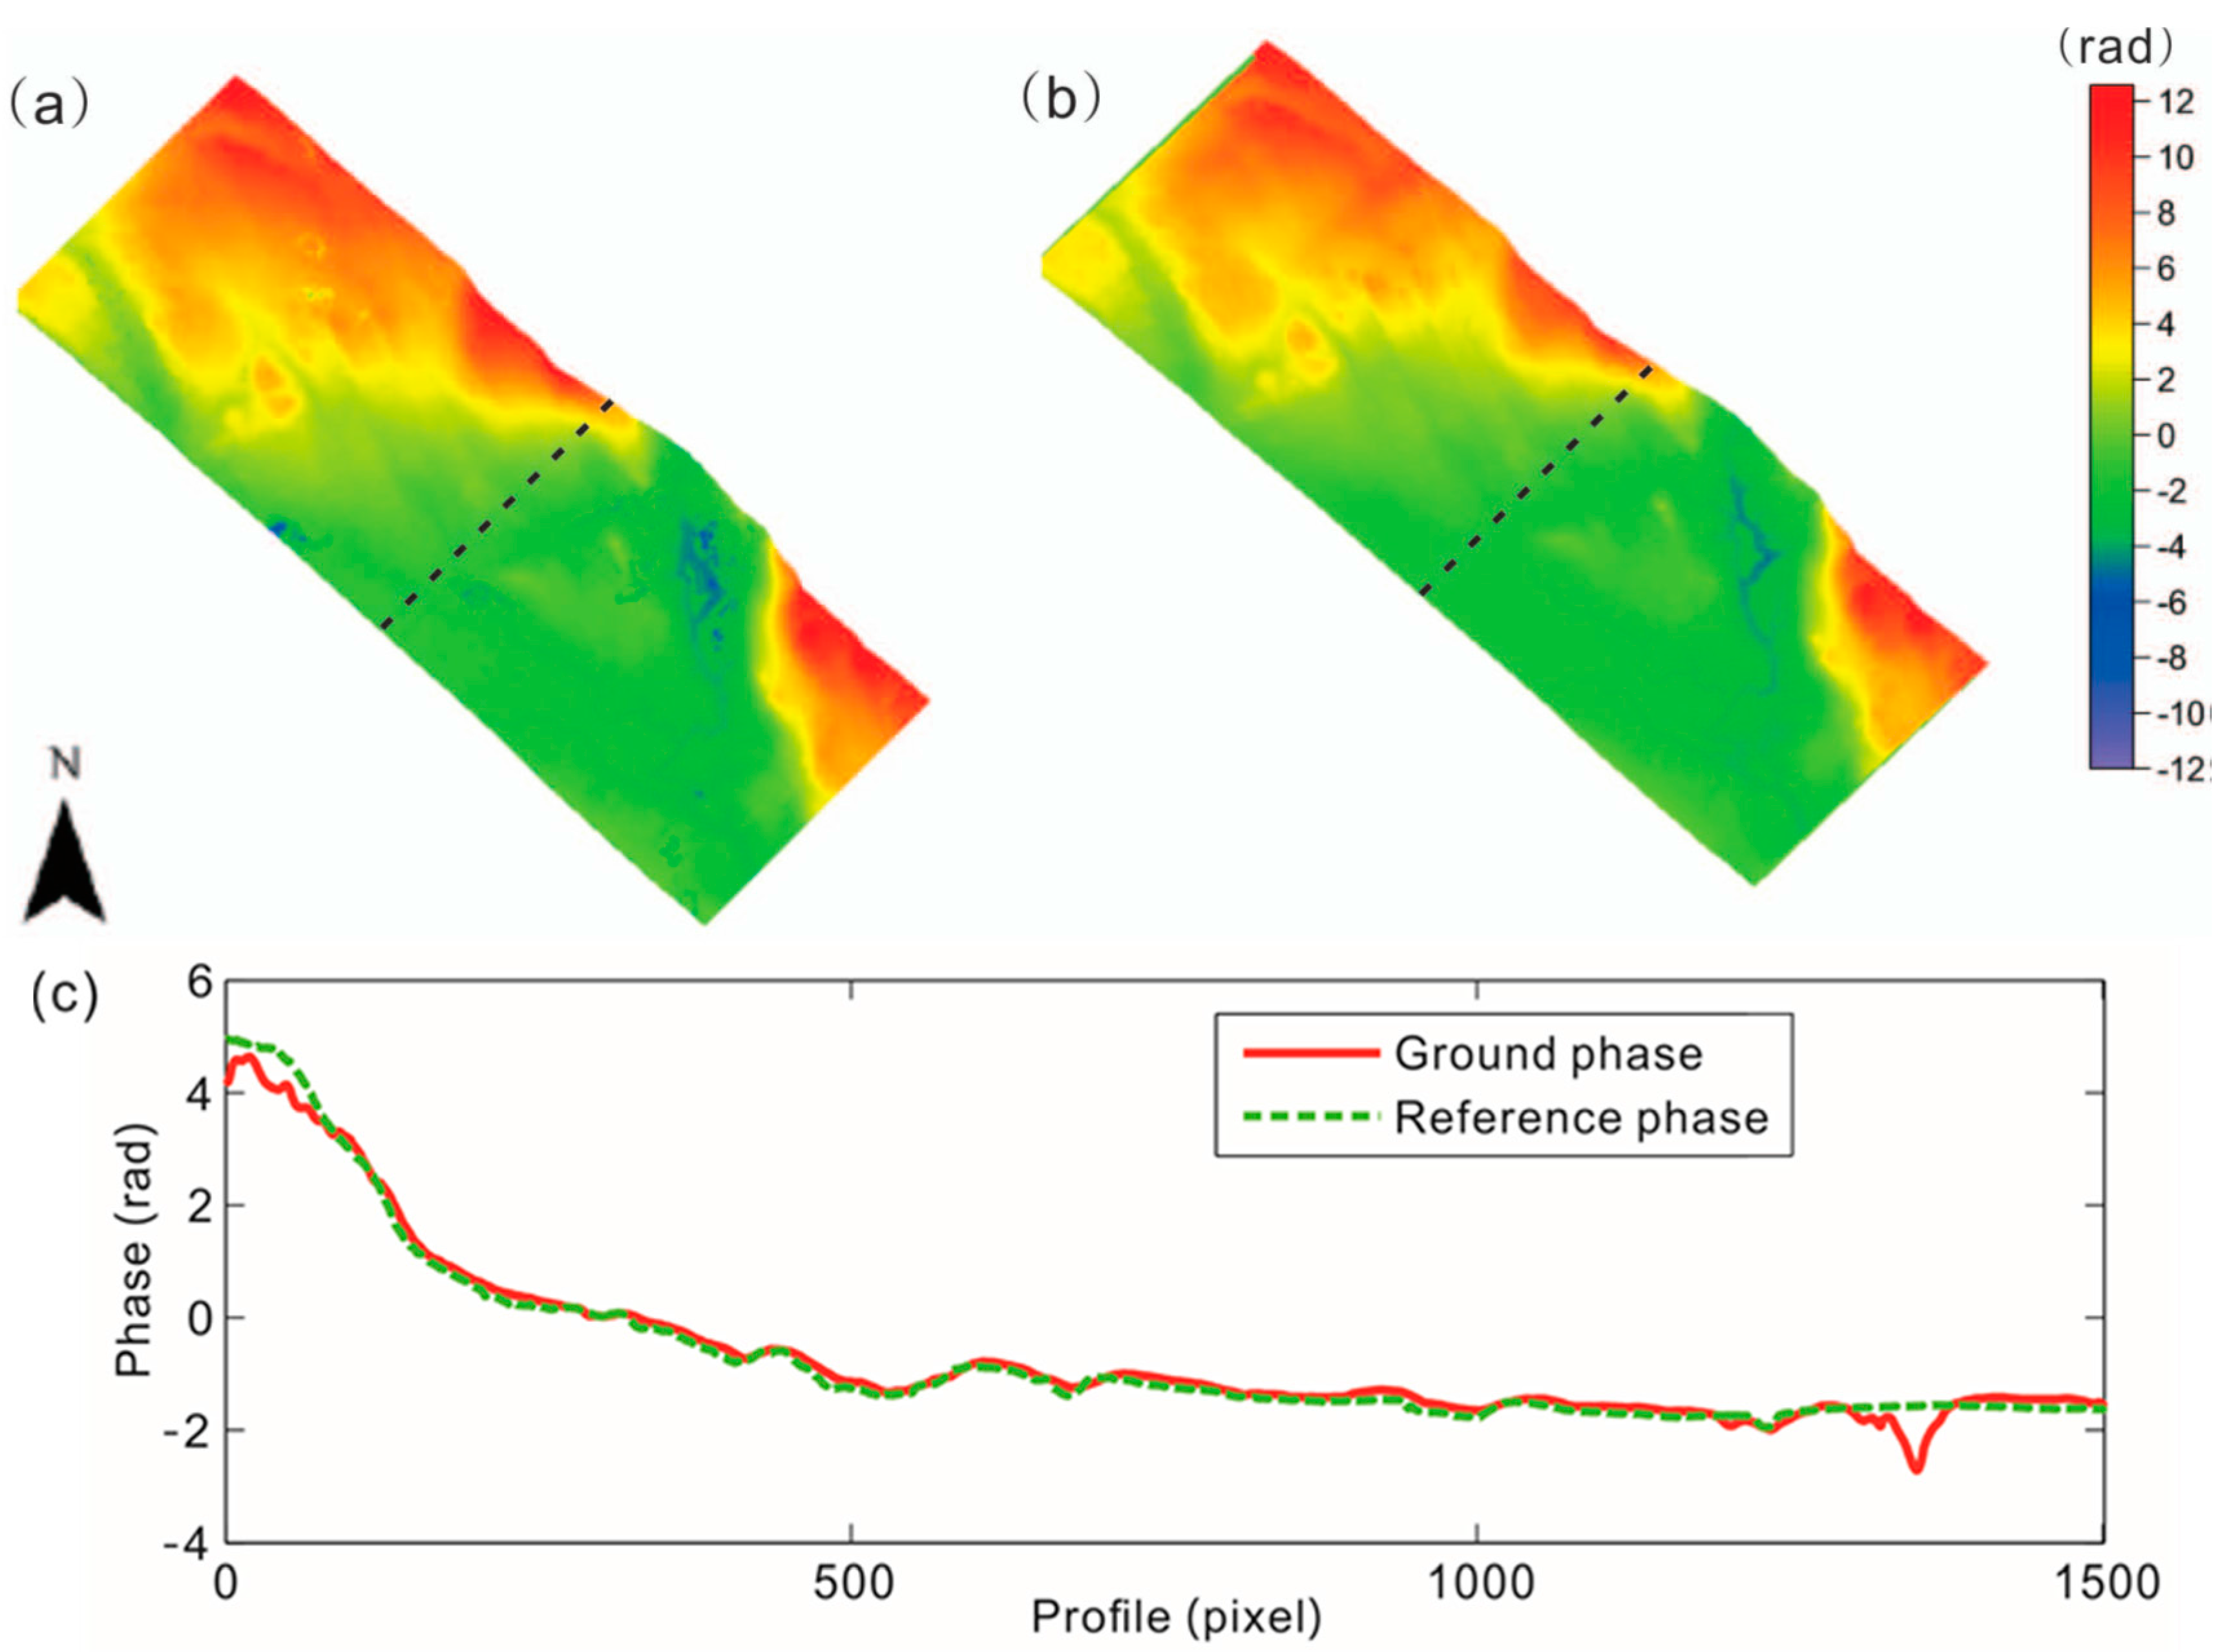
4.3. The Ground Phase for Different Density

Inside the unit circle of the complex coherence plane, the coherence loci for the RVoG model are a straight line, which is the geometric expression for the RVoG model. The coherence line intersects the circle at two points. One is the coherence point related to the ground phase, which can be determined by the certain judgment standard. The other is a useless solution for inversion. In theory, the coherence points related to different polarization states should be located on the coherence line in the complex plane. However, due to the error caused by data processing and temporal decorrelation, the coherence points are actually not distributed on the line, but scattered on its two sides. Thus, we must rebuild the coherence line by a total least squares line fit. In this way, the fitted coherence line will directly influence the estimation of ground phase.
Using the ground phase of the four selected forest stands, we were able to analyze the impact of forest density to the ground phase estimation. For comparison, we converted the LiDAR DEM into the reference phase using the baseline parameters of the platform.
The ground phase estimated by the fitted coherence line and the reference phase obtained by using external LiDAR DEM are shown in Figure 5a,b respectively. We could differentiate the reference phase and the ground phase to analyze the accuracy of the ground phase for different forest density. However, there was an error in the area where phase changes suddenly from π to −π, as shown in Figure 5c, greatly affecting the RMSE of the ground phase. Before comparing, therefore, we needed to unwrap the reference phase and ground phase, respectively, and the corresponding result is shown in Figure 6.
Estimation of the ground phase depends on the fitted coherence line. Thanks to the introduction of the PD coherence channels, the error caused by the judgment method has been greatly eliminated. The coherence line is limited by the distribution range of the coherence points related to polarization states (the visible length of the coherence line). In the complex plane, the sparser the distribution of coherence points, the more reliable the fitted coherence line. If other factors are consistent, such as the baseline length, radar wavelength, and polarization channels, the forest density will be a main factor influencing the distribution of the coherence points.
As shown in Table 3, the estimation accuracy of the ground phase increases with the increasing forest stand density. The reason is that, for the low density forest stand, the electromagnetic wave easily penetrated the vegetation layer, and the phase centers of coherence channels with high volume scattering were close to the phase centers with high surface scattering. In the complex plane, the coherence points related to all five coherence channels are densely distributed within the unit circle (see Figure 7a). In this case, the fitted coherence line had a bad geometrical structure and low reliability, so the estimation accuracy of the ground phase was poor. Conversely, for the high density forest stand, the electromagnetic wave could not penetrate the vegetation layer easily. The phase centers of polarization states with high volume scattering were located in the upper part of the vegetation layer, which were far away from the phase centers of polarization states with dominant surface scattering. Additionally, in the complex plane, the coherence points were scattered widely on both sides of the coherence line, as can be seen in Figure 7b. Therefore, it was good for the coherence line fitting and the estimation of the ground phase.
By using the phase corresponding to the volume coherence and the ground phase, we can approximately estimate the height of forest stand. For example, the height related to HH coherence channel can be estimated by Equation (6):
h = arg ( γ H H ) ϕ 0 k z
The relative height of phase centers for different forest stands can be obtained by comparing the result estimated from Equation (6) with the results obtained by LiDAR (see Figure 8).
For the four forest stands of real data, we can make a quantitative analysis for the distribution of the coherence points by the method above. As shown in Table 4, the STD of phase centers correlates positively with the forest stand density. Furthermore, relative locations of phase centers related to different polarization states gradually become discrete.
In [14], the authors made a qualitatively analysis of the forest height inversion performance on the sparse pine forest by using X-band HH and HV polarizations. The obtained phase center height difference between the HH and HV polarizations in the sparse area is larger than that of the dense area, which is beneficial to achieve a more accurate forest height. This is in conflict with the trend in Figure 8. The reason is that, in the case of X-band, the phase center of HV channel is always located in the canopy for both the sparse and dense area, while the phase center of HH channel gradually declines with decreasing density because of increasing ground contribution [14]. However, for the P-band data used in this paper, all polarizations had considerable contributions from the ground due to strong penetration. Moreover, with the increasing density, the phase center of HV or PDH polarizations gradually rose, which caused the phase centers of different channels to separate. Therefore, the distribution of the coherence points gradually increases in the complex plane with increasing forest stand density, which is beneficial to the coherence linear fitting and the estimation of the ground phase. According to the procedures of the traditional three-stage inversion process, we find that ground phase is one of the essential parameters of the RVoG model, and accurate ground phase can make a remarkable contribution to improve the accuracy of forest height inversion.

5. Conclusions

The impact of forest density on forest height inversion with the RVoG model has been researched for this paper, which offers a beneficial reference for the study of the applicability of models from Polarimetric Interferometric SAR data and methods of forest height inversion. In this paper, forest stand height for different densities was estimated in the experiments using both simulated and real data. In the simulation experiments, the results of three groups of datasets with reference height of 10 m, 14 m, and 18 m showed that all of the RMSEs decrease with increasing forest density. For the extremely sparse forests, the vegetation layer could not be assumed as a random volume. In this case, the height inversion accuracy of the classical three-stage method was poor. Furthermore, we found a positive correlation between the forest density and the estimation accuracy of the forest stand height. According to the results of real data experiments, the applicability of the RVoG model for different forest density was specifically analyzed in two aspects, ground phase and ground-to-volume scattering ratio. The main factor affecting the estimation accuracy of ground phase is the visible length of the coherence line, which is sensitive to the change in forest stand density. In addition, the relationship between density and ground-to-volume scattering ratio is also an important factor that influences the applicability of the RVoG model.
For the traditional three-stage inversion process, the ground-to-volume scattering ratio needs to be less than −10 dB to secure a height accuracy of around 10% [27]. However, in this paper, we found a negative correlation between forest density and ground-to-volume scattering ratio; moreover, in the sparse vegetation areas, ground-to-volume scattering ratio no longer met the assumption of less than −10 dB. In addition, it was difficult to obtain the accurate volume-only coherence in such a situation. Therefore, it is necessary to consider the ground-to-volume scattering ratio when we estimate forest height in the sparse vegetation areas. For the six-dimension nonlinear iterative algorithm, although the ground-to-volume scattering ratio is parameterized for all the polarizations in the forest height inversion, the ill-conditioned problem is usually caused by the small differences of ground-to-volume scattering ratio under different polarizations. In this case, it was difficult for us to obtain robust results. Therefore, the ground-to-volume scattering ratio is an essential factor for influencing the accuracy of forest height inversion.
We conclude that, with the increase of forest stand density, the estimation accuracy of the ground phase increases, and the ground-to-volume scattering ratio decreases, which is helpful for the retrieval of forest stand height. At the same time, the applicability of the RVoG model is limited in sparse vegetation areas because of the influence of forest density to the ground-to-volume scattering ratio. However, in real data experiments, we only find a qualitative relationship and not a definitively quantitative relationship. The reason is that, for real forest scenes, the forest density used in this paper could not well reflect the density of the trunk, which is related to the attenuation of the electromagnetic wave, as described in [37]. More prior knowledge about forest geometrical structures is needed to study the relationship between forest density and the density of the trunks. Furthermore, the ground scattering contribution (e.g., odd scattering and double bounce scattering) is affected by the terrain slope [38]. As a result, the ground-to-volume scattering ratio is also affected by the terrain slope. Therefore, terrain slope should also be considered when we study the relationship between ground-to-volume ratio and forest density in future work. Nonetheless, this paper helps us to better understand the performance of the RVoG model over forests with different densities and provides an opportunity for us to modify the RVoG model by integrating the forest density.

Acknowledgments

The work was supported by the National Natural Science Foundation of China (No. 41531068, 41371335). Additionally, this paper is supported by PA-SB ESA EO Project Campaign of “Development of methods for Forest Biophysical Parameters Inversion Using POLInSAR Data (ID. 14655).” The authors would also like to thank ESA for providing free PolSARproSim tools.

Author Contributions

Changcheng Wang conceived the idear, designed the experiments, and revised the paper; Lei Wang performed the experiments and wrote the paper; Haiqiang Fu provided and analyzed the data; Qinghua Xie and Jianjun Zhu analyzed the experimental results.

Conflicts of Interest

The authors declare no conflict of interest.

References

  1. Fu, H.; Wang, C.; Zhu, J.; Xie, Q.; Zhao, R. Inversion of vegetation height from PolInSAR using complex least squares adjustment method. Sci. China Earth Sci. 2015, 58, 1018–1031. [Google Scholar] [CrossRef]
  2. Wu, Y.; Hong, W.; Wang, Y. Research status and edification for polarimetric SAR interferometry. J. Electron. Inf. Technol. 2007, 9, 1258–1263. [Google Scholar]
  3. Askne, J.; Dammert, P.; Ulander, L.; Smith, G. C-band repeat-pass interferometric SAR observations of the forest. IEEE Trans. Geosci. Remote Sens. 1997, 35, 25–35. [Google Scholar] [CrossRef]
  4. Askne, J.; Santoro, M.; Smith, G.; Fransson, J.E. Multitemporal repeat-pass SAR interferometry of boreal forests. IEEE Trans. Geosci. Remote Sens. 2003, 41, 1540–1550. [Google Scholar] [CrossRef]
  5. Askne, J.; Santoro, M. Multitemporal repeat pass SAR interferometry of boreal forests. IEEE Trans. Geosci. Remote Sens. 2005, 43, 1219–1228. [Google Scholar] [CrossRef]
  6. Treuhaft, R.N.; Madsen, S.N.; Moghaddam, M.; Zyl, J.J. Vegetation characteristics and underlying topography from interferometric radar. Radio Sci. 1996, 31, 1449–1485. [Google Scholar] [CrossRef]
  7. Treuhaft, R.N.; Cloude, S.R. The structure of oriented vegetation from polarimetric interferometry. IEEE Trans. Geosci. Remote Sens. 1999, 37, 2620–2624. [Google Scholar] [CrossRef]
  8. Treuhaft, R.N.; Siqueira, P.R. Vertical structure of vegetated land surfaces from interferometric and polarimetric radar. Radio Sci. 2000, 35, 141–177. [Google Scholar] [CrossRef]
  9. Papathanassiou, K.P.; Cloude, S.R. Single-baseline polarimetric SAR interferometry. IEEE Trans. Geosci. Remote Senci. 2001, 39, 2352–2362. [Google Scholar] [CrossRef]
  10. Mette, T.; Kugler, F.; Papathanassiou, K.; Hajnsek, I. Forest and the random volume over ground-nature and effect of 3 possible error types. In Proceedings of the EUSAR 2006—6th European Conference on Synthetic Aperture Radar, Dresden, Germany, 16–18 May 2006.
  11. Lavalle, M.; Solimini, D.; Pottier, E.; Desnos, Y.-L. The Dependence of the PolinSAR degree of coherence on forest parameters. In Proceedings of the PolInSAR Workshop 2009, Frascati, Italy, 26–30 January 2009.
  12. Zhou, Y.; Hong, W.; Cao, F. Investigation on volume scattering for vegetation parameter estimation of polarimetric SAR interferometry. PIERS Online 2009, 5, 1–5. [Google Scholar] [CrossRef]
  13. Ballester-Berman, J.D.; Vicente-Guijalba, F.; Lopez-Sanchez, J.M. A simple RVoG test for PolInSAR data. IEEE J. Sel. Top. Appl. Earth Obs. Remote Sens. 2015, 8, 1028–1040. [Google Scholar] [CrossRef]
  14. Garestier, F.; Dubois-Fernandez, P.C.; Papathanassiou, K.P. Pine forest height inversion using single-pass X-band PolInSAR data. IEEE Trans. Geosci. Remote Sens. 2008, 46, 59–68. [Google Scholar] [CrossRef] [Green Version]
  15. Lopez-Martinez, C.; Alonso-Gonzalez, A. Assessment and estimation of the RVoG model in polarimetric SAR interferometry. IEEE Trans. Geosci. Remote Sens. 2014, 52, 3091–3106. [Google Scholar] [CrossRef]
  16. Neumann, M.; Saatchi, S.S.; Ulander, L.M.; Fransson, J.E. Assessing performance of L-and P-band polarimetric interferometric SAR data in estimating boreal forest above-ground biomass. IEEE Trans. Geosci. Remote Sens. 2012, 50, 714–726. [Google Scholar] [CrossRef]
  17. Lei, Y.; Siqueira, P. Estimation of forest height using spaceborne repeat-pass L-Band InSAR correlation magnitude over the US State of maine. Remote Sens. 2014, 6, 10252–10285. [Google Scholar] [CrossRef]
  18. Lavalle, M.; Simard, M.; Pottier, E.; Solimini, D. PolInSAR forestry applications improved by modeling height-dependent temporal decorrelation. In Proceedings of the IEEE International Geoscience and Remote Sensing Symposium, Honolulu, HI, USA, 25–30 July 2010; pp. 4772–4776.
  19. Lavalle, M.; Simard, M.; Solimini, D.; Pottier, E. Height-dependent temporal decorrelation for POLINSAR and TOMOSAR forestry applications. In Proceedings of the 8th European Conference on Synthetic Aperture Radar, Aachen, Germany, 7–10 June 2010; pp. 1–4.
  20. Lavalle, M.; Simard, M.; Hensley, S. A temporal decorrelation model for polarimetric radar interferometers. IEEE Trans. Geosci. Remote Sens. 2012, 50, 2880–2889. [Google Scholar] [CrossRef]
  21. Ahmed, R.; Siqueira, P.; Hensley, S.; Chapman, B.; Bergen, K. A survey of temporal decorrelation from spaceborne L-Band repeat-pass InSAR. Remote Sens. Environ. 2011, 115, 2887–2896. [Google Scholar] [CrossRef]
  22. Simard, M.; Hensley, S.; Lavalle, M.; Dubayah, R.; Pinto, N.; Hofton, M. An empirical assessment of temporal decorrelation using the uninhabited aerial vehicle synthetic aperture radar over forested landscapes. Remote Sens. 2012, 4, 975–986. [Google Scholar] [CrossRef]
  23. Neumann, M. Remote Sensing of Vegetation Using Multi-Baseline Polarimetric SAR Interferometry: Theoretical Modeling and Physical Parameter Retrieval. Ph.D. Thesis, University de Rennes 1, Rennes France, 2009. [Google Scholar]
  24. Lu, H.; Suo, Z.; Guo, R.; Bao, Z. S-RVoG model for forest parameters inversion over underlying topography. Electron. Lett. 2013, 49, 618–620. [Google Scholar] [CrossRef]
  25. Xie, Q.; Wang, C.; Zhu, J.; Fu, H. Forest height inversion by combining S-RVOG Model with terrain factor and PD coherence optimization. Acta Geod. Cartogr. Sin. 2015, 44, 686–693. [Google Scholar]
  26. Lavalle, M.; Solimini, D.; Pottier, E.; Desnos, Y.L. PolinSAR for forest biomass retrieval: PALSAR observations and model analysis. In Proceedings of the IEEE International Geoscience and Remote Sensing Symposium, IGARSS 2008, Boston, MA, USA, 7–11 July 2008; Volume 3, pp. 302–305.
  27. Cloude, S.R.; Papathanassiou, K.P. Three-stage inversion process for Polarimetric SAR Interferometry. IEEE Proc. Radar Sonar Navig. 2003, 150, 125–134. [Google Scholar] [CrossRef]
  28. Cloude, S.R.; Papathanassiou, K.P. Polarimetric SAR interferometry. IEEE Trans. Geosci. Remote Sens. 1998, 36, 1551–1565. [Google Scholar] [CrossRef]
  29. Tabb, M.; Orrey, J.; Flynn, T.; Carande, R. Phase diversity: A decomposition for vegetation parameter estimation using polarimetric SAR interferometry. In Proceedings of the 4th European Conference on Synthetic Aperture Radar, Cologne, Germany, 4–6 June 2002; pp. 721–724.
  30. Pottier, E.; Ferro-Famil, L.; Allain, S.; Cloude, S.; Hajnsek, I.; Papathanassiou, K.P.; Moreira, A.; Williams, M.; Minchella, A.; Lavalle, M.; et al. Overview of the PolSARpro V4. 0 software. The open source toolbox for polarimetric and interferometric polarimetric SAR data processing. In Proceedings of the 2009 IEEE International Geoscience and Remote Sensing Symposium, IGARSS 2009, Cape Town, South Africa, 12–17 July 2009; Volume 4, pp. 936–939.
  31. Ulander, L.M.; Gustavsson, A.; Dubois-Fernandez, P.; Dupuis, X.; Fransson, J.E.; Holmgren, J.; Wallerman, J.; Eriksson, L.; Sandberg, G.; Soja, M. BIOSAR 2010-A SAR campaign in support to the BIOMASS mission. In Proceedings of the IEEE International Geoscience and Remote Sensing Symposium (IGARSS), Vancouver, BC, Canada, 24–29 July 2011; pp. 1528–1531.
  32. Ulander, L.M.; Sandberg, G.; Soja, M.J. Biomass retrieval algorithm based on P-band biosar experiments of boreal forest. In Proceedings of the IEEE International Geoscience and Remote Sensing Symposium (IGARSS), Vancouver, BC, Canada, 24–29 July 2011; pp. 4245–4248.
  33. Tebaldini, S.; Rocca, F. Multibaseline polarimetric SAR tomography of a boreal forest at P-and L-bands. IEEE Trans. Geosci. Remote Sens. 2012, 50, 232–246. [Google Scholar] [CrossRef]
  34. Santi, E.; Pettinato, S.; Paloscia, S.; Castracane, P.; Di Giammatteo, U. CATARSI—Cap and trade assessment by remote sensing investigation: An algorithm for crop and forest biomass estimate. In Proceedings of the IEEE International Geoscience and Remote Sensing Symposium (IGARSS), Quebec City, QC, Canada, 13–18 July 2014; pp. 733–736.
  35. Lee, S.K.; Kugler, F.; Papathanassiou, K.; Hajnsek, I. Polarimetric SAR interferometry for forest application at P-band: Potentials and challenges. In Proceedings of the IEEE International Geoscience and Remote Sensing Symposium, IGARSS 2009, Cape Town, South Africa, 12–17 July 2009; Volume 4, pp. 13–16.
  36. Neumann, M.; Saatchi, S.S.; Ulander, L.M.; Fransson, J.E. Parametric and non-parametric forest biomass estimation from PolInSAR data. In Proceedings of the IEEE International Geoscience and Remote Sensing Symposium (IGARSS), Vancouver, BC, Canada, 24–29 July 2011; pp. 420–423.
  37. Freeman, A.; Durden, S. A three-component scattering model for polarimetric SAR data. IEEE Trans. Geosci. Remote Sens. 1998, 36, 963–973. [Google Scholar] [CrossRef]
  38. Park, S.E.; Moon, W.M.; Pottier, E. Assessment of scattering mechanism of polarimetric SAR signal from mountainous forest areas. IEEE Trans. Geosci. Remote Sens. 2012, 50, 4711–4719. [Google Scholar] [CrossRef]
Figure 1. The test site selected from the BIOSAR 2008 campaign (From Google Earth). The star in the border map indicates the location of study area. The red rectangle indicates the covering area of the E-SAR data.
Remotesensing 08 00291 g001
Figure 2. The RMSE of inversed height for different forest stand density from the simulated data with reference height of 10 m (line with plus), 14 m (line with circle), and 18 m (line with asterisk).
Remotesensing 08 00291 g002
Figure 3. Correlation between the ground-to-volume scattering ratio and density from the simulated data with reference height of 10 m.
Remotesensing 08 00291 g003
Figure 4. Forest height map of the test site and the location of the selected forest stands. The numbers in the red polygons indicate the sample forest stands with field investigations.
Remotesensing 08 00291 g004
Figure 5. The ground phase (a); the reference phase (b) generated by LiDAR DEM and the phase profiles (c) of the black dashed lines in (a) and (b).
Remotesensing 08 00291 g005aRemotesensing 08 00291 g005b
Figure 6. The ground phase (a); the reference phase (b) generated by LiDAR DEM which are unwrapped; and the contrast of the profiles (c) shown as the black dashed lines in (a) and (b).
Remotesensing 08 00291 g006
Figure 7. The coherence line fitted by using the total least squares linear fitting method. (a) Low density; (b) high density.
Remotesensing 08 00291 g007
Figure 8. Relative height of phase centers for different density.
Remotesensing 08 00291 g008
Table 1. Main parameters of the simulated data of forest with PolSARpro Forest Simulator. Three datasets with reference height of 10 m, 14 m, and 18 m were simulated.
Platform Altitude3000 m
Horizontal Baseline10 m
Vertical Baseline1 m
Incidence Angle45°
Center Frequency1.5 GHz
Tree SpeciesPine
Reference Height10 m, 14 m, and 18 m
Table 2. Assessment of forest stand height inversion errors from the three-stage inversion method.
Forest Stand NumberForest Stand Density (stems/Ha)Average Height from LiDAR(m)Average Height from the Three-Stage Method (m)RMSE (m)
368963320.7116.394.56
411592519.4917.693.87
36169149817.1715.173.76
18147182717.6315.773.13
Table 3. Assessment of the ground phase estimation errors for different density.
Forest Stand Number368941153616918147
Forest Stand Density (stems/Ha)63392514981827
RMSE (rad)0.260.220.150.14
Table 4. Discrete degree of phase centers for different forest density.
Forest Stand Number368941153616918147
Forest stand density (stems/Ha)63392514981827
STD0.0750.0950.1260.143

