Article

Early Detection and Quantification of Almond Red Leaf Blotch Using High-Resolution Hyperspectral and Thermal Imagery

by
Manuel López-López
1,
Rocío Calderón
1,*,
Victoria González-Dugo
1,
Pablo J. Zarco-Tejada
1 and
Elías Fereres
2
1
Instituto de Agricultura Sostenible (IAS), Consejo Superior de Investigaciones Científicas (CSIC), Alameda del Obispo s/n, 14004 Córdoba, Spain
2
Department of Agronomy, University of Córdoba (UCO), Campus Universitario de Rabanales, 14014 Córdoba, Spain
*
Author to whom correspondence should be addressed.
Remote Sens. 2016, 8(4), 276; https://doi.org/10.3390/rs8040276
Submission received: 23 December 2015 / Revised: 10 February 2016 / Accepted: 21 March 2016 / Published: 25 March 2016

Abstract

:
Red leaf blotch is one of the major fungal foliar diseases affecting almond orchards. High-resolution thermal and hyperspectral airborne imagery was acquired from two flights and compared with concurrent field visual evaluations for disease incidence and severity. Canopy temperature and vegetation indices were calculated from thermal and hyperspectral imagery and analyzed for their ability to detect the disease at early stages. The classification methods linear discriminant analysis and support vector machine, using linear and radial basis kernels, were applied to a combination of these vegetation indices in order to quantify and discriminate between red leaf blotch severity levels. Chlorophyll and carotenoid indices and chlorophyll fluorescence were effective in detecting red leaf blotch at the early stages of disease development. Linear models showed higher power to separate between asymptomatic trees and those affected by advanced stages of disease development while the non-linear model was better in discriminating asymptomatic plants from those at early stages of red leaf blotch development. Leaf-level measurements of stomatal conductance, chlorophyll content, chlorophyll fluorescence, photochemical reflectance index, and spectral reflectance showed no significant differences between healthy leaves and the green areas of symptomatic leaves. This study demonstrated the feasibility of early detecting and quantifying red leaf blotch using high-resolution hyperspectral imagery.

Graphical Abstract

1. Introduction

Red leaf blotch of almond (Prunus amigdalus) is a fungal foliar disease widely extended throughout almond production regions of Europe and Asia and it is considered of high economic importance [1,2,3]. Nowadays, the spread of almond red leaf blotch is increasing in importance in Spain [4] due to the intensification of production in recently-planted almond orchards, i.e., incorporation of new varieties, irrigation, higher tree density, light pruning, and occupation of sites with temperate climate that could be advantageous for the disease development [5]. There are noticeable cultivar differences in genetic resistance to the disease, this being a crucial factor determining its potential impact on almond production. Some varieties such as Guara and Tarraco are considered very susceptible, while Vayro and Constantí have shown high resistance [5].
Red leaf blotch disease is caused by the fungus Polystigma amygdalinum PF Cannon (Phyllachoraceae), formerly known as Polystigma ochraceum [2], which is mainly present in the Mediterranean Basin [2]. As the other species of the same genus, in their teleomorph phase, it forms brightly colored stromata on living leaves and overwinters as a saprophyte on fallen ones. It is on these fallen leaves where the fungus forms reproductive structures that will release ascospores the following spring, the maximum discharge occurring at petal fall [3,
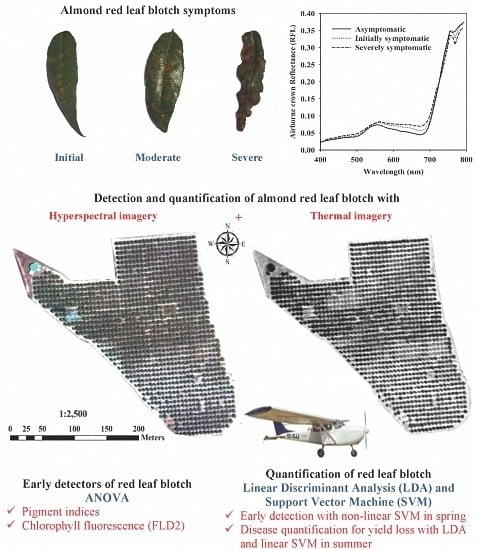
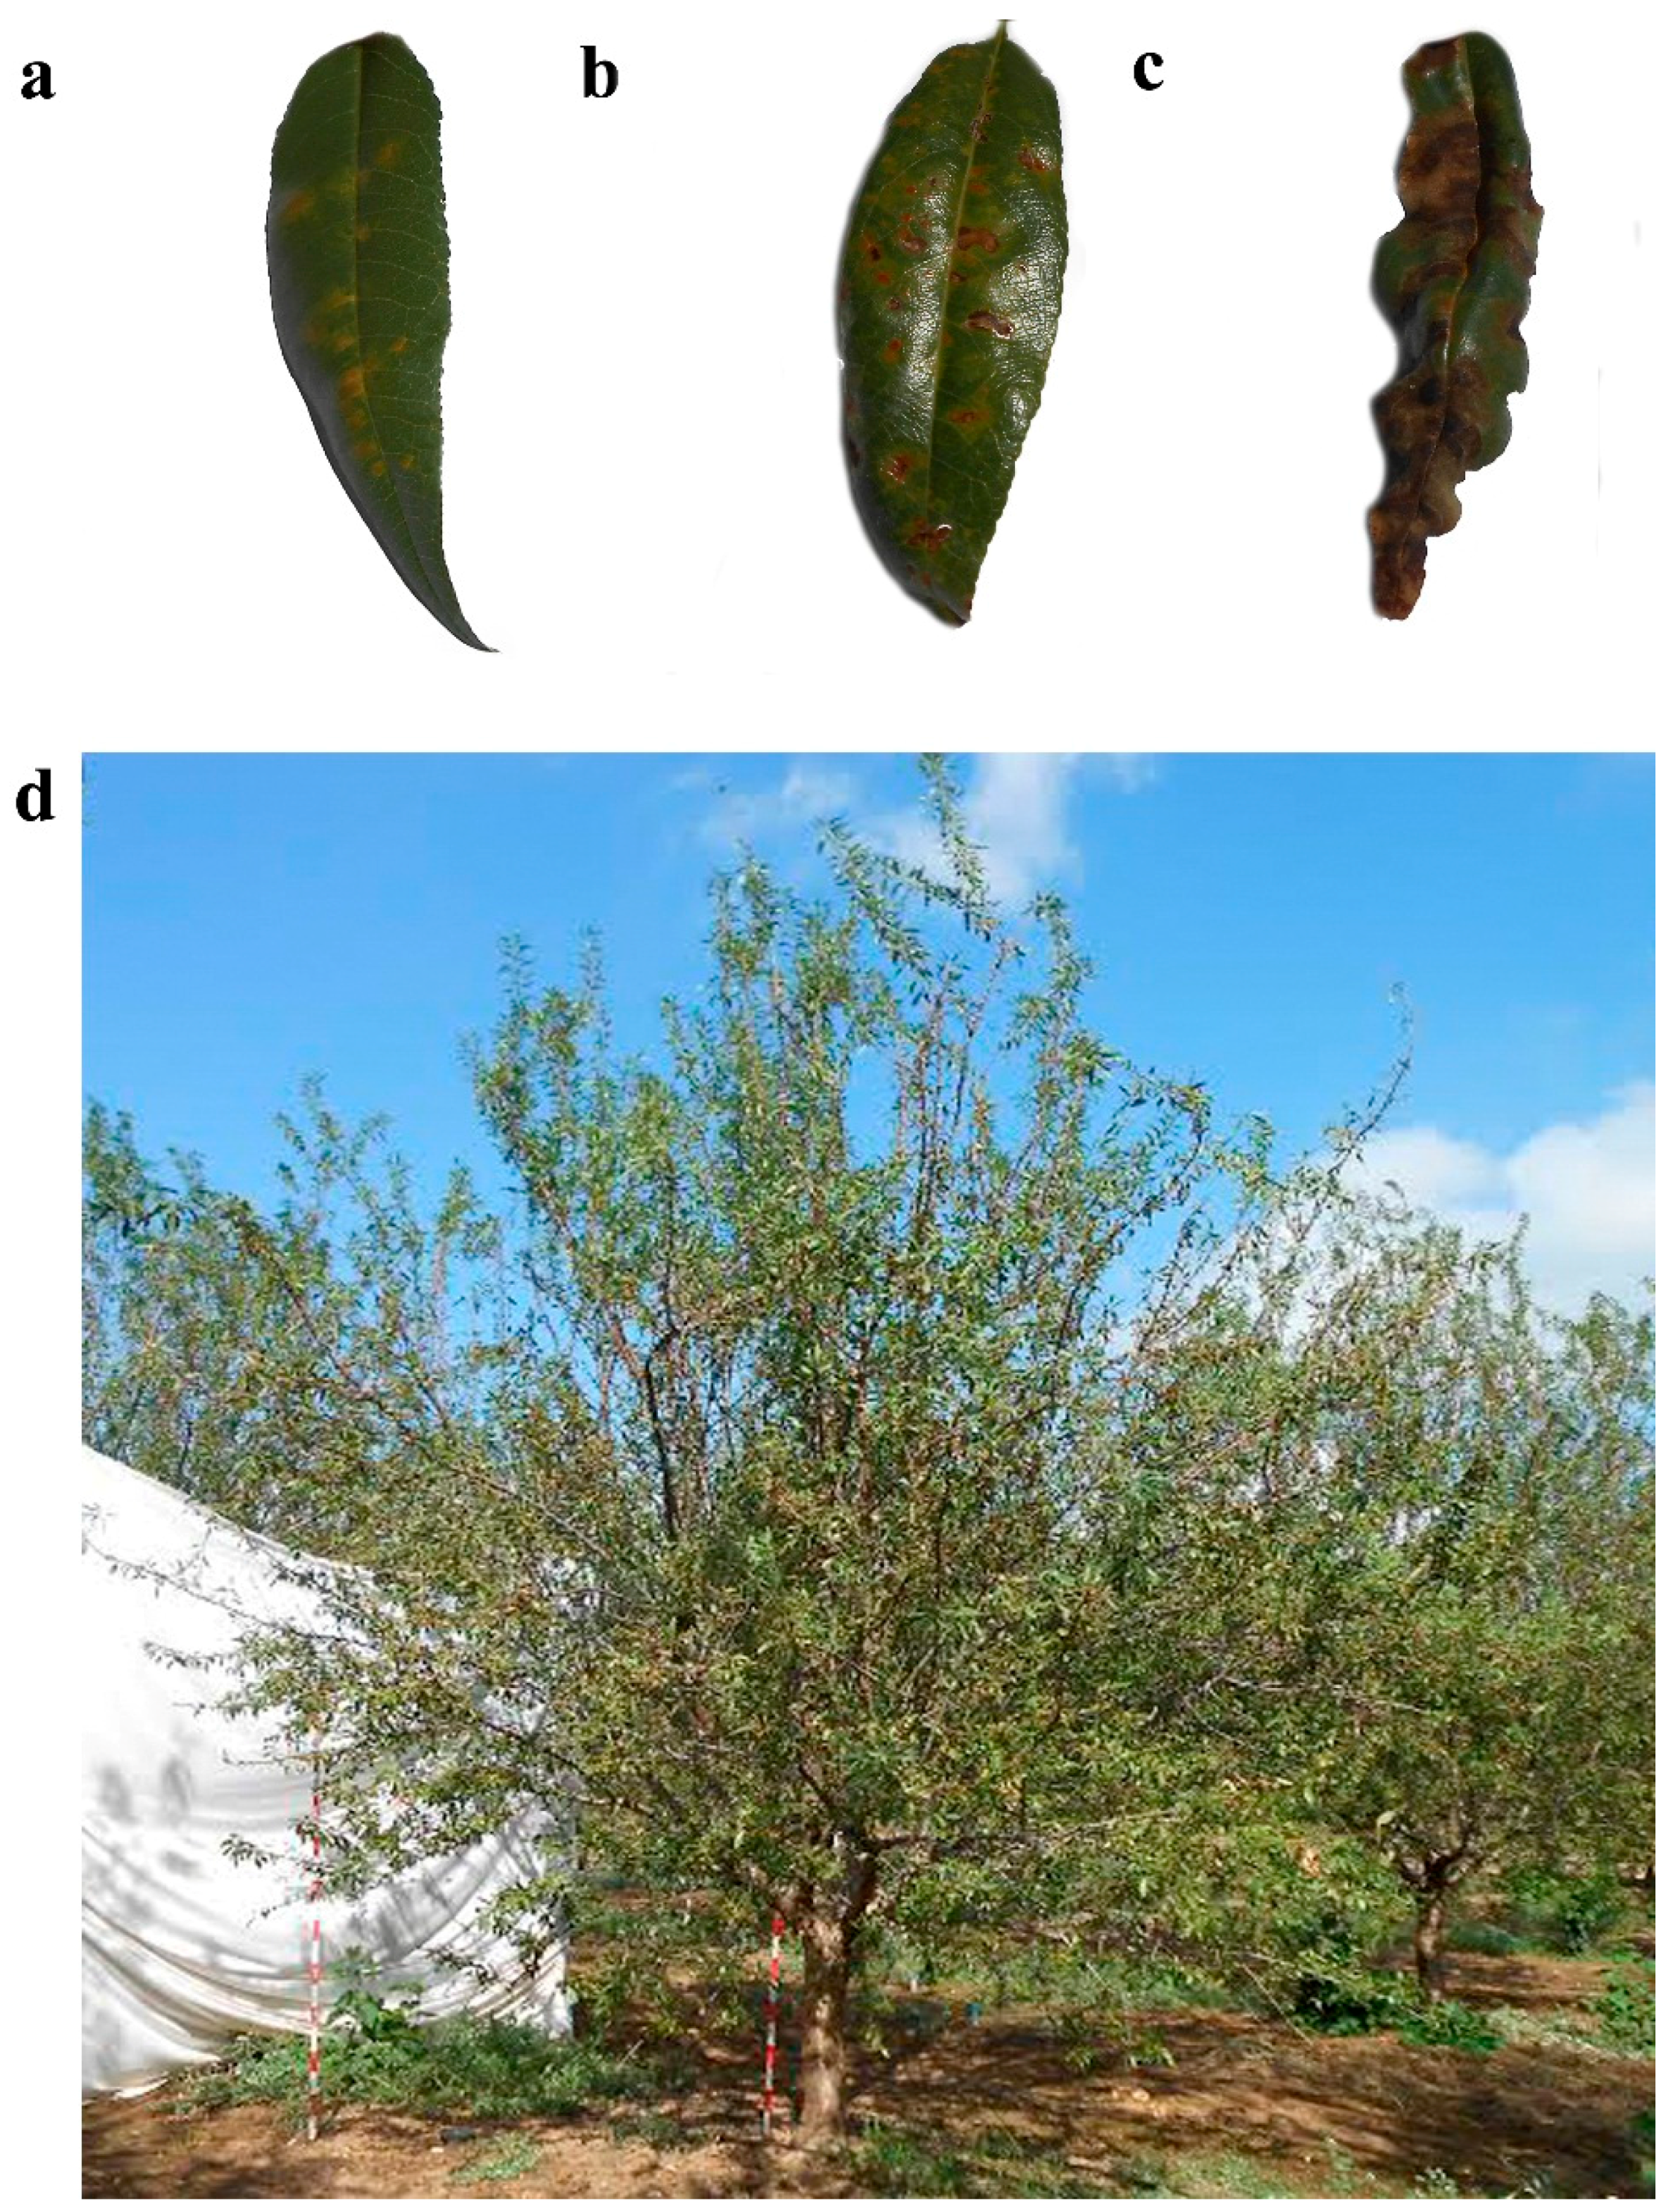
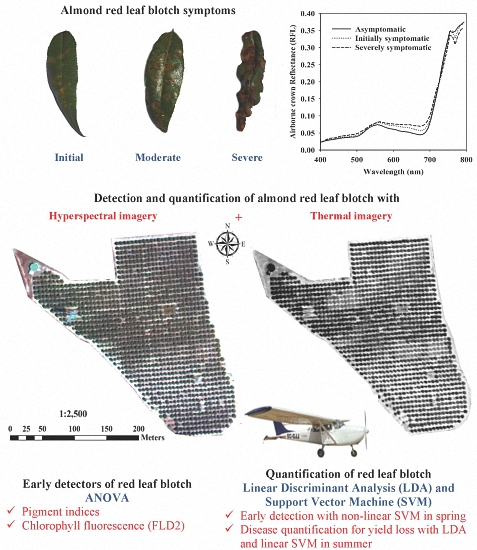
6]. Such released spores begin the infection of young leaves; thus, the removal of fallen leaves is recommended as a cultural means of disease control. Symptoms start as pale green spots on both sides of the leaves, and turn into yellowish-orange afterwards (Figure 1a). Spots grow in size throughout the spring and end up covering almost the whole leaf surface in late summer (Figure 1b). Conidia formed in summer are not known to have a relevant impact on the epidemic [7]. At advanced stages of disease development, leaves curl and become necrotic (Figure 1c). Red leaf blotch can lead to a premature defoliation (Figure 1d) [2,3], hence causing a decrease in photosynthetic capacity and, thus, possibly affecting yield [3,4]. Although triforine, a systemic active ingredient, has been proven to be effective against P. amygdalinum [6], until now disease control is mainly based on the application of preventive fungicides at petal fall, vegetative bud break and leaf sprout stages [4]. Remote sensing could be used to map fields and identify areas with little or no red leaf blotch incidence and, therefore, limit the fungicide applications under precision agriculture strategies. Furthermore, research on new, effective systemic fungicides for disease control could take advantage of early detection via remote sensing by restricting the use of pesticides to areas of the fields where it would be required.
Remote sensing methods have been used to detect the effects of foliar diseases on plant responses, such as changes in leaf color due to pigment degradation, reduction in green canopy biomass, and an increase of canopy temperature because of lower transpiration rates [8]. Indeed, remote sensing has already been used to detect, monitor, and quantify a variety of diseases in different crops, and several reviews are available [8,9,10,11]. The majority of these studies are focused on foliar pathogens in annual crops, such as powdery mildew, downy mildew, and leaf rust. These diseases show characteristic leaf color changes caused by a reduction of pigments that absorb light, thus increasing reflectance in the visible region. Moreover, plants infected by foliar pathogens reveal a decrease in green biomass detectable through a reduction in the near-infrared region. These disease effects associated with pigment degradation and structural changes can be detected by multispectral and hyperspectral imagery. Multispectral imagery enabled the detection of downy mildew in opium poppy [12], and powdery mildew and leaf rust in wheat [13], while hyperspectral technology was used at the leaf level for early detection [14] and quantification of Cercospora leaf spot, leaf rust, and powdery mildew in sugar beet [15], as well as to discriminate among yellow, leaf and stem rust in wheat [16]. Although much less information exists on the use of multispectral imagery for detecting diseases in tree crops, a recent study realized early detection of laurel wilt in avocado trees using vegetation indices related to pigment content and crown structure [17]. Hyperspectral airborne sensors have been successfully used to detect a root disease caused by Verticillium dahliae in olive trees [18,19] and the citrus greening disease (Huanglongbing) [20,21,22]. Other approaches have included the use of thermal imagery, which is particularly suitable to detect lower transpiration rates caused by root diseases [18,19].
To our knowledge, no previous studies using remote sensing for detection of red leaf blotch in almond have been published. The hypotheses of the current study were, on the one hand, that red leaf blotch symptoms were related to physiological changes at the canopy level that can be detected using high-resolution hyperspectral and thermal imagery, and, on the other hand, that the fungus affects only the symptom-bearing leaf areas while the green parts of infected leaves may continue to function normally. Therefore, the objectives of this study were (i) to early detect and quantify the incidence and severity of almond red leaf blotch using high-resolution hyperspectral and thermal imagery; and (ii) to assess the effects of P. amygdalinum infection on some physiological variables at the leaf level.

2. Materials and Methods

2.1. Study Site Description

The experimental area was located in Córdoba, in Southern Spain, a region of Mediterranean climate characterized by warm and dry summers and cool and wet winters, with an average annual rainfall exceeding 550 mm. The study was conducted in a 5.5-ha cv. Guara almond orchard at Alameda del Obispo Research Station (37°52’N, 4°49’W). The orchard was drip irrigated with two laterals per tree row and conventionally managed: no soil ploughing, weed control through herbicide applications and weeding machine passes and pest and disease control following a fungicide-and-insecticide application calendar. The orchard became naturally infected by P. amygdalinum. The fungicide applications based on thiram and captan were not enough for complete control of red leaf blotch in 2014. Consequently, the field showed a range of levels of disease incidence and severity.
Spring of 2014 was characterized by a precipitation of 93 mm, which was temporally-distributed along the spring period, and an average temperature of 17 °C, with temperatures from 10 °C in March to 25 °C in May [23].

2.2. Leaf-Level Measurements

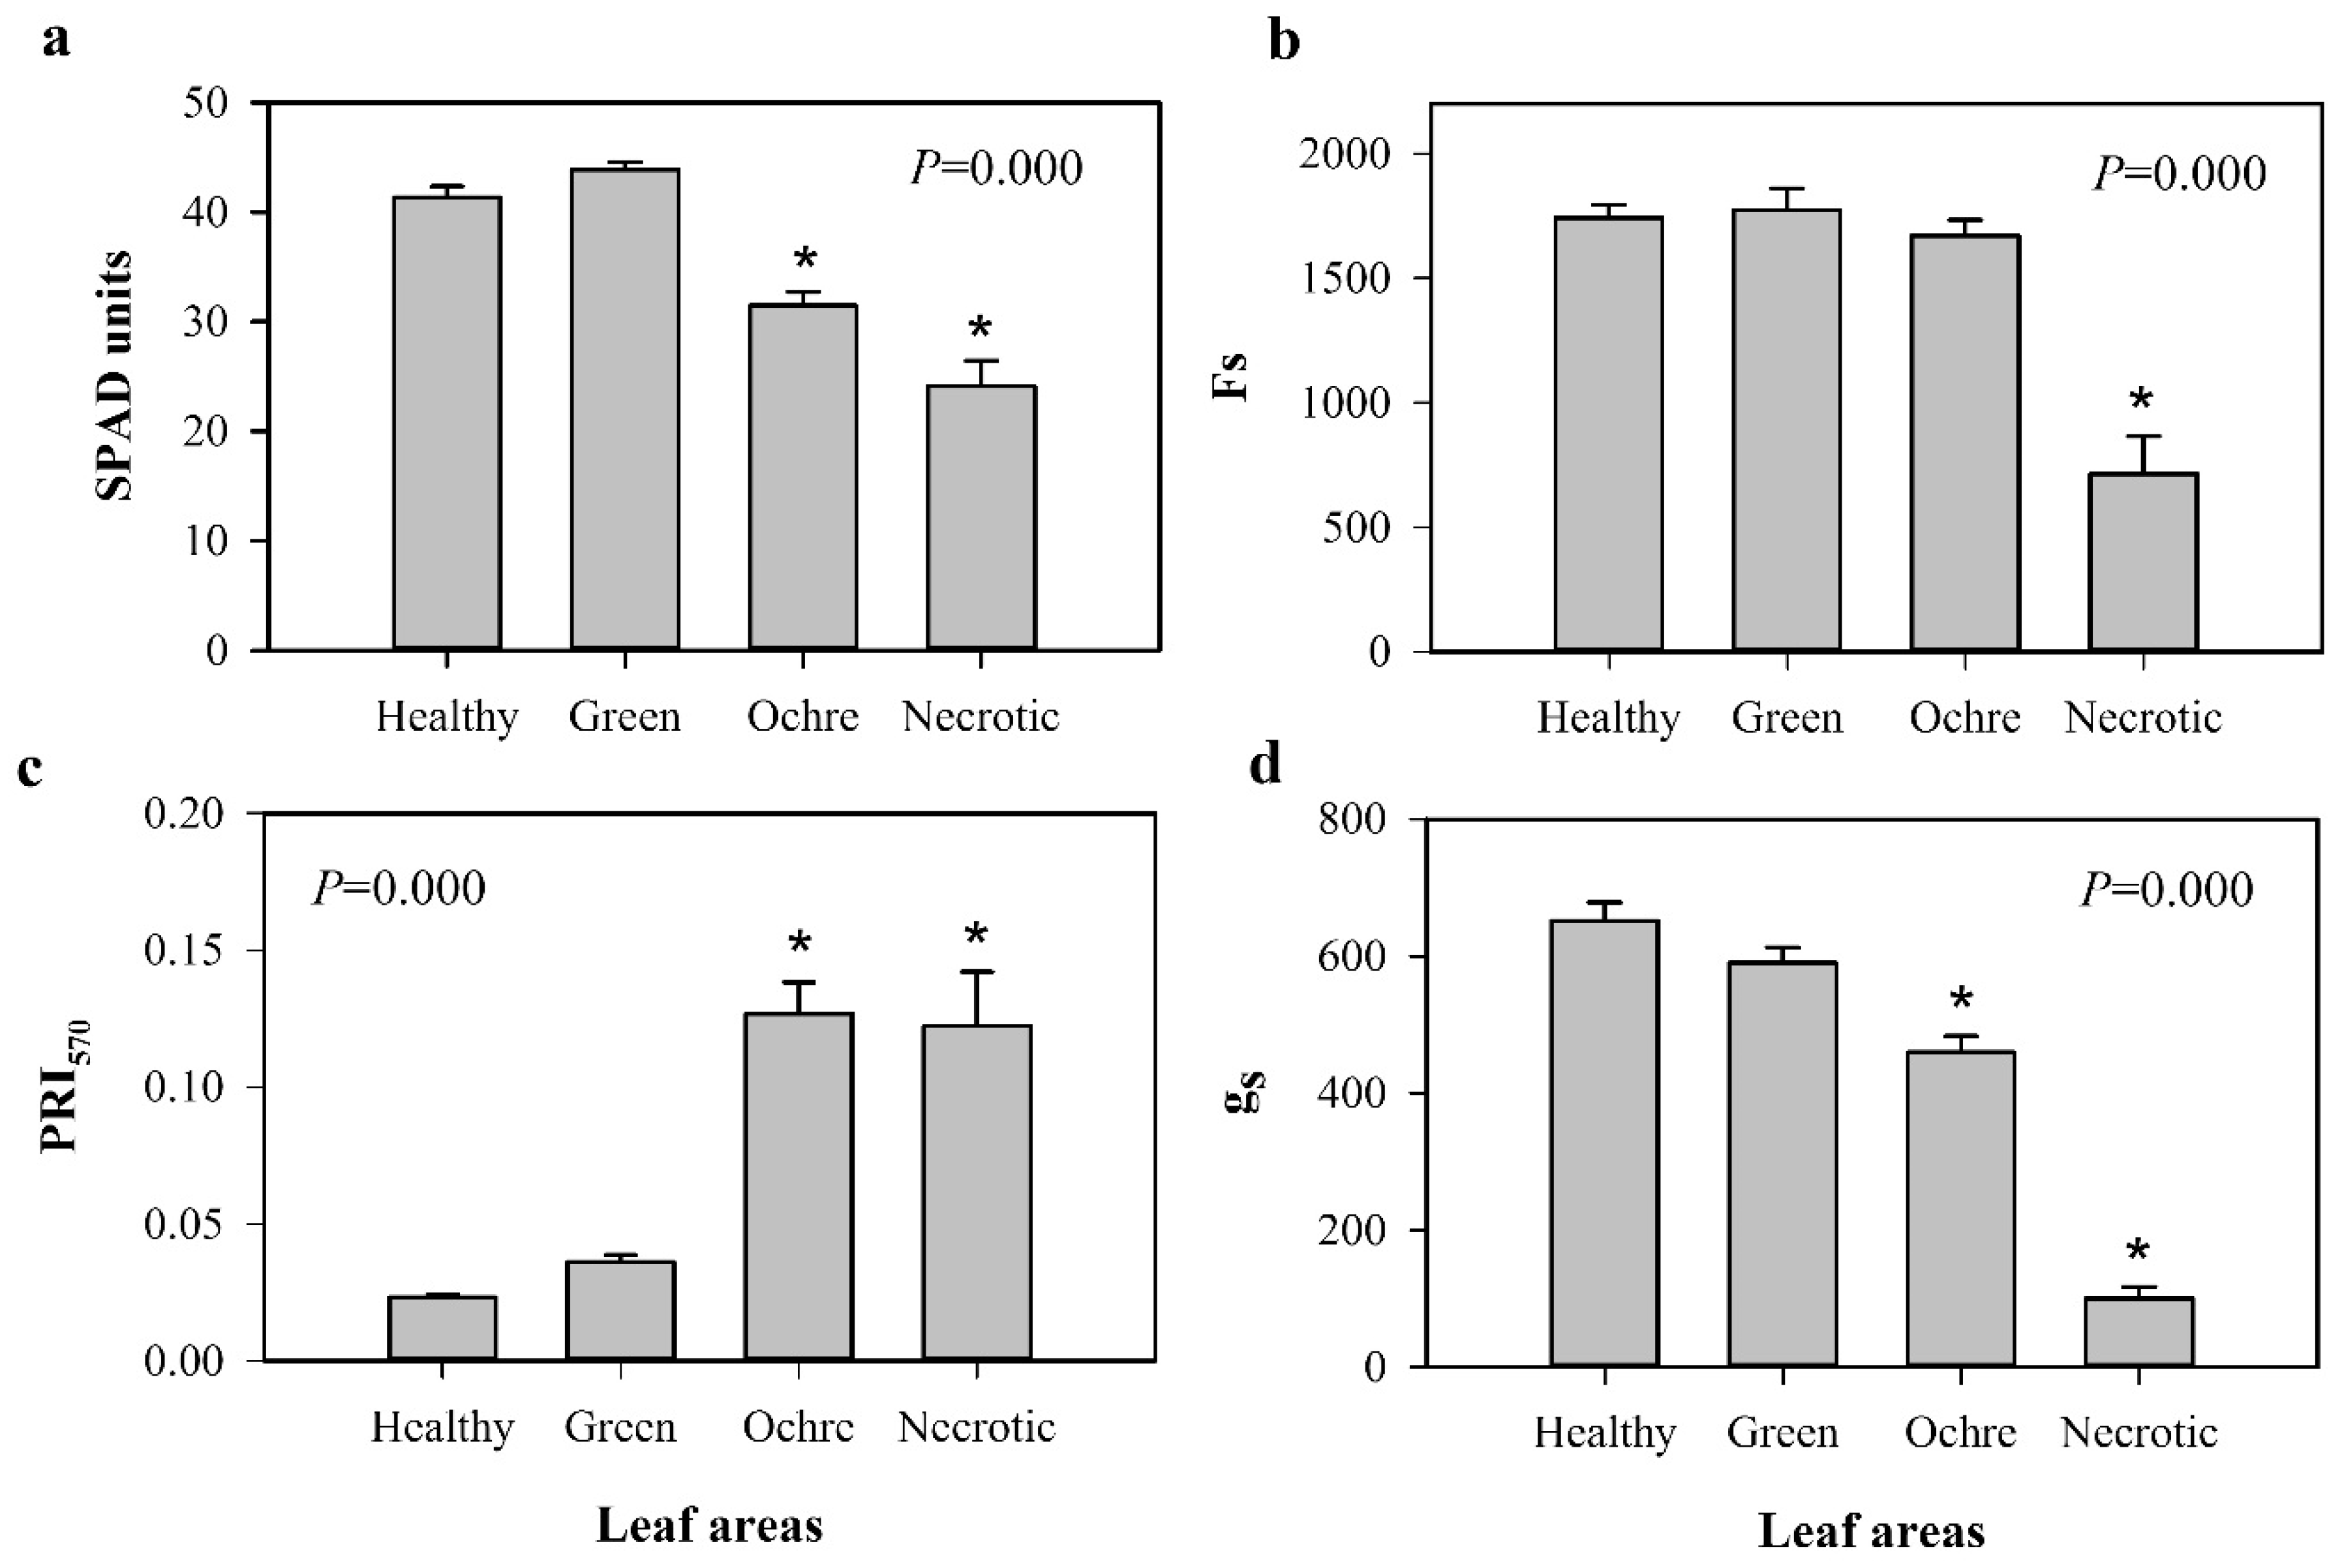
One infected tree was chosen for detailed leaf measurements in order to avoid tree-to-tree variations. Chlorophyll meter readings (SPAD units), chlorophyll fluorescence (Fs), photochemical reflectance index (PRI570), and stomatal conductance (gs) were measured on 24 asymptomatic, 29 ochre, and nine necrotic areas in affected leaves, and 20 locations within healthy leaves, located in the same stems as the affected leaves.
Chlorophyll content was measured with a chlorophyll meter (SPAD 502 Plus Chlorophyll Meter, Spectrum Technologies, Inc., Aurora, IL, USA), which was used preferentially because of the strong relationship between its digital readings and real leaf chlorophyll content, as demonstrated by several authors (e.g., [24,25]). Steady-state chlorophyll fluorescence and PRI570 data were taken with instruments designed to measure chlorophyll fluorescence (FluorPen FP 100, Photon Systems Instruments, Drasov, Czech Republic), and R531 and R570 spectral bands with a bandwidth of 10 nm (PlantPen PRI 200, Photon Systems Instruments, Drasov, Czech Republic), respectively. For stomatal conductance measurements, a steady-state diffusion porometer (model SC-1, Decagon Devices, Washington, DC, USA) was employed. These devices have been successfully used for the detection of Verticillium wilt in olive plants at leaf level under controlled conditions [26]. Measurements were taken on fully-expanded sunny leaves according to operational requirements of the devices, between 11:30 and 12:30 GMT (so that there were no noticeable variations in sun radiation intensity), on 18 July. Measured leaves were 1–1.5 meters high in the canopy.
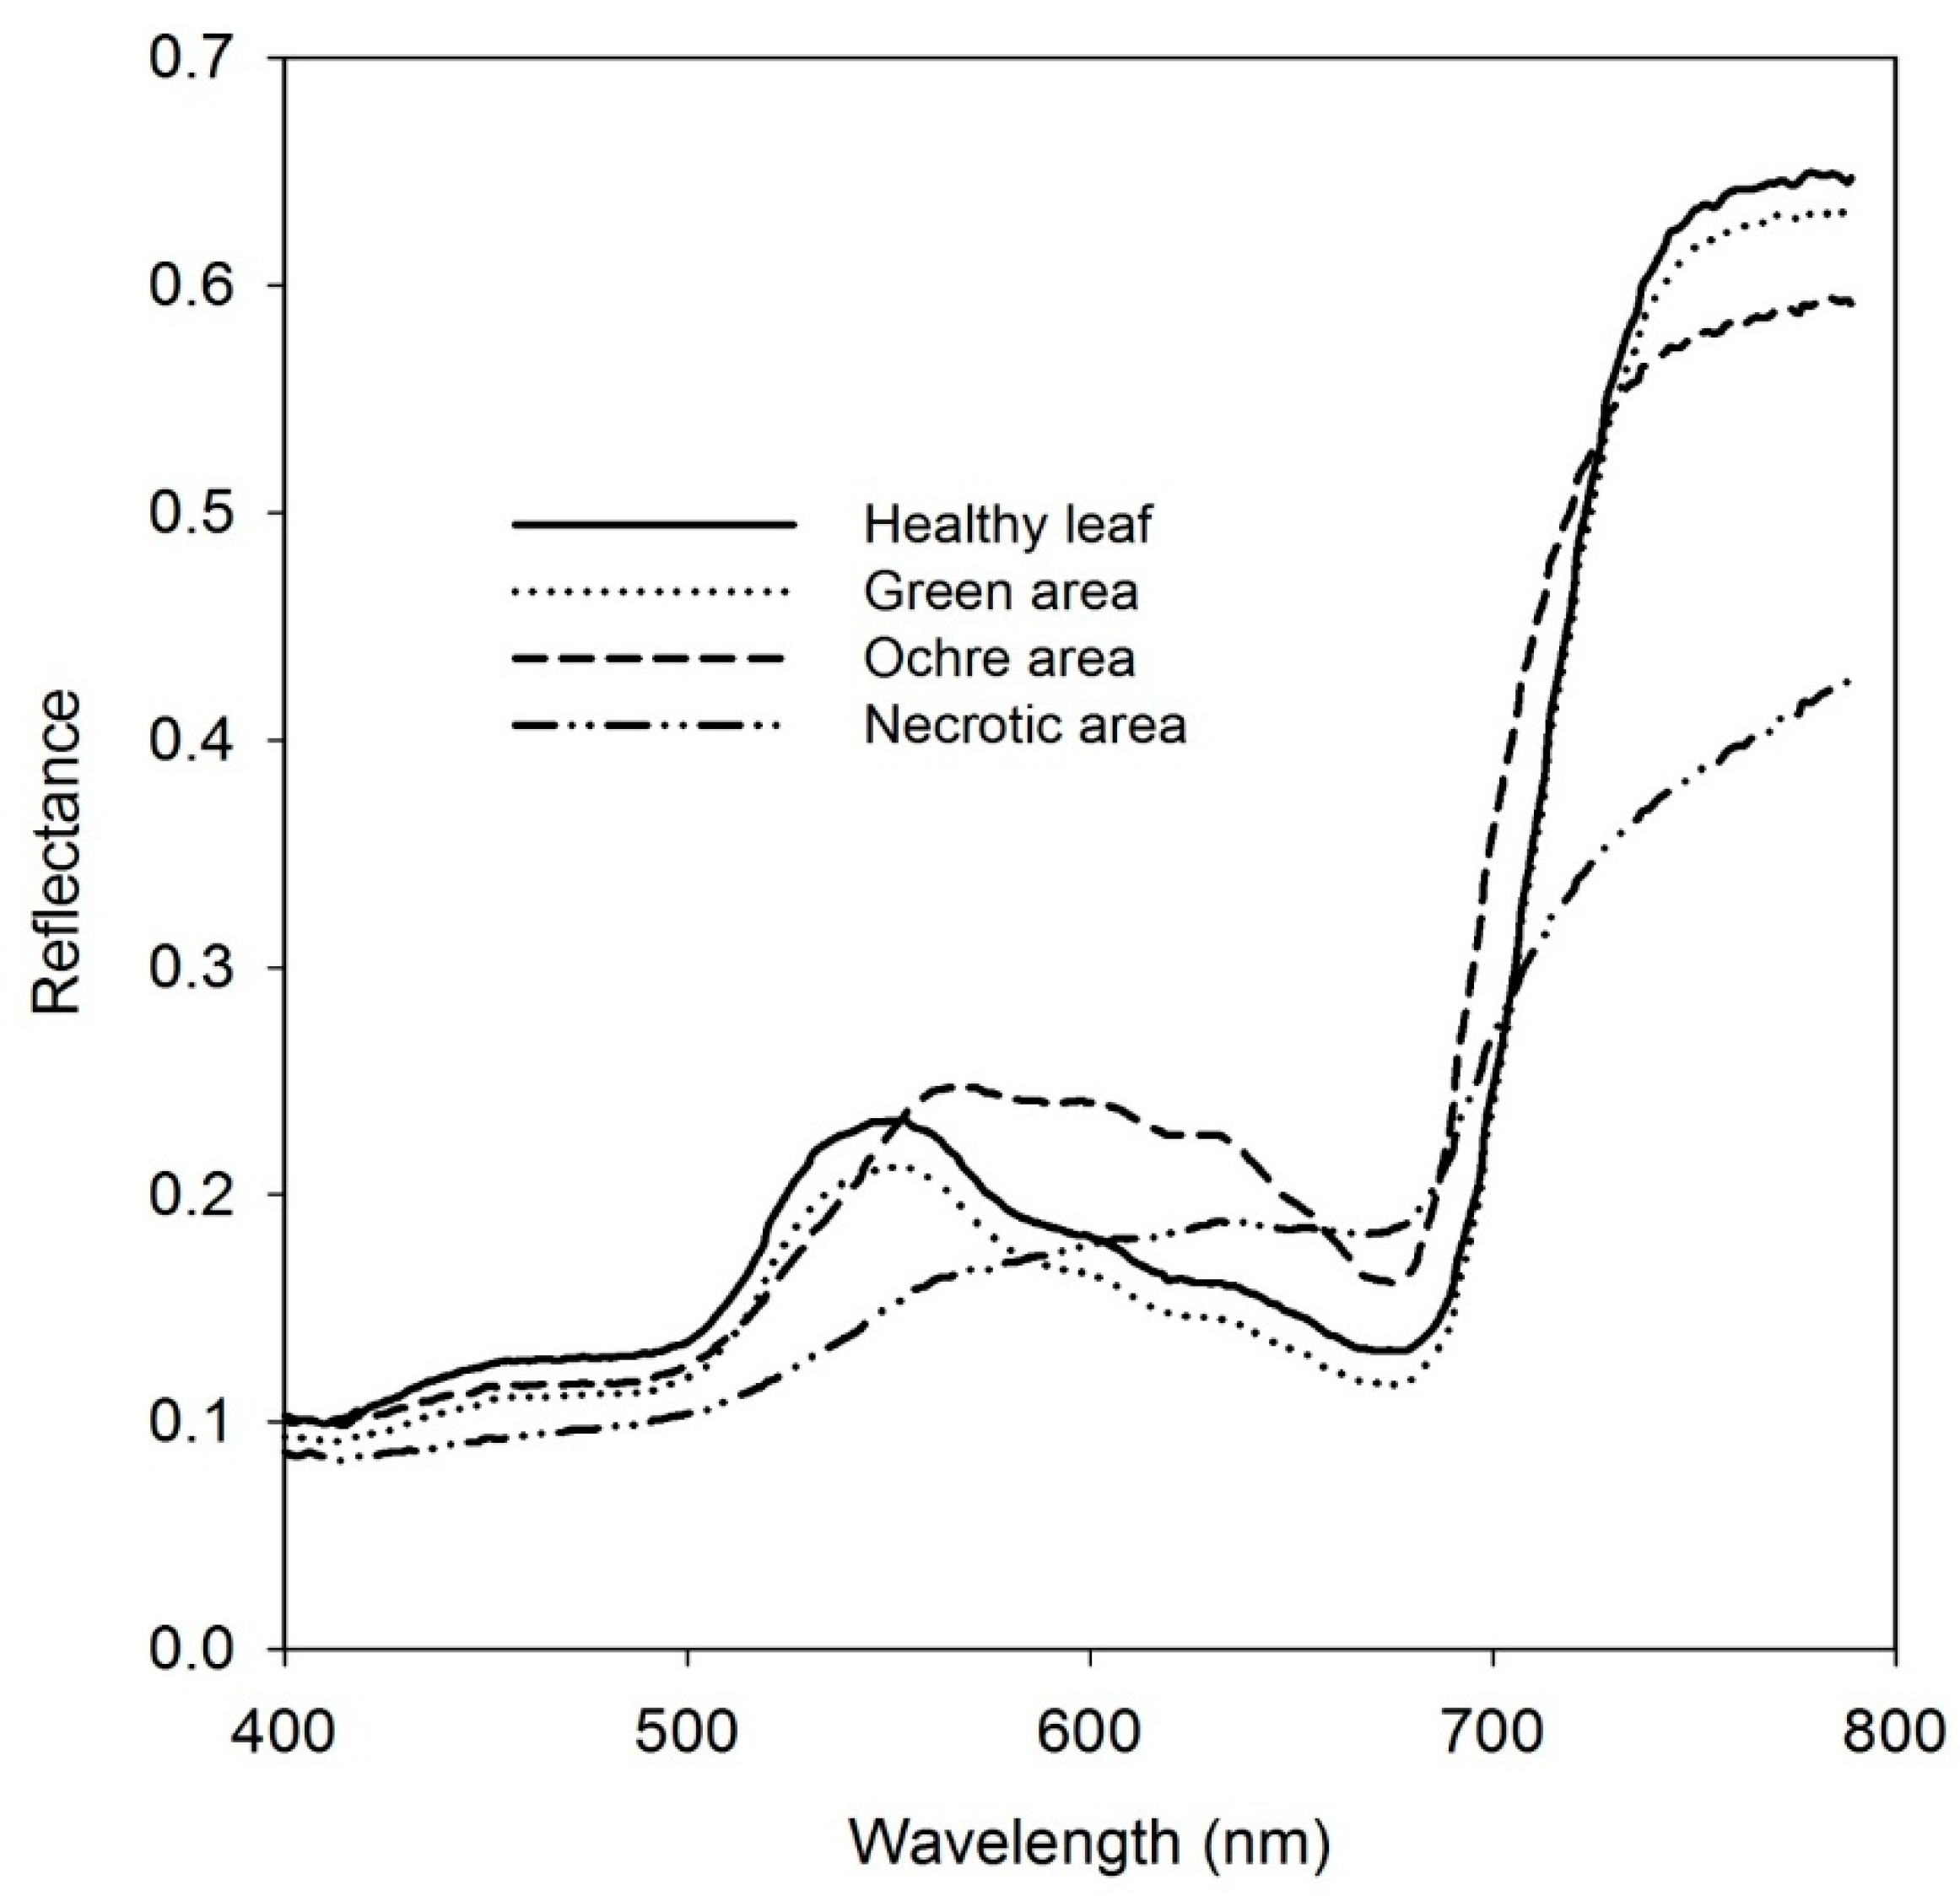
Spectral reflectance within the visible and near-infrared regions was measured on 11 asymptomatic, 11 ochre, and 10 necrotic areas in affected leaves, and on six locations within healthy leaves nearby with a device designed for measuring spectral reflectance on flat leaves (PolyPen RP400, Photon Systems Instruments, Drasov, Czech Republic), operating in the spectral mode of 256 bands in the 400–790 nm region with 8 nm FWHM. Average values of spectral reflectance for asymptomatic leaves and green, ochre, and necrotic areas of symptomatic leaves resulted in the spectrum shown in Figure 2. Moreover, data coming from PolyPen measurements were used to calculate pigment (chlorophyll, carotenes, and xanthophyll) indices as well as visible R/G/B ratios and disease-related indices (Table 1).

2.3. Disease Assessment at Tree Crown Level

Red leaf blotch incidence and severity were assessed by visually inspecting 52 almond trees for disease symptoms described above on 11 and 30 July 2014, the same days when the two flights took place. Disease severity was evaluated by visual observation of foliar symptoms in each individual tree and rated on a 0–3 rating scale according to the percentage of foliage with disease symptoms, where: 0 = 0% (asymptomatic tree), 1 = 1% to 10% (initially symptomatic), 2 = 11% to 50% (moderately symptomatic), and 3 = 51% to 100% (severely symptomatic). Four operators performed the evaluation over the 52 almond trees. The observations from the operators that recorded the highest and lowest overall evaluations were discarded, and as a result, the final score was obtained by averaging the observations from the two remaining operators.
The disease developed unevenly throughout the field, some trees showing very advanced stages while others were unaffected or with only initial symptoms at the end of summer. Generally, the first pale-green spots appeared in mid-March and turned ochre by the end of the month. Throughout the spring, ochre spots continued to appear, growing in size and merging with other spots. The symptoms were usually more visible in the inner and lower parts of the canopy. The first necrotic lesions appeared in early May. At the end of June, the youngest stems and leaves were the only asymptomatic parts of the most severely affected trees. Among the 52 trees evaluated on 11 July, there were 16 asymptomatic trees (30.8% of the total evaluated trees), 16 presenting red leaf blotch disease at its initial stage (30.8%), 14 with moderate symptoms (26.9%), and six were severely affected (11.5%). On 30 July, the tree ratings frequencies were of 14 (26.9%), 10 (19.2%), 17 (32.7%), and 11 (21.2%), respectively.

2.4. Airborne Imagery

Imagery was acquired from the study site on 11 and 30 July 2014 using a hyperspectral sensor and a thermal camera on board a Cessna aircraft operated by the Laboratory for Research Methods in Quantitative Remote Sensing of the Consejo Superior de Investigaciones Científicas (Quantalab, IAS-CSIC, Spain). Both cameras were flown at 550 m above ground level (AGL) at 10:00 GMT on both dates to minimize differences due to sun angle effects between airborne flights. Hyperspectral and thermal imagery were acquired at 30 cm and 40 cm pixel resolution, respectively.
The hyperspectral sensor used in this experiment was the visible and near-infrared micro-hyperspectral imager (Micro-Hyperspec VNIR model, Headwall Photonics, Fitchburg, MA, USA) operating in the spectral mode of 260 bands at 1.85 nm/pixel and 12-bit radiometric resolution, yielding 6.4 nm FWHM with a 25-micron slit in the 400–885 nm region. Frame storage rate on board the aircraft was set to 50 fps (frames per second) with 18 ms integration time. The 8-mm focal length lens yielded an IFOV of 0.93 mrad and an angular FOV of 49.82°. The hyperspectral sensor was radiometrically calibrated in the laboratory with an integrating sphere (CSTMUSS2000C Uniform Source System, LabSphere, North Sutton, NH, USA) using coefficients derived from a calibrated uniform light source at four illumination and six integration times. Atmospheric correction enabled the conversion of radiance values to reflectance using total incoming irradiance simulated with the SMARTS model [27,28] and the aerosol optical depth was measured at 550 nm with a Micro-Tops II sunphotometer (Solar LIGHT Co., Philadelphia, PA, USA) at the study site concurrently with the flight. Ortho-rectification of the hyperspectral imagery was performed with PARGE (ReSe Applications Schläpfer, Wil, Switzerland), using inputs from an inertial measuring unit (IMU) (MTiG model, Xsens, Enschede, The Netherlands) installed onboard and synchronized with the micro-hyperspectral imager.
The narrow-band indices described in Table 1 were calculated from the mean radiance and reflectance spectra obtained from the 260 spectral bands acquired by the hyperspectral imager [29,30,31,32,33,34,35,36,37,38,39,40,41,42,43,44,45,46,47,48,49,50,51,52,53,54,55,56,57]. Many of these indices have been shown to be closely related to specific features of leaf physiology [18,19], thus, according to the effects of red leaf blotch on almond trees, namely, a decrease in green leaf biomass, pigment degradation, leaf color changes, and an expected increase of fluorescence emission by PS-I photosystem, we selected five types of indices related to: (i) structural effects; (ii) pigment concentration (chlorophyll, carotenoid and xanthophyll); (iii) blue/green/red ratios; (iv) chlorophyll fluorescence, and (v) spectral disease indices.
The fluorescence emission was assessed from the radiance spectra by the Fraunhofer Line Depth (FLD) principle calculated from a total of two bands for the in (L762 nm) and out band of the O2-A feature (L750 nm) (FLD2), using the equation described by Zarco-Tejada et al. [54].
The thermal camera used in the two flights (FLIR SC655, FLIR Systems, Wilsonville, OR, USA) has a 640 × 480 pixel resolution and was equipped with a 24.5 mm f1.0 lens, connected to a computer via USB 2.0 protocol. This camera has a spectral response in the range of 7.5–13 µm and operates with a thermoelectric cooling stabilization, giving us a high sensitivity below 50 mK. Radiometric calibration was conducted in the laboratory using a black body (model P80P, Land Instruments, Dronfield, UK) at varying target and ambient temperatures and through vicarious calibrations using surface temperature measurements [19]. Canopy temperature (Tc), extracted from thermal imagery, minus air temperature (Ta) was calculated as a water stress indicator of almond trees (Tc-Ta).
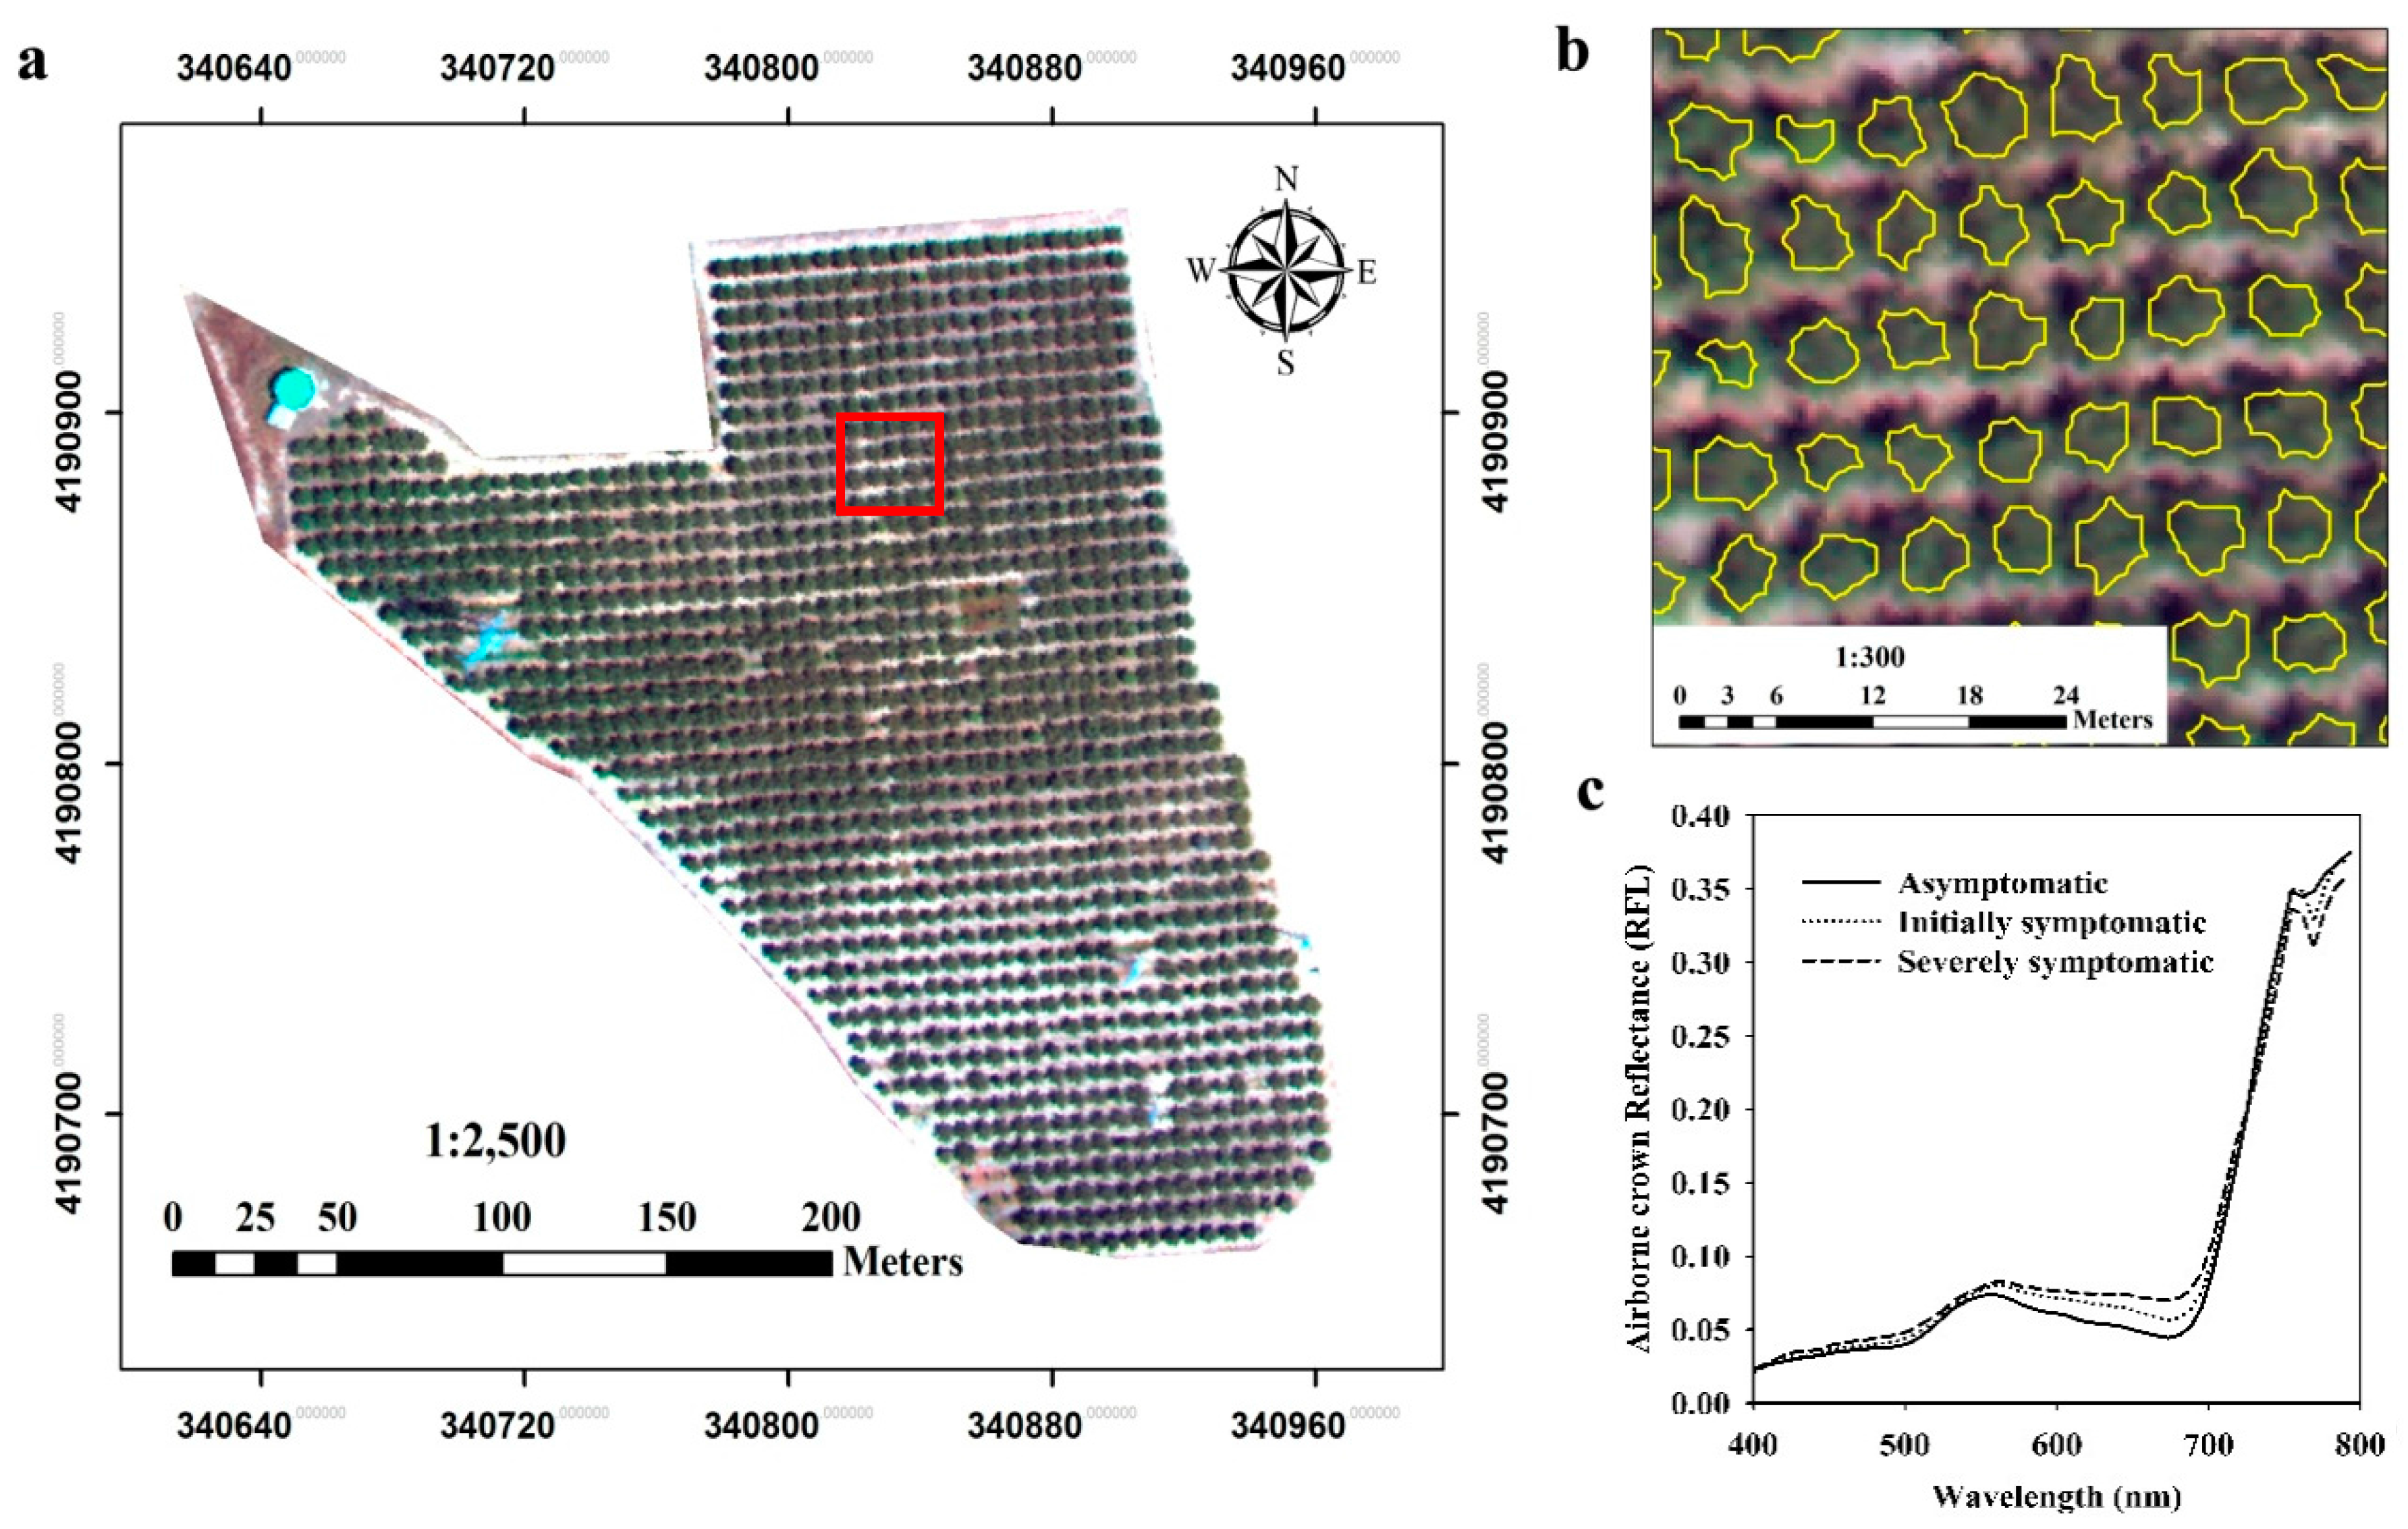
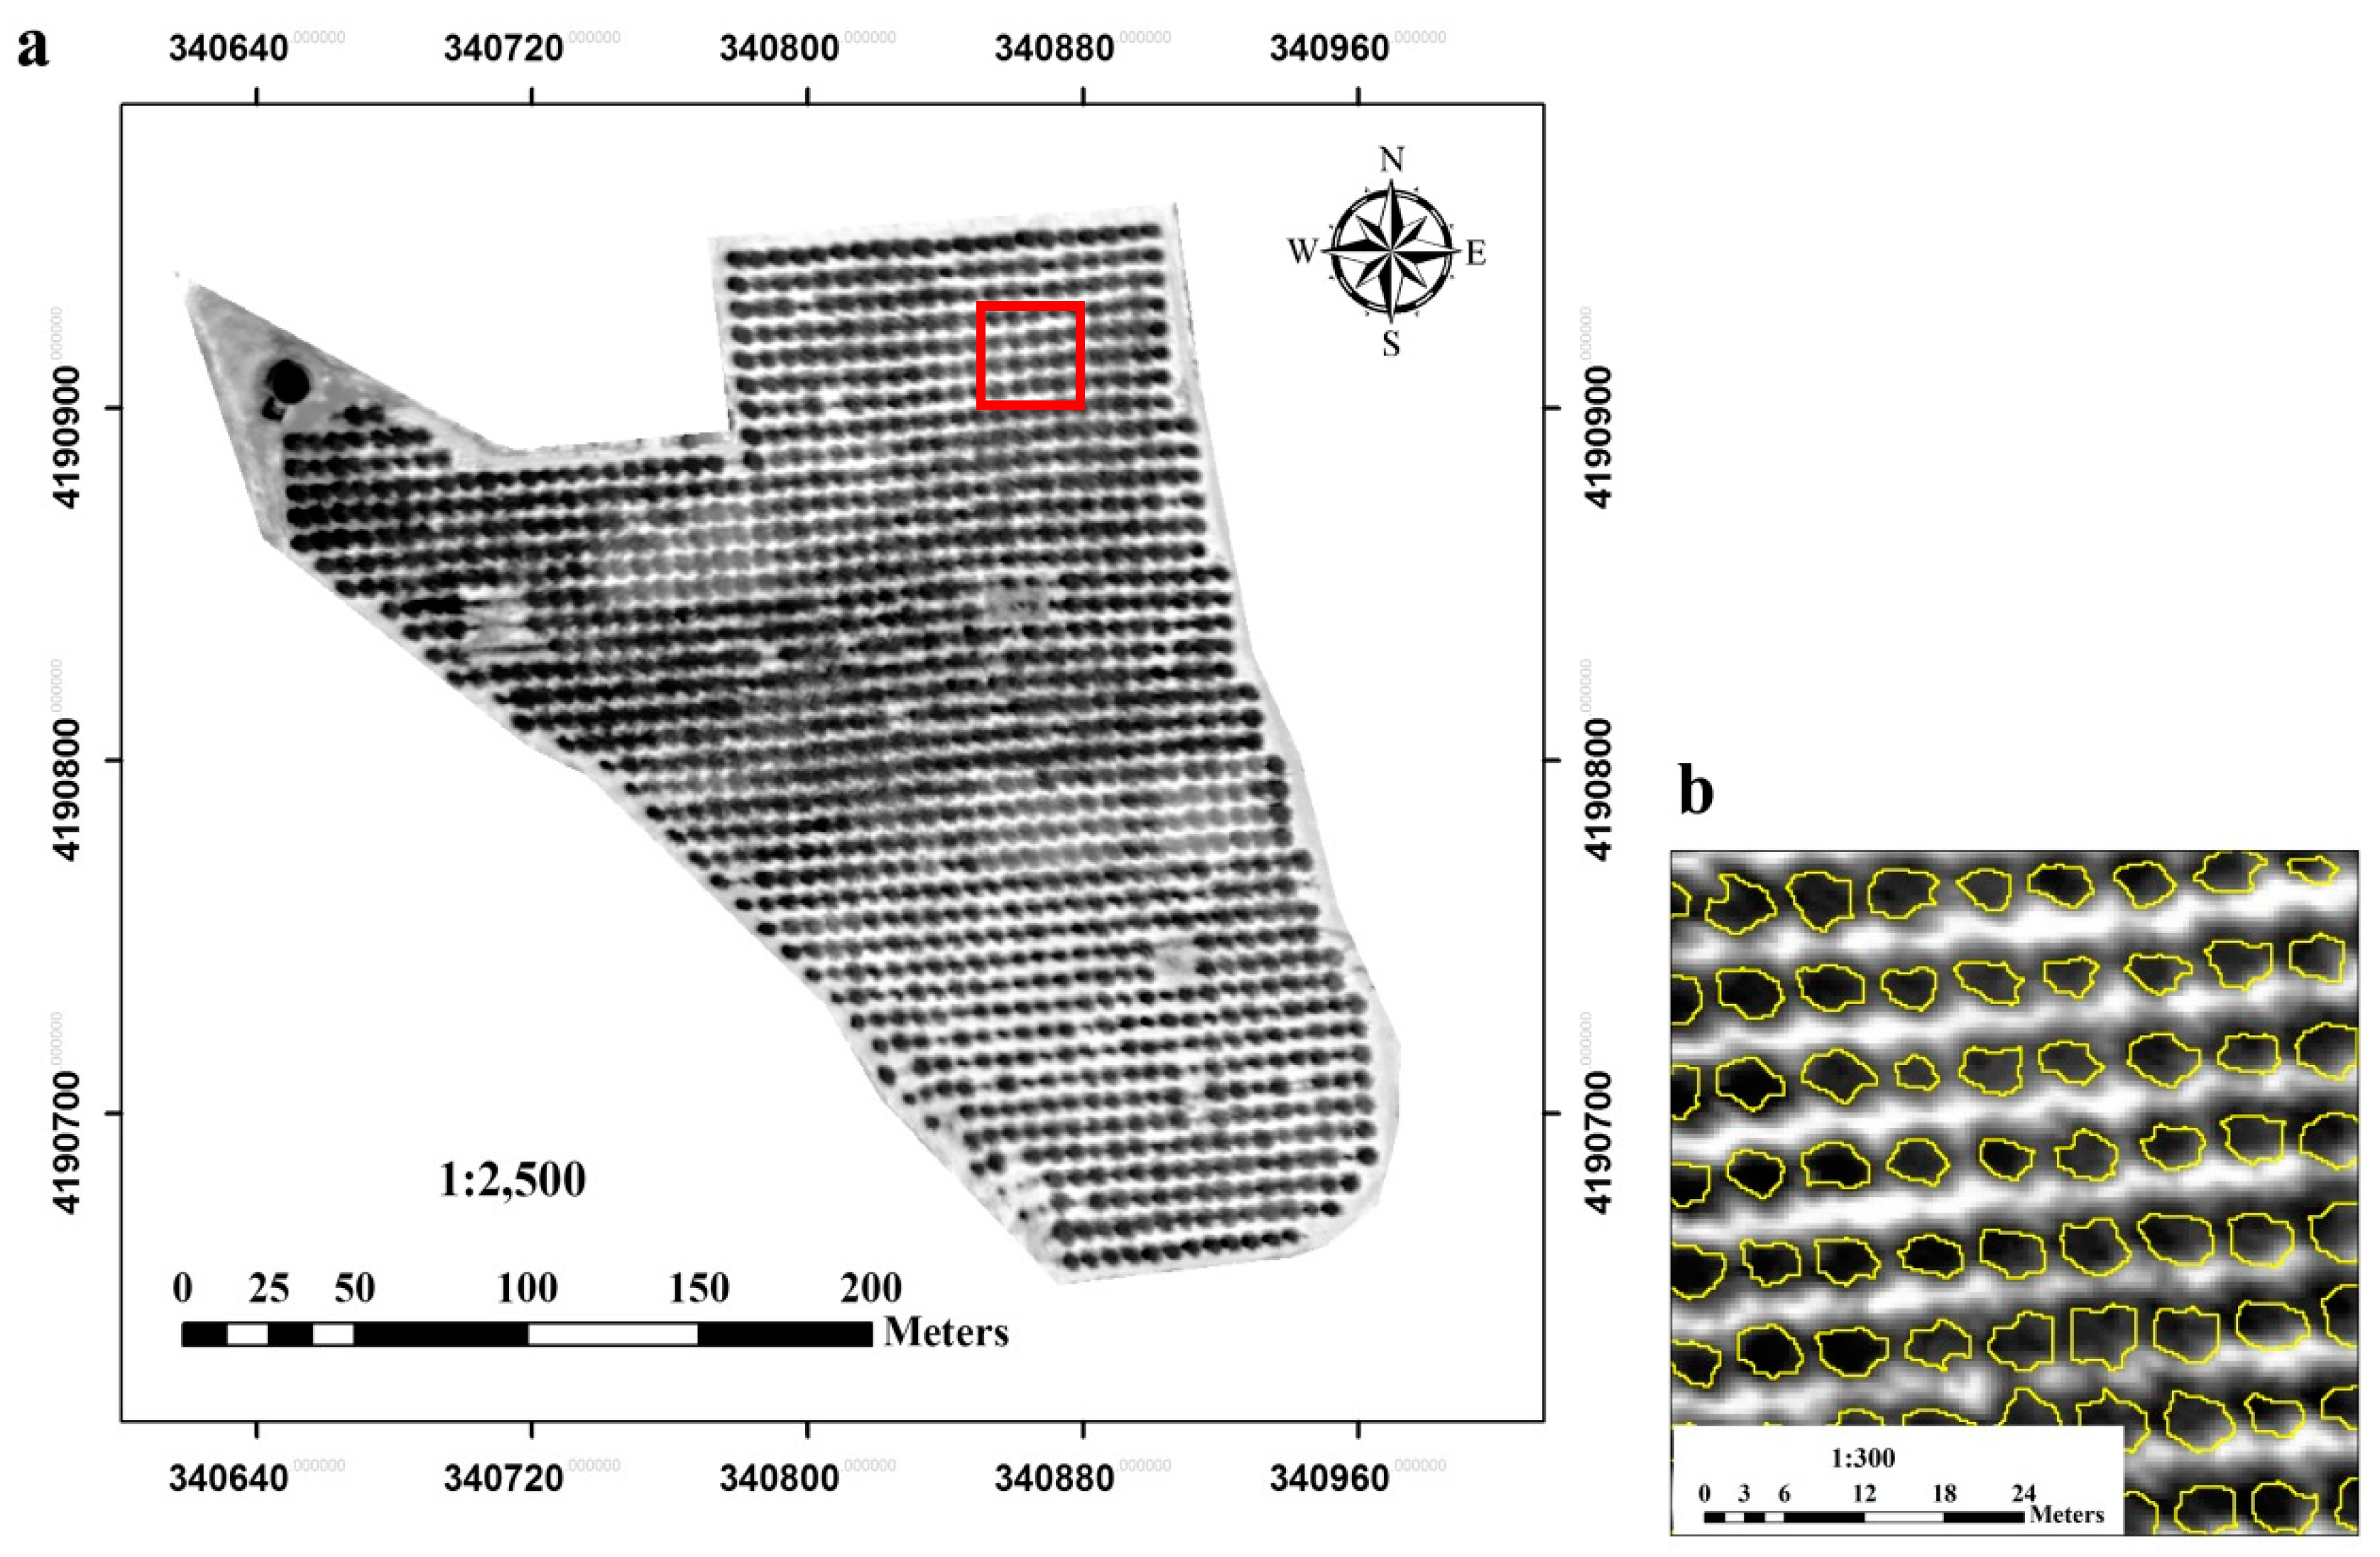
The high-resolution hyperspectral and thermal imagery (Figure 3a and Figure 4a) acquired over the orchard allowed single tree identification using automatic object-based crown detection algorithms (Figure 3b and Figure 4b), which calculated mean temperature and hyperspectral reflectance at the pure crown-level (Figure 3c). An image segmentation procedure was used as described Calderón et al. [19].

2.5. Data Analyses

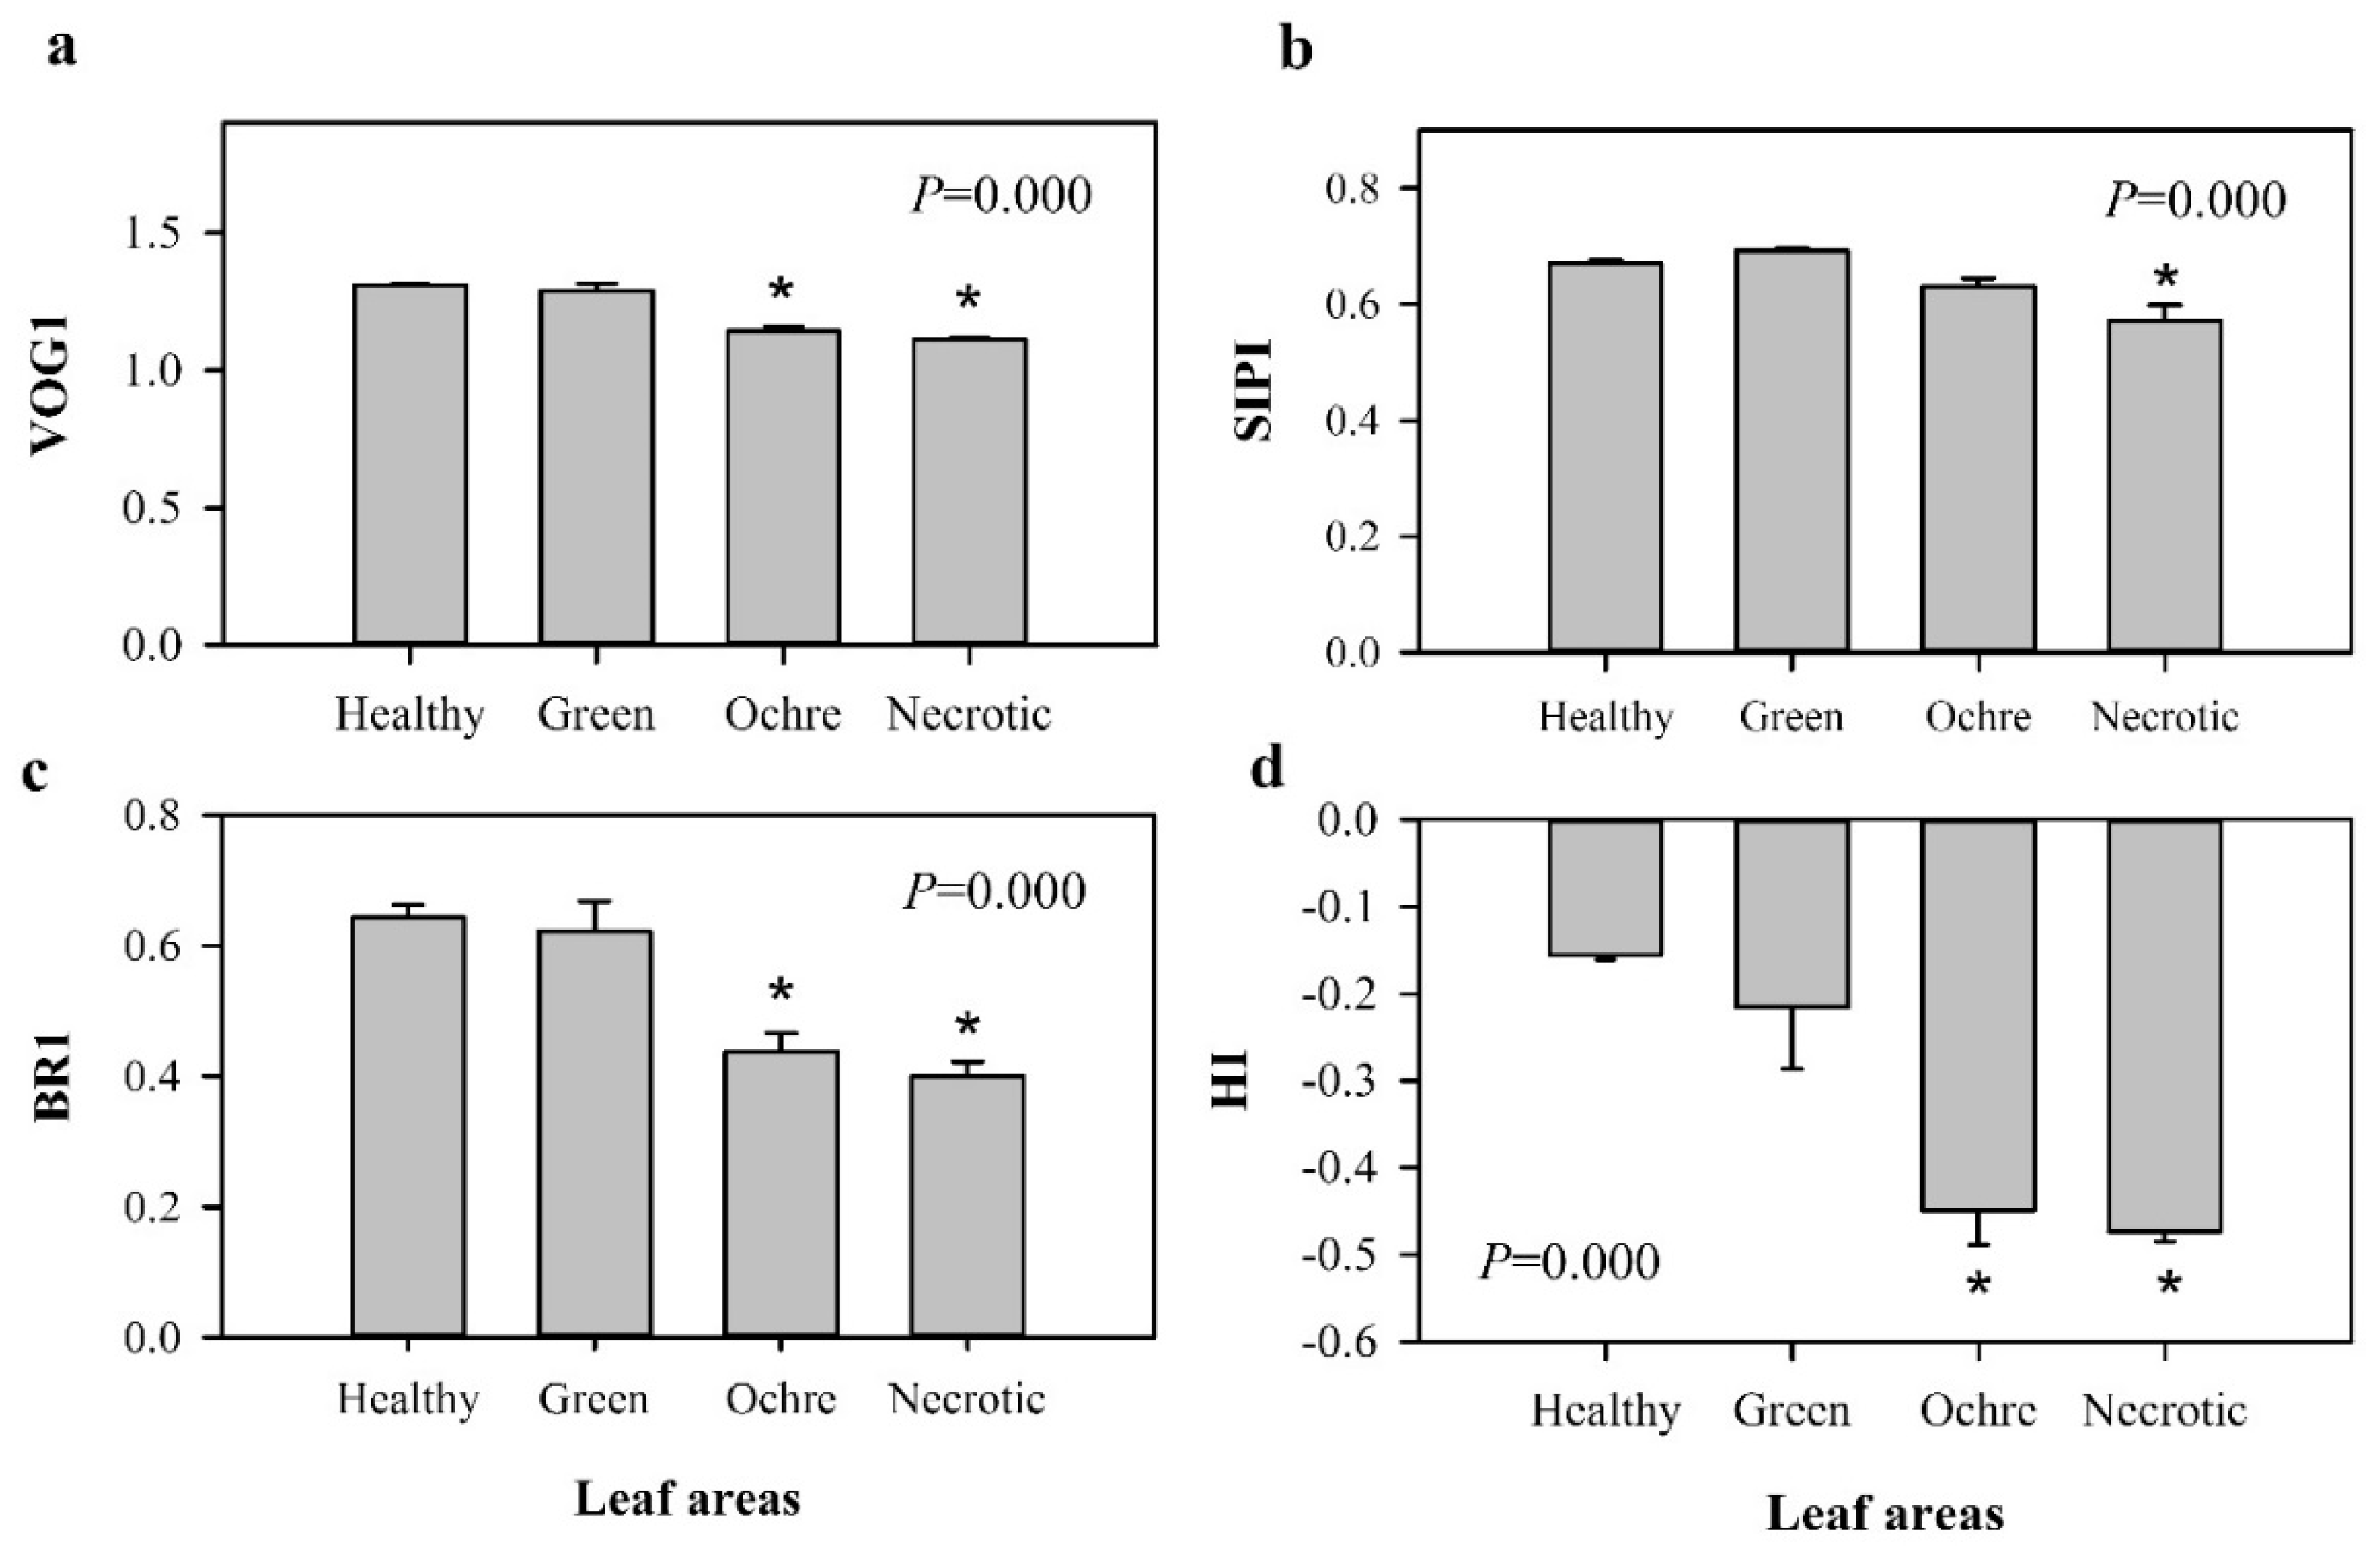
Leaf-level data were subjected to a completely randomized standard analysis of the variance (ANOVA) followed by a HSD Tukey test to examine significant differences at p < 0.05 for each measured parameter among the four classes of leaf areas (asymptomatic, ochre, and necrotic areas of symptomatic leaves, and asymptomatic leaves nearby). Leaf-level measured parameters with either a non-normal data distribution or with not homogenous variances underwent a Kruskal–Wallis analysis of variance (Kruskal–Wallis AOV) instead of standard ANOVA. The software Statistix 9.0 (Analytical Software, Tallahassee, FL, USA) was used to conduct these analyses.
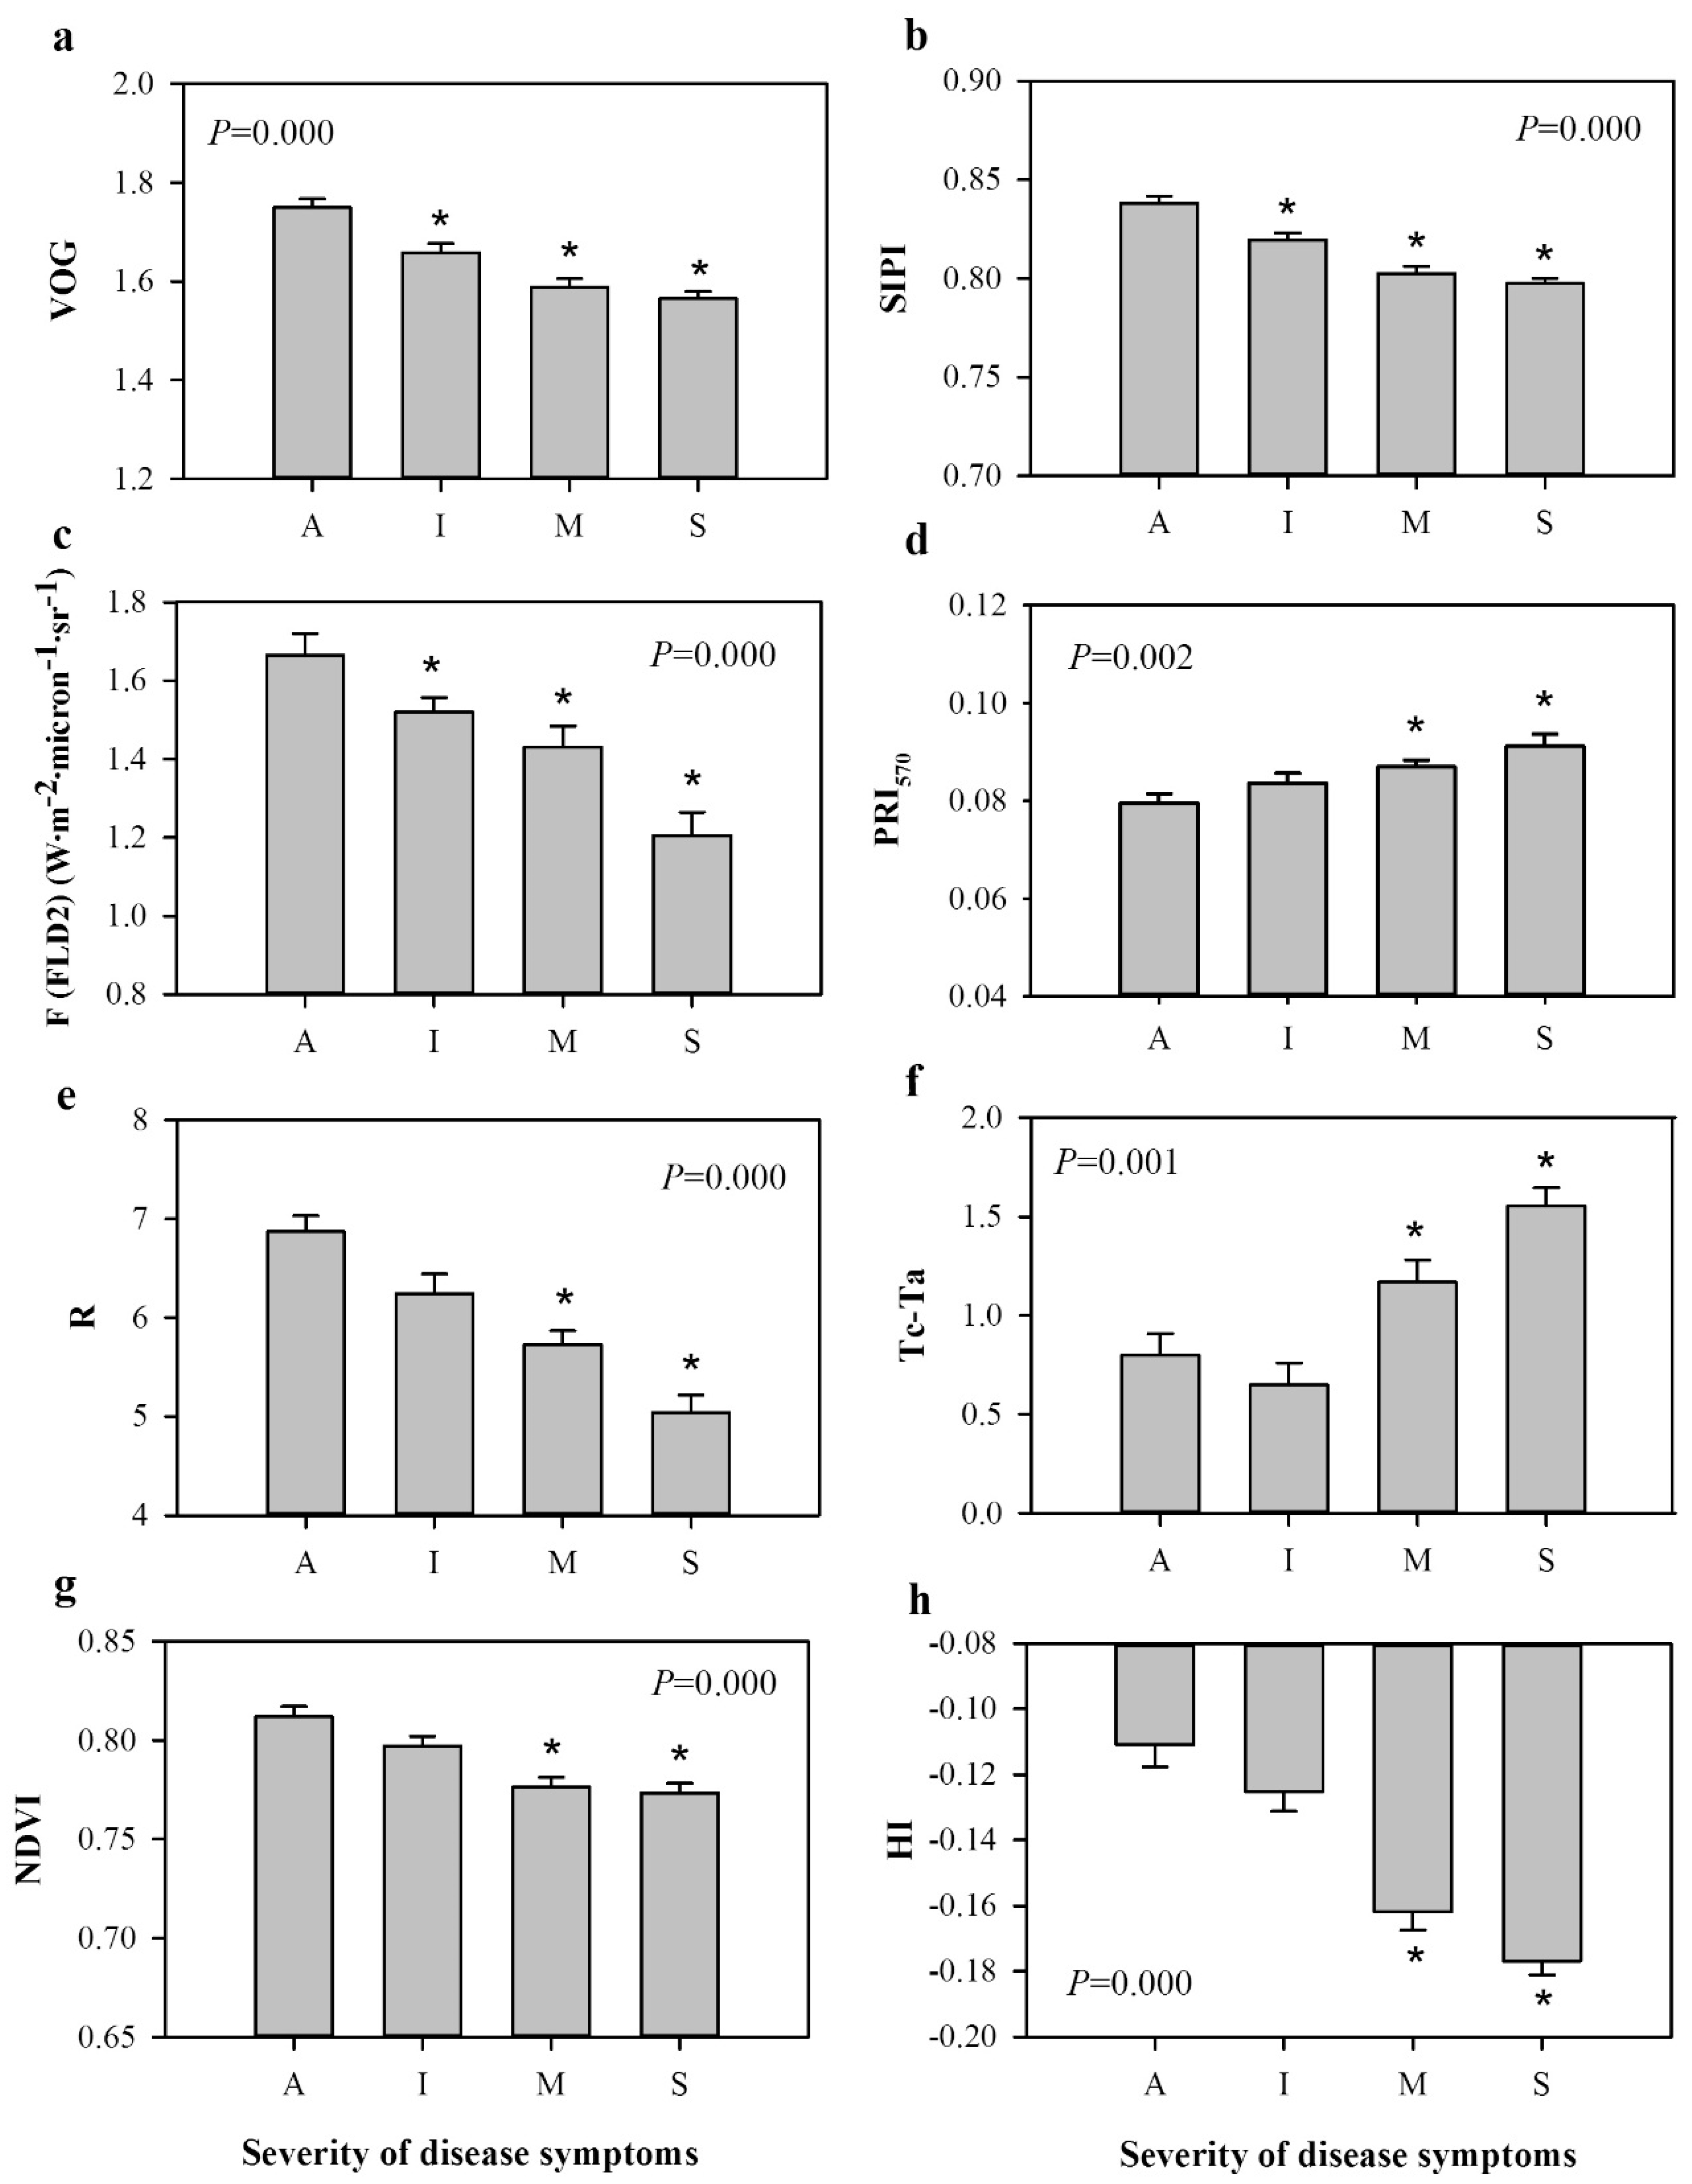
At canopy scale, the level of disease severity was related to Tc-Ta values and to the indices calculated from hyperspectral imagery obtained from each of the two flights. In order to check the sensitivity of Tc-Ta and each of the vegetation indices to the levels of disease severity evaluated in the field, standard ANOVA was conducted on the indices that were normally distributed and showed uniform variance, and again Kruskal–Wallis AOV was used for those which did not meet these requirements. The Dunnett’s two-tailed test (for indices analyzed with ANOVA) and Mann–Whitney U test (for the ones analyzed with Kruskal–Wallis AOV) with Bonferroni’s correction for α value were used to determine significant differences between asymptomatic trees and each of the disease severity levels at p < 0.05.
Afterwards, the combined information from the indices underwent a multivariate analysis and was used to develop models able to quantify disease incidence and severity, so as to separate each severity class from the rest and detect early symptomatic trees. The data calculated from thermal and hyperspectral imagery acquired on 11 July were the training dataset and the data from the 30 July flight were the test dataset. The classification models were trained to classify disease severity groups and the test data was used to evaluate the model classification accuracy. First, the STEPDISC procedure of SAS software (version 9.4; SAS Institute, Cary, NC, USA) was applied to the training set to eliminate variables within the model that did not provide additional information or were redundant according to the Wilk’s lambda method, as well as to add variables outside the model that contribute most to it. The data obtained from the stepwise analysis were further subjected to two different classification methods: linear discriminant analysis (LDA) and support vector machine (SVM). LDA was conducted with the DISCRIM procedure of SAS to generate a discriminant function capable of determining the classification accuracy of the dataset, based on the pooled covariance matrix and the prior probabilities of the classification groups [58]. Due to the non-normal distribution of the data, a non-parametric discriminant analysis was conducted specifying a k-value of 4 for the k-nearest-neighbor rule [
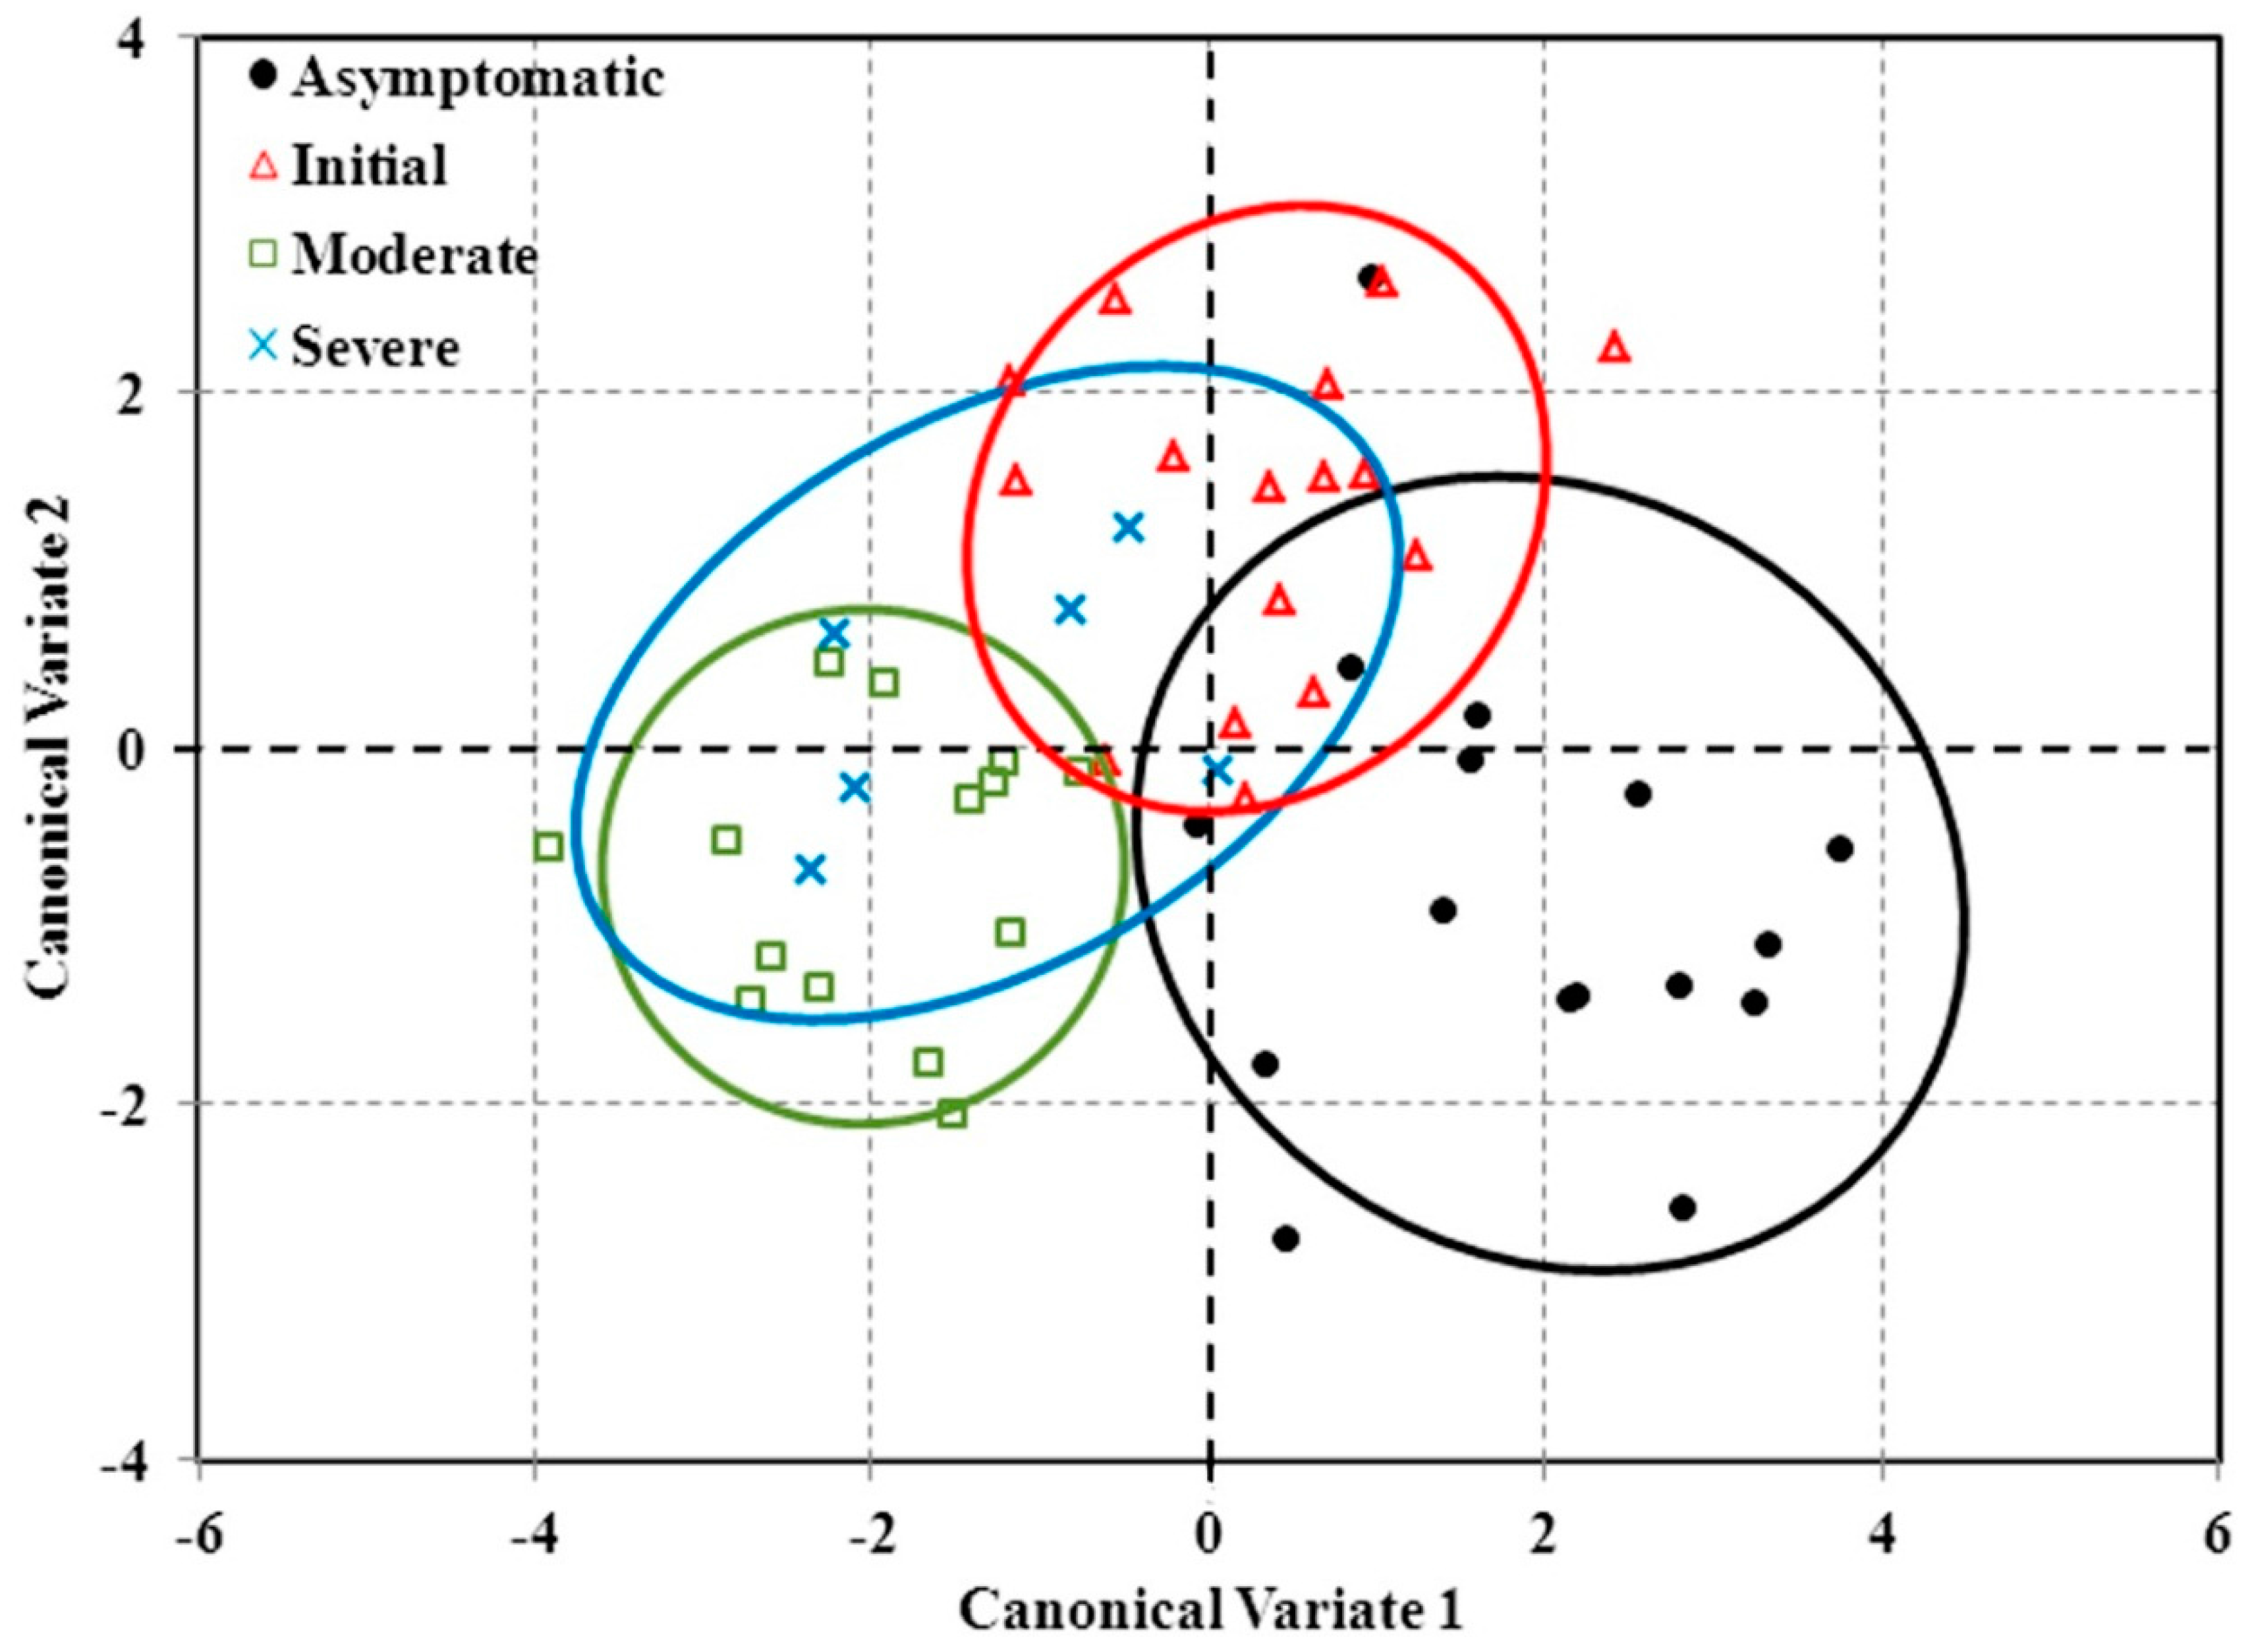
19]. Then, a canonical discriminant analysis using the CANDISC procedure of SAS was conducted to separate red leaf blotch severity classes based on linear combinations of the spectral indices selected by the stepwise analysis. The linear combinations of variables (canonical variates) were then correlated with the original disease severity classes. Individual values for each canonical variate were plotted in a bi-plot for the first and second canonical variables.
Linear and non-linear SVM classification methods were conducted using R software (R Foundation for Statistical Computing), following the procedures described in Calderón et al. [19] for non-linear SVM classification methods. The linear SVM classification was carried out using a linear kernel, while the non-linear SVM classification used the radial basis function kernel. Likewise, a grid search method using cross validation approach was applied, as suggested by Hsu et al. [59].
The classification accuracies of the models were evaluated by calculating the overall accuracy value and the kappa (κ) coefficient, which gives an overall accuracy assessment for the classification based on commission and omission error for all classes.

3. Results

3.1. Leaf-Level Observations

According to the analyses of variance conducted on the four variables measured at leaf level, green areas of symptomatic leaves had the same chlorophyll content, Fs, PRI570, and gs as healthy leaves (see Figure 5). SPAD, PRI570, and gs, discriminated symptomatic areas (both ochre and necrotic) from asymptomatic ones, the latter being able to segregate necrotic from ochre areas, as well. Fs could only distinguish necrotic areas from the rest.
Table 2 gives a summary of the hyperspectral indices calculated from the PolyPen reflectance data, together with the analyses of variance. It can be seen that no index found significant differences (p > 0.05) between asymptomatic leaves and asymptomatic areas of symptomatic ones. Several chlorophyll indices (VOGs, CI, SRPI, CTRI1, PSSRa, PSSRb, and CAR), PRI570, some R/G/B ratios (BRI1, BRI2, and LIC2), as well as disease index HI found significant differences (p < 0.05) between asymptomatic and symptomatic areas. Figure 6 shows some of the indices calculated from Polypen measurements.

3.2. Airborne Imagery Results

3.2.1. Red Leaf Blotch Detection by Univariate Analyses

Table 3 shows the analyses of variance conducted on the normalized canopy temperature (Tc-Ta) and spectral indices calculated from the thermal and hyperspectral imagery acquired on 11 and 30 July 2014. Chlorophyll-related indices VOG (Figure 7a), VOG2, VOG3, GM1, GM2, CI, Datt_NIRCabCx+c, PSSRa, PSSRb, and PSNDc were able to detect initial red leaf blotch symptoms in both flights, since significant (p < 0.05) changes appeared when compared with healthy trees. Carotenoid indices SIPI (Figure 7b) and PSSRc also revealed significantly (p < 0.05) lower values at any of the disease severity levels in both flights, detecting early stages of disease development. The chlorophyll fluorescence signal estimated from the hyperspectral imagery with the FLD method could discriminate between asymptomatic trees and those affected by the disease at any of the severity levels (p < 0.05) in both flights (Figure 7c).
By contrast, xanthophyll indices PRI570 (Figure 7d) and PRI515 showed an upward trend as red leaf blotch severity level increased, showing significantly (p < 0.05) higher values only when trees were affected by moderate and severe symptoms. Similarly, the R/G/B ratios, the greenness (G), red index (R) (Figure 7e), the blue/red (BRI1 and BRI2), and red/green ratios (RGI) and LIC2 were able to significantly (p < 0.05) detect moderate and severe symptoms. Finally, the blue index (B) and the blue/green ratios (BGI1 and BGI2) did not detect disease symptoms. Tc-Ta tended to increase as the disease severity level increased, showing significantly (p < 0.05) higher values when trees were affected by moderate or severe symptoms (Figure 7f). Moreover, moderate and severe symptoms induced significantly (p < 0.05) lower values of structural indices than those estimated on asymptomatic trees (Figure 7g). Finally, the health index (HI), showed significantly lower values (p < 0.05) at moderate and severe symptoms (Figure 7h).

3.2.2. Red Leaf Blotch Quantification by Multivariate Analyses

Eleven out of 46 indices calculated from the thermal and hyperspectral imagery acquired on 11 July were selected in the forward stepwise discriminant analysis. The indices that contributed most (partial R2 > 0.1) to discriminate among red leaf blotch severity classes were VOG, PSRI, PSNDc, FLD2, and GM1, followed (partial R2 > 0.07 < 0.1) by CRI550, LIC2, CRI550_515 and BRI2. MTVI2, and NPQI showed the lowest contribution (partial R2 < 0.067) to the discriminant function (Table 4).
The indices selected by the forward stepwise discriminant analysis were used to train LDA, correctly classifying the 81.3%, 85.7%, 100%, and 83.3% of the asymptomatic, initial, moderate, and severe red leaf blotch affected trees, respectively (Table 5). Interestingly, all symptomatic trees were correctly classified as symptomatic. Overall, the classification accuracy of the model was 84.6% and the κ value 0.792 (95% confidence interval 0.660–0.925). The predicted accuracy of the discriminant model was assessed using a cross-validation sample from the flight conducted over the same study site on 30 July. The model correctly classified 59.6% of the sample trees and the 64.3%, 20.0%, 70.6%, and 72.7% of the asymptomatic, initial, moderate, and high-severity infected red leaf blotch trees were correctly classified, respectively (Table 5).
A canonical discriminant analysis was applied, obtaining two canonical functions (variates) that showed significant differences (p < 0.005) among red leaf blotch severity classes (Table 6). The first canonical variate significantly accounted for 65.6% of the variation while the second one only accounted for 24.7% of the variation. The pigment indices (i.e., VOG, PSRI, PSNDc, GM1, CRI550, and CRI550_515) dominated the two variates. In addition, the first canonical variate was also dominated by LIC2 and MTVI2, while FLD2, BRI2, and NPQI dominated the second canonical variate. The first canonical variate was able to discriminate asymptomatic trees from those with moderate and severe symptoms, while the second variate performed better for detecting differences between asymptomatic and initially-infected trees (Figure 8).
In addition to LDA classification, SVM was also conducted using linear (Table 7a) and radial basis kernels (Table 7b). The linear SVM model achieved an overall classification accuracy of 88.5% and a 0.842 κ value (95% confident interval 0.723–0.961). On the other hand, the overall classification accuracy obtained by the non-linear SVM model using a radial basis kernel was 96.2% and the κ value 0.947 (95% confidence interval 0.875–1.000). The predicted accuracies of the linear and non-linear SVM models were assessed using a cross-validation sample calculated from the second flight, obtaining overall accuracies of 63.5% and 55.8%, respectively (Table 7a and b). Interestingly, non-linear SVM correctly classified the 80.0% of initial affected trees, while linear SVM only classified the 15.4%.
In contrast to linear models (i.e., LDA and linear SVM), non-linear SVM was very effective in separating between asymptomatic trees and those infected at early stages of red leaf blotch development. However, LDA and linear SVM classification methods showed higher power to identify asymptomatic trees and those affected by red leaf blotch at advanced stages of disease development.

4. Discussion

Remote sensing has been proposed as a useful tool for disease management, primarily at early stages of disease development in order to design appropriate disease control measurements [8]. However, red leaf blotch of almond trees is presently managed by preventive applications of fungicide. Thus, remote sensing could be used to build up field maps where areas with little or no risk of infection can be identified, and so implement precision agriculture strategies which restrict the application of fungicides to areas where disease incidence is expected. Early detection of this disease could also help reduce the use of fungicide once effective active ingredients against this disease are available.
For technical reasons, it was impossible to fly in spring, at the start of the epidemics, which would be appropriate for early detection. Nonetheless, the disease presented a wide range of disease severity values throughout the field, healthy and initially-symptomatic trees also being present even in July in some areas of the field, which allowed us to check the model ability to distinguish red leaf blotch early symptoms. Moreover, since quantification and segregation among higher disease severity levels were objectives of the present work as well, it was not optimum to fly until mid-summer, when more severe symptoms can be observed. Even if leaf area density is much lower in early-April than from May onwards, the model was developed from pure-crown pixels, so there is no interference of soil pixels. In addition, this procedure prevents any effect of inter-tree and inter-row spacing, training, and canopy architecture when modeling other fields.
Furthermore, the aircraft was flown at 550 m AGL so as to minimize the effect of sun angle variation between flying dates, cameras underwent radiometric calibration before every flight, and atmospheric correction was applied when calculating reflectance values from radiance values measured. Therefore, the scrupulous methodology followed in the acquisition of data from the hyperspectral and thermal cameras and its processing ensures the adequate correlation between the model and the field visual evaluation as well as its transferability to other fields and dates, two flights being enough—one for training and other one for validating the model. The main conclusion of the present work regarding early detection, that is, “early symptoms can be detected from chlorophyll indices and fluorescence”, is supported by our measurements at leaf level and by the individual analysis of variance conducted on each index.
Up to now, few studies using remote sensing have been conducted for detection of diseases at the canopy scale in tree crops, with the exception of wilt diseases in olive [18,19] and avocado trees [17] and greening disease of citrus [20,21,22]. This work has demonstrated the potential of high-resolution hyperspectral imagery for the early detection and quantification of red leaf blotch in almond orchards. Chlorophyll a+b and carotenoid indices and chlorophyll fluorescence, estimated with the FLD principle, were identified as the best indicators to detect red leaf blotch at leaf level and at early stages of disease development, while canopy temperature (Tc-Ta) and structural, xanthophyll, R/G/B, and disease indices proven to be good indicators to detect the presence of moderate and severe symptoms.
Calderón et al. [18,19] studied the infection and severity caused by Verticillium dahliae in olive orchards, identifying Tc-Ta and chlorophyll fluorescence (FLD3) as early remote sensing indicators of the disease. Here, Tc-Ta only detected moderate and severe red leaf blotch symptoms due to the appearance of ochre and necrotic spots which cause an increase in leaf temperature. In another fungal foliar disease (downy mildew in opium poppy), Tc-Ta was significantly affected when symptoms reached a moderate stage [12]. While Tc-Ta is useful to detect root impairment caused by soil-borne pathogens due to the colonization of xylem vessels and the subsequent reduction in the transpiration rate, it is not such a good indicator of fungal foliar diseases at early stages of disease development. This may be because the disease does not affect the green area of symptomatic leaves so the reduction in stomatal conductance is only restricted to the part of the leaf affected by the pathogen. Thus, the increase of temperature in affected areas of leaves is a local effect, not being sufficient to significantly increase the canopy temperature at early stages of disease development. This result is in agreement with the ones conducted by Lidenthal et al. [60] and Oerke et al. [61] with leaf infrared thermography in cucumber plants affected by downy mildew, showing a decrease in the transpiration rate and a consequent rise in temperature with the appearance of chlorotic and necrotic tissues. Leaf thermography was also similarly used for the detection of apple scab disease [62] and downy mildew in grapevines [63]. By contrast, chlorophyll a+b and carotenoid indices were able to detect the early effects of red leaf blotch here, while these indices only detected Verticillium wilt in olive in the more advanced stages [19]. In addition, chlorophyll a+b and carotenoid indices were also demonstrated to detect citrus greening disease [21]. In conclusion, the early detection of plant diseases is highly influenced by the type of symptoms induced, which leads to selecting different vegetation indices depending on the symptoms which, in turn, depend on the specific physiological responses induced by the pathogen infection.
Regarding the classification models developed, linear models (LDA and linear SVM) showed higher power to separate between asymptomatic trees and those affected by advanced stages of disease development while the non-linear SVM model was more effective in discriminating asymptomatic plants from those at early stages of red leaf blotch development. Rumpf et al. [15] also found that a non-linear SVM model conducted with the radial basis kernel could achieve a good separation between healthy sugar beet plants and plants with early infections of Cercospora leaf spot, sugar beet rust, and powdery mildew. Nevertheless, these results are opposite to the ones obtained by Calderón et al. [19] for Verticillium wilt quantification over large olive areas, where LDA was the more efficient than non-linear SVM in early detection.
In practice, the results obtained with linear and non-linear classification methods are different and can be applied in different scenarios depending on the objective pursued. In spring, when red leaf blotch starts, the non-linear SVM classification method, with an 80% of class recall for initially-symptomatic trees (Table 7b), could be applied to detect field areas with initial symptoms, due to its efficiency in separating the trees at initial stages of disease development from the rest. In summer, when the disease is at its highest epidemic level, the main objective is to quantify the disease and assess possible consequent almond yield loss in the following year. In this case, linear classification models, which better separate trees at advanced stages of disease development, would be used.
After LDA, a canonical discriminant analysis was conducted to reduce the dimensionality of the variables included in the model to two canonical variates. The first canonical variate allowed the discrimination between the asymptomatic and the moderate and severe levels of disease, while the second variate was able to distinguish between asymptomatic and initial stages of disease development. Pigment indices (i.e., VOG, PSRI, PSNDc, GM1, CRI550, and CRI550_515) dominated both variates demonstrating its power to discriminate asymptomatic trees from symptomatic ones. Chlorophyll fluorescence (FLD2) dominated the second variate, proving its potential to distinguish between asymptomatic and initial symptomatic severity level. These results agree with the ones obtained when individual indices were studied for red leaf blotch detection using univariate statistical analyses. Analyses of variance demonstrated that pigment indices were very suitable to detect red leaf blotch at the canopy level at initial and advanced stages of disease development. Structural indices were found to be good indicators of moderate and severe P. amygdalinum infection. Although severely affected and healthy trees overlap, it is just because of one single severely symptomatic tree (Figure 8). Yet, this analysis is rather good in separating healthy from symptomatic trees and would, then, be useful in disease quantification.
This study demonstrated the difficulty of the quantification of red leaf blotch in almond orchards due to the local leaf effects caused by P. amygdalinum infection, so the necessity of high-resolution imagery for monitoring the disease is of higher importance.

5. Conclusions

In this work, almond red leaf blotch effects were assessed both at leaf and canopy levels. Regarding the former, green tissues of symptomatic leaves behaved in terms of photosynthetic activity as tissue from healthy leaves. Therefore, the decrease of photosynthesis at the canopy level is caused by the loss of effective leaf area. Pigment (chlorophyll a+b and carotenoid) indices and chlorophyll fluorescence (FLD2) were the most appropriate to detect initial red lead blotch symptoms, as well as for discerning between disease severity classes. Non-linear SVM classification method was the most efficient in separating between healthy trees and trees with incipient infection.
This study is the first to use high-resolution hyperspectral imagery for almond disease assessment. The large number of vegetation indices analyzed provides a wide database from which the best-fitting indices emerged for almond red leaf blotch detection and quantification. Remote sensing proved to be a useful tool for decision support and implementation of precision crop protection techniques in red leaf blotch control. The goodness of the results obtained opens an interesting research lines since almond is, nowadays, a crop of increasing importance due to health-related almond consumption benefits. Moreover, this crop is shifting in many areas of the Mediterranean Basin from a traditional low input scenario to more intensive management systems with high revenues.

Acknowledgements

The experiment was carried out in the experimental farm “Alameda del Obispo” belonging to the Andalusian Institute of Agricultural Research (IFAPA). The almond orchard facility has been established by Ignacio Lorite whose support and advice is gratefully acknowledged. Financial support was provided by projects P12-AGR-2521 from Junta de Andalucía, and AGL2009-0735 and AGL 2012-35196 from Spanish “Ministerio de Economía y Competitividad (MEC)” and the European Regional Development Fund. M. López-López has a fellowship from MEC (BES-2013-063390). M. Medina, L. Ahumada, K. Gutierrez, M. Orgaz and R. Luque are acknowledged for their technical support with field work. D. Notario, A.Vera, A. Hornero and R.Romero are acknowledged for their support in the airborne campaign and image processing.

Author Contributions

Manuel López-López, Rocío Calderón, Victoria González-Dugo, Pablo J. Zarco-Tejada and Elías Fereres conceived and designed the experiments. Manuel López-López, Pablo J. Zarco-Tejada and Elías Fereres performed the experiments. Manuel López-López, Rocío Calderón, Victoria González-Dugo, Pablo J. Zarco-Tejada and Elías Fereres analyzed the data. Manuel López-López, Rocío Calderón, Victoria González-Dugo and Pablo J. Zarco-Tejada contributed materials/analysis tools. Manuel López-López, Rocío Calderón, Victoria González-Dugo, Pablo J. Zarco-Tejada and Elías Fereres wrote the paper.

Conflicts of Interest

The authors declare no conflict of interest.

Abbreviations

The following abbreviations are used in this manuscript:
AGLAbove Ground Level
ANOVAstandard Analysis of Variance
FLDFraunhofer Line Depth
FOVField Of View
fpsframes per second
FsSteady-state chlorophyll fluorescence
FWHMFull Width at Half Maximum
GMTGreenwich Mean Time
gsStomatal conductance
IFOVInstantaneous Field of View
IMUInertial Measuring Unit
LDALinear Discriminant Analysis
SVMSupport Vector Machine
TaAir Temperature
Tc-TaNormalized canopy temperature
TcCanopy Temperature
VNIRVisible and Near-Infrared
κKappa coefficient

References

  1. Tuset, J.J.; Portilla, M.T. Principales alteraciones del almendro causadas por hongos en el área Mediterránea Española. Frutic. Prof. 1987, 11, 13–17. [Google Scholar]
  2. Cannon, P.F. Systematics and diversity of the Phyllachoraceae associated with Rosaceae, with a monograph of Polystigma. Mycol. Res. 1996, 100, 1409–1427. [Google Scholar] [CrossRef]
  3. Saad, A.T.; Masannat, K. Economic importance and cycle of Polystigma ochraceum, causing red leaf blotch disease of almond in Lebanon. Bull. OEPP/EPPO 1997, 27, 481–485. [Google Scholar] [CrossRef]
  4. Almacellas Gort, J. Síntomas, daños y métodos de control de la mancha ocre del almendro. Vida Rural 2014, Diciembre, 28–32. [Google Scholar]
  5. Miarnau, X.; Vargas, F.J.; Montserrat, R.; Alegre, S. Aspectos importantes en las nuevas plantaciones de almendro en regadío. Rev. Frutic. 2010, 10, 94–103. [Google Scholar]
  6. Banihashemi, Z. Biology and control of Polystigma ochraceum, the cause of almond red leaf blotch. Plant Pathol. 1990, 39, 309–315. [Google Scholar] [CrossRef]
  7. Suzuky, Y.; Hatakeyama, S.; Harada, Y.; Tanaka, K. Polystigma fulvum, a red leaf blotch pathogen on leaves of Prunus spp., has the Polystigmina pallecens anamorph/andromorph. Mycosciencie 2008, 49, 395–398. [Google Scholar]
  8. Mahlein, A.K.; Oerke, E.C.; Steiner, U.; Dehne, H.W. Recent advances in sensing plant diseases for precision crop protection. Eur. J. Plant Pathol. 2012, 133, 197–209. [Google Scholar] [CrossRef]
  9. Nilsson, H.E. Remote sensing and image analysis in plant pathology. Annu. Rev. Phytopathol. 1995, 15, 489–527. [Google Scholar] [CrossRef] [PubMed]
  10. Bock, C.H.; Poole, G.H.; Parker, P.E.; Gottwald, T.R. Plant disease severity estimated visually, by digital photography and image analysis, and hyperspectral imaging. Crit. Rew. Plant Sci. 2010, 29, 59–107. [Google Scholar] [CrossRef]
  11. Barton, C. Advances in remote sensing of plant stress. Plant Soil 2012, 354, 41–44. [Google Scholar] [CrossRef]
  12. Calderón, R.; Montes-Borrego, M.; Landa, B.B.; Navas-Cortés, J.A.; Zarco-Tejada, P.J. Detection of downy mildew of opium poppy using high-resolution multi-spectral and thermal imagery acquired with an unmanned aerial vehicle. Precision Agric. 2014, 15, 639–661. [Google Scholar] [CrossRef]
  13. Franke, J.; Menz, G. Multi-temporal wheat disease detection by multi-spectral remote sensing. Precision Agric. 2007, 8, 161–172. [Google Scholar] [CrossRef]
  14. Mahlein, A.K.; Steiner, U.; Dehne, H.W.; Oerke, E.C. Spectral signatures of sugar beet leaves for the detection and differentiation of diseases. Precision Agric. 2010, 11, 413–431. [Google Scholar] [CrossRef]
  15. Rumpf, T.; Mahlein, A.K.; Steiner, U.; Oerke, E.C.; Plümer, L. Early detection and classification of plant diseases with support vector machines based on hyperspectral reflectance. Comput. Electron. Agric. 2010, 74, 91–99. [Google Scholar] [CrossRef]
  16. Devadas, R.; Lamb, D.W.; Simpfendorfer, S.; Backhouse, D. Evaluating ten spectral vegetation indices for identifying rust infection in individual wheat leaves. Precision Agric. 2009, 10, 459–470. [Google Scholar] [CrossRef]
  17. De Castro, A.I.; Ehsani, R.; Ploetz, R.; Crane, J.H.; Abdulridha, L. Optimum spectral and geometric parameters for early detection of laurel wilt disease in avocado. Remote Sens. Environ. 2015, 171, 33–44. [Google Scholar] [CrossRef]
  18. Calderón, R.; Navas-Cortés, J.A.; Lucena, C.; Zarco-Tejada, P.J. High-resolution airborne hyperspectral and thermal imagery for early detection of Verticillium wilt of olive using fluorescence, temperature and narrow-band spectral indices. Remote Sens. Environ. 2013, 139, 231–245. [Google Scholar] [CrossRef]
  19. Calderón, R.; Navas-Cortés, J.A.; Zarco-Tejada, P.J. Early detection and quantification of Verticillium wilt in olive using hyperspectral and thermal imagery over large areas. Remote Sens. 2015, 7, 5584–5610. [Google Scholar] [CrossRef]
  20. Kumar, A.; Lee, W.S.; Ehsani, R.; Albrigo, L.G.; Yang, C.; Mangan, R.L. Citrus greening disease detection using aerial hyperspectral and multispectral imaging techniques. J. Appl. Remote Sens. 2012, 6, 063542. [Google Scholar]
  21. Sankaran, S.; Maja, J.M.; Buchanon, S.; Ehsani, R. Huanglongbing (Citrus Greening) detection using visible, near infrared and thermal imaging techniques. Sensors 2013, 13, 2117–2130. [Google Scholar] [CrossRef] [PubMed]
  22. Li, H.; Lee, W.S.; Wang, K.; Ehsani, R.; Yang, C. “Extended spectral angle mapping (ESAM)” for citrus greening disease detection using airborne hyperspectral imaging. Precision Agric. 2014, 15, 162–183. [Google Scholar] [CrossRef]
  23. Consejería de Agricultura, Pesca y Desarrollo Rural—Junta de Andalucía. Available online: http://www.juntadeandalucia.es/agriculturaypesca/ifapa/ria (accessed on 14 December 2015).
  24. Yadava, U.L. A rapid and nondestructive method to determine chlorophyll in intact leaves. HortScience 1986, 21, 1449–1450. [Google Scholar]
  25. Marquard, R.D.; Tipton, J.L. Relationship between extractable chlorophyll and an in situ method to estimate leaf greenness. HortScience 1987, 22, 1327. [Google Scholar]
  26. Calderón, R.; Lucena, C.; Trapero-Casas, J.L.; Zarco-Tejada, P.J.; Navas-Cortés, J.A. Soil temperature determines the reaction of olive cultivars to Verticillium dahliae pathotypes. PLoS ONE 2014, 9. [Google Scholar] [CrossRef] [PubMed]
  27. Gueymard, C.A. SMARTS, a Simple Model of the Atmospheric Radiative Transfer of Sunshine: Algorithms and Performance Assessment; Technical Report no. FSEC-PF-270–95 1995; Florida Solar Energy Center: Cocoa, FL, USA, 1995. [Google Scholar]
  28. Gueymard, C.A. Parameterized transmittance model for direct beam and circumsolar spectral irradiance. Sol. Energy 2001, 71, 325–346. [Google Scholar] [CrossRef]
  29. Rouse, J.W.; Haas, R.H.; Schell, J.A.; Deering, D.W.; Harlan, J.C. Monitoring the Vernal Advancement and Retrogradation (Greenwave Effect) of Natural Vegetation; NASA/GSFC Type III Final Report; NASA/GSFC: Greenbelt, MD, USA, 1974. [Google Scholar]
  30. Rougean, J.L.; Breon, F.M. Estimating PAR absorbed by vegetation from bidirectional reflectance measurements. Remote Sens. Environ. 1995, 51, 375–384. [Google Scholar] [CrossRef]
  31. Jordan, C.F. Derivation of leaf area index from quality of light on the forest floor. Ecology 1969, 50, 663–666. [Google Scholar] [CrossRef]
  32. Chen, J. Evaluation of vegetation indices and modified simple ratio for boreal applications. Can. J. Remote Sens. 1996, 22, 229–242. [Google Scholar] [CrossRef]
  33. Rondeaux, G.; Steven, M.; Baret, F. Optimization of soil-adjusted vegetation indices. Remote Sens. Environ. 1996, 55, 95–107. [Google Scholar] [CrossRef]
  34. Qi, J.; Chehbouni, A.; Huete, A.R.; Kerr, Y.H.; Sorooshian, S. A modified soil adjusted vegetation index. Remote Sens. Environ. 1994, 48, 119–126. [Google Scholar] [CrossRef]
  35. Haboudane, D.; Miller, J.R.; Pattey, E.; Zarco-Tejada, P.J.; Strachan, I. Hyperspectral vegetation indices and novel algorithms for predicting green LAI of crop canopies: Modeling and validation in the context of precision agriculture. Remote Sens. Environ. 2004, 90, 337–352. [Google Scholar] [CrossRef]
  36. Liu, H.Q.; Huete, A.R. A feedback based modification of the NDVI to minimize canopy background and atmospheric noise. IEEE Trans. Geosci. Remote Sens. 1995, 33, 457–465. [Google Scholar]
  37. Lichtenhaler, H.K.; Lang, M.; Sowinska, M.; Heisel, F.; Mieh, J.A. Detection of vegetation stress via a new high resolution fluorescence imaging system. J. Plant Physiol. 1996, 148, 599–612. [Google Scholar] [CrossRef]
  38. Vogelmann, J.E.; Rock, B.N.; Moss, D.M. Red edge spectral measurements from sugar maple leaves. Int. J. Remote Sens. 1993, 14, 1563–1575. [Google Scholar] [CrossRef]
  39. Gitelson, A.A.; Merzlyak, M.N. Signature analysis of leaf reflectance spectra: Algorithm development for remote sensing of chlorophyll. Int. J. Remote Sens. 1997, 18, 2691–2697. [Google Scholar] [CrossRef]
  40. Haboudane, D.; Miller, J.R.; Tremblay, N.; Zarco-Tejada, P.J.; Dextraze, L. Integrated narrow-band vegetation indices for prediction of crop chlorophyll content for application to precision agriciculture. Remote Sens. Environ. 2002, 84, 416–426. [Google Scholar] [CrossRef]
  41. Peñuelas, J.; Baret, F.; Filella, I. Semi-empirical indices to assess carotenoids/chlorophyll a ratio from leaf spectral reflectance. Photosynthetica 1995, 31, 221–230. [Google Scholar]
  42. Barnes, J.D. A reappraisal of the use of DMSO for the extraction and determination of chlorophylls a and b in lichens and higher plants. Environ. Exp. Bot. 1992, 2, 85–100. [Google Scholar] [CrossRef]
  43. Peñuelas, J.; Gamon, J.A.; Fredeen, A.L.; Merino, J.; Field, C.B. Reflectance indices associated with physiological changes in nitrogen- and water-limited sunflower leaves. Remote Sens. Environ. 1994, 48, 135–146. [Google Scholar] [CrossRef]
  44. Carter, G.A. Ratios of leaf reflectances in narrow wavebands as indicators of plant stress. Int. J. Remote Sens. 1994, 15, 697–703. [Google Scholar] [CrossRef]
  45. Blackburn, G.A. Spectral indices for estimating photosynthetic pigment concentrations: A test using senescent tree leaves. Int. J. Remote Sens. 1998, 19, 657–675. [Google Scholar] [CrossRef]
  46. Datt, B. Remote sensing of chlorophyll a, chlorophyll b, chlorophyll a+b, and total carotenoid content in eucalyptus leaves. Remote Sens. Environ. 1998, 66, 111–121. [Google Scholar] [CrossRef]
  47. Merzlyak, M.N.; Gitelson, A.A.; Chivkunova, O.B.; Rakitin, V.Y. Non-destructive optical detection of pigment changes during leaf senescence and fruit ripening. Physiol. Plant. 1999, 106, 135–141. [Google Scholar] [CrossRef]
  48. Gitelson, A.A.; Keydan, G.P.; Merzlyak, M.N. Three-band model for noninvasive estimation of chlorophyll, carotenoids, and anthocyanin contents in higher plant leaves. Geophys. Res. Lett. 2006, 33, L11402. [Google Scholar] [CrossRef]
  49. Chappelle, E.W.; Kim, M.S.; McMurtrey, J.E. Ratio analysis of reflectance spectra (RARS): An algorithm for the remote estimation of the concentrations of chlorophyll a, chlorophyll b, and carotenoids in soybean leaves. Remote Sens. Environ. 1992, 39, 239–247. [Google Scholar] [CrossRef]
  50. Gamon, J.A.; Peñuelas, J.; Field, C.B. A narrow-wave band spectral index that tracks diurnal changes in photosynthetic efficiency. Remote Sens. Environ. 1992, 41, 35–44. [Google Scholar] [CrossRef]
  51. Hernández-Clemente, R.; Navarro-Cerrillo, R.M.; Suárez, L.; Morales, F.; Zarco-Tejada, P.J. Assessing structural effects on PRI for stress detection in conifer forests. Remote Sens. Environ. 2011, 115, 2360–2375. [Google Scholar] [CrossRef]
  52. Gitelson, A.A.; Yacobi, Y.Z.; Schalles, J.F.; Rundquist, D.C.; Han, L.; Stark, R.; Etzion, D. Remote estimation of phytoplankton density in productive waters. Arch. Hydrobiol. 2000, 55, 121–136. [Google Scholar]
  53. Zarco-Tejada, P.J.; Berjón, A.; López-Lozano, R.; Miller, J.R.; Marin, P.; Cachorro, V.; González, M.R.; de Frutos, A. Assessing vineyard condition with hyperspectral indices: Leaf and canopy reflectance simulation in a row-structured discontinuous canopy. Remote Sens. Environ. 2005, 99, 271–287. [Google Scholar] [CrossRef]
  54. Zarco-Tejada, P.J.; González-Dugo, V.; Berni, J.A.J. Fluorescence, temperature and narrow-band indices acquired from a UAV for water stress detection using a hyperspectral imager and a thermal camera. Remote Sens. Environ. 2012, 117, 322–337. [Google Scholar] [CrossRef]
  55. Plascyk, J.A. The MK II Fraunhofer Line Dicsriminator (FLD-II) for airborne and orbital remote sensing of solar-stimulated luminescence. Opt. Eng. 1975, 14, 339–346. [Google Scholar] [CrossRef]
  56. Maier, S.W.; Günther, K.P.; Stellmes, M. Sun-induced fluorescence: A new tool for precision farming. In Digital Imaging and Spectral Techniques: Applications to Precision Agriculture and Crop Physiology; McDonald, M., Schepers, J., Tartly, L., van Toai, T., Major, D., Eds.; American Society of Agronomy: Madison, WI, USA, 2003; pp. 209–222. [Google Scholar]
  57. Mahlein, A.K.; Rumpf, T.; Welke, P.; Dehne, H.-W.; Plümer, L.; Steiner., U.; Oerke, E.C. Development of spectral indices for detecting and identifying plant diseases. Remote Sens. Environ. 2013, 128, 21–30. [Google Scholar] [CrossRef]
  58. Khattree, R.; Naik, D.N. Multivariate Data Reduction and Discrimination with SAS Software; SAS Institute Inc.: Cary, NC, USA, 2000. [Google Scholar]
  59. Hsu, C.W.; Chang, C.C.; Lin, C.J. A Practical Guide to Support Vector Classification. Available online: http://www.csie.ntu.edu.tw/~cjlin/papers/guide/guide.pdf (accessed on 17 December 2014).
  60. Lindenthal, M.; Steiner, U.; Dehne, H.-W.; Oerke, E.-C. Effect of downy mildew development on transpiration of cucumber leaves visualized by digital infrared thermography. Phytopathology 2005, 95, 233–240. [Google Scholar] [CrossRef] [PubMed]
  61. Oerke, E.-C.; Steiner, U.; Dehne, H.-W.; Lindenthal, M. Thermal imaging of cucumber leaves affected by downy mildew and environmental conditions. J. Exp. Bot. 2006, 57, 2121–2132. [Google Scholar] [CrossRef] [PubMed]
  62. Oerke, E.-C.; Fröhling, P.; Steiner, U. Thermographic assessment of scab disease on apple leaves. Precision Agric. 2011, 12, 699–715. [Google Scholar] [CrossRef]
  63. Stoll, M.; Schultz, H.R.; Baecker, G.; Berkelmann-Loehnertz, B. Early pathogen detection under different water status and the assessment of spray application in vineyards through the use of thermal imagery. Precision Agric. 2008, 9, 407–417. [Google Scholar] [CrossRef]
Figure 1. Picture of red leaf blotch symptoms: first ochre spots on a leaf (a); moderately affected leaf with some necrotic spots (b); necrotic leaf (c); and severely affected tree (d). Pictures were taken on 18 July 2014 in Córdoba.
Remotesensing 08 00276 g001
Figure 2. Reflectance spectrum of healthy leaves and, green, ochre, and necrotic areas of affected leaves measured with PolyPen RP400 operating in the spectral mode of 256 bands in the 400–790 nm region with 8 nm FWHM. Measurements were taken on fully-expanded sunny leaves from 1–1.5 meters high in the canopy on 18 July.
Remotesensing 08 00276 g002
Figure 3. Hyperspectral mosaic (a) obtained with the hyperspectral sensor on board the manned platform at 30-cm resolution. Pure almond crowns were identified using automatic object-based crown detection (b). Sample crown reflectance obtained by the hyperspectral imagery from red leaf blotch asymptomatic, initially symptomatic, and severely symptomatic almond trees is shown in (c). Red square (a) is shown in detail in (b).
Remotesensing 08 00276 g003
Figure 4. Thermal scene (a) obtained with the thermal camera on board the manned platform at 40-cm resolution, enabling pure almond crown identification (b). Pure almond crowns were identified using automatic object-based crown detection. Red square (a) is shown in detail in (b).
Remotesensing 08 00276 g004
Figure 5. Mean values of chlorophyll meter readings (SPAD units) (a); chlorophyll fluorescence (Fs) (b); photochemical reflectance index (PRI570) (c); and stomatal conductance (gs, mmols·m−2·s−1) (d); and measured on 24 asymptomatic, 29 ochre, and nine necrotic areas in affected leaves, and 20 locations within healthy leaves, located in the same stems as the affected leaves. Measurements were taken on fully-expanded, sunny leaves, between 11:30 and 12:30 GMT on 18 July. Analysis of variance of each index was conducted and asterisks indicate significant differences from the asymptomatic plants according to Tukey or Kruskall–Walli’s test at p < 0.05. Error bars indicate standard errors.
Remotesensing 08 00276 g005
Figure 6. Mean values of VOG1 (a); SIPI (b); Blue/Red ratio (BR1) (c) and healthy-index (HI) (d) of 11 green, 11 ochre, and 10 necrotic areas in affected leaves, and of six locations within healthy leaves nearby. Measurements were taken on sunny fully-expanded leaves with a Polypen RP400 device, between 11:30 and 12:30 GMT on 18 July. Analysis of variance of each index was conducted and asterisks indicate significant differences from the asymptomatic plants according to Tukey or Kruskall–Walli’s test at p < 0.05. Error bars indicate standard errors.
Remotesensing 08 00276 g006
Figure 7. Mean values of VOG (a); SIPI (b); chlorophyll fluorescence FLD2 (c); PRI570 (d); red index (R) (e); Tc-Ta (f); NDVI (g); and healthy-index (HI) (h) for every red leaf blotch severity level calculated from thermal and hyperspectral imagery acquired on 11 July 2014. Analysis of variance of each index was conducted and asterisks indicate significant differences from the asymptomatic plants according to Dunnett‘s two-tailed test or Mann–Whitney U test at p < 0.05. Error bars indicate standard errors. Disease severity levels are shown as: A = asymptomatic, I = initial, M = moderate and S = severe.
Remotesensing 08 00276 g007
Figure 8. Classification of 52 almond trees assessed in the flight of 11 July 2014 into four red leaf blotch severity classes based on the first and second canonical variates from the canonical discriminant analysis.
Remotesensing 08 00276 g008
Table 1. Summary of the vegetation indices, calculated from hyperspectral airborne imagery, which were assessed for their correspondence with the disease severity (0–3), and their formulations.
Vegetation IndicesEquationReference
Structural Indices
Normalized Difference Vegetation Index N D V I = ( R 800 R 670 ) / ( R 800 + R 670 ) [29]
Renormalized Difference Vegetation Index R D V I = ( R 800 R 670 ) / ( R 800 + R 670 ) [30]
Simple Ratio S R = R 800 / R 670 [31]
Modified Simple Ratio M S R = R 800 / R 670 1 ( R 800 / R 670 ) 0.5 + 1 [32]
Optimized Soil-Adjusted Vegetation Index O S A V I = ( 1 + 0.16 ) ( R 800 R 670 ) R 800 + R 670 + 0.16 [33]
Modified Soil-Adjusted Vegetation Index M S A V I = 2 R 800 + 1 ( 2 R 800 + 1 ) 2 8 ( R 800 R 670 ) 2 [34]
Modified Triangular Vegetation Indices M T V I 1 = 1.2 [ 1.2 ( R 800 R 550 ) 2.5 ( R 670 R 550 ) ] [35]
M T V I 2 = 1.5 [ 1.2 ( R 800 R 550 ) 2.5 ( R 670 R 550 ) ] ( 2 R 800 + 1 ) 2 ( 6 R 800 5 R 670 ) 0.5 [35]
Modified Chlorophyll Absorption Ratio Indices M S A V I 1 = 1.2 [ 2.5 ( R 800 R 670 ) 1.3 ( R 800 R 550 ) ] [35]
M S A V I 2 = 1.5 [ 2.5 ( R 800 R 670 ) 1.3 ( R 800 R 550 ) ] ( 2 R 800 + 1 ) 2 ( 6 R 800 5 R 670 ) 0.5 [35]
Enhanced Vegetation IndexEVI = 2.5(R800R670)/(R800 + 6R670 − 7.5R400 + 1)[36]
Lichtenthaler Index L I C 1 = ( R 800 R 680 ) / ( R 800 + R 680 ) ] [37]
Pigment indices Chlorophyll a+b indices
Vogelmann Indices V O G 1 = R 740 / R 720 [38]
V O G 2 = ( R 734 R 747 ) / ( R 715 + R 726 ) [38]
V O G 3 = ( R 734 R 747 ) / ( R 715 + R 720 ) [38]
Gitelson and Merzlyak indices G M 1 = R 750 / R 550 [39]
G M 2 = R 750 / R 700 [39]
Chlorophyll Index Red Edge C I = R 750 / R 710 [40]
Simple Ratio Pigment Index S R P I = R 430 / R 680 [41]
Normalized Phaeophytinization Index N P Q I = ( R 415 R 735 ) / ( R 415 + R 735 ) [42]
Normalized Pigments Index N P C I = ( R 680 R 430 ) / ( R 680 + R 430 ) [43]
Carter Indices C T R I 1 = R 695 / R 420 [44]
Pigment Specific Simple Ratio Chlorophyll a P S S R a = R 800 / R 675 [45]
Pigment Specific Simple Ratio Chlorophyll b P S S R b = R 800 / R 650 [45]
Pigment Specific Normalized Difference P S N D c = ( R 800 R 470 ) / ( R 800 + R 470 ) [45]
Reflectance Band Ratio Index D a t t N I R C a b C x + c = R 860 / ( R 550 × R 708 ) [46]
Carotenoid Indices
Structure-Intensive Pigment Index S I P I = ( R 800 R 445 ) / ( R 800 + R 680 ) [41]
Plant Senescencing Reflectance Index P S R I = ( R 680 R 500 ) / R 750 [47]
Pigment Specific Simple Ratio Carotenoids P S R R c = R 800 / R 500 [45]
Lichtenhaler Index L I C 3 = R 440 / R 740 [37]
Carotenoid Reflectance Indices C R I 550 = ( 1 / R 510 ) ( 1 / R 550 ) [48]
C R I 550 _ 515 = ( 1 / R 515 ) ( 1 / R 550 ) [48]
Ratio Analysis of Reflectance Spectra R A R S = R 746 / R 513 [49]
Xanthophyll indices
Photochemical Reflectance Index (570) P R I 570 = ( R 570 R 531 ) / ( R 570 + R 531 ) [50]
Photochemical Reflectance Index (515) P R I 515 = ( R 515 R 531 ) / ( R 515 + R 531 ) [51]
R/G/B Indices
Redness Index R = R 700 / R 670 [52]
Greenness Index G = R 570 / R 670 [18]
Blue Index B = R 450 / R 490 [18]
Blue/Green Indices B G I 1 = R 400 / R 550 [53]
B G I 2 = R 450 / R 550 [53]
Blue/Red Indices B R I 1 = R 400 / R 690 [54]
B R I 2 = R 450 / R 690 [54]
Red/Green Indices R G I = R 690 / R 550 [53]
Lichtenthaler Index L I C 2 = R 440 / R 690 [37]
Chlorophyll Fluorescence
FLD2 F L D 2 ( 750 ; 762 ) [54,55,56]
Plant Disease Index
Healthy-Index H I = ( R 534 R 698 ) / R 534 + R 698 1 2 R 704 [57]
Table 2. Results of the analyses of variance conducted on the vegetation indices calculated from PolyPen output data at the leaf level. Treatments were separated in homogenous groups (according to the all pair-wise comparison method HSD Tukey test in the case of the indices that could undergo an ANOVA and Kruskal–Wallis in the case of the ones that did not accomplish for the conditions of either normality or variance homogeneity). The groups are ordered as follows: asymptomatic leaf, green region, ochre region, and necrotic region.
Vegetation IndicesANOVAKruskal–Wallis
PHSD TukeyPHom. Groups
Chlorophyll a+b indices
 VOG1 0.000A-A-B-B
 VOG2 0.000B-B-A-AB
 VOG3 0.000B-B-A-AB A-A-AB-B
 GM10.002AB-A-B-B
 GM2 0.000
 CI 0.000A-A-B-B
 SRPI0.000A-A-B-C B-B-B-A
 NPQI 0.000
 NPCI 0.000B-B-AB-A
 CTRI10.000A-A-B-B
 PSSRa0.000A-A-B-B
 PSSRb0.000A-A-B-C
 PSNDc0.000A-A-A-B
Carotenoid indices
 SIPI 0.000AB-A-BC-C
 PSRI 0.000C-CB-AB-A
 PSSRc 0.000AB-A-AB-B
 LIC3 0.000AB-B-B-A
Xanthophyll indices
 PRI570 0.000A-A-B-B
 PRI515 0.000AB-B-B-A
R/G/B indices
 R 0.000AB-AB-A-B
 G 0.000A-A-A-B
 B 0.040AB-AB-A-B
 BG10.000B-B-B-A
 BG20.000B-B-B-A
 BR10.000A-A-B-B
 BR2 0.000A-A-B-B
 RGI 0.000B-B-AB-A
 LIC20.000A-A-B-B
Plant disease index
 HI 0.000A-A-B-B
Table 3. Sensitivity of standardized canopy temperature and vegetation indices to red leaf blotch symptoms in almond trees calculated from the thermal and hyperspectral imagery obtained on 11 July 2014 and on 30 July 2014. The occurrence of significant differences in Tc-Ta and spectral indices from asymptomatic class according to Dunnett’s two-tailed test or Mann–Whitney U test for initial, moderate, and severe red leaf blotch symptoms is indicated with an “X”.
Source11 July 201430 July 2014
PDisease Severity LevelsPDisease Severity Levels
InitModSevInitModSev
Thermal
 Tc-Ta0.001 XX0.000 XX
Structural indices
 NDVI0.000 XX0.000 XX
 RDVI0.001 XX0.000 XX
 SR0.000 XX0.000XXX
 MSR0.000 XX0.000XXX
 OSAVI0.000 XX0.000 XX
 MSAVI0.001 XX0.000 XX
 MTVI10.002 XX0.000XXX
 MTVI20.001 XX0.000 XX
 MCARI10.002 XX0.000XXX
 MCARI20.001 XX0.000 XX
 EVI0.001 XX0.000 XX
 LIC10.000 XX0.000 XX
Pigment indices
Chlor a+b indices
 VOG0.000XXX0.000XXX
 VOG20.000XXX0.000XXX
 VOG30.000XXX0.000XXX
 GM10.000XXX0.000XXX
 GM20.000XXX0.000XXX
 CI0.000XXX0.000XXX
 SRPI0.002 XX0.000XXX
 NPQI0.815 0.015X
 NPCI0.002 XX0.000XXX
 CTR10.003 XX0.004XXX
 DattNIRCabCx+c0.000XXX0.000XXX
 PSSRa0.000XXX0.000XXX
 PSSRb0.000XXX0.000XXX
 PSNDc0.000XXX0.000XXX
Carotenoid indices
 SIPI0.000XXX0.000XXX
 PSRI0.001 XX0.000 XX
 PSSRc0.000XXX0.000XXX
 LIC30.002XXX0.000 XX
 CRI5500.000XX 0.000 XX
 CRI550_5150.000XX 0.000 XX
 RARS0.000XXX0.000 X
Xanthophyll indices
 PRI5700.002 XX0.002 XX
 PRI5150.001XXX0.000 XX
R/G/B indices
 B0.323 0.082
 G0.002 XX0.000 XX
 R0.000 XX0.000 XX
 BGI10.599 0.083
 BGI20.070 0.001 X
 BRI10.014 XX0.000XXX
 BRI20.002 XX0.000 XX
 RGI0.001 XX0.000 XX
 LIC20.001 XX0.000 XX
Fluorescence
 FLD20.000XXX0.000XXX
Plant disease index
 HI0.000 XX0.000 XX
Table 4. Variables selected in the forward stepwise discriminant analysis to determine the severity of Polystigma amigdalinum infection in almond trees.
SourceWilks’ LambdaPartial R2F ValuePr > FPr < Lambda
VOG0.4840.516335.58<0.0001<0.0001
PSRI0.3410.294113.75<0.0001<0.0001
PSNDc0.1590.13234.630.0047<0.0001
FLD20.3000.12054.480.0055<0.0001
GM10.2110.11914.240.0074<0.0001
CRI5500.2570.07712.670.0517<0.0001
LIC20.1470.07472.420.0710<0.0001
CRI550_5150.2780.07422.590.0571<0.0001
BRI20.1840.07082.340.0789<0.0001
MTVI20.2390.06702.270.0851<0.0001
NPQI0.1980.06312.090.1070<0.0001
Table 5. Training confusion matrix for red leaf blotch severity classes using the linear discriminant classification based on the indices selected by the forward stepwise discriminant analysis for the flight conducted on 11 July 2014 and confusion matrix obtained by the linear discriminant model validation with almond trees flown on 30 July 2014.
PredictionTrainingValidation
Ground TruthClass precisionGround TruthClass precision
AsympInitModSevAsympInitModSev
Asymp13000100%910181.8%
Init1120092.3%221228.6%
Mod1014187.5%3212070.6%
Sev140550.0%054847.1%
Class recall81.3%85.7%100%83.3%84.6%64.3%20.0%70.6%72.7%59.6%
Table 6. Standardized canonical coefficients (SCCs) and correlation coefficients (CCCs) of discriminant canonical functions of vegetation indices selected by the forward stepwise discriminant analysis that determine almond red leaf blotch severity levels.
SCCsCCCs
SourceVariate 1Variate 2Variate 1Variate 2
VOG3.612−4.3810.770−0.175
PSRI2.8894.727−0.5600.007
PSNDc1.5807.2780.731−0.145
FLD2−0.284−0.7710.543−0.173
GM1−2.472−3.2640.756−0.234
CRI550−4.985−3.9550.703−0.150
LIC21.050−0.7230.6690.015
CRI550_5155.5772.7010.714−0.111
BRI2−0.0257.0920.6420.049
MTVI20.5680.5460.6370.097
NPQI−0.228−0.516−0.047−0.055
Cumulative proportion0.6560.247······
Table 7. Training confusion matrix for almond red leaf blotch severity classes obtained from the support vector machine classification using (a) linear and (b) radial basis kernels based on the indices selected by the forward stepwise discriminant analysis for the flight conducted on 11 July 2014 and confusion matrix obtained by the support vector machine model validation with almond trees flown on 30 July 2014 using (a) linear and (b) radial basis kernels.
(a)
PredictionTrainingValidation
Ground TruthClass PrecisionGround TruthClass Precision
AsympInitModSevAsympInitModSev
Asymp14000100%910090.0%
Init1130092.9%220233.3%
Mod1313076.5%3516359.3%
Sev001685.7%021666.7%
Class recall87.5%81.3%92.9%100%88.5%64.3%15.4%94.1%54.5%63.5%
(b)
PredictionTrainingValidation
Ground TruthClass PrecisionGround TruthClass Precision
AsympInitModSevAsympInitModSev
Asymp1601094.1%810088.9%
Init01500100%484342.1%
Mod0113092.9%2113854.2%
Sev0006100%00000%
Class recall100%93.8%92.9%100%96.2%57.1%80.0%76.5%0%55.8%

