Article

Remote Sensing of Deformation of a High Concrete-Faced Rockfill Dam Using InSAR: A Study of the Shuibuya Dam, China

1
State Key Laboratory of Water Resources and Hydropower Engineering Science, Wuhan University, Wuhan 430072, China
2
Global Navigation Satellite System Research Centre, Wuhan University, Wuhan 430079, China
*
Author to whom correspondence should be addressed.
Remote Sens. 2016, 8(3), 255; https://doi.org/10.3390/rs8030255
Submission received: 8 December 2015 / Revised: 26 January 2016 / Accepted: 11 March 2016 / Published: 17 March 2016

Abstract

:
Settlement is one of the most important deformation characteristics of high concrete faced rockfill dams (CFRDs, >100 m). High CFRDs safety would pose a great threat to the security of people’s lives and property downstream if this kind of deformation were not to be measured correctly, as traditional monitoring approaches have limitations in terms of durability, coverage, and efficiency. It has become urgent to develop new monitoring techniques to complement or replace traditional monitoring approaches for monitoring the safety and operation status of high CFRDs. This study examines the Shuibuya Dam (up to 233.5 m in height) in China, which is currently the highest CFRD in the world. We used space-borne Interferometric Synthetic Aperture Radar (InSAR) time series to monitor the surface deformation of the Shuibuya Dam. Twenty-one ALOS PALSAR images that span the period from 28 February 2007 to 11 March 2011 were used to map the spatial and temporal deformation of the dam. A high correlation of 0.93 between the InSAR and the in-situ monitoring results confirmed the reliability of the InSAR method; the deformation history derived from InSAR is also consistent with the in-situ settlement monitoring system. In addition, the InSAR results allow continuous investigation of dam deformation over a wide area that includes the entire dam surface as well as the surrounding area, offering a clear picture continuously of the dam deformation.

Graphical Abstract

1. Introduction

Dam safety is a major issue in hydraulic engineering, especially for high concrete faced rockfill dams (CFRDs) [1,2]. Because CFRDs are easy to construct and cost effective, they are becoming a preferred dam type in hydraulic engineering, and have been constructed all over the world [2]. Over the past two decades, many CFRDs higher than 150 m have been built, including a few up to 240 m, for example the Shuibuya (SBY) Dam (233 m), the Zipingpu Dam (156 m), and the Hongjiadu Dam (179 m) in China [3,4]. The SBY CFRD is currently the highest CFRD in the world. At present, there are more than 50 CFRDs higher than 100 m that have been constructed in China. Additionally, a number of 300 m-high earth-rock-fill dams are being constructed in western China, such as the Qizong Dam (356 m, a central core rockfill dam (CCRD)), and the Rumei Dam (315 m, CFRD). If any one of these high dams collapsed, it would cause great damage to the people’s lives and property downstream. However, monitoring the deformation of high CFRDs poses a major challenge because of the limitations of traditional approaches.
Settlement caused by loading from gravity, water pressure, and earthquakes is the main deformation feature for high CFRDs and is regarded as a key indicator of dam safety. Thus, it is important to establish reasonable and effective methods for monitoring the deformation features of CFRDs during their construction and normal operation periods. Traditional internal monitoring methods include tension wire alignment, and hydraulic overflow settlement gauges [5,6,7]. Tension wire alignment is used to monitor the internal horizontal deformation of the dam. However, the monitoring results are greatly influenced by vertical deformation, which can give rise to substantial errors [7]. Hydraulic overflow settlement gauges can be used to monitor internal vertical deformation with an acceptable degree of accuracy. However, their functionality is limited in high dams because these dams can be subject to deformation greater than the measurement range of the gauges [8]. In sum, because of their low observation and coverage efficiency, lack of durability, short service lifetime, and labor-intensive monitoring needs, these traditional internal monitoring methods cannot meet the safety monitoring requirements of large dams in terms of efficiency, accuracy, and long-term observations. Therefore, it has become urgent to develop new monitoring techniques and approaches.
In the last 20 years, Interferometric Synthetic Aperture Radar (InSAR) has proven to be a powerful tool for measuring the Earth’s surface movements. InSAR can be accurate to a few millimeters, as well as having high spatial resolution (with pixels in the order of meters to tens of meters) over a wide area (100 km × 100 km or even wider) and offering higher density and coverage than can be provided by in-situ techniques [9]. InSAR has been applied to measure surface height changes in various domains, including earthquakes, volcanoes, and cities [10,11]. InSAR measures surface displacement by differencing the phase observations between two complex radar images, and the resulting difference phase creates a new type of image called an interferogram. Few studies have focused on using InSAR to map displacement of dam bodies and/or reservoir slopes [12,13,14,15], and high CFRDs have not been investigated yet. In this study, we aim to use spaceborne InSAR data to investigate the spatial and temporal changes of the SBY Dam, and to compare with the in-situ measurements.
The paper is structured as follows: Section 2 gives a general description of the SBY Dam, the geological setting, the ground monitoring system, and the SAR data used in this study. Section 3 describes the InSAR time series processing, and the InSAR results and comparison with the in-situ measurements are given in Section 4. Discussions and conclusions are presented in Sections 5.

2. Study Area and Dataset
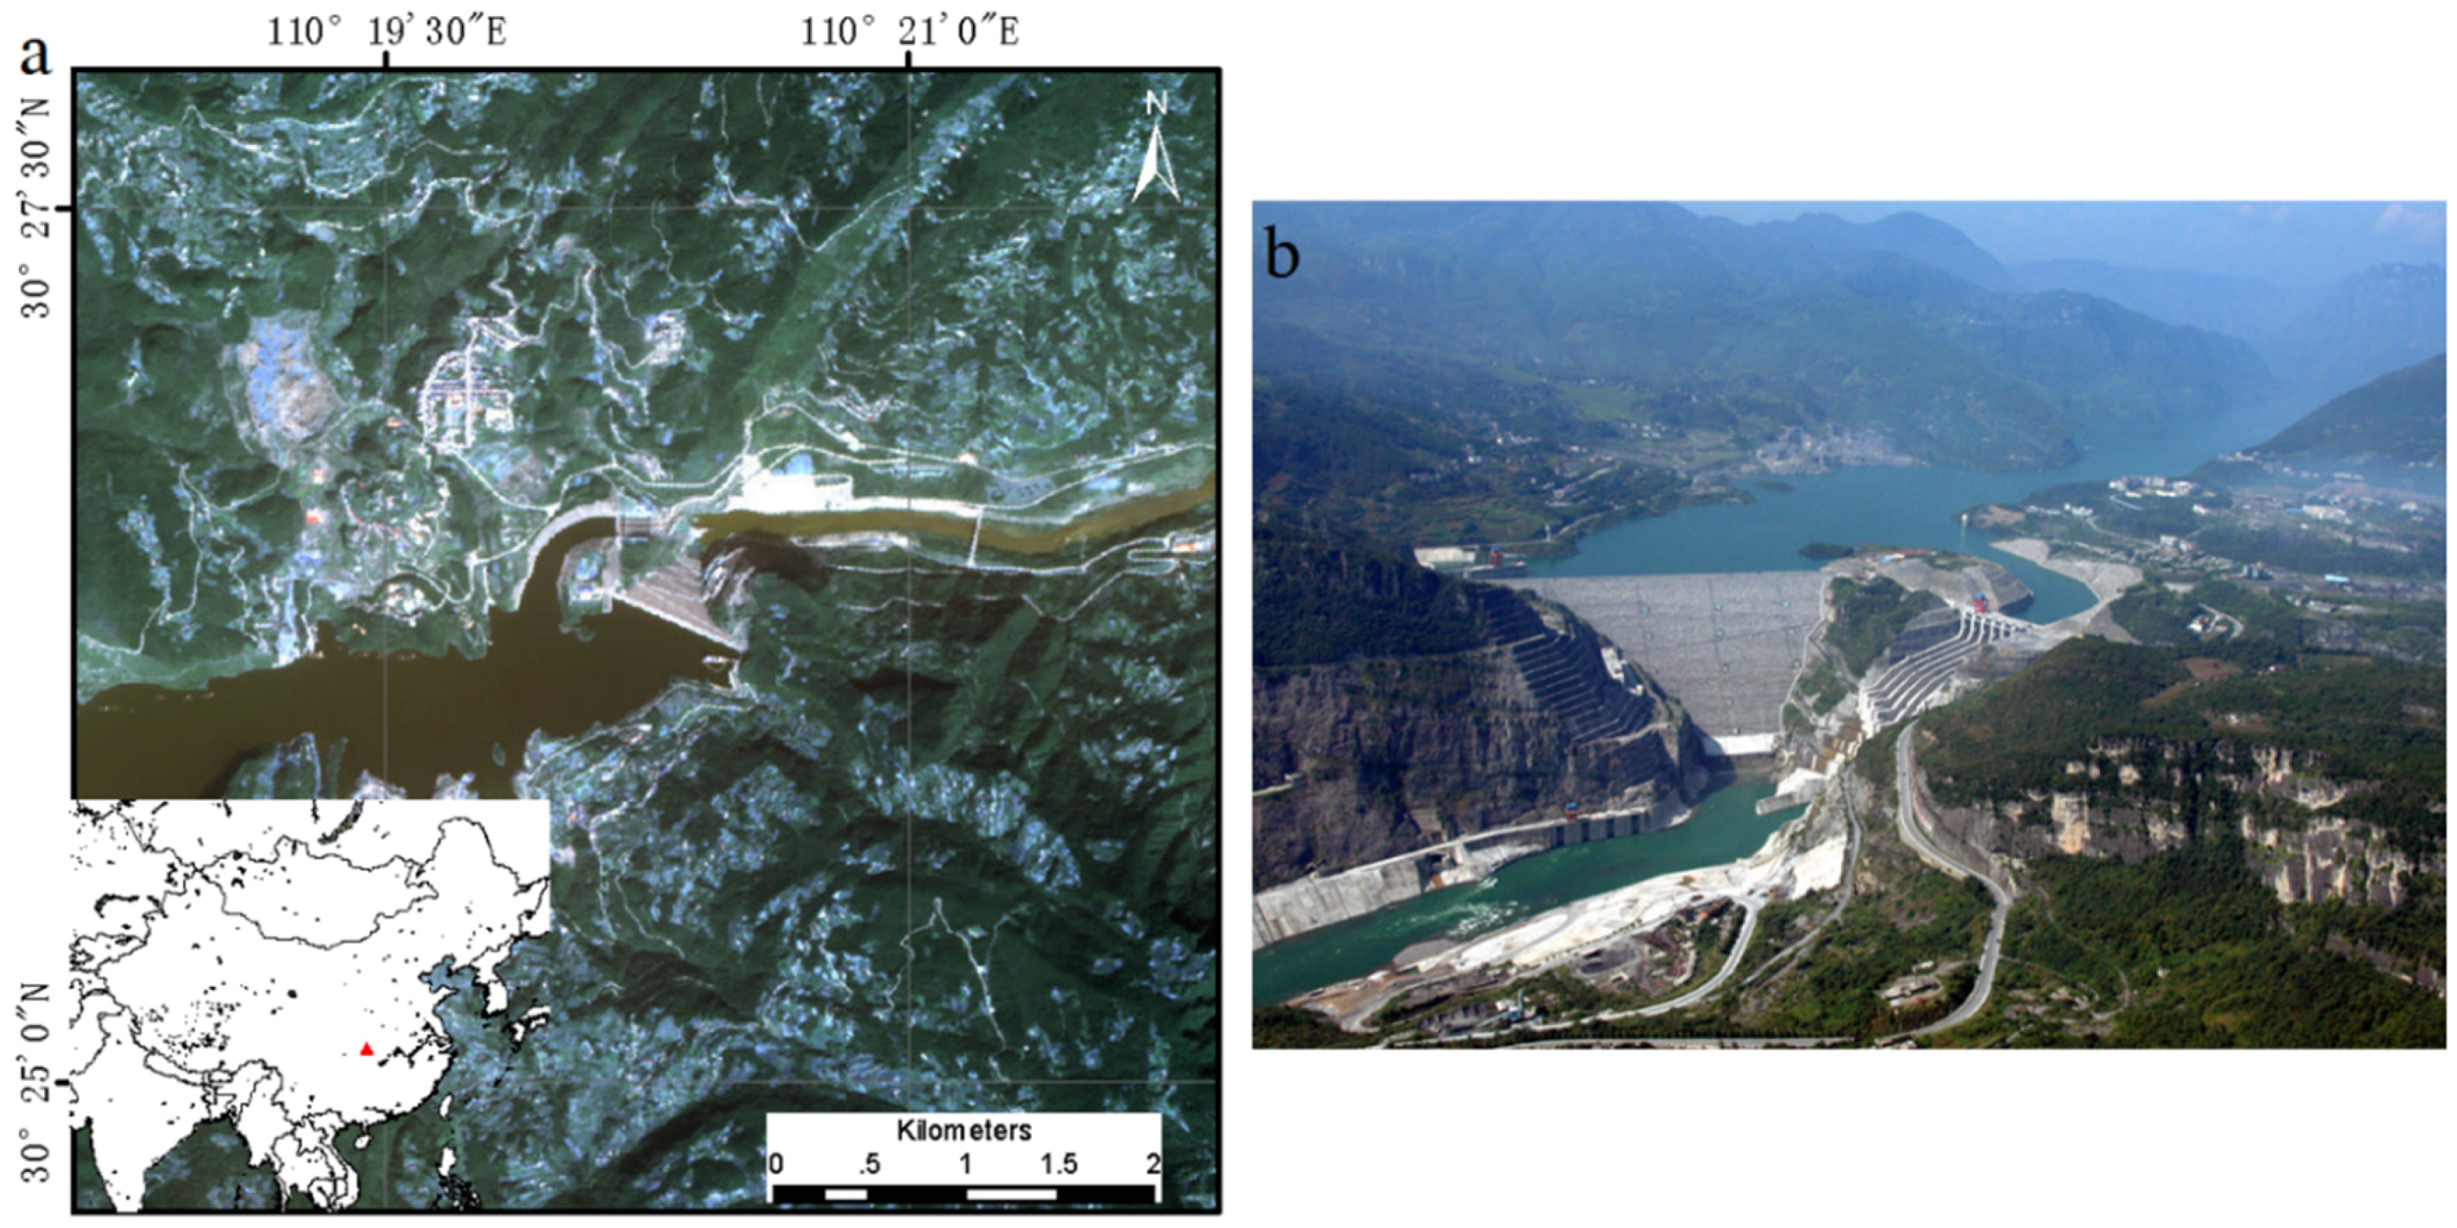
2.1. Study Area

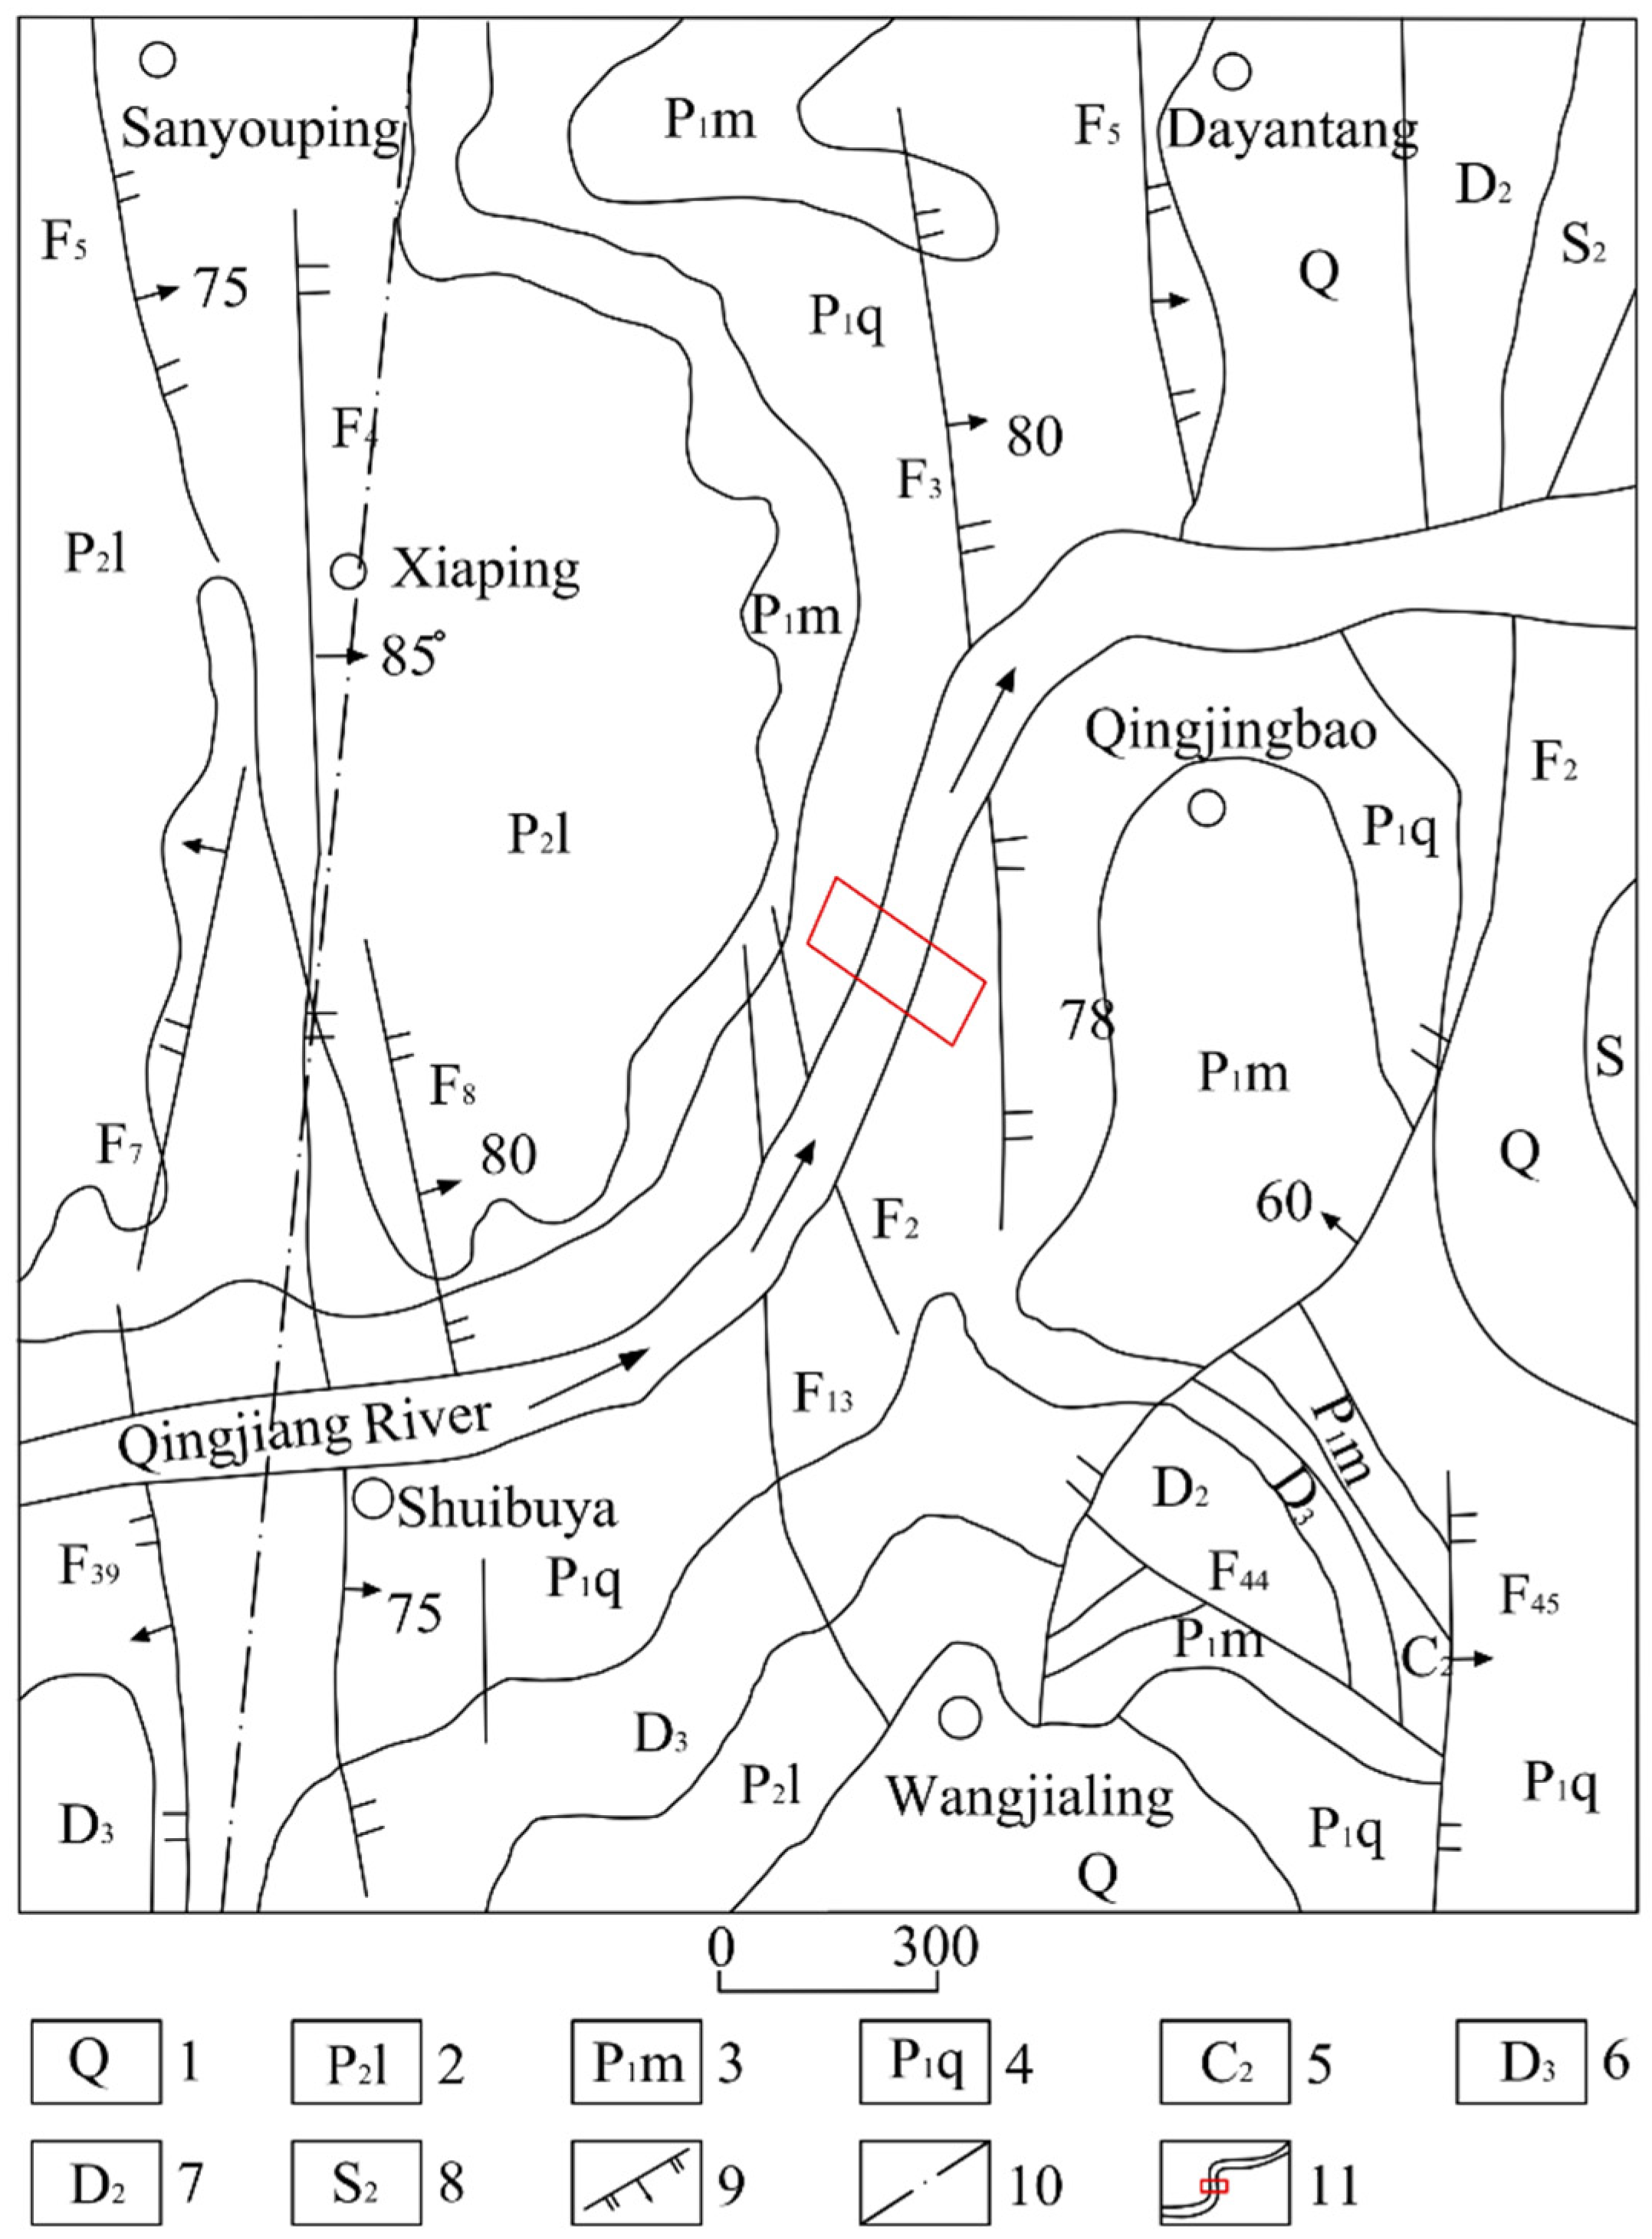
2.1.1. Geological Setting of the Shuibuya CFRD

The SBY CFRD (Figure 1) is located on the middle stream of the Qingjiang River, in the Enshi Autonomous Prefecture, Hubei Province, China, approximately 117 km upstream of the city of Enshi and 92 km from the Geheyan hydropower plant downstream. Also, there are seven towns and a big city within about 100 km downstream of the SBY dam, approximately 300,000 people in total. In the study area, fracture systems are abundant and Karst topography is well developed. Geologic structures are heterogeneous and the geological materials are anisotropic, exhibiting mechanical behavior that strongly depends on the presence of discontinuities. There are nearly 90 faults beneath these hydraulic structures, with lengths ranging from ten meters to one hundred meters. Approximately 89.3% of the faults are steep in angle and they mainly trend NNE, NNW, NE, NWW, and NEE (Figure 2) [16].
Beneath these hydraulic structures, the rocks of the interlayer shear zone are Devonian, Carbonic, and Permian in age (Figure 2). Based on previous investigations, there are approximately sixty interlayer shear zones in the Carbonic and Permian layers. These shear zones strongly affect the stability of the dam because most of them soften easily, especially in the mire zone or the mire membrane [16,17].
According to a geologic assessment and a geostress survey conducted for the site, the initial stress of the rock in the SBY Dam is controlled by gravity and the topography of the valley. Within the SBY Dam zone, the dam foundation is a multi-layer hydrogeological structure. It consists of impervious beds and water-resistant layers from top to bottom. The Permian limestone makes up the impervious beds. The water-resistant layers are composed of Permian, Carbonic, Devonian, and Silurian facies. In particular, the Permian facies of the interlayer shear zone, consist of marlite and argillaceous limestone [17].
The foundation of the dam has a large influence on the stability and safety of the dam. The pressure of the reservoir water and the force from the dam’s gravity cause deformation of the foundations, which can then influence the deformation of the dam and affect the stress state of the concrete slab. Cracks in the concrete slab will increase the possibility of dam collapse. Therefore, the geological characteristics of the dam’s foundations are important for high rockfill dams and they must be surveyed with care.

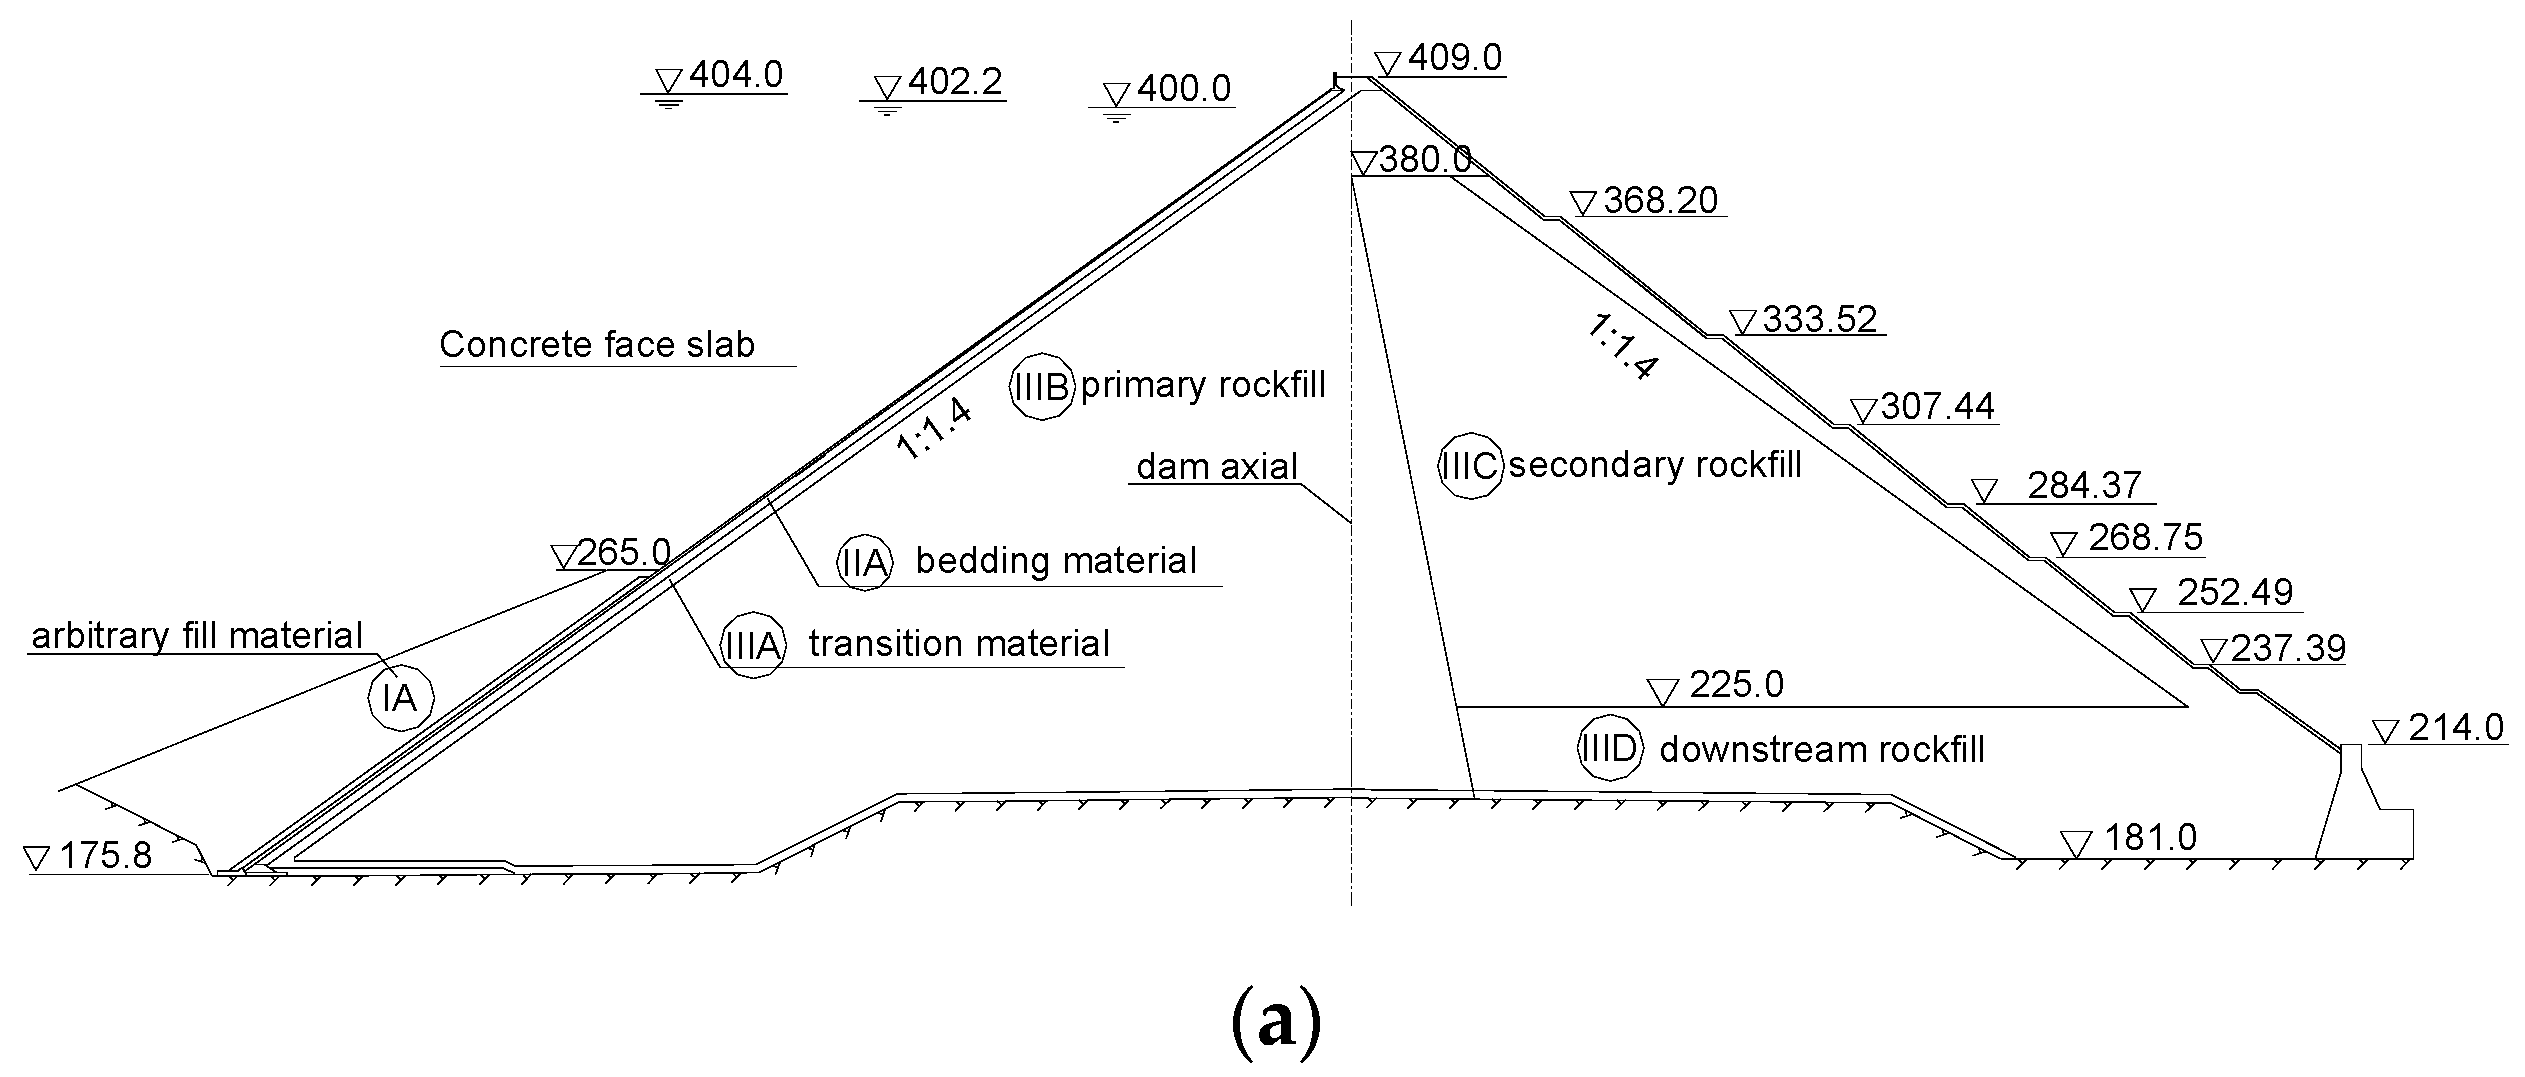
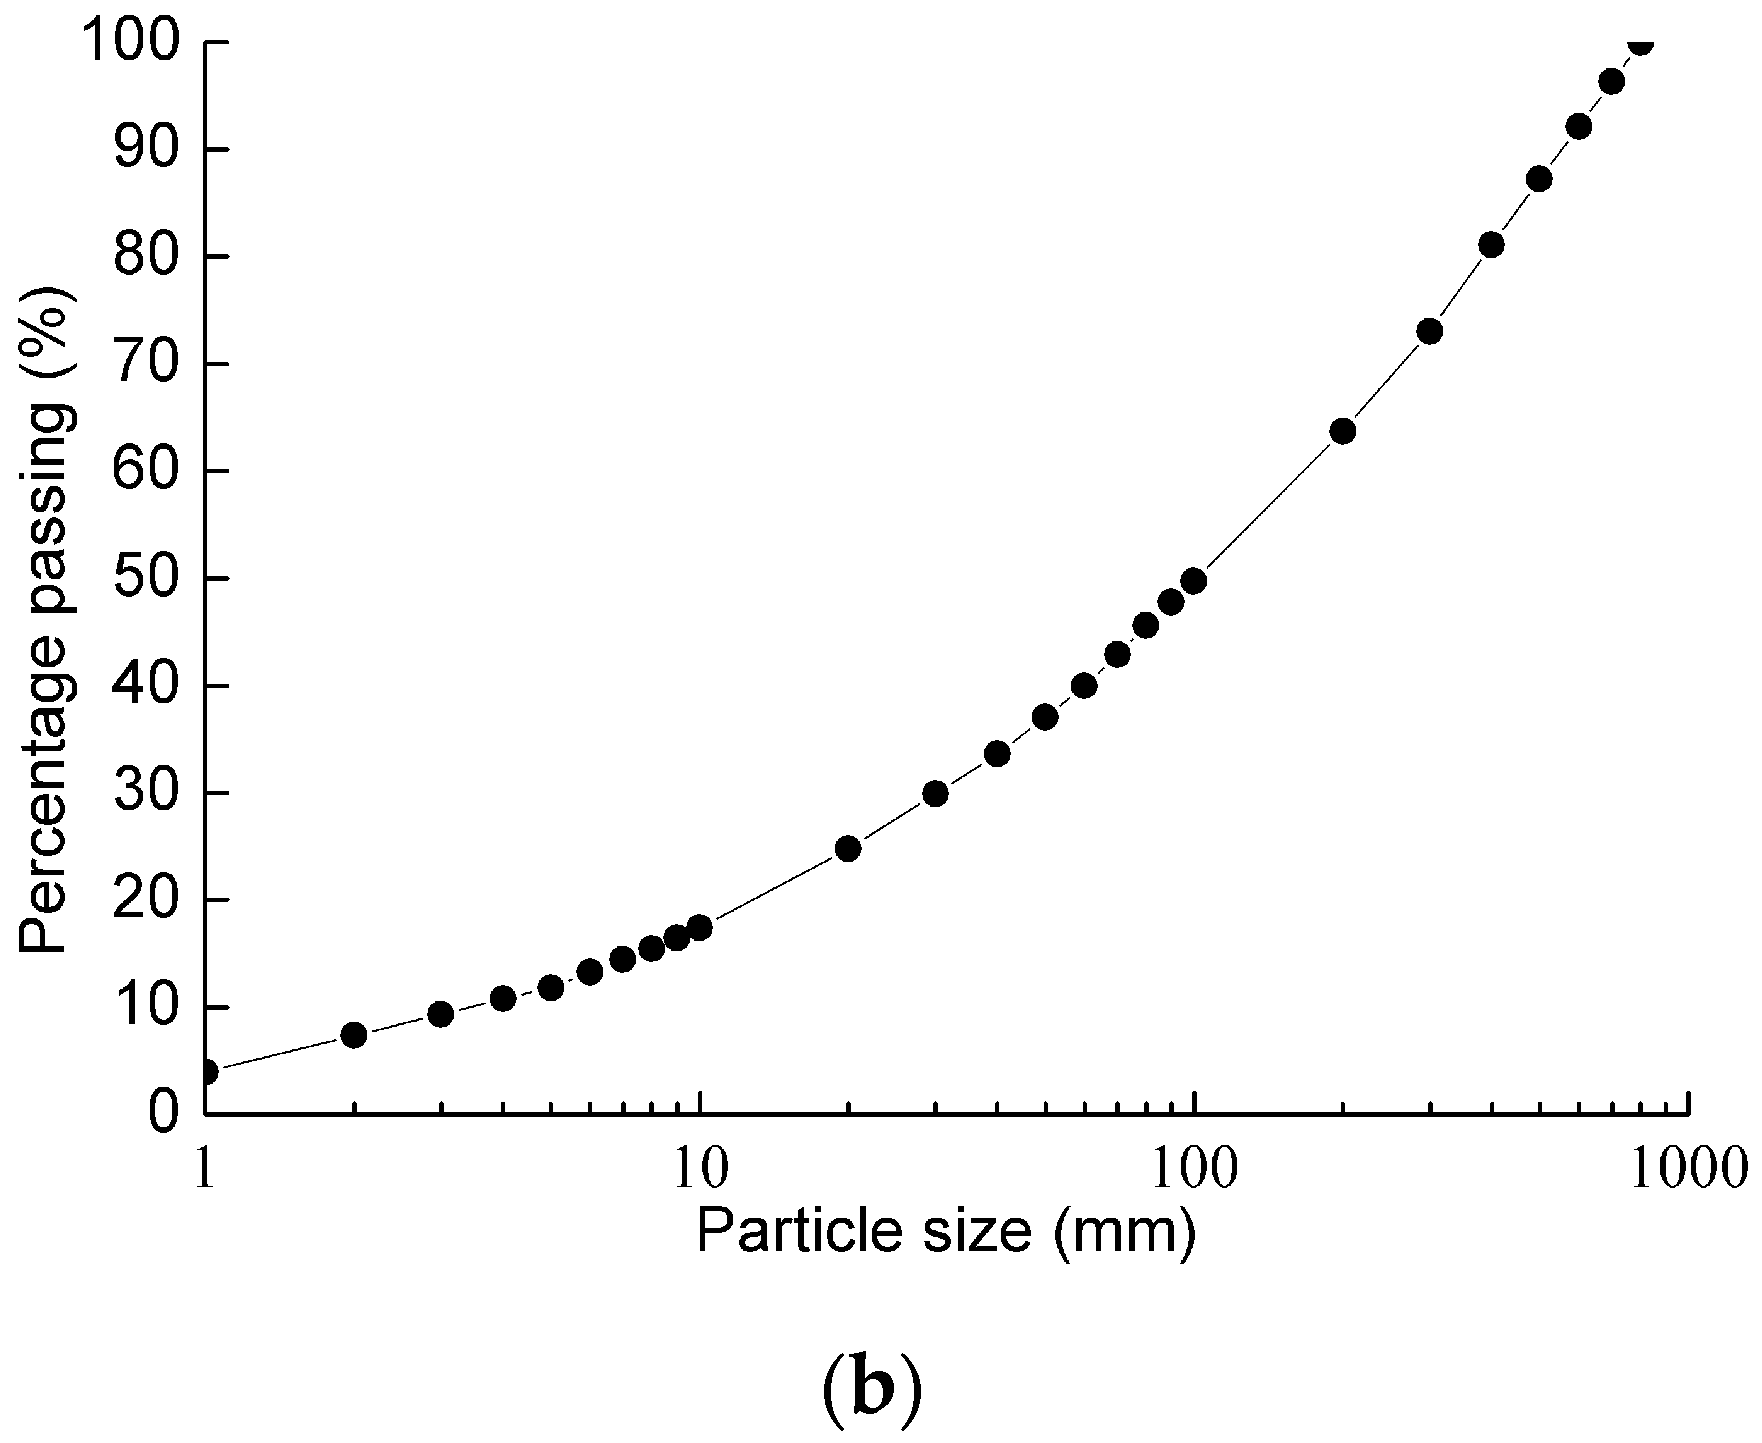
2.1.2. The Shuibuya CFRD

The height of the SBY CFRD is 233.5 m and the crest length is 675 m. The normal water level of the reservoir is 400 m and the maximum water storage of the reservoir is approximately 4.59 × 10⁹ m3. The SBY Dam has four generators in its underground power plant, with a total electric generating capacity of 1840 MW. The dam is a typical concrete face rockfill dam and its body is composed of six material zones: arbitrary fill material (IA), bedding material (IIA), transition material (IIIA), primary rockfill (IIIB), secondary rockfill (IIIC) and downstream rockfill (IIID), as shown in Figure 3a. The total volume of the filling material is 1.66 × 10⁷ m3; the volume of IA is 9.45 × 10⁵ m3, the volume of IIA is 3.84 × 10⁵ m3, the volume of hard limestone in IIIA is 7.21 × 10⁵ m3, the volume of limestone in IIIB is 8.25 × 10⁶ m3, the volume of a hard and soft intrusion agent in IIIC is 4.08 × 10⁶ m3, and the volume of hard rock in IIID is 2.22 × 10⁶ m3. The biggest rockfill particle is 800 mm, the smallest is 1 mm and more than 50% are greater than 100 mm (Figure 3b). The maximum cross-section of the SBY CFRD is shown in Figure 3a. The integrated slope of both the upstream dam and the downstream dam is 35.35° (1:1.4, vertical: horizontal). The boundary of the primary and secondary rockfill zone begins at an altitude of 380 m in the axis of the dam and ends at the downstream end of the dam with a slope of 1:0.2 (vertical:horizontal).
The excavation of the dam plinth above 200 m began in September of 2001 and finished in October 2002, when construction began. In January 2005, the concreting of the first-stage face slab was finished and the reservoir filling began when the dam height reached 405 m. Concreting of the third-stage face slab was completed in March 2007 and the construction of the entire dam was finished in July of 2008. The reservoir was filled in several sequential steps over the period from October 2006 to November 2008.

2.2. Ground Data

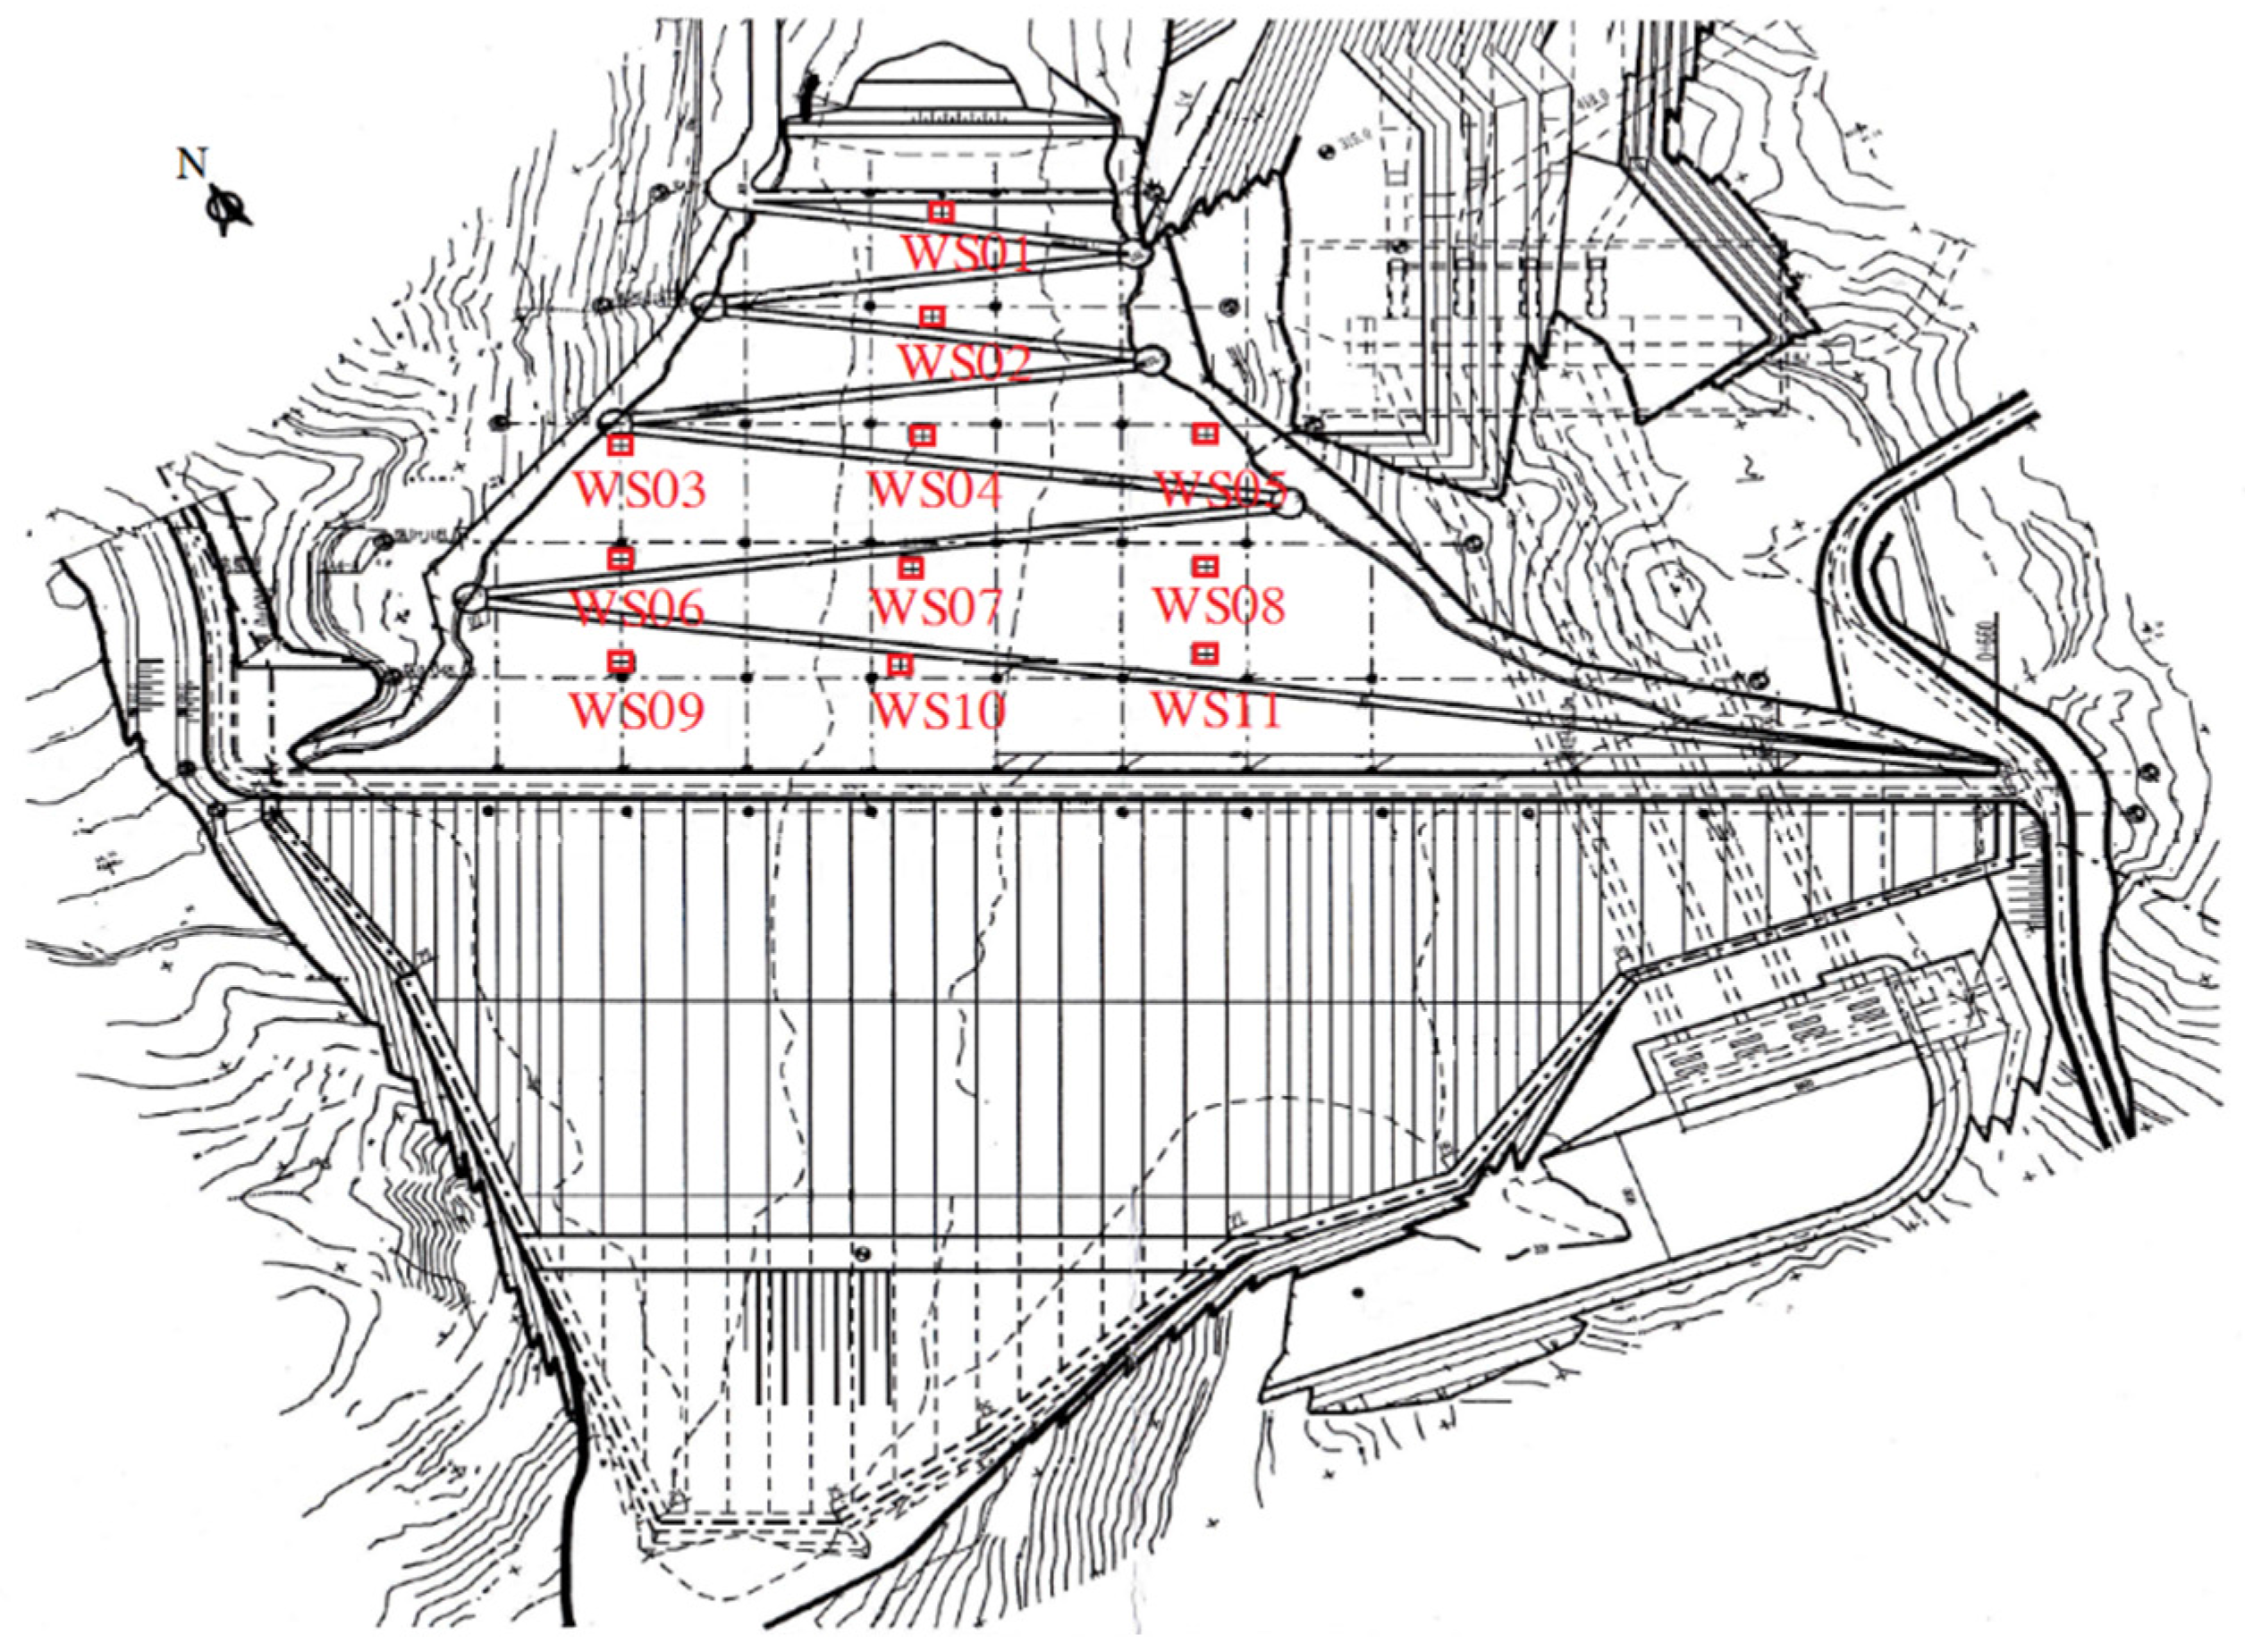
2.2.1. Ground Monitoring System

Because of the significance of the project, an improved and detailed settlement monitoring system was implemented for the SBY CFRD. The system includes an exterior settlement monitoring system (ESMS), an interior settlement monitoring system (ISMS), a dam foundation settlement monitoring system (DFSMS), a slab deflection deformation monitoring system (SDDMS), a disengaging of face slab monitoring system (DFSMS), and a peripheral joint monitoring system (PJMS). Moreover, there are many piezometers and earth pressure cells installed throughout the dam. The ESMS include seven monitoring lines (SA1 to SA7) that consist of 56 measurement points and eleven monitoring stations distributed downstream of the dam (Figure 4). The eleven monitoring stations (WS1 to WS11) were established at elevations of 235 m, 265 m, 300 m, 335 m, and 370 m to monitor the settlement of the downstream dam surface as well as the settlement of the ISMS (Table 1). We analyze and discuss here the details of the eleven ESMS stations.

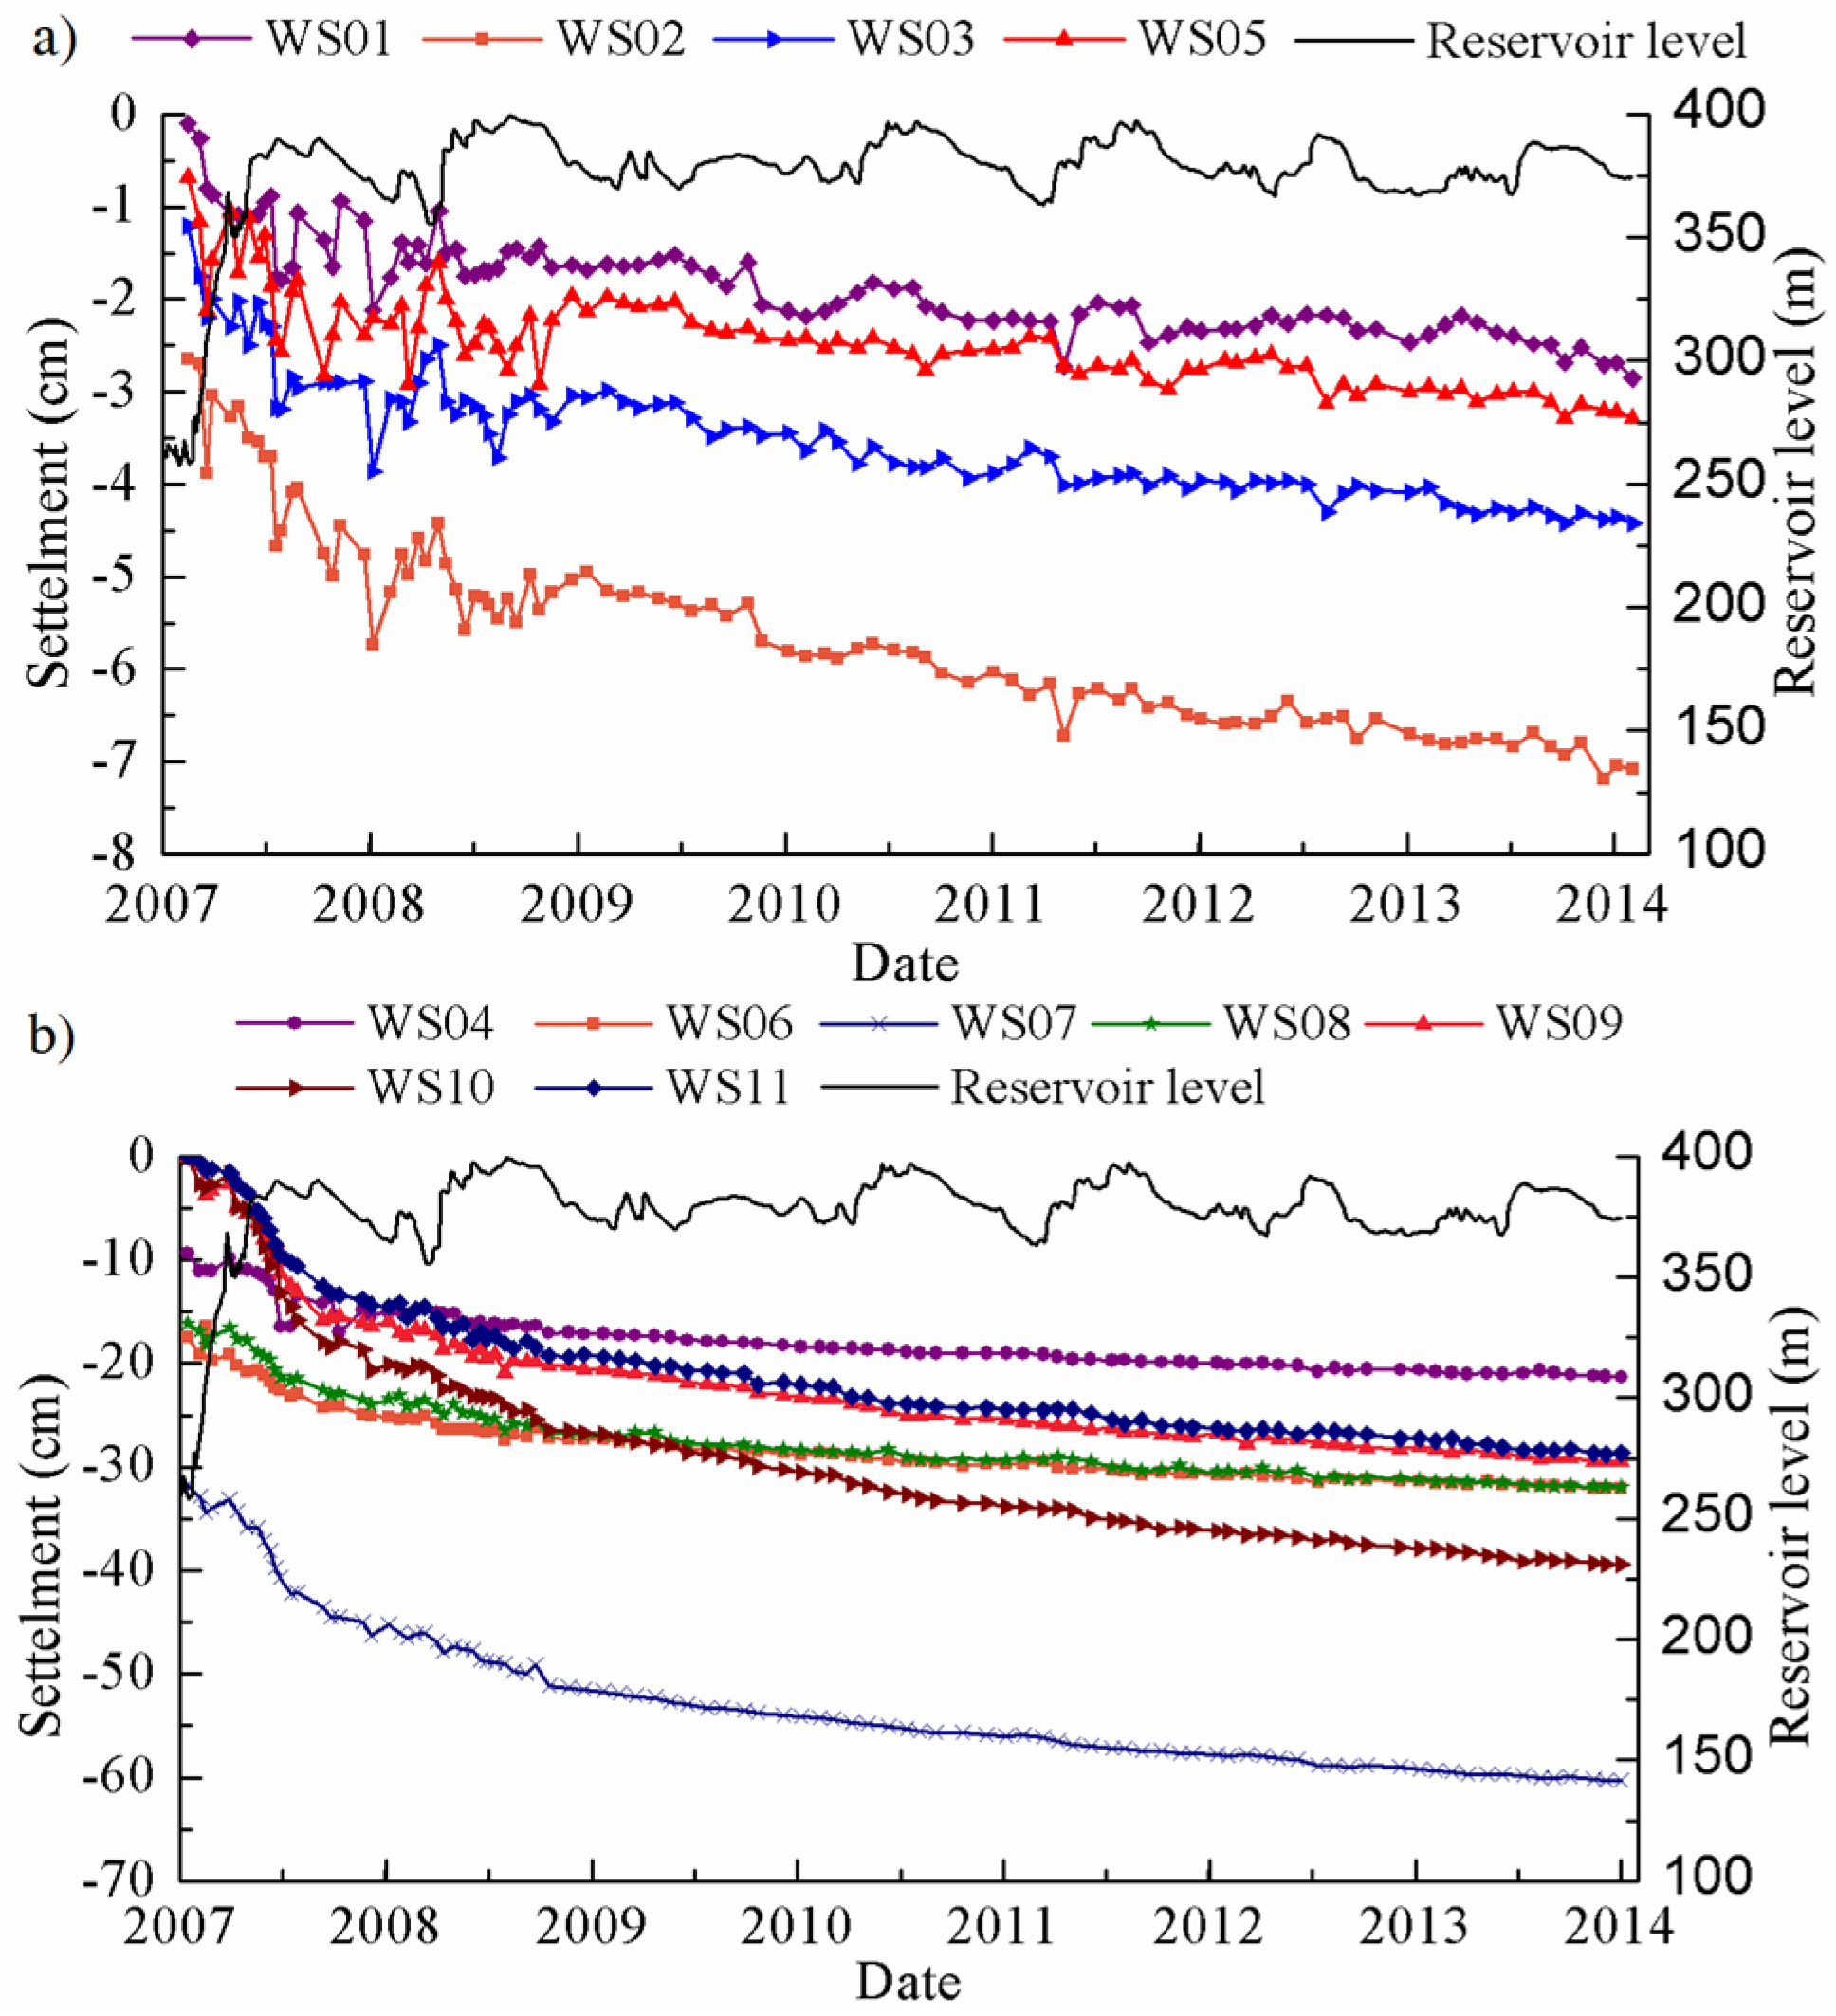
2.2.2. Ground Monitoring Results

The external monitoring records used in this study are from June 2006. The deformation of the monitoring points was evaluated for three different reference periods:
  • The period of dam construction (before October 2006).
  • The period during the first reservoir filling (October 2006–September 2007, when the water level was between 205.06 m above sea level and 389.61 m).
  • The period of operation (September 2007–January 2014, when the water level was between 359.68 m and 398.56 m).
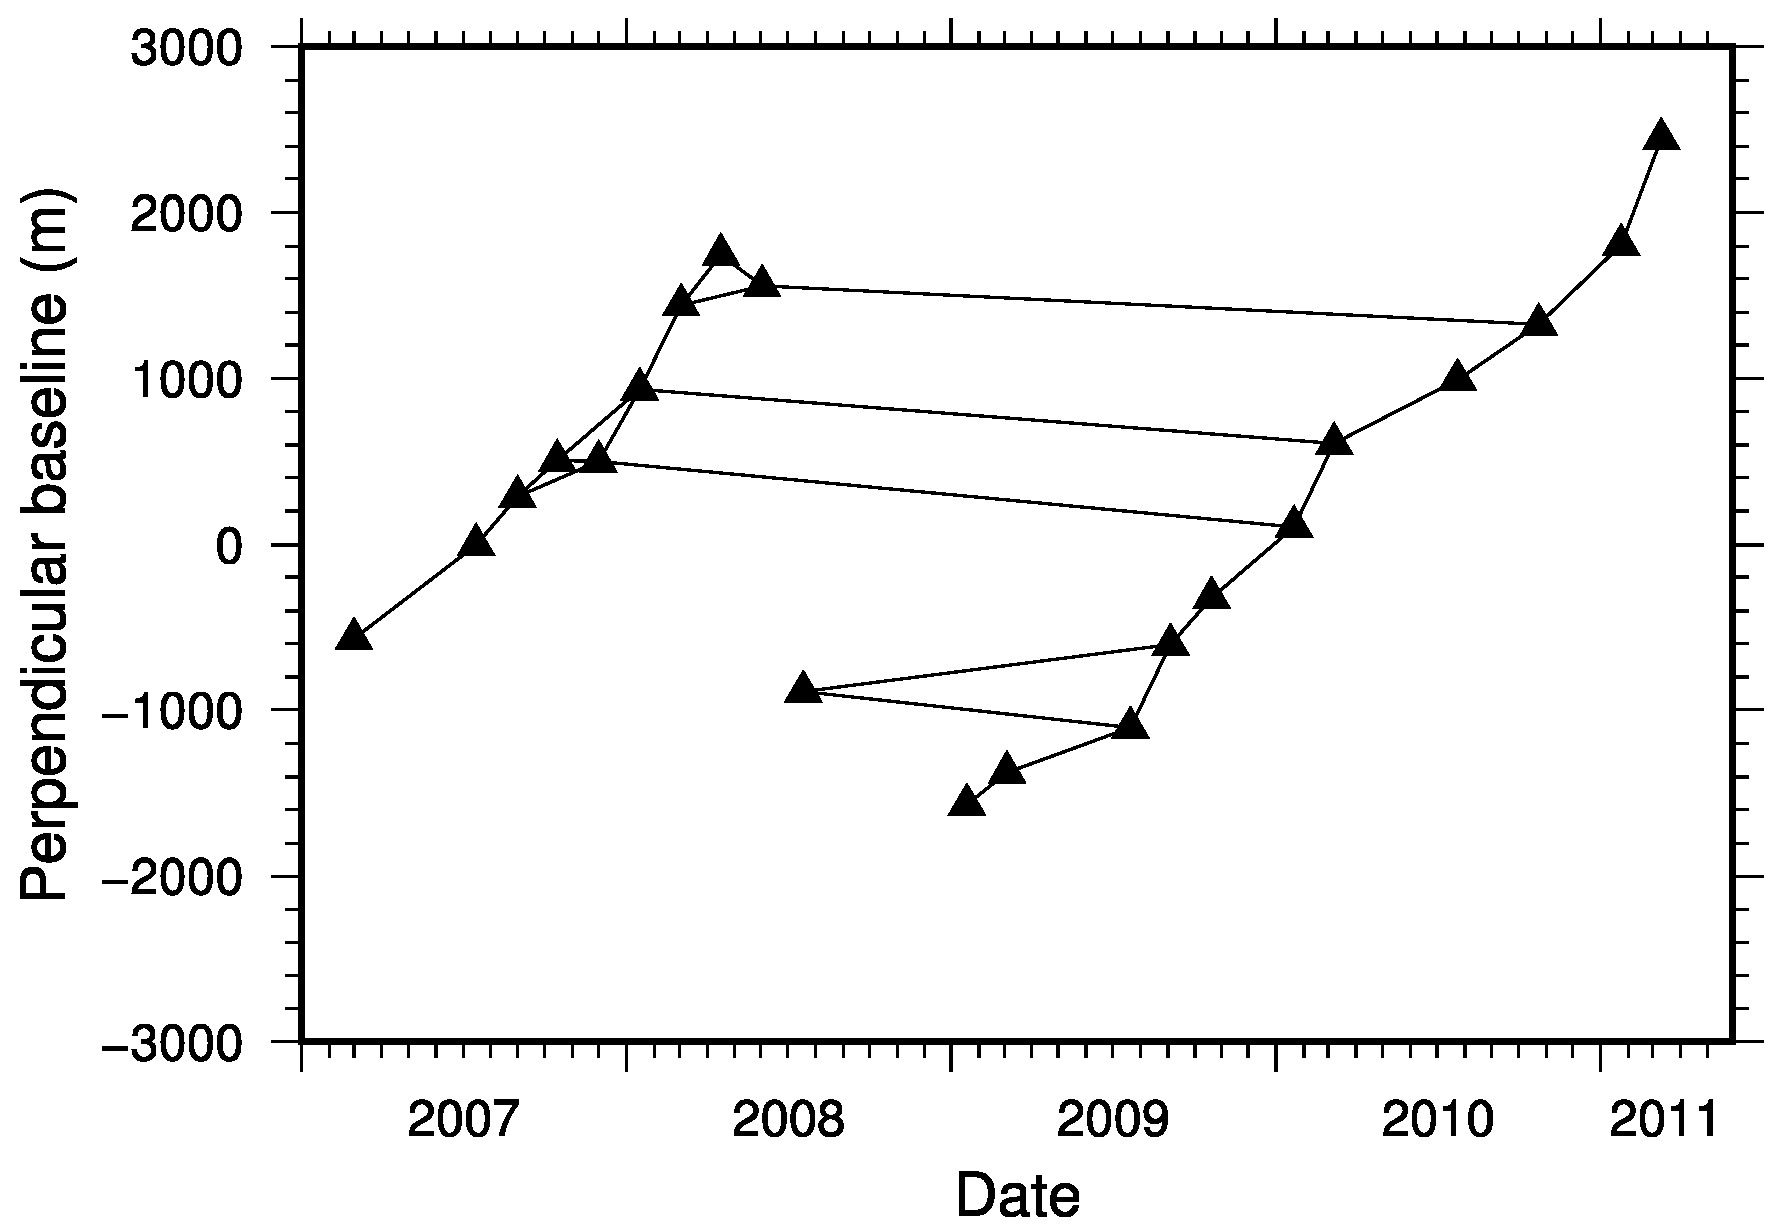
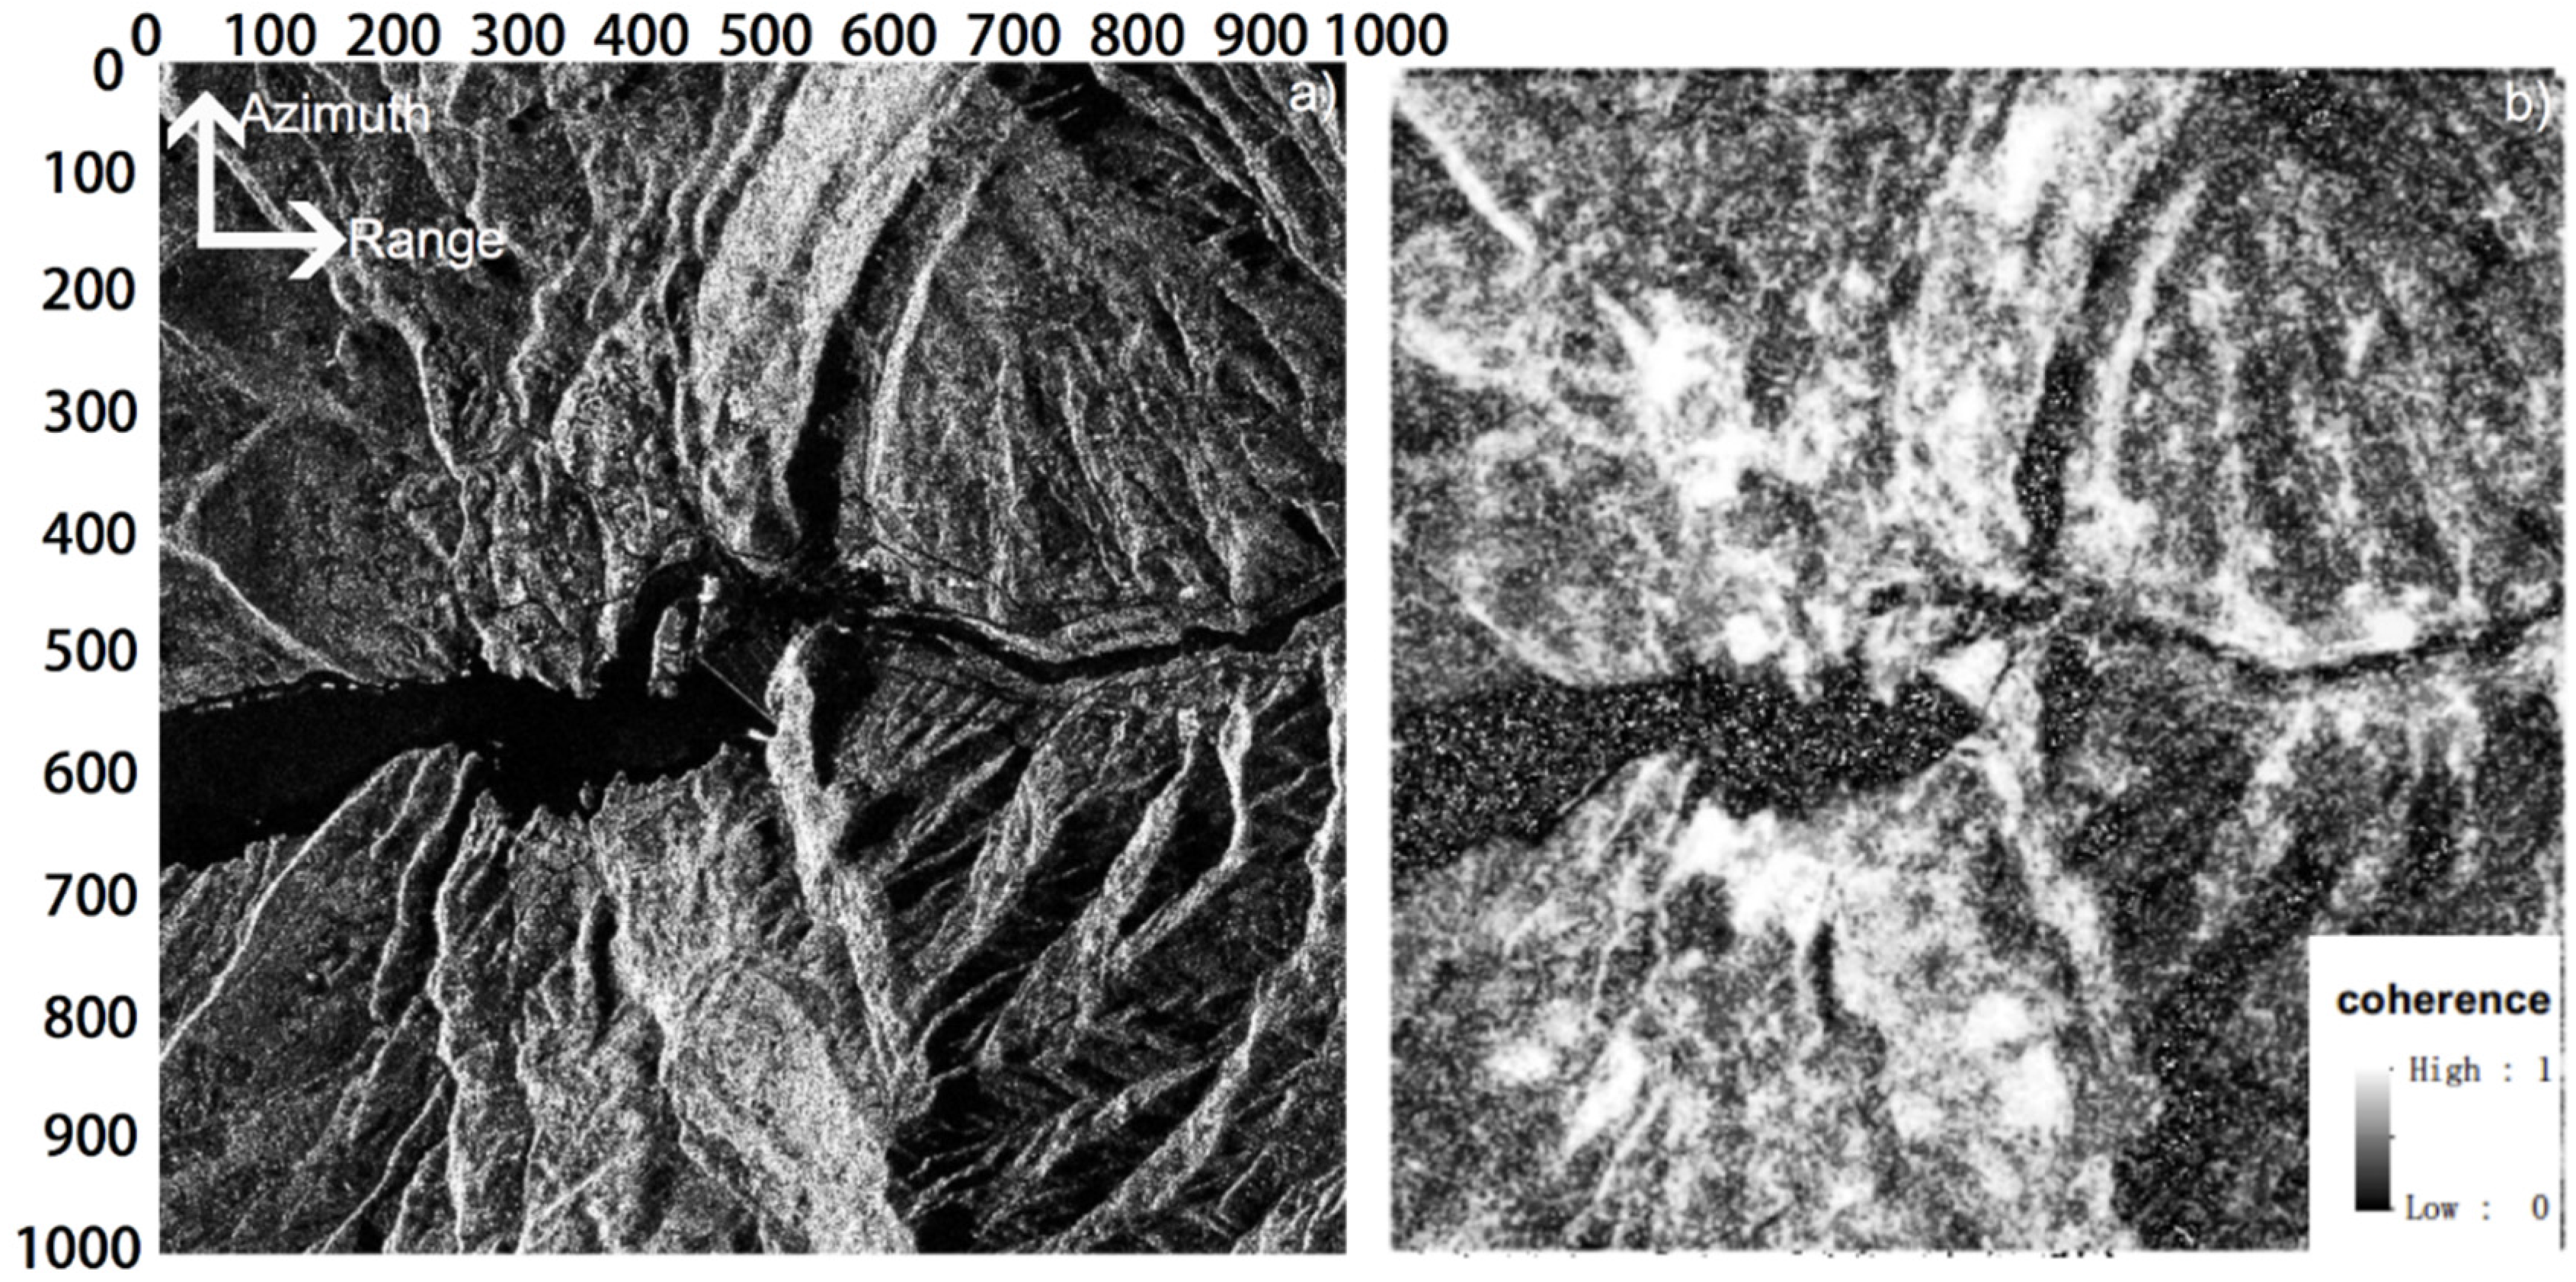
Figure 5 shows the levelling deformation results of the eleven monitoring stations (WS01-WS11). The levelling records begin after the completion of the construction and cover the period when the reservoir was first filled as well as the later dam operation. During the first reservoir filling, when the reservoir water level was rising continuously, the dam settlement increased rapidly. Most of the external settlement occurred during the first reservoir filling stage. After the reservoir was filled, the settlement continued, but at a slower pace. The settlement of the monitoring points gradually stabilized and the rate of settlement decreased with time as the dam deformation stabilized. The total settlement recorded by the ESMS is consistent with the expected excess load caused by the construction and the impoundments. Over all the monitoring points considered, the settlement patterns are similar, which means that no heterogeneities are present in the dam. The absence of such anomalies suggests that this is a common behavior for this type of dam and that the SBY CFRD is well constructed and operated.

2.3. SAR Data

For mapping the displacement of the SBY dam, twenty-one ascending ALOS-1 PALSAR L-band (~23.6 cm) images acquired from the Japan Aerospace Exploration Agency were used in this study (Figure 6). The ALOS-1 satellite was launched in January 2006 and terminated in April 2011. Only images from 28 February 2007 to 11 March 2011 were processed, to represent the period after completion of the dam. In the single-imaging mode, the resolution of the images is approximately 4.7 m in the slant range and 4.5 m in the azimuth direction. The incidence angle is about 38.7°. There are many archived ESA Envisat C-band (~5.6 cm) images, however their finest resolution is approximately five times coarser than the PALSAR data. Considering the size of the dam, Envisat C-band data is not suitable for this study. In the finest imaging mode, the resolution of the TerraSAR-X and Cosmo-SkyMed X-band (~3 cm) images are much higher (up to 1 m) than the PALSAR data, but there is very little archived data in this area at present, and so these data are also inappropriate for the InSAR time series analysis used in this study. In addition, the L-band has better penetration capability, which could provide stronger radar signals of the dam surroundings than C-/X-band, as the surroundings of the dam are highly covered by vegetation (Figure 1). Therefore, the ALOS PALSAR dataset is currently the most suitable dataset for this study.

3. Advanced InSAR Analysis

The GAMMA processing package was used to generate a Single Look Complex (SLC) product from the set of raw SAR images. Most images were acquired in Fine Beam Single-polarization (FBS) mode; for images acquired in Fine Beam Dual-polarization (FBD) mode, an oversampling process was performed in the range direction to produce the same resolution as the FBS mode. All SLC images were co-registered to a chosen master image to match the dataset to its later interferogram generation. Next, an area of approximately 5 km × 5 km (1000 pixels × 1000 pixels) centered on the SBY Dam was cropped from the original 70 km × 70 km SLC images (Figure 7a). To generate a high phase quality of the interferograms and reduce the decorrelation effects caused by the spatial and temporal baseline, interferogram pairs with a spatial baseline below 2000 m and temporal baselines below 30 months were selected to produce all possible combinations of the interferogram. After all the interferograms had been generated by the GAMMA package, each interferogram was investigated visually, and only interferograms with a valid phase and coverage over 70% were kept for later InSAR time series analysis. Thus, out of the 21 PALSAR images, 26 interconnected interferograms were selected. These interferograms show high coherence and they are free of obvious ionospheric artefacts. The temporal and spatial baseline distribution of each interferogram is shown in Figure 6.
Subtraction of topographic fringes from each interferogram was performed using the 1-arc second Shuttle Radar Topography Mission (SRTM) Digital Elevation Model (DEM) [18]. To obtain Line of Sight (LOS) displacement, the MCF algorithm was used to unwrap the phase [19]. Given the image resolution and the size of the SBY Dam, multi-looking processing was not performed in this study. Figure 7 shows an amplitude SAR image and the average coherence map.

Time Series Analysis

In addition to the deformation signal, the unwrapped phase consists of four terms: inaccurate orbital information, topographic error, atmospheric propagation delays (atmospheric phase screen (APS)), and noise [20]. Various approaches have been developed to reduce these four terms based on multi-interferogram analysis [21,22,23,24,25]. In this study, time series analysis was performed using the InSAR Time Series with the Atmospheric Estimation Model (InSAR TS+AEM, [26]), which is based on the Small BAseline Subset algorithm (SBAS) (e.g., [22]). To select more stable pixels from the interferogram stack, the temporal or intermittent coherent pixels strategy was applied to increase the density and distribution of points [27,28]. In practice, a highly coherent pixel can be identified by its continuous coherence across acquisition dates; it is also characterized by coherent continuity in the stack of all interferograms. Due to the topographic and morphological structure of the area, high-reflectivity pixels are associated with high-coherence pixels. Furthermore, highly coherent pixels are only preserved in non-vegetated areas such as man-made constructions (dam, buildings, and roads) or bare surfaces; the interferogram degrades faster in vegetated areas, which characterize most of the slopes around the reservoir. Figure 7b shows the average coherence.
In terms of orbital error, because the study area is approximately 5 km by 5 km, a linear plane across the entire interferogram is sufficiently accurate to remove the orbital error [29]. For a given set of unwrapped interferograms, topographic error signals can be separated because they are proportional to perpendicular baselines [29]. Therefore, the first two terms can be estimated and individually removed from the unwrapped phase. Taking into account the spatial structure of atmospheric effects (only correlated in space) (e.g., the power-law process [30,31]), the APS can be estimated using a temporary linear velocity (TLV) model and distinguished from non-linear surface motion [26]. The algorithm was applied iteratively until convergence was achieved [26,32]. A small area (500 m × 500 m) in the village was assumed to be stable during the InSAR observations and was therefore selected as the reference site for the InSAR time series analysis. Because the ground levelling measurements only map vertical settlement, we also considered deformation in the vertical direction for our InSAR measurements, and the LOS mean velocity and LOS time series were both converted into vertical direction measurements. Due to the steep slope of the dam surrounding (Figure 1), layer over, foreshortening or shadow phenomena occurred on both sides of the dam in the SAR image. Geocoding or orthorectification processing causes terrain stretching in steep slope areas, and results in distortion and redistribution of topographic features. In this case study, the geocoding process caused loss of InSAR signals on the dam surface. Therefore, to avoid the above issues and to display the results better, the SAR images and the final mean velocity map were not geocoded to a geographic coordinate system (e.g., WGS-84). To investigate the accuracy of InSAR measurements, eleven points in the same locations as the eleven WS stations of the dam were used to compare the deformation rates. These eleven locations were carefully selected by cross-reference of the optical image, SAR amplitude image, and the ground monitoring locations. Additionally these eleven points were also used to present the deformation history of the dam.

4. Results

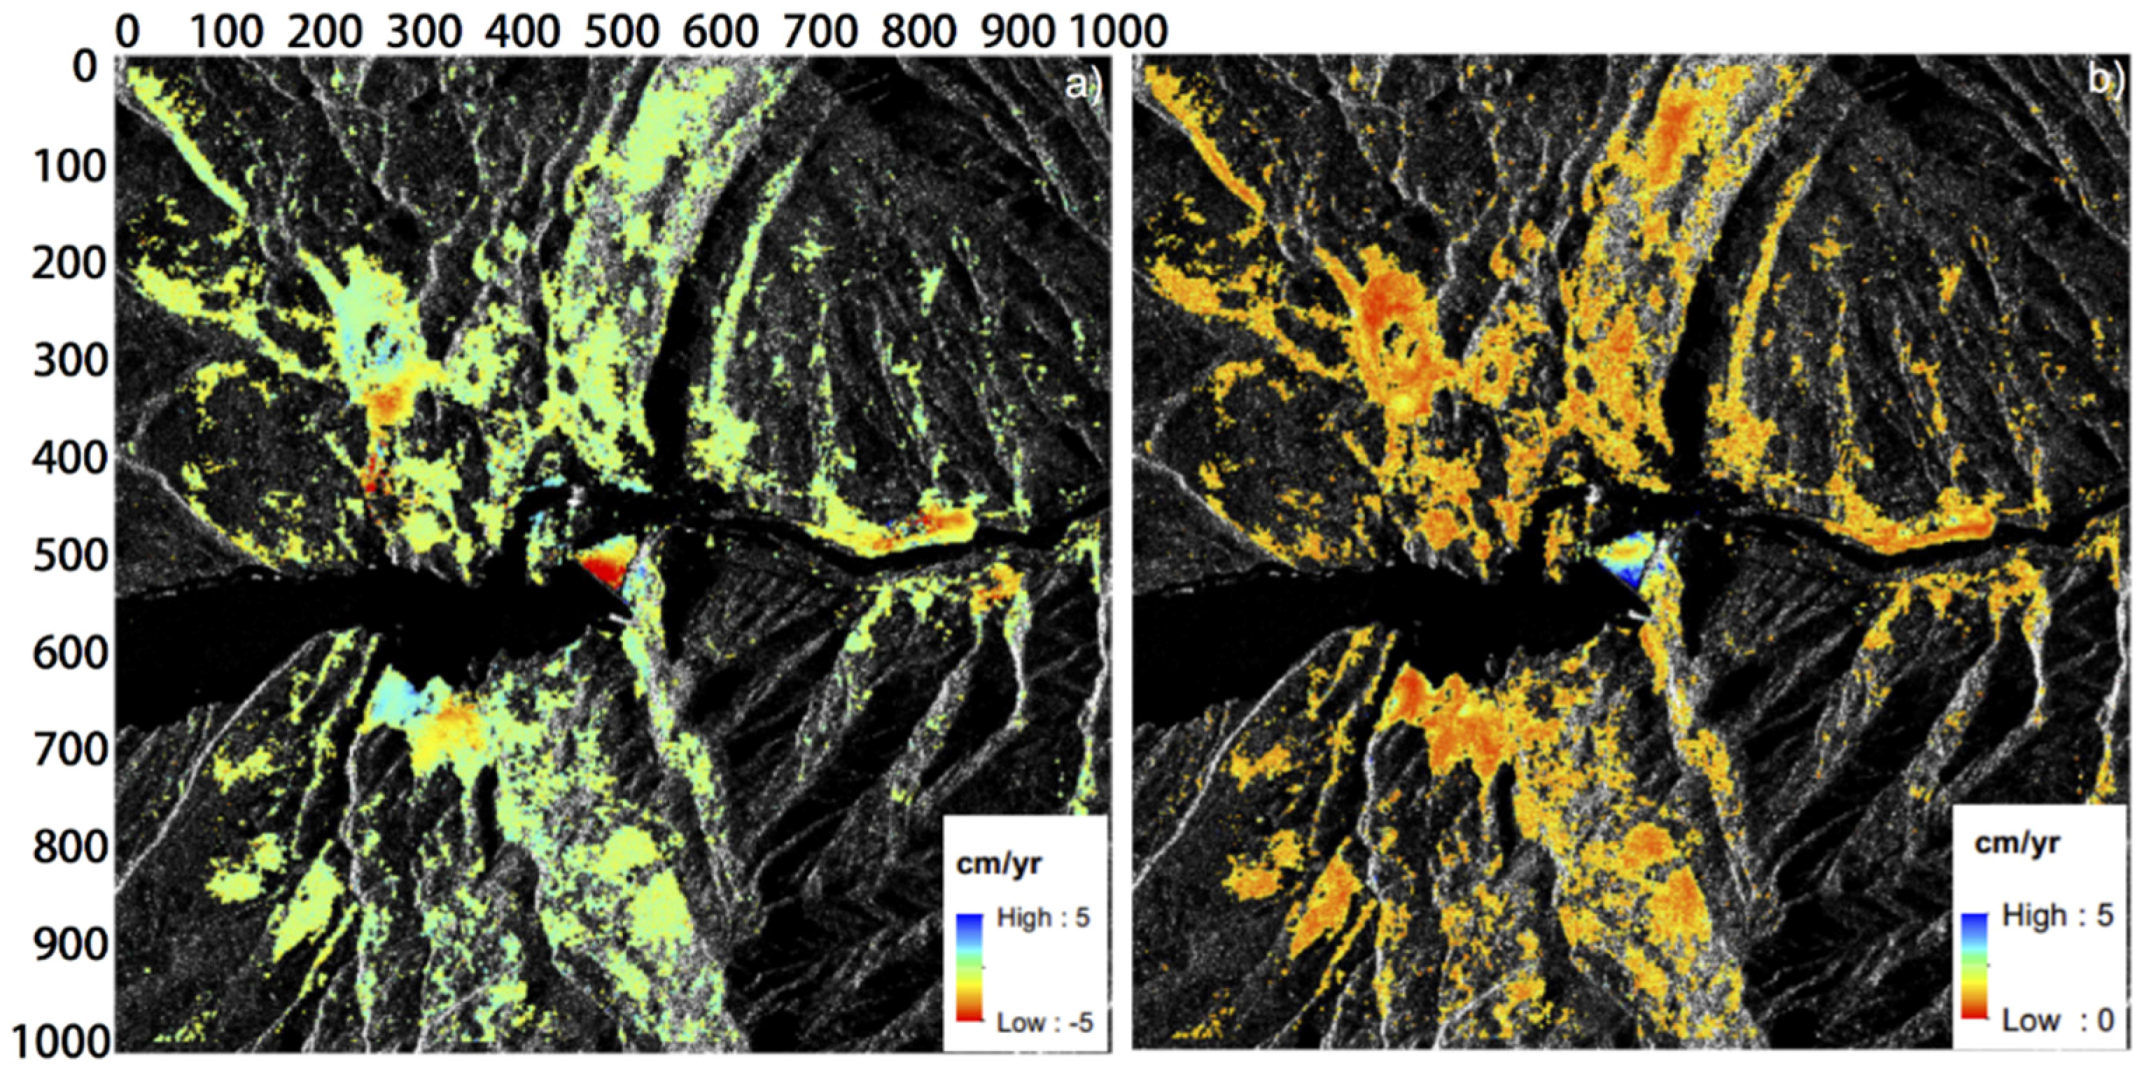
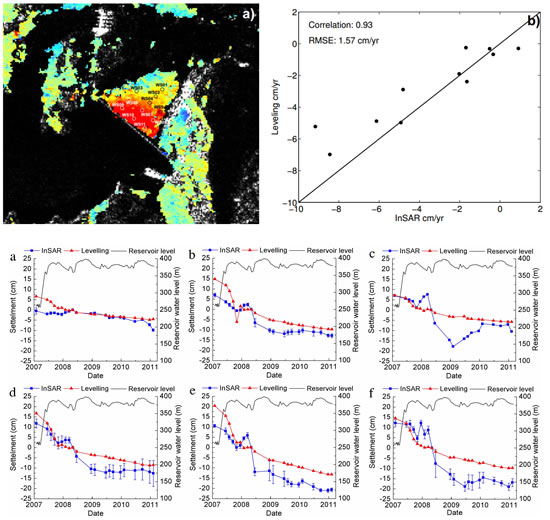
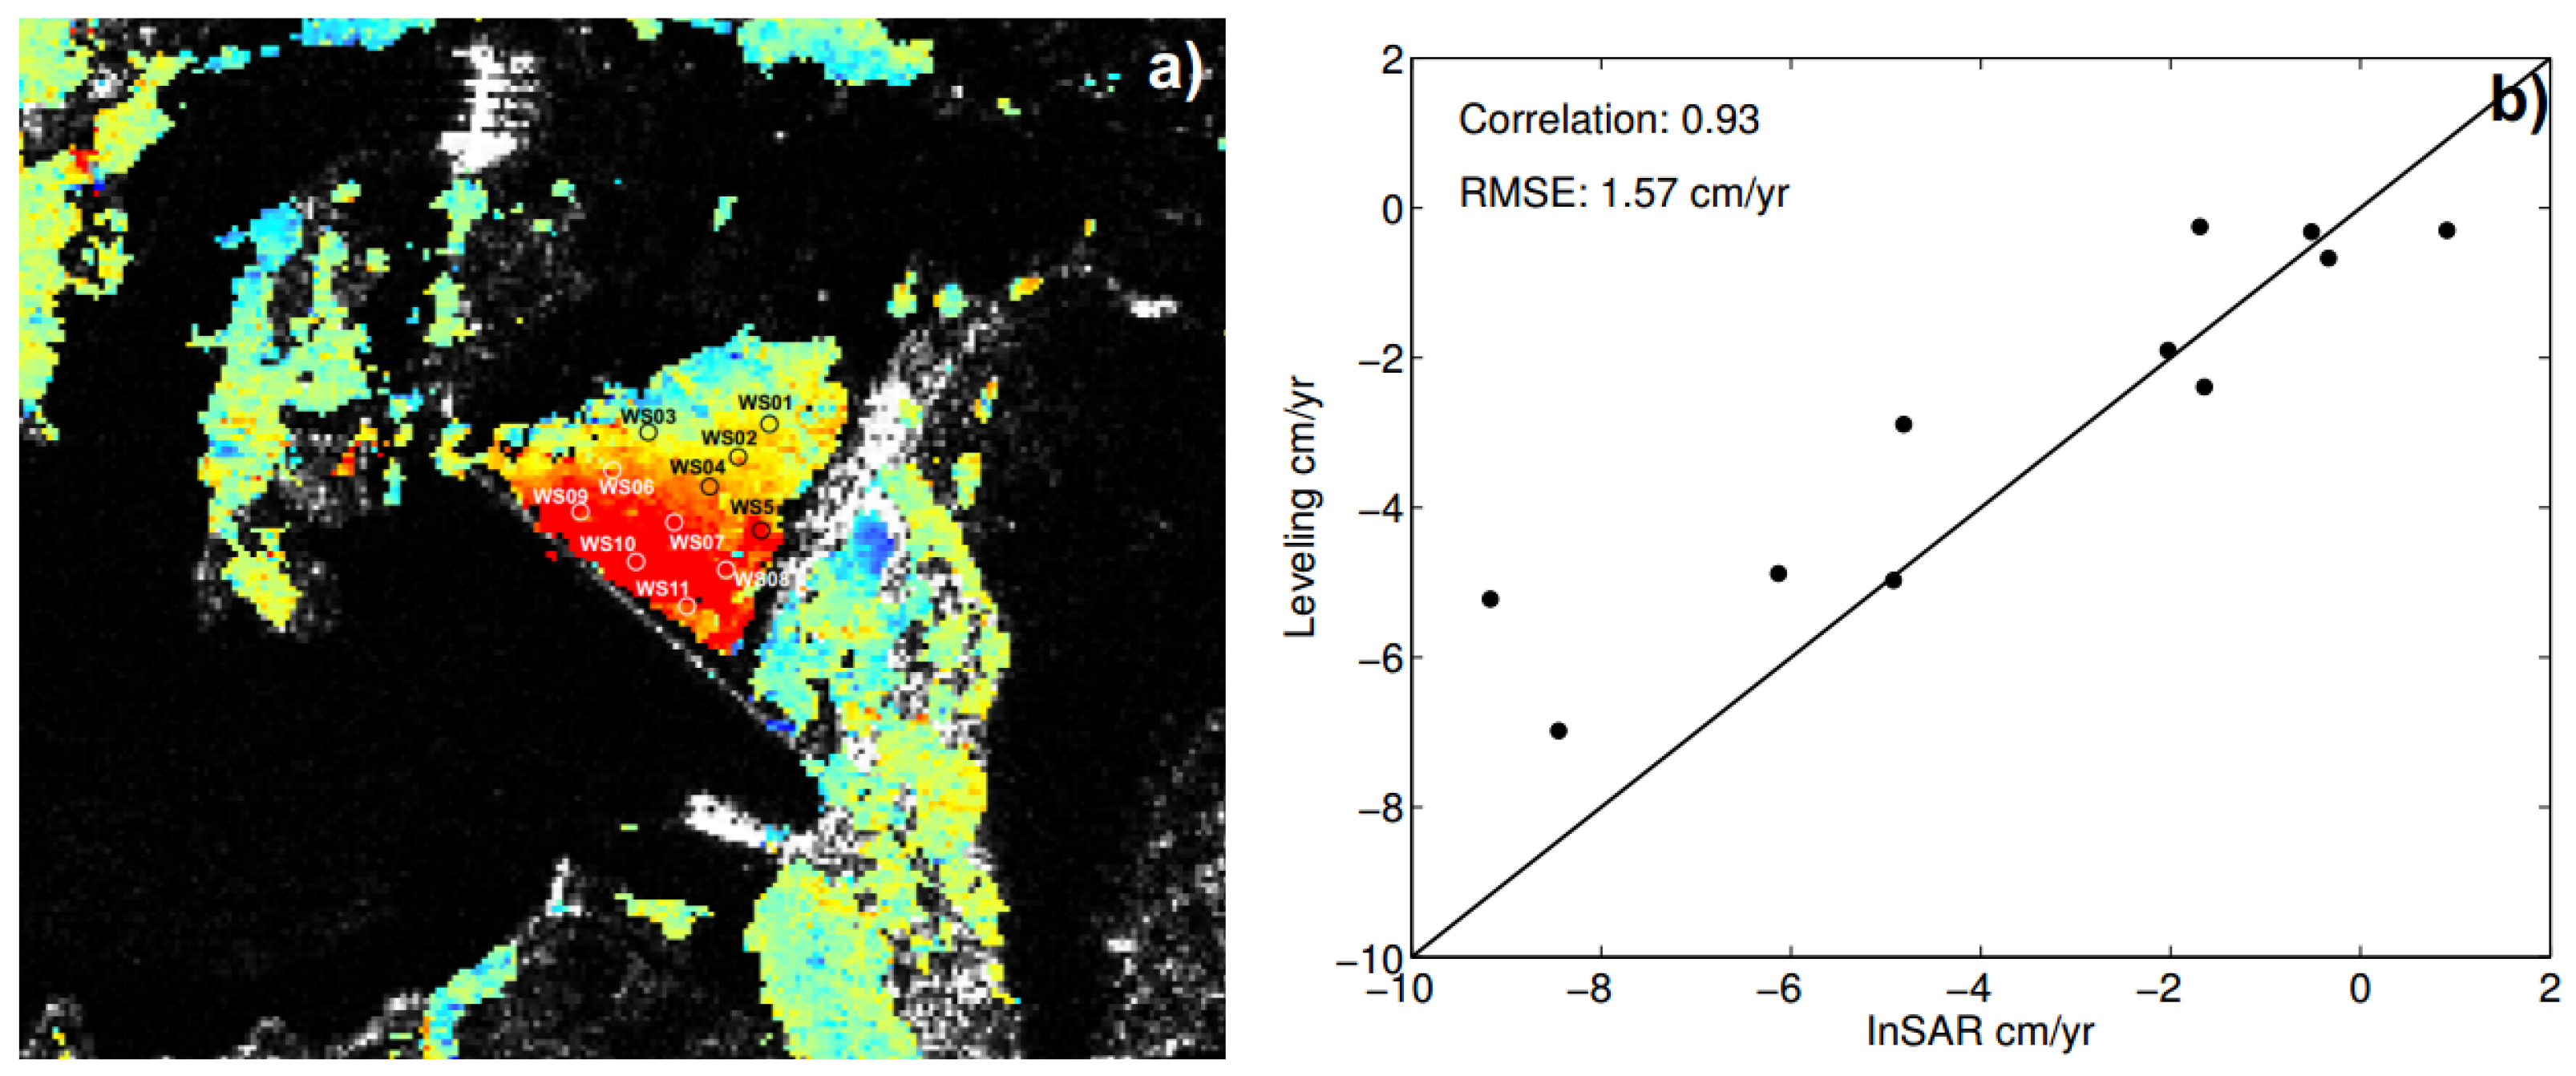
4.1. Mean Velocity and Validation

Figure 8a shows the final mean deformation velocity of the study area and the SBY Dam, and Figure 8b is its corresponding root mean square (RMS). We note that a negative value indicates that the surface is moving away from the satellite (settlement), while a positive value indicates that the surface is moving towards the satellite (uplift). From the accumulated coherent pixels shown in Figure 7b, it is apparent that stable coherent pixels are distributed in non-vegetated areas (such as the dam body, buildings, and roads), while loss of coherent pixels is often associated with vegetation. The SBY Dam shows strong coherence because of its concrete surface. From 28 February 2007 to 11 March 2011, most of the study area did not change and was relatively stable; small settlement/uplift (−3 to −1 cm/year and 1 to 3 cm/year) occurred on both sides of the river, while the SBY Dam had the largest settlement (Figure 9a). Based on local landslide records, the small amounts of settlement/uplift along the river were most likely caused by landslides. No obvious surface settlement was observed in the small villages, as would be expected. The obvious settlement occurred in the SBY Dam, with a mean settlement velocity of up to −10 cm/year. Figure 8a shows that the largest settlement happened in the upper and middle parts of the dam, while the sides and the bottom of the dam presented relatively small or no changes. In addition, no obvious settlement occurred on the sides of the dam. Figure 8b shows the dam body has large RMS, ranging approximate from 1 to 5 cm/year, while the rest of the study area has very small RSM (lower than 1 cm/year).
To quantify the settlement derived by InSAR in this study, a buffer of 3 × 3 windows centerd on each levelling route (Figure 4) was chosen as the InSAR measurements (Figure 9a). This reduces the effects of noise from the InSAR measurements as well as ensuring the same settlement pattern. All coherent pixels inside this buffer were used to calculate an average velocity; these values are shown in Table 2. The correlation and the root mean square error (RMSE) are shown in Figure 9. Based on the eleven monitoring stations, the correlation between the two measurements is up to 0.93, and the RMSE is 1.57 cm/year. The accuracy of our InSAR measurements is up to 1.11 cm/year if the levelling measurements are used as a reference. Our results show that the mean settlement rate measured by InSAR is in good agreement with the rate measured by levelling. Thus, settlement of the SBY CCRD can be accurately identified using the InSAR time series method.

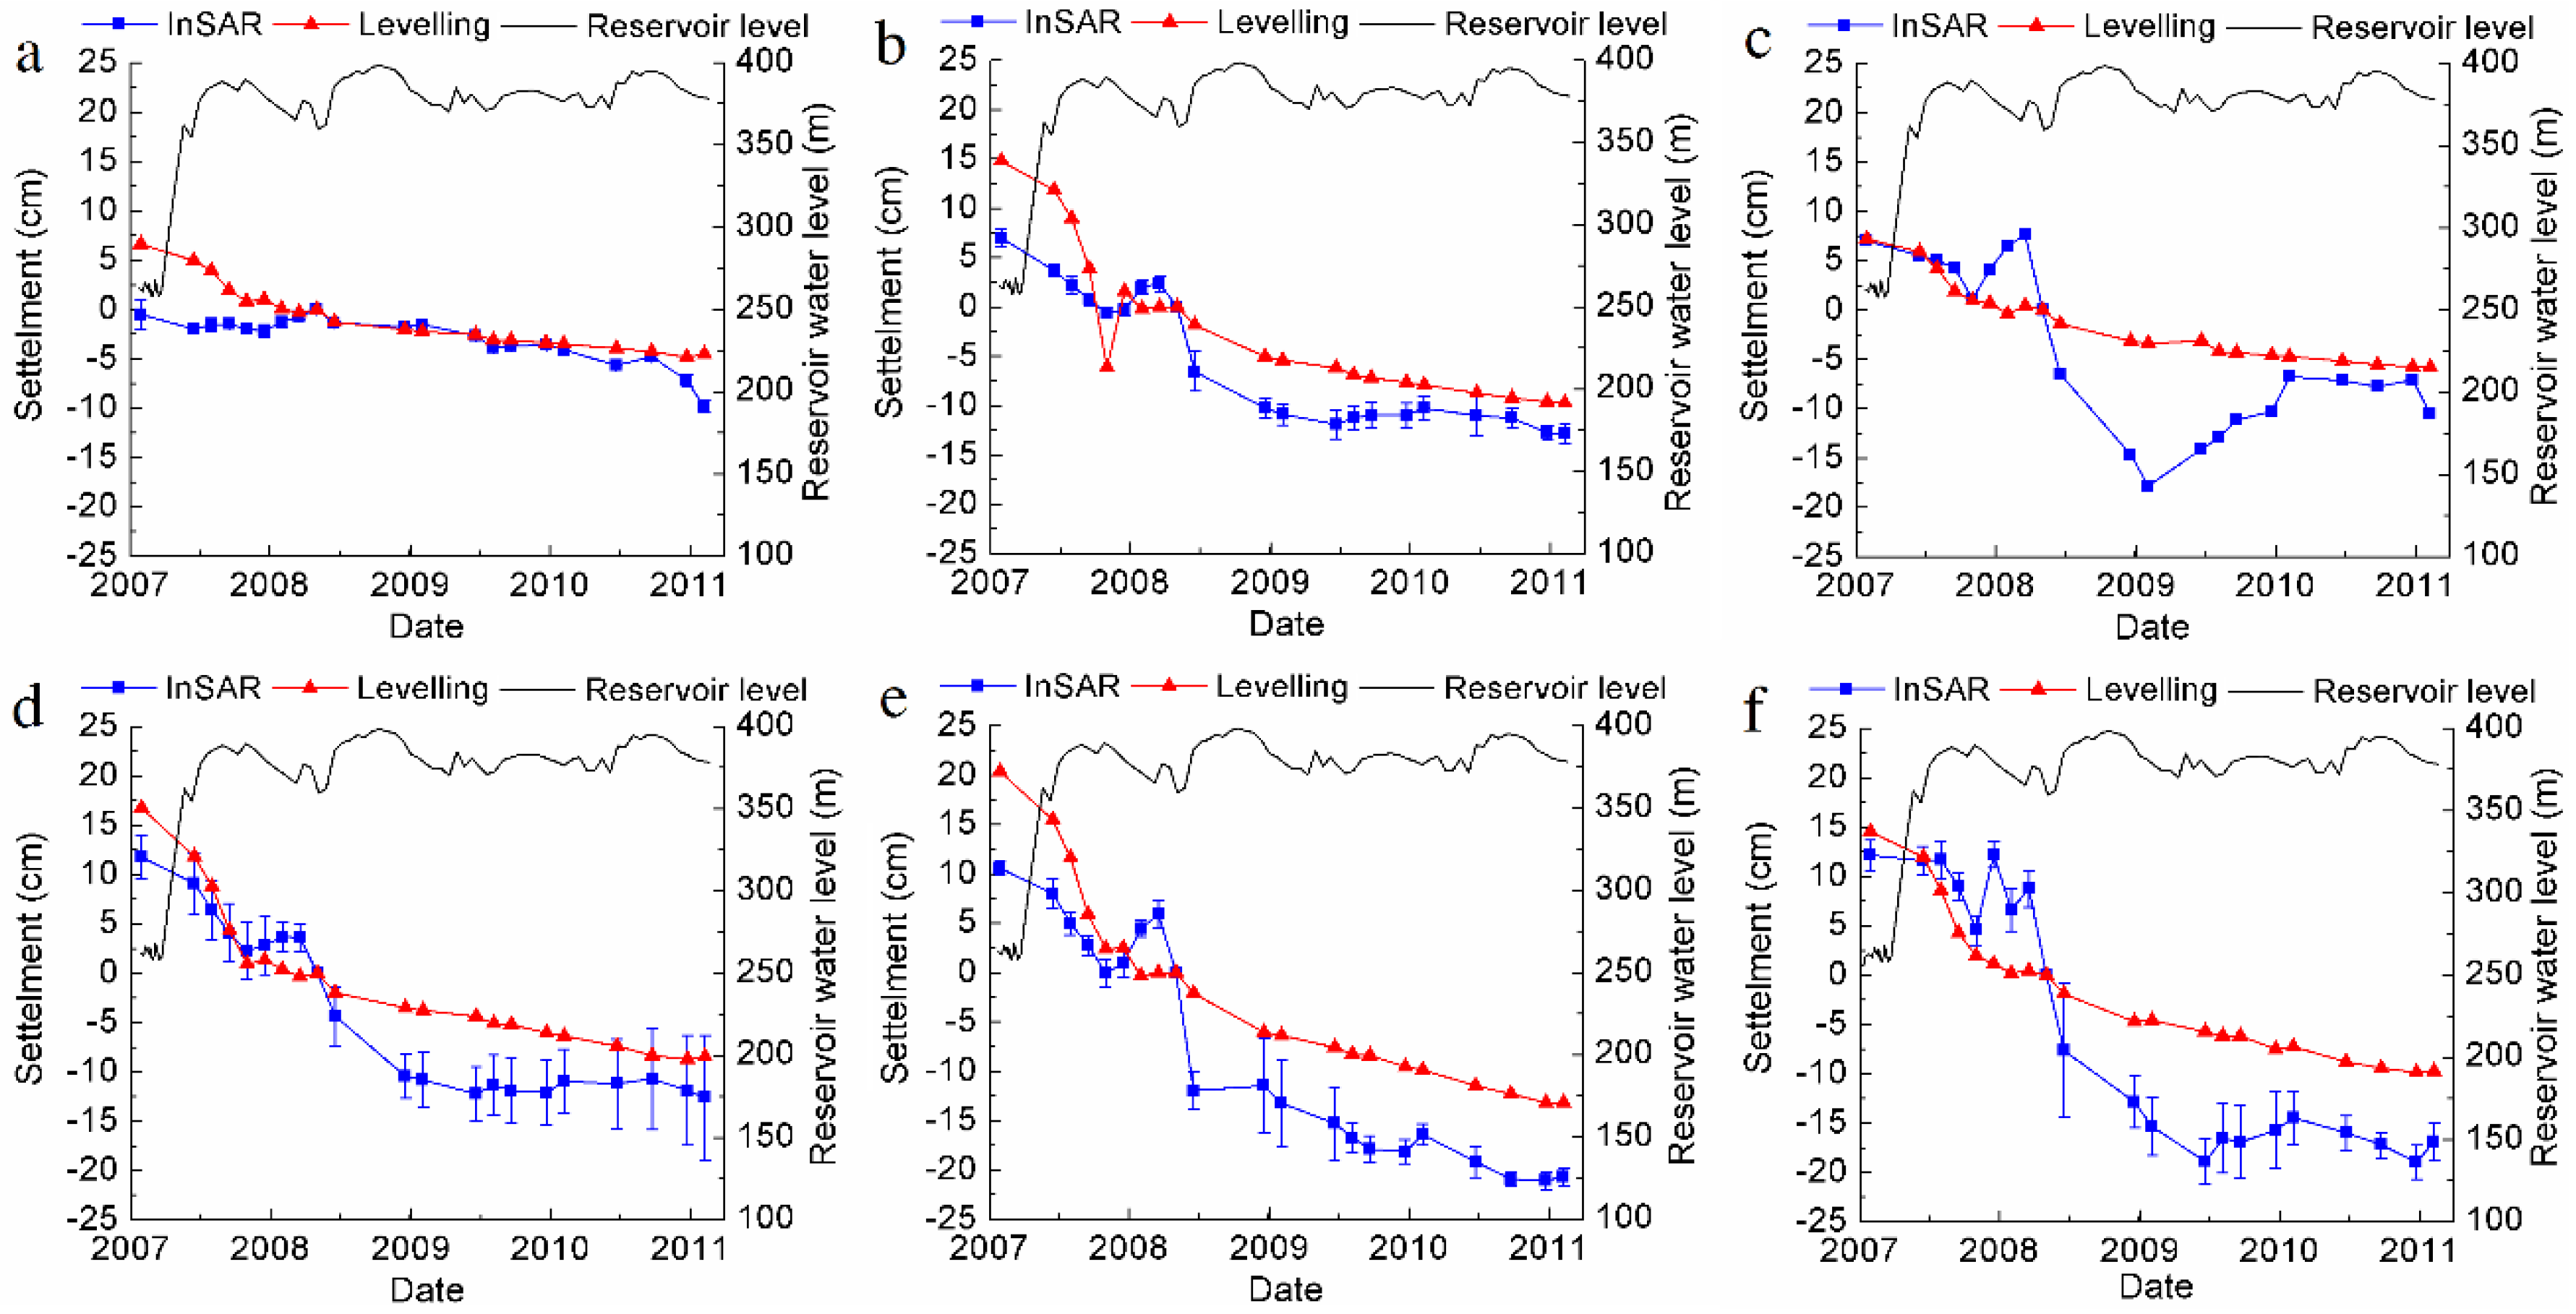
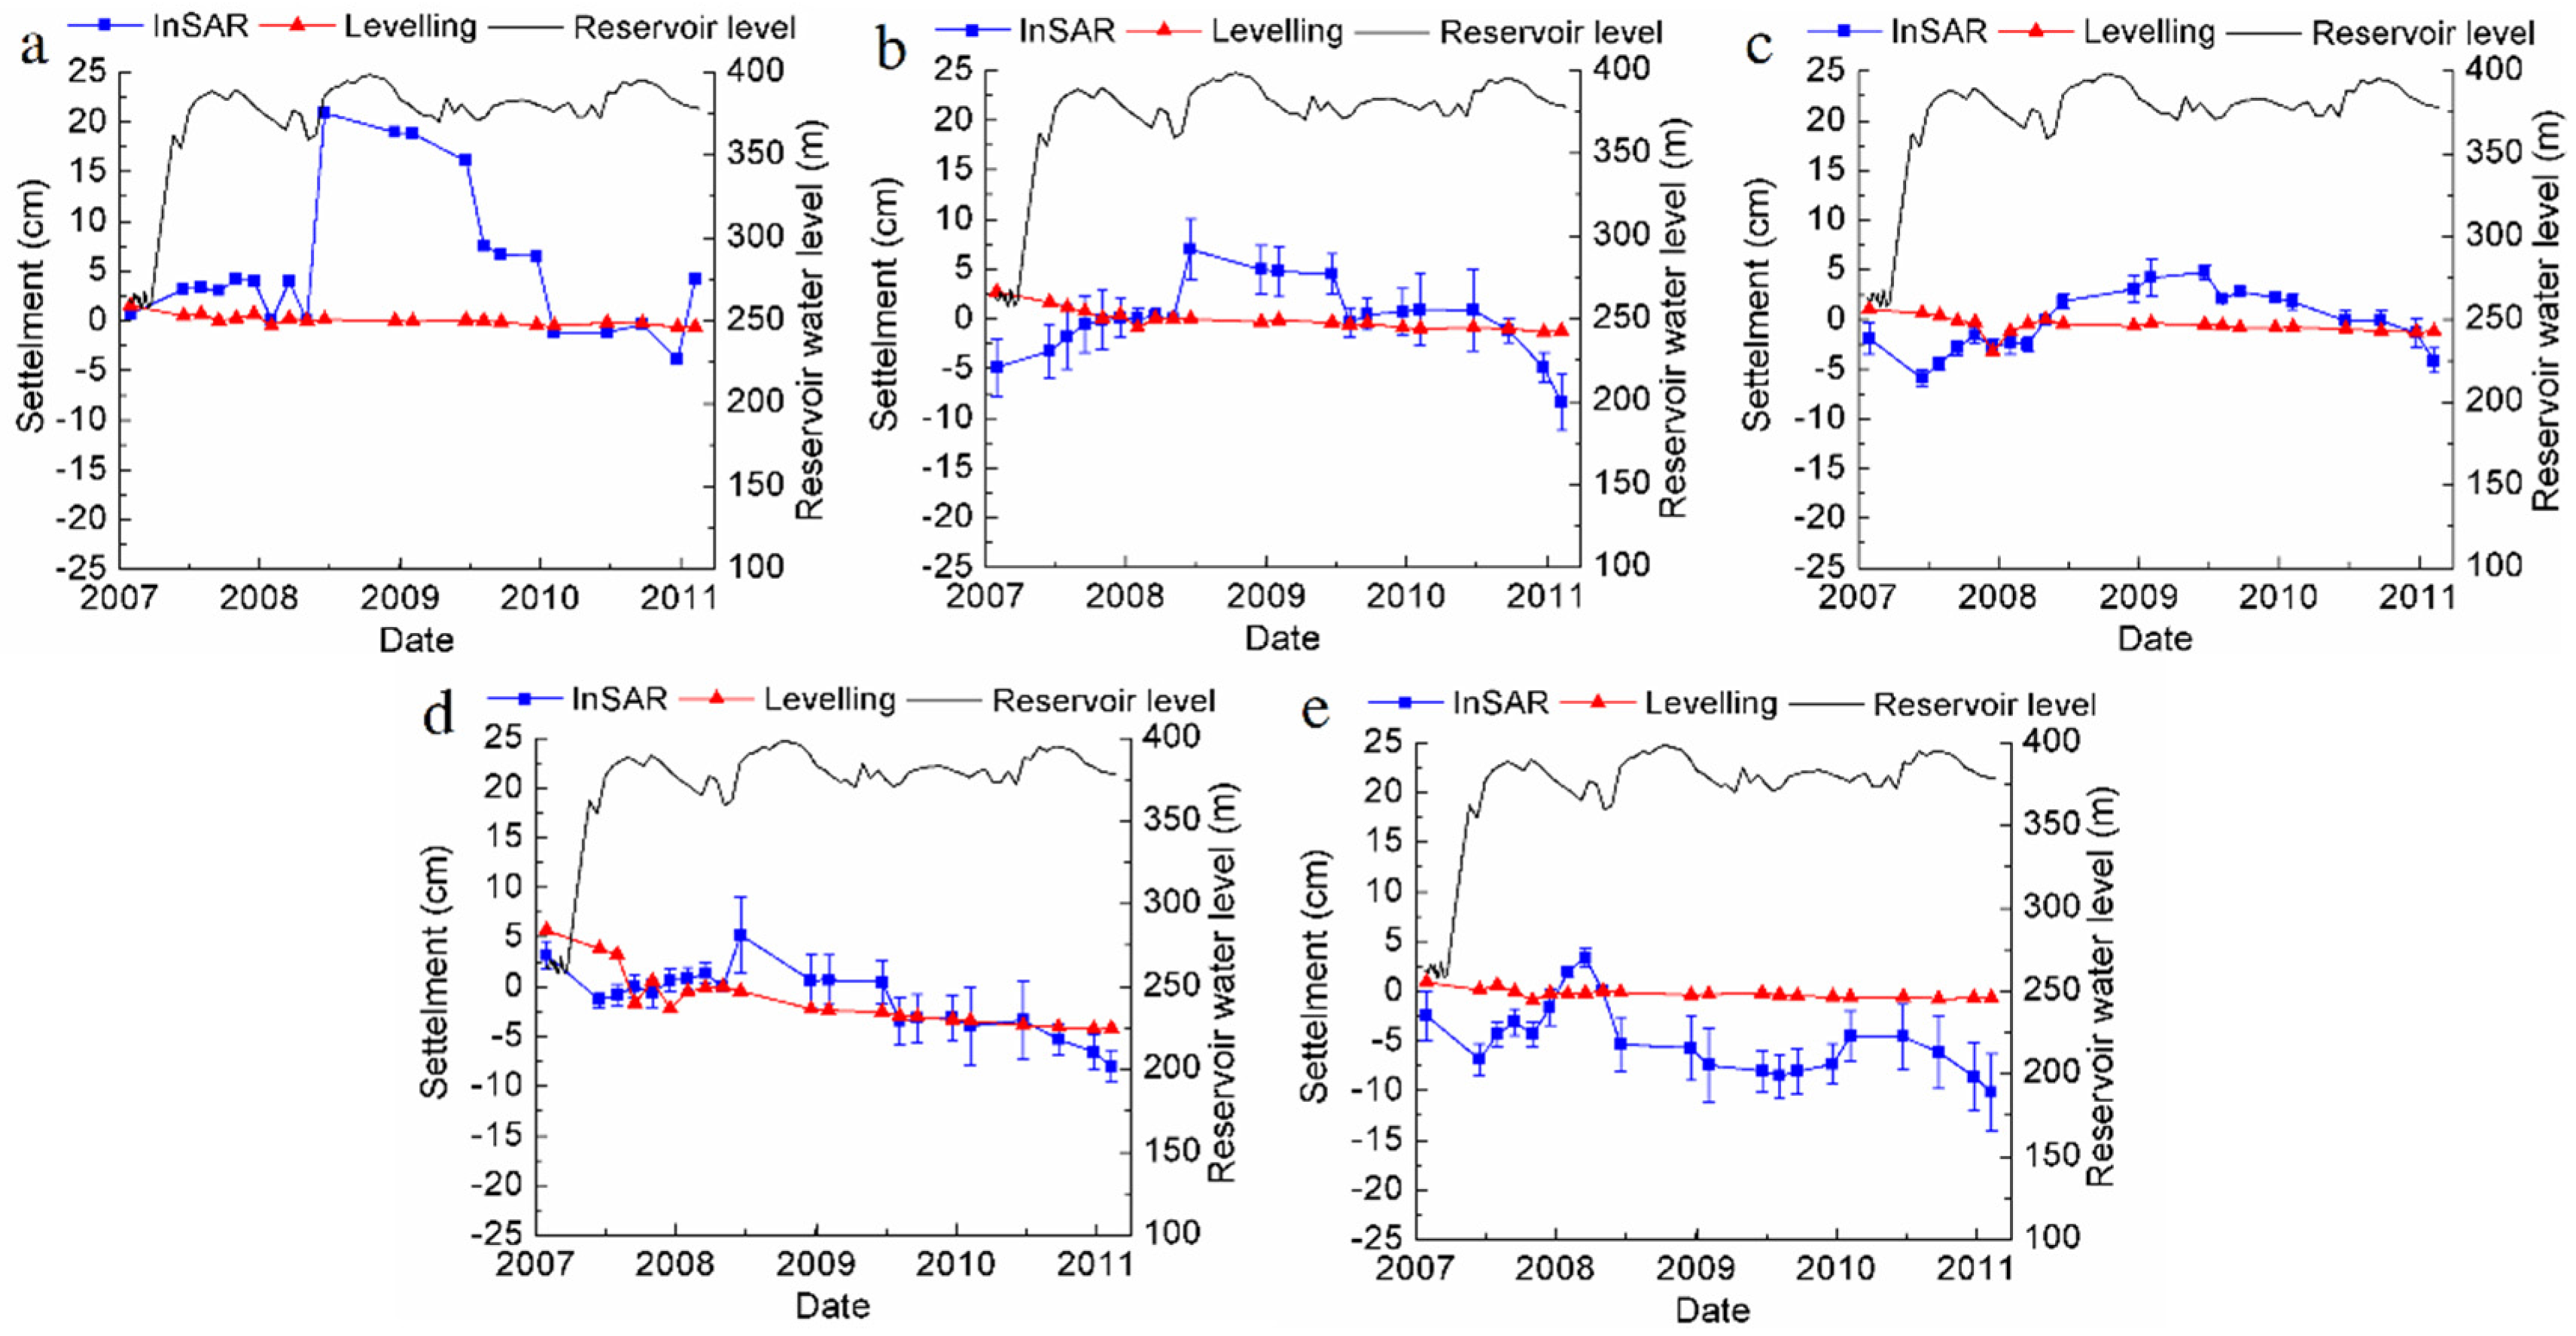
4.2. Time Series Analysis

Figure 10 and Figure 11 show the settlement history of eleven points of the levelling and InSAR time series results from 28 February 2007 to 11 March 2011 and the corresponding reservoir water level. Almost all of the deformation tendencies derived from InSAR are consistent with the deformation obtained from the levelling measurements. Additionally, our results show that: (1) the mean velocities of stations 1 to 5 (Figure 9a) are relatively stable (Figure 10 and Table 1) and less than −2 cm/year. In contrast, the mean velocities of stations 6 to 11 (Figure 9a) are much higher (Figure 11 and Table 1), ranging from −9 cm/year to −2 cm/year; (2) Figure 11 shows that rapid settlement occurred in stations 6 to 11 prior to 2009, while slower settlement occurred after 2009. For station 10 (Figure 9a and Figure 11e), nearly 25 cm of settlement was observed from February 2007 to January 2009; however, only approximately 7 cm of settlement occurred from January 2009 to March 2011. These results suggest that at higher levels of the dam, greater amounts of settlement occurred; (3) For stations 4, 7 and 9 (Figure 9a), the measured deformation was larger than for stations 3, 5, 6, 8, 10, and 11. This deformation pattern is consistent with the stress path along the dam; more stress occurs closer to the central part of the structure, while less stress occurs in the lateral parts.

5. Discussions

As the number of high CFRDs grows, monitoring the deformation characteristics of CFRDs during construction and their normal operation presents a major challenge because of the limitations of traditional approaches. Settlement is one of the most important deformation characteristics of a high CFRD and is regarded as a key indicator of dam safety. Deformation is caused by loading from gravity, the reservoir water level, and the characteristics of the rockfill. During the construction period, as the dam height increases, the dam undergoes settlement caused by gravity. The dam foundation also experiences subsidence, which accelerates settlement of the dam body. During the reservoir filling period, as the water level rises the load of water pressure on the concrete face increases rapidly, and the load increment causes elastic-plastic deformation. Generally, the rate of deformation is rapid during the construction and reservoir filling periods. During the operation period, the rockfill of the dam begins to break, rotate, and translate with the unload-reload process caused by changes in reservoir level. These loads cause elastic-plastic deformation; however, this is mostly creep deformation that gradually decreases in rate over time. Therefore, settlement of the dam surface occurs rapidly during the first reservoir filling and then decreases gradually. As shown in Figure 10 and Figure 11, settlement rate of stations of 6 to 10 is higher than stations 1 to 5, and fast settlement is observed during the period of February 2007 to January 2009. Also, in the central part of the dam, higher deformation rates were observed due to large stresses, such as the settlement rate of station 10 which is higher than station 7, which is higher than station 4.
In this study, twenty-one ALOS PALAR images acquired from 28 February 2007 to 11 March 2011 were used to map the deformation velocity and historical change of the SBY Dam. A high correlation of 0.93 between the InSAR results and the ground levelling measurements suggests that the InSAR technique is a reliable way to detect dam deformation. The low RMSE of 1.57 cm/year indicates that the InSAR measurements are useful for monitoring the deformation of the dam .The density and coverage of InSAR measurement can be much higher than conventional survey methods, such as leveling and GPS. Besides the deformation of the dam body, the stability of the surroundings of the dam is also determined by the InSAR method. This is important because the geologic stability of a dam’s surroundings has a great impact on its behavior. However, the steep slope of its surroundings causes layer over, foreshortening, or shadow to the SAR image, which results in losing InSAR signals on the dam body if the geocoding process is performed. A higher resolution of SAR image (e.g., 3 m TerraSAR-X), and DEM (few meters) could mitigate such issues.
However, variations between leveling and InSAR should be noticed, for example about 10 cm difference in the time series of station 11. Variations could be mainly due to the following reasons. As discussed above, given that dam settlement occurs faster during the first reservoir-filling period and thereafter decreases gradually, a non-linear model would be more practical in estimating the deformation during the first displacement stage. Another source of uncertainty is the APS. This can be mitigated with a model such as the TLV model used in this study. There are many ways to reduce the effect caused by APS, for more details, please refer to Li et al. [33,34,35] and Jolivet et al. [36].

6. Conclusions

In summary, we demonstrated that high CFRD deformation can be detected using remote sensing, specifically with InSAR images. This approach was able to provide insight into deformation of the SBY Dam at large scale and higher density. Combining results between InSAR and in-situ measurements shows that the settlement is affected by gravity and the reservoir water level, so that higher settlement occurs in higher positions of the dam. The InSAR time series also provides an assessment of the geology stability of the dam’s surrounding. Our findings should encourage the increasing use of the interferometric technique in the future to monitor the deformation of the SBY Dam and other high CFRDs. In particular, the availability of new very high resolution images acquired by the TerraSAR-X, Cosmo-SkyMed, and Sentinel-1A instruments, as well as advanced MTI techniques should allow us to obtain better and more reliable results because these high resolution images do not have a very fine ground resolution (up to 1 m) but shorter revisiting times (up to 4 days). In addition, ground based SAR (GB-SAR) could also be a useful tool in monitoring deformation of dams [37,38].
The InSAR method provides a useful way to monitor the settlement of CFRDs and will help with evaluation of their safety and prediction of displacement. Additionally, this method is able to complement or replace the traditional approaches, especially when they have failed to measure the deformation because of their short service life and low coverage. A 3D finite element method (FEM) model of the SBY CFRD should be built and the process of construction and reservoir filling should be simulated to analyze the strain-stress characteristics of the dam. Detailed numerical analyses of surface deformation will be presented in a subsequent companion paper. Therefore, reliably high CFRDs stability monitoring and assessment results can be expected by combining InSAR methods and a prediction model.

Acknowledgments

This research was supported by the National Natural Science Foundation of China (No. 51322905). We thank Gang Ma for sharing ideas on how to compare the data, and Tao Li for sharing his experience with InSAR data processing. We also acknowledge Zhenhong Li for providing the InSAR + AEM InSAR time series package and advice on data processing.

Author Contributions

Wei Zhou, Shaolin Li, Zhiwei Zhou, and Xiaolin Chang developed the main idea of this study, and Wei Zhou guided the project. Shaolin Li and Wei Zhou contributed to the geological interpretation and the ground monitoring data analysis. Zhiwei Zhou performed the ALOS PALSAR data interferometry processing and analysis. Zhiwei Zhou, Shaolin Li and Wei Zhou contributed to discussion of the final results and writing the manuscript.

Conflicts of Interest

The authors declare no conflict of interest.

References

  1. Hunter, G.; Fell, R. Rockfill modulus and settlement of concrete face rockfill dams. J. Geotech. Geoenviron. Eng. 2003, 129, 909–917. [Google Scholar] [CrossRef]
  2. Zhou, W.; Hua, J.; Chang, X.; Zhou, C. Settlement analysis of the shuibuya concrete-face rockfill dam. Comput. Geotech. 2011, 38, 269–280. [Google Scholar] [CrossRef]
  3. Zhou, W.; Chang, X.; Zhou, C.; Liu, X. Creep analysis of high concrete-faced rockfill dam. Int. J. Numer. Methods Biomed. Eng. 2010, 26, 1477–1492. [Google Scholar]
  4. Yang, Z.Y.; Jiang, G.C. Deformation control techniques for 200 m-high hongjiadu concrete face rockfill dam. Chin. J. Geotech. Eng. 2008, 30, 1241–1247. [Google Scholar]
  5. Li, Z.; Li, J.; Zheng, S.; Wu, Q. Several measures for improving hydraulic overflow settlement gauge. Hydropower Autom. Dam Monit. 2010, 6, 31–33. [Google Scholar]
  6. Han, J.; Zhang, C. Experimental research on the installation of pipe-type settlement gauge in Nuozhadu hydropower station. Water Power 2012, 9, 64–67. [Google Scholar]
  7. Liu, G.; Li, Z.; Li, X.; Wang, J. Experimental analysis of horizontal displacement monitoring device with long pipeline tensile. Hydropower Autom. Dam Monit. 2012, 36, 53–56. [Google Scholar]
  8. Peng, H. Interior deformation monitoring of dam body for 300 m high grade cfrd. Hydropower Autom. Dam Monit. 2012, 36, 40–44. [Google Scholar]
  9. Massonnet, D.; Feigl, K.L. Radar interferometry and its application to changes in the earth’s surface. Rev. Geophys. 1998, 36, 441–500. [Google Scholar] [CrossRef]
  10. Simons, M.; Rosen, P.A. Interferometric synthetic aperture radar geodesy. In Treatise on Geophysics; Gerald, S., Ed.; Elsevier: Amsterdam, The Netherlands, 2007; pp. 391–446. [Google Scholar]
  11. Rosen, P.A.; Hensley, S.; Joughin, I.R.; Li, F.K.; Madsen, S.N.; Rodriguez, E.; Goldstein, R.M. Synthetic aperture radar interferometry. Proc. IEEE 2000, 88, 333–382. [Google Scholar] [CrossRef]
  12. Di Martire, D.; Iglesias, R.; Monells, D.; Centolanza, G.; Sica, S.; Ramondini, M.; Pagano, L.; Mallorquí, J.J.; Calcaterra, D. Comparison between differential sar interferometry and ground measurements data in the displacement monitoring of the earth-dam of conza della campania (Italy). Remote Sens. Environ. 2014, 148, 58–69. [Google Scholar] [CrossRef]
  13. Wang, T.; Perissin, D.; Rocca, F.; Liao, M.-S. Three gorges dam stability monitoring with time-series InSAR image analysis. Sci. China Earth Sci. 2011, 54, 720–732. [Google Scholar] [CrossRef]
  14. Lazecký, M.; Perissin, D.; Zhiying, W.; Ling, L.; Yuxiao, Q. Observing dam’s movements with spaceborne sar interferometry. In Engineering Geology for Society and Territory—Volume 5; Lollino, G., Manconi, A., Guzzetti, F., Culshaw, M., Bobrowsky, P., Luino, F., Eds.; Springer International Publishing: Cham, Switzerland, 2015; pp. 131–136. [Google Scholar]
  15. Voege, M.; Frauenfelder, R.; Larsen, Y. Displacement monitoring at svartevatn dam with interferometric sar. In Proceedings of the 2012 IEEE International Geoscience and Remote Sensing Symposium (IGARSS), Munich, Germany, 22–27 July 2012; pp. 3895–3898.
  16. Xu, W.; Xie, S.; Xu, R.; Liu, S.; Zhu, Z. Gological model for rockmass of dam foundation at shuibuya hydropower station. J. Eng. Geol. 2002, 10, 260–265. [Google Scholar]
  17. Hu, D.; Shi, L.; Tan, C. 3-d umerical simulation on rock stability of shuibuya hydroelectrical project on the qingjiang river. Geoscience 1999, 4, 466–470. [Google Scholar]
  18. Farr, T.G.; Rosen, P.A.; Caro, E.; Crippen, R.; Duren, R.; Hensley, S.; Kobrick, M.; Paller, M.; Rodriguez, E.; Roth, L.; et al. The shuttle radar topography mission. Rev. Geophys. 2007, 45, RG2004. [Google Scholar] [CrossRef]
  19. Eineder, M.; Hubig, M.; Milcke, B. Unwrapping large interferograms using the minimum cost flow algorithm. In Proceedings of the 1998 IEEE International Geoscience and Remote Sensing Symposium, IGARSS’98, Seattle, WA, USA, 6–10 July 1998; pp. 83–87.
  20. Hanssen, R.F. Radar Interferometry: Data Interpretation and Error Analysis; Springer Science & Business Media: Dordrecht, The Netherland, 2001. [Google Scholar]
  21. Ferretti, A.; Prati, C.; Rocca, F. Permanent scatterers in SAR interferometry. IEEE Trans. Geosci. Remote Sens. 2001, 39, 8–20. [Google Scholar] [CrossRef]
  22. Berardino, P.; Fornaro, G.; Lanari, R.; Sansosti, E. A new algorithm for surface deformation monitoring based on small baseline differential SAR interferograms. IEEE Trans. Geosci. Remote Sens. 2002, 40, 2375–2383. [Google Scholar] [CrossRef]
  23. Hooper, A.; Segall, P.; Zebker, H. Persistent scatterer interferometric synthetic aperture radar for crustal deformation analysis, with application to volcán alcedo, galápagos. J. Geophys. Res. 2007, 112, B07407. [Google Scholar] [CrossRef]
  24. Doin, M.-P.; Guillaso, S.; Jolivet, R.; Lasserre, C.; Lodge, F.; Ducret, G.; Grandin, R. Presentation of the small-baseline nsbas processing chain on a case example: The etna deformation monitoring from 2003 to 2010 using Envisat data. In Proceddings of the Fringe 2011 Workshop, Frascati, Italy, 19–23 September 2011; pp. 303–304.
  25. Ferretti, A.; Fumagalli, A.; Novali, F.; Prati, C.; Rocca, F.; Rucci, A. A new algorithm for processing interferometric data-stacks: Squeesar. IEEE Trans. Geosci. Remote Sens. 2011, 49, 1–11. [Google Scholar] [CrossRef]
  26. Li, Z.; Fielding, E.J.; Cross, P. Integration of InSAR time-series analysis and water-vapor correction for mapping postseismic motion after the 2003 bam (Iran) earthquake. IEEE Trans. Geosci. Remote Sens. 2009, 47, 3220–3230. [Google Scholar]
  27. Zhang, L.; Ding, X.; Lu, Z. Ground settlement monitoring based on temporarily coherent points between two sar acquisitions. ISPRS J. Photogramm. Remote Sens. 2011, 66, 146–152. [Google Scholar] [CrossRef]
  28. Sowter, A.; Bateson, L.; Strange, P.; Ambrose, K.; Syafiudin, M.F. Dinsar estimation of land motion using intermittent coherence with application to the south derbyshire and leicestershire coalfields. Remote Sens. Lett. 2013, 4, 979–987. [Google Scholar] [CrossRef]
  29. Hanssen, R.F. Radar Interferometry: Data Interpretation and Error Analysis; Kluwer Academic Plublishers: Dordrecht, The Netherlands, 2001. [Google Scholar]
  30. Li, Z.; Fielding, E.J.; Cross, P.; Muller, J.-P. Interferometric synthetic aperture radar atmospheric correction: GPS topography-dependent turbulence model. J. Geophys. Res. Solid Earth 2006, 111, B02404. [Google Scholar] [CrossRef]
  31. Williams, S.; Bock, Y.; Fang, P. Integrated satellite interferometry: Tropospheric noise, GPS estimates and implications for interferometric synthetic aperture radar products. J. Geophys. Res. Solid Earth 1998, 103, 27051–27067. [Google Scholar] [CrossRef]
  32. Hammond, W.C.; Blewitt, G.; Li, Z.; Plag, H.P.; Kreemer, C. Contemporary uplift of the sierra nevada, western united states, from GPS and InSAR measurements. Geology 2012, 40, 667–670. [Google Scholar] [CrossRef]
  33. Li, Z.; Muller, J.-P.; Cross, P.; Fielding, E.J. Interferometric synthetic aperture radar (InSAR) atmospheric correction: GPS, moderate resolution imaging spectroradiometer (MODIS), and InSAR integration. J. Geophys. Res. 2005, 110, B03410. [Google Scholar] [CrossRef]
  34. Li, Z.; Fielding, E.J.; Cross, P.; Muller, J.-P. Interferometric synthetic aperture radar atmospheric correction: Medium resolution imaging spectrometer and advanced synthetic aperture radar integration. Geophys. Res. Lett. 2006, 33, L06816. [Google Scholar] [CrossRef]
  35. Li, Z.; Fielding, E.J.; Cross, P.; Preusker, R. Advanced InSAR atmospheric correction: Meris/MODIS combination and stacked water vapour models. Int. J. Remote Sens. 2009, 30, 3343–3363. [Google Scholar] [CrossRef]
  36. Jolivet, R.; Agram, P.S.; Lin, N.Y.; Simons, M.; Doin, M.-P.; Peltzer, G.; Li, Z. Improving InSAR geodesy using global atmospheric models. J. Geophys. Res. Solid Earth 2014, 119, 2324–2341. [Google Scholar] [CrossRef]
  37. Talich, M.; Glöckner, M.; Böhm, O.; Antoš, F.; Soukup, L.; Havrlant, J.; Šolc, J. The application of the ground-based InSAR technique for the deformation monitoring of concrete hydropower dam orlík on vltava river. In Proceedings of the 6th International Conference on Engineering Surveying, Prague, Czech Republic, 3 April 2014.
  38. Monserrat, O.; Crosetto, M.; Luzi, G. A review of ground-based SAR interferometry for deformation measurement. ISPRS J. Photogramm. Remote Sens. 2014, 93, 40–48. [Google Scholar] [CrossRef]
Figure 1. The location of the study area and the Shuibuya reservoir: (a) The location of the Shuibuya reservoir (red triangle); (b) View of the Shuibuya concrete faced rockfill dam.
Remotesensing 08 00255 g001
Figure 2. Geological map of the Shuibuya Dam. 1. Quaternary; 2–4. Permian; 5. Carbonic; 6–7. Devonian; 8. Silurian; 9. Geological boundary; 10. Fault; 11. The site of the dam.
Remotesensing 08 00255 g002
Figure 3. Typical zoning and grading curve of the Shuibuya concrete faced rockfill dam. (a) Typical zoning; (b) grading curve.
Remotesensing 08 00255 g003aRemotesensing 08 00255 g003b
Figure 4. Layout of the exterior settlement monitoring system (ESMS) of the Shuibuya.
Remotesensing 08 00255 g004
Figure 5. External settlement recorded by the monitoring stations on the downstream surface of the dam. (a) Settlement records from stations WS01 to WS05; (b) Settlement records from stations WS06 to WS11.
Remotesensing 08 00255 g005
Figure 6. Interferogram distribution in terms of the spatial and temporal baseline. Each black triangle represents one synthetic aperture radar (SAR) image and the black solid line between two triangles represents one interferogram.
Remotesensing 08 00255 g006
Figure 7. The cropped study area and the average coherence map in radar geometry (not geocoded). (a) The amplitude image of the study area; (b) the average coherence map, where white indicates pixels with strong coherence and black indicates pixels with low or no coherence.
Remotesensing 08 00255 g007
Figure 8. Vertical deformation velocity and root mean square (RMS) of the study area in radar geometry (not geocoded). (a) the vertical deformation velocity; (b) the RMS of the vertical deformation velocity.
Remotesensing 08 00255 g008
Figure 9. Comparison of the velocity from the reference levelling and the estimated InSAR results. The locations in (a) corresponding to the levelling measurements are shown in Figure 4, and the velocity of both measurements is shown in Table 2. Black line in (b) is a 1:1 line.
Remotesensing 08 00255 g009
Figure 10. Settlement time series derived from InSAR (blue) and in-situ measurements (red) for stations 1–5 (Figures ae). Each blue square indicates the average mean velocity of the selected buffer zone, and the error bar represents the standard deviation. Red triangles indicate the levelling measurements and the solid black line indicates the change in reservoir water level.
Remotesensing 08 00255 g010
Figure 11. Settlement time series derived from InSAR (blue) and in-situ measurements (red) for stations 6–11 (Figures af). Each blue square indicates the average mean velocity of the selected buffer zone, and the error bar represents the standard deviation. Red triangles indicate the levelling measurements and the solid black line indicates the change in reservoir water level.
Remotesensing 08 00255 g011
Table 1. Locations of the monitoring stations.
WS01WS02WS03WS04WS05WS06WS07WS08WS09WS10WS11
X (m)265.0214.0161.0161.0161.0108.0108.0108.048.048.048.0
Y (m)256.8252.0132.0247.2357.6132.0240.0357.6132.0237.6357.6
Z (m)235.0265.0300.0300.0300.0340.0340.0340.0370.0370.0370.0
Where X indicates the direction from upstream to downstream along the river, Y indicates the direction from the right to the left bank of the river and Z indicates the elevation.
Table 2. Comparison of settlement rates estimated by InSAR and in-situ measurements.
νSAR (cm/year)νWS (cm/year)Difference (cm/year)
WS01-SAR1−0.52−0.320.20
WS02-SAR2−0.34−0.670.33
WS03-SAR30.91−0.301.21
WS04-SAR4−2.03−1.900.13
WS05-SAR5−1.69−0.251.44
WS06-SAR6−1.64−2.390.75
WS07-SAR7−4.92−4.970.05
WS08-SAR8−4.81−2.891.92
WS09-SAR9−6.13−4.881.25
WS10-SAR10−8.45−6.981.47
WS11-SAR11−9.17−5.223.95

