
A River Basin over the Course of Time: Multi-Temporal Analyses of Land Surface Dynamics in the Yellow River Basin (China) Based on Medium Resolution Remote Sensing Data


Abstract
:
1. Introduction
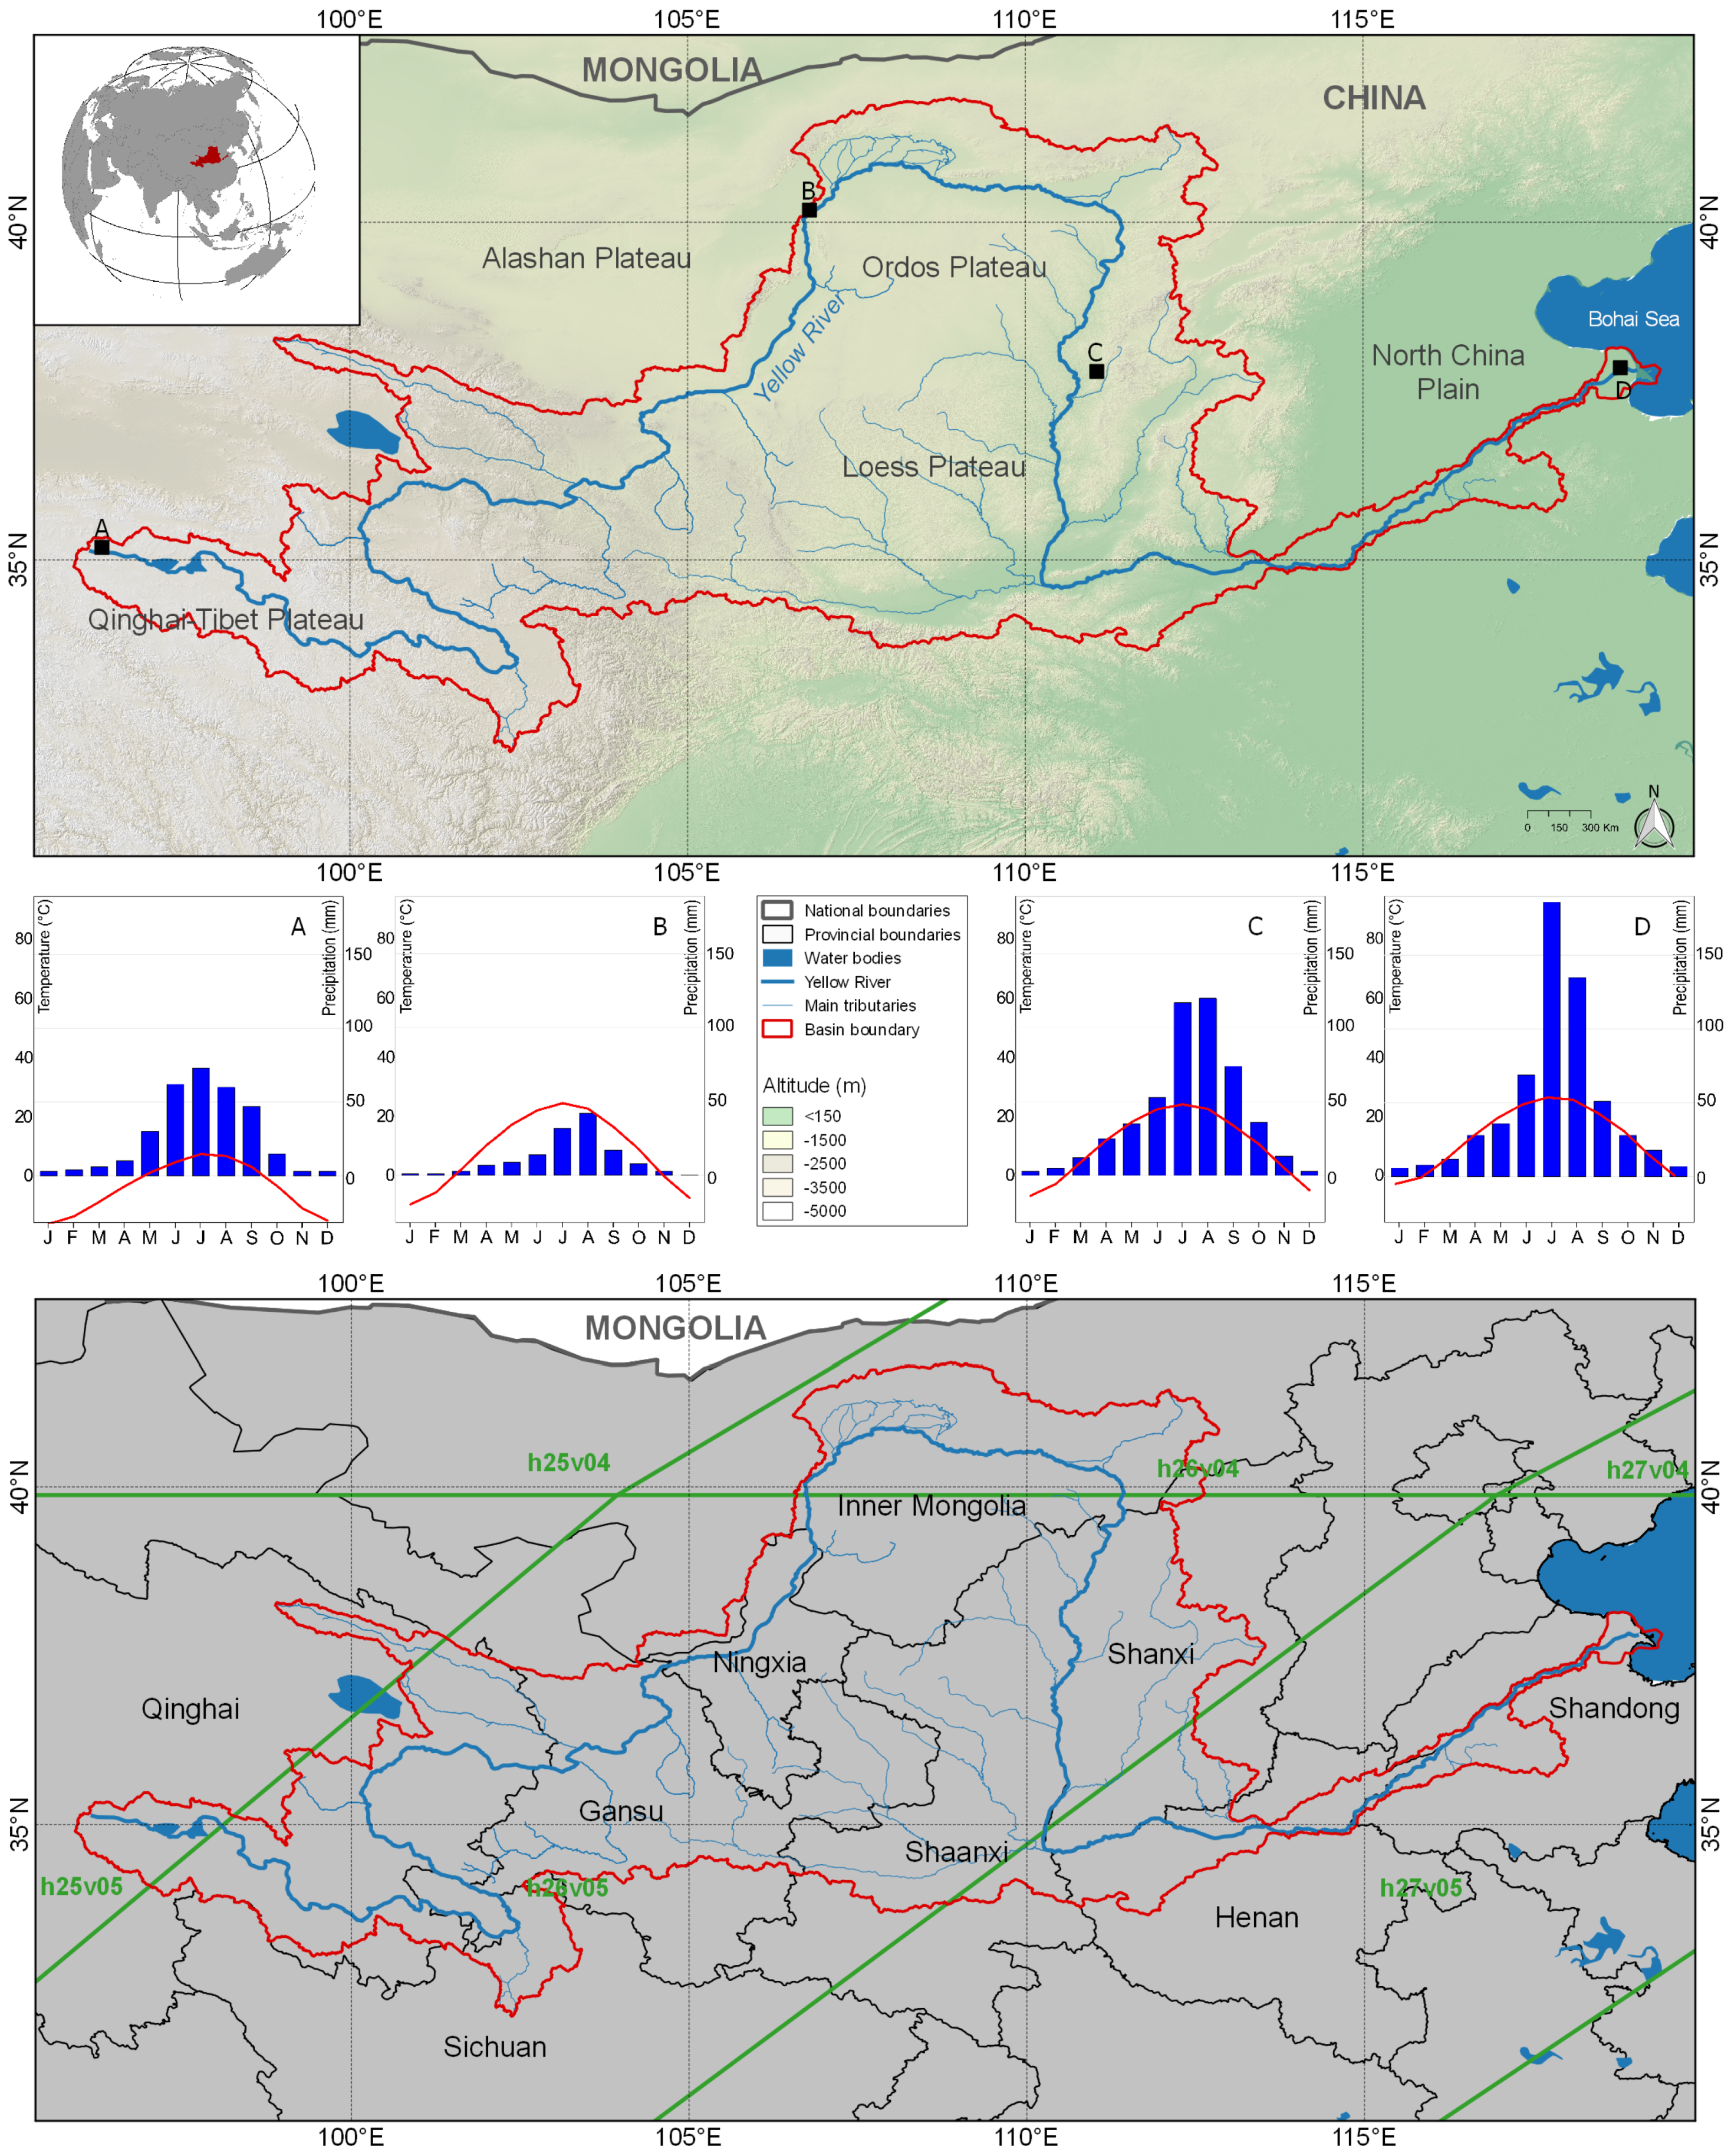
2. Study Area
3. Material and Methods
3.1. MODIS Data and Processing Steps
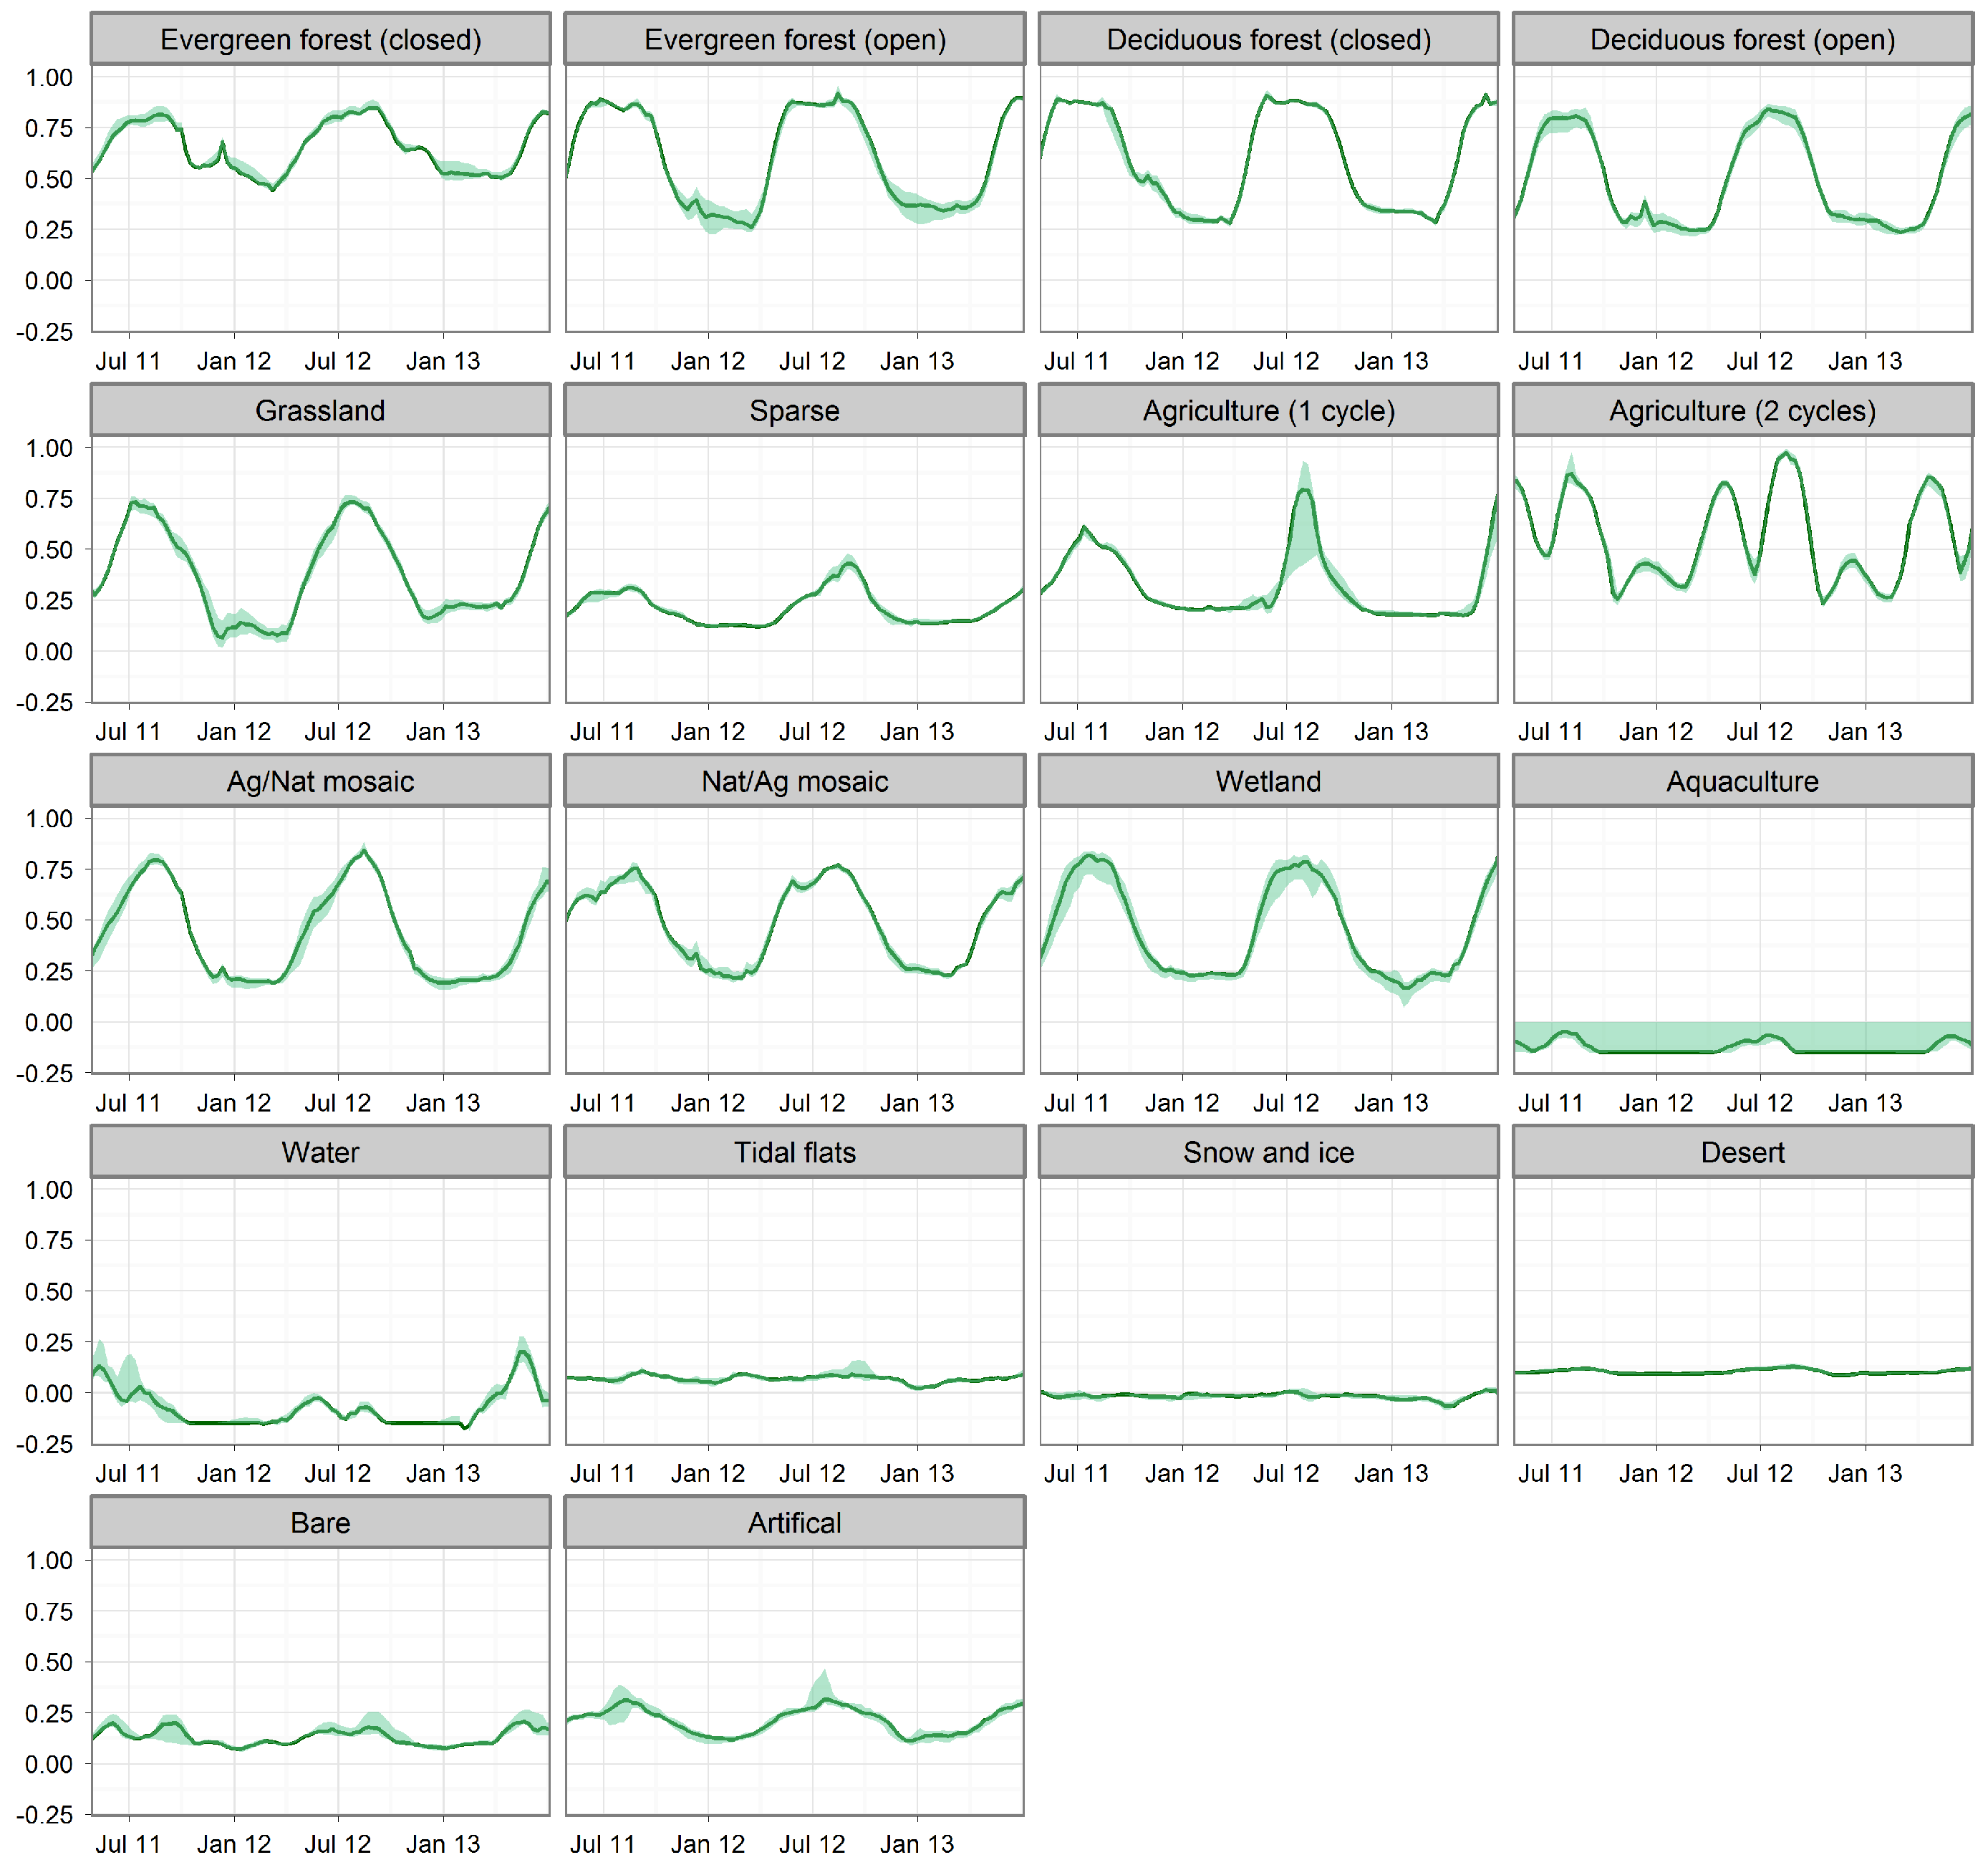
3.2. Classification Features
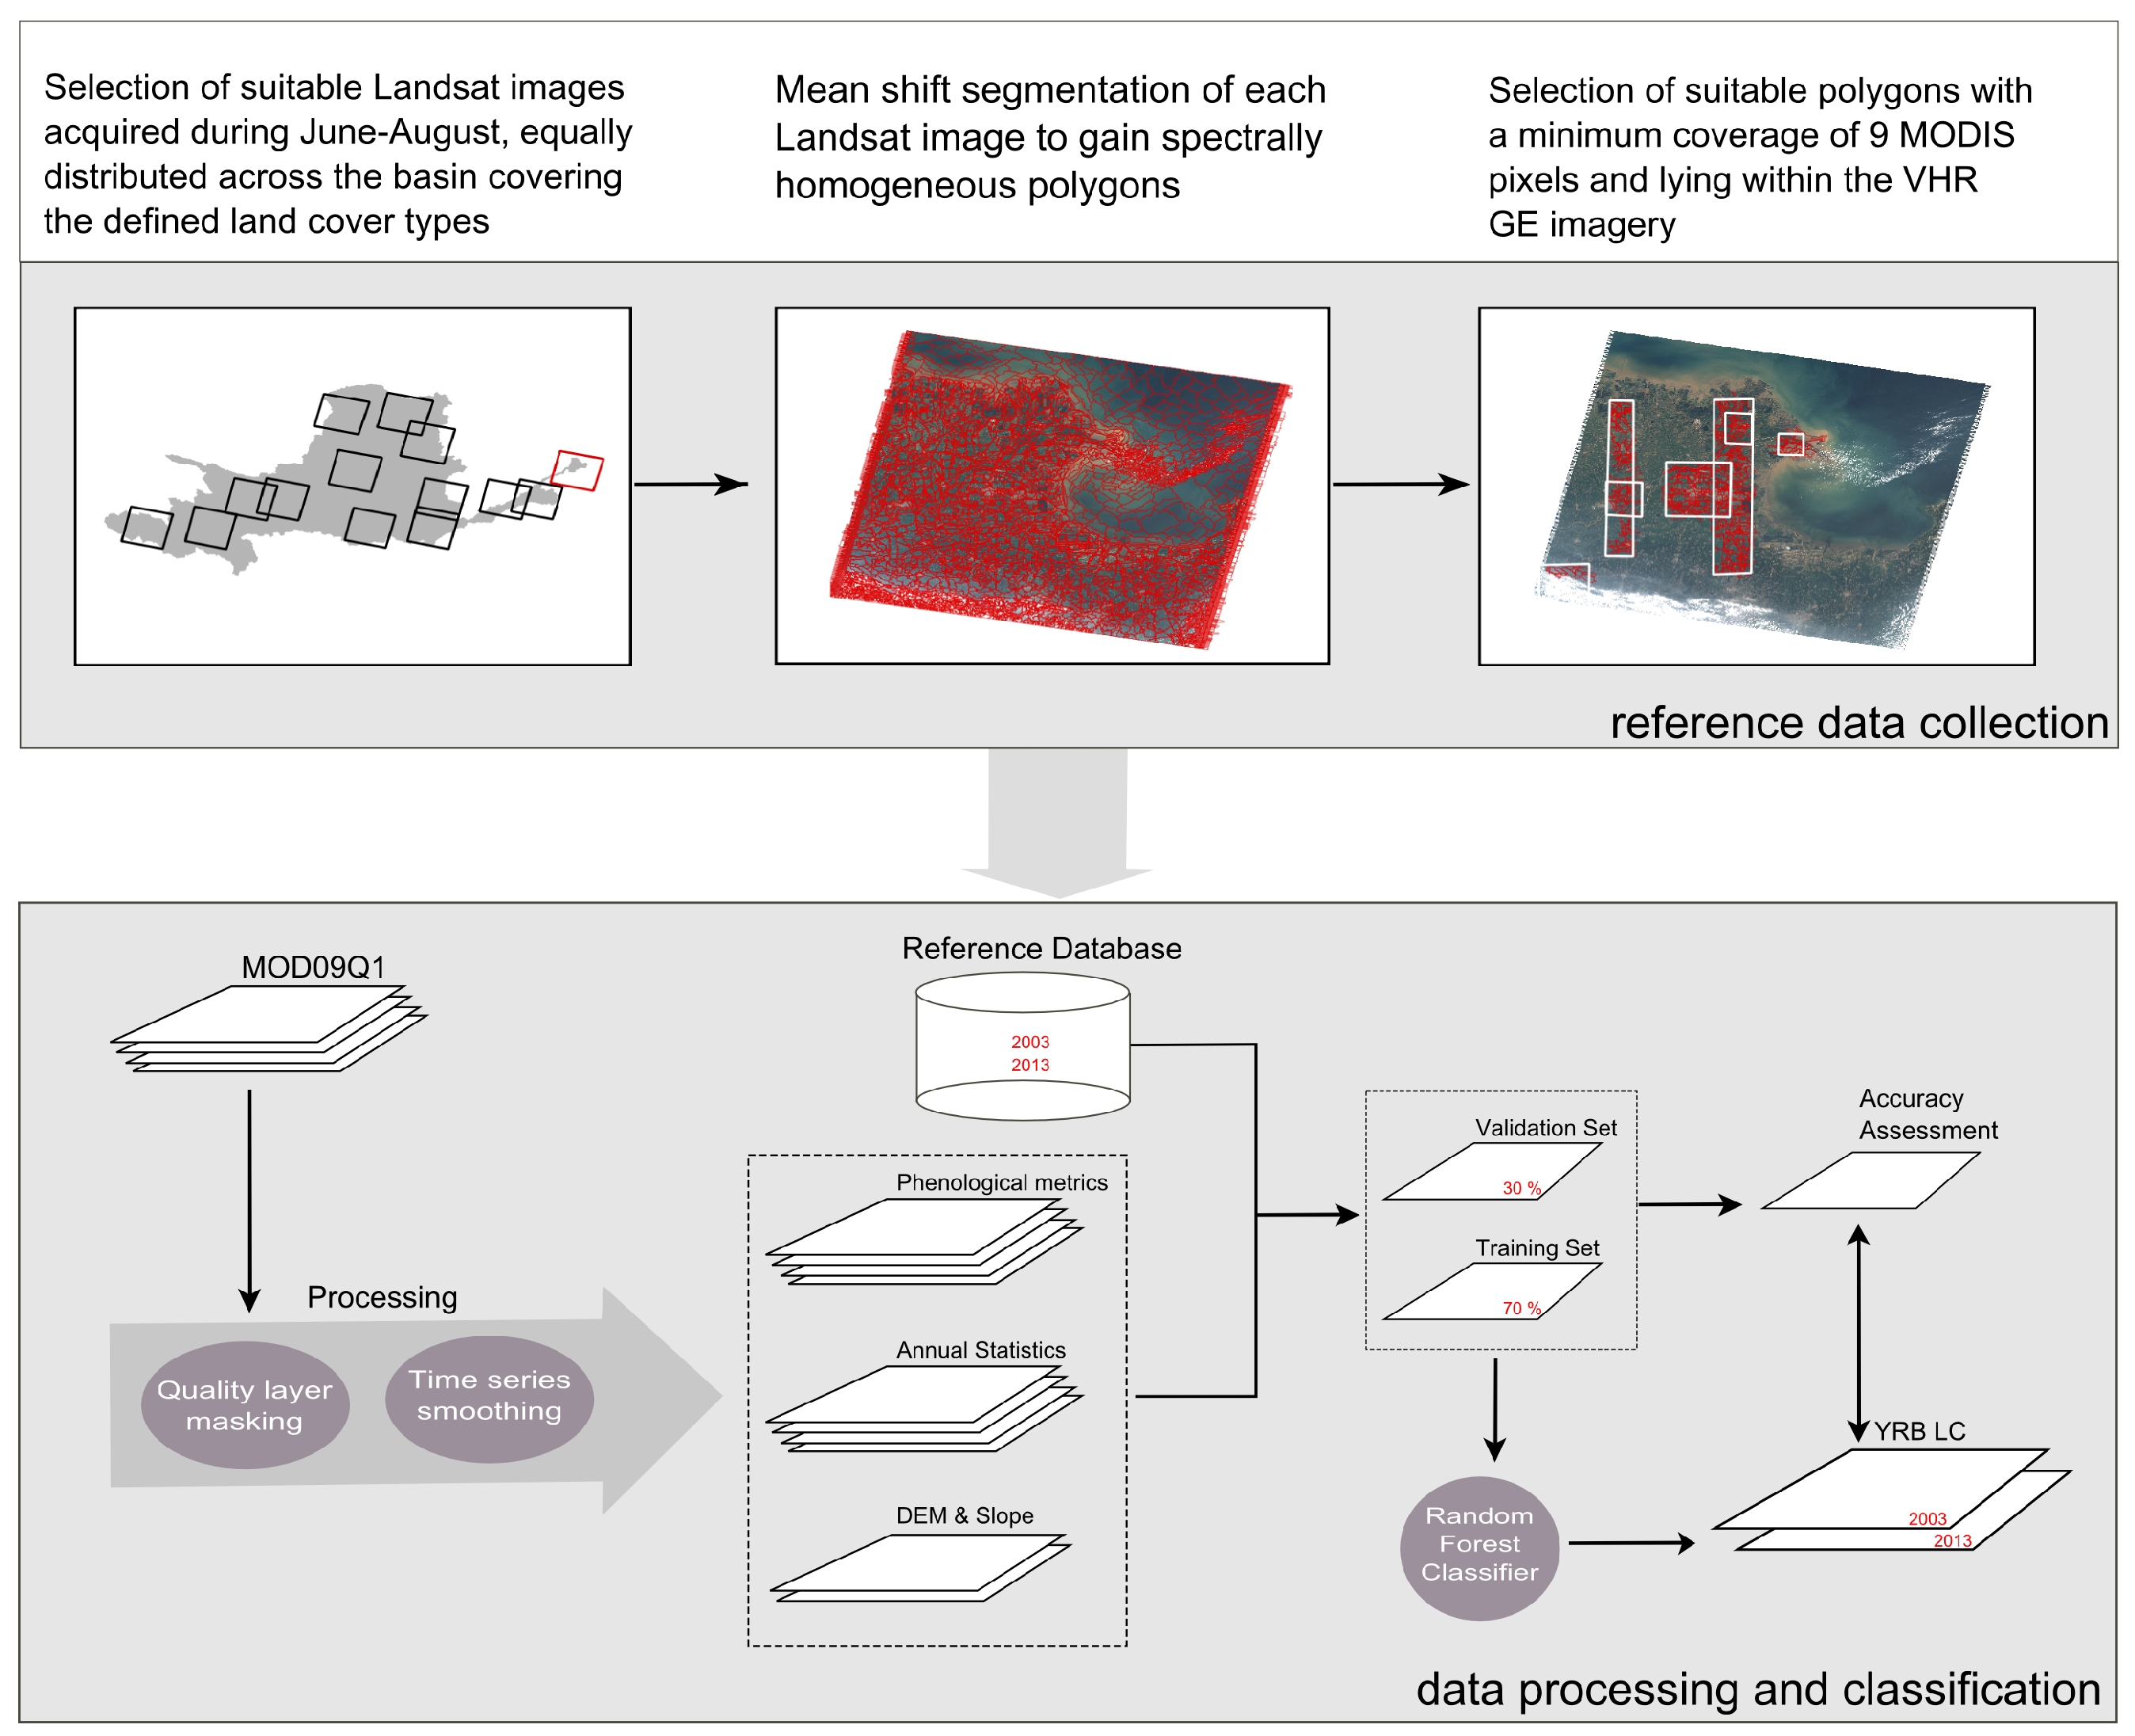
3.3. Reference Data Collection
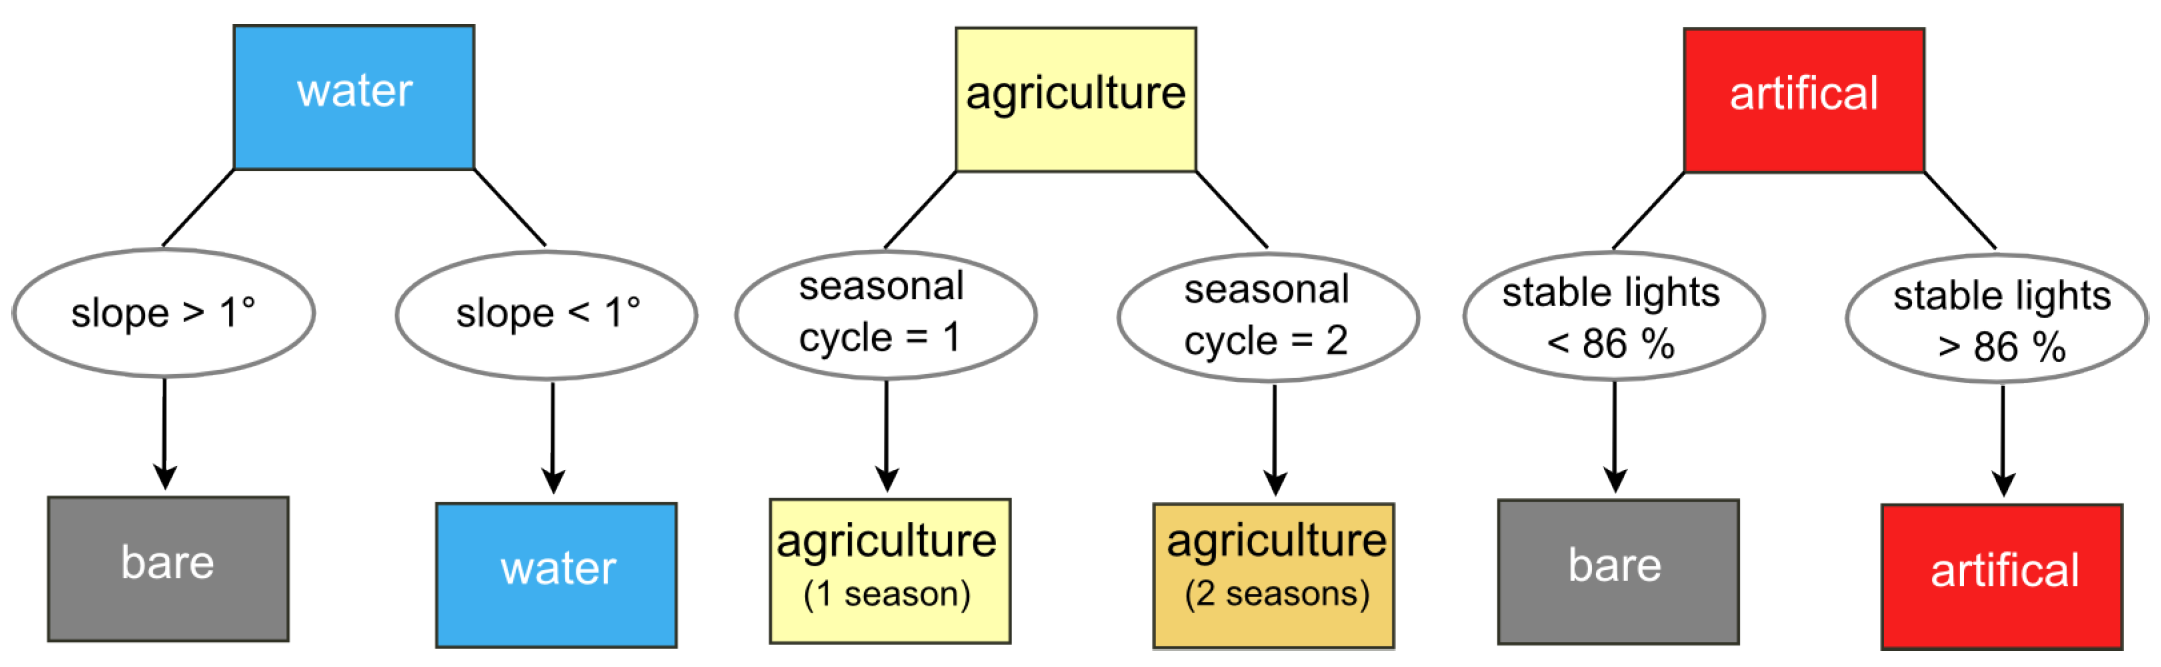
3.4. Classification Approach, Post-Classification and Accuracy Assessment
4. Results
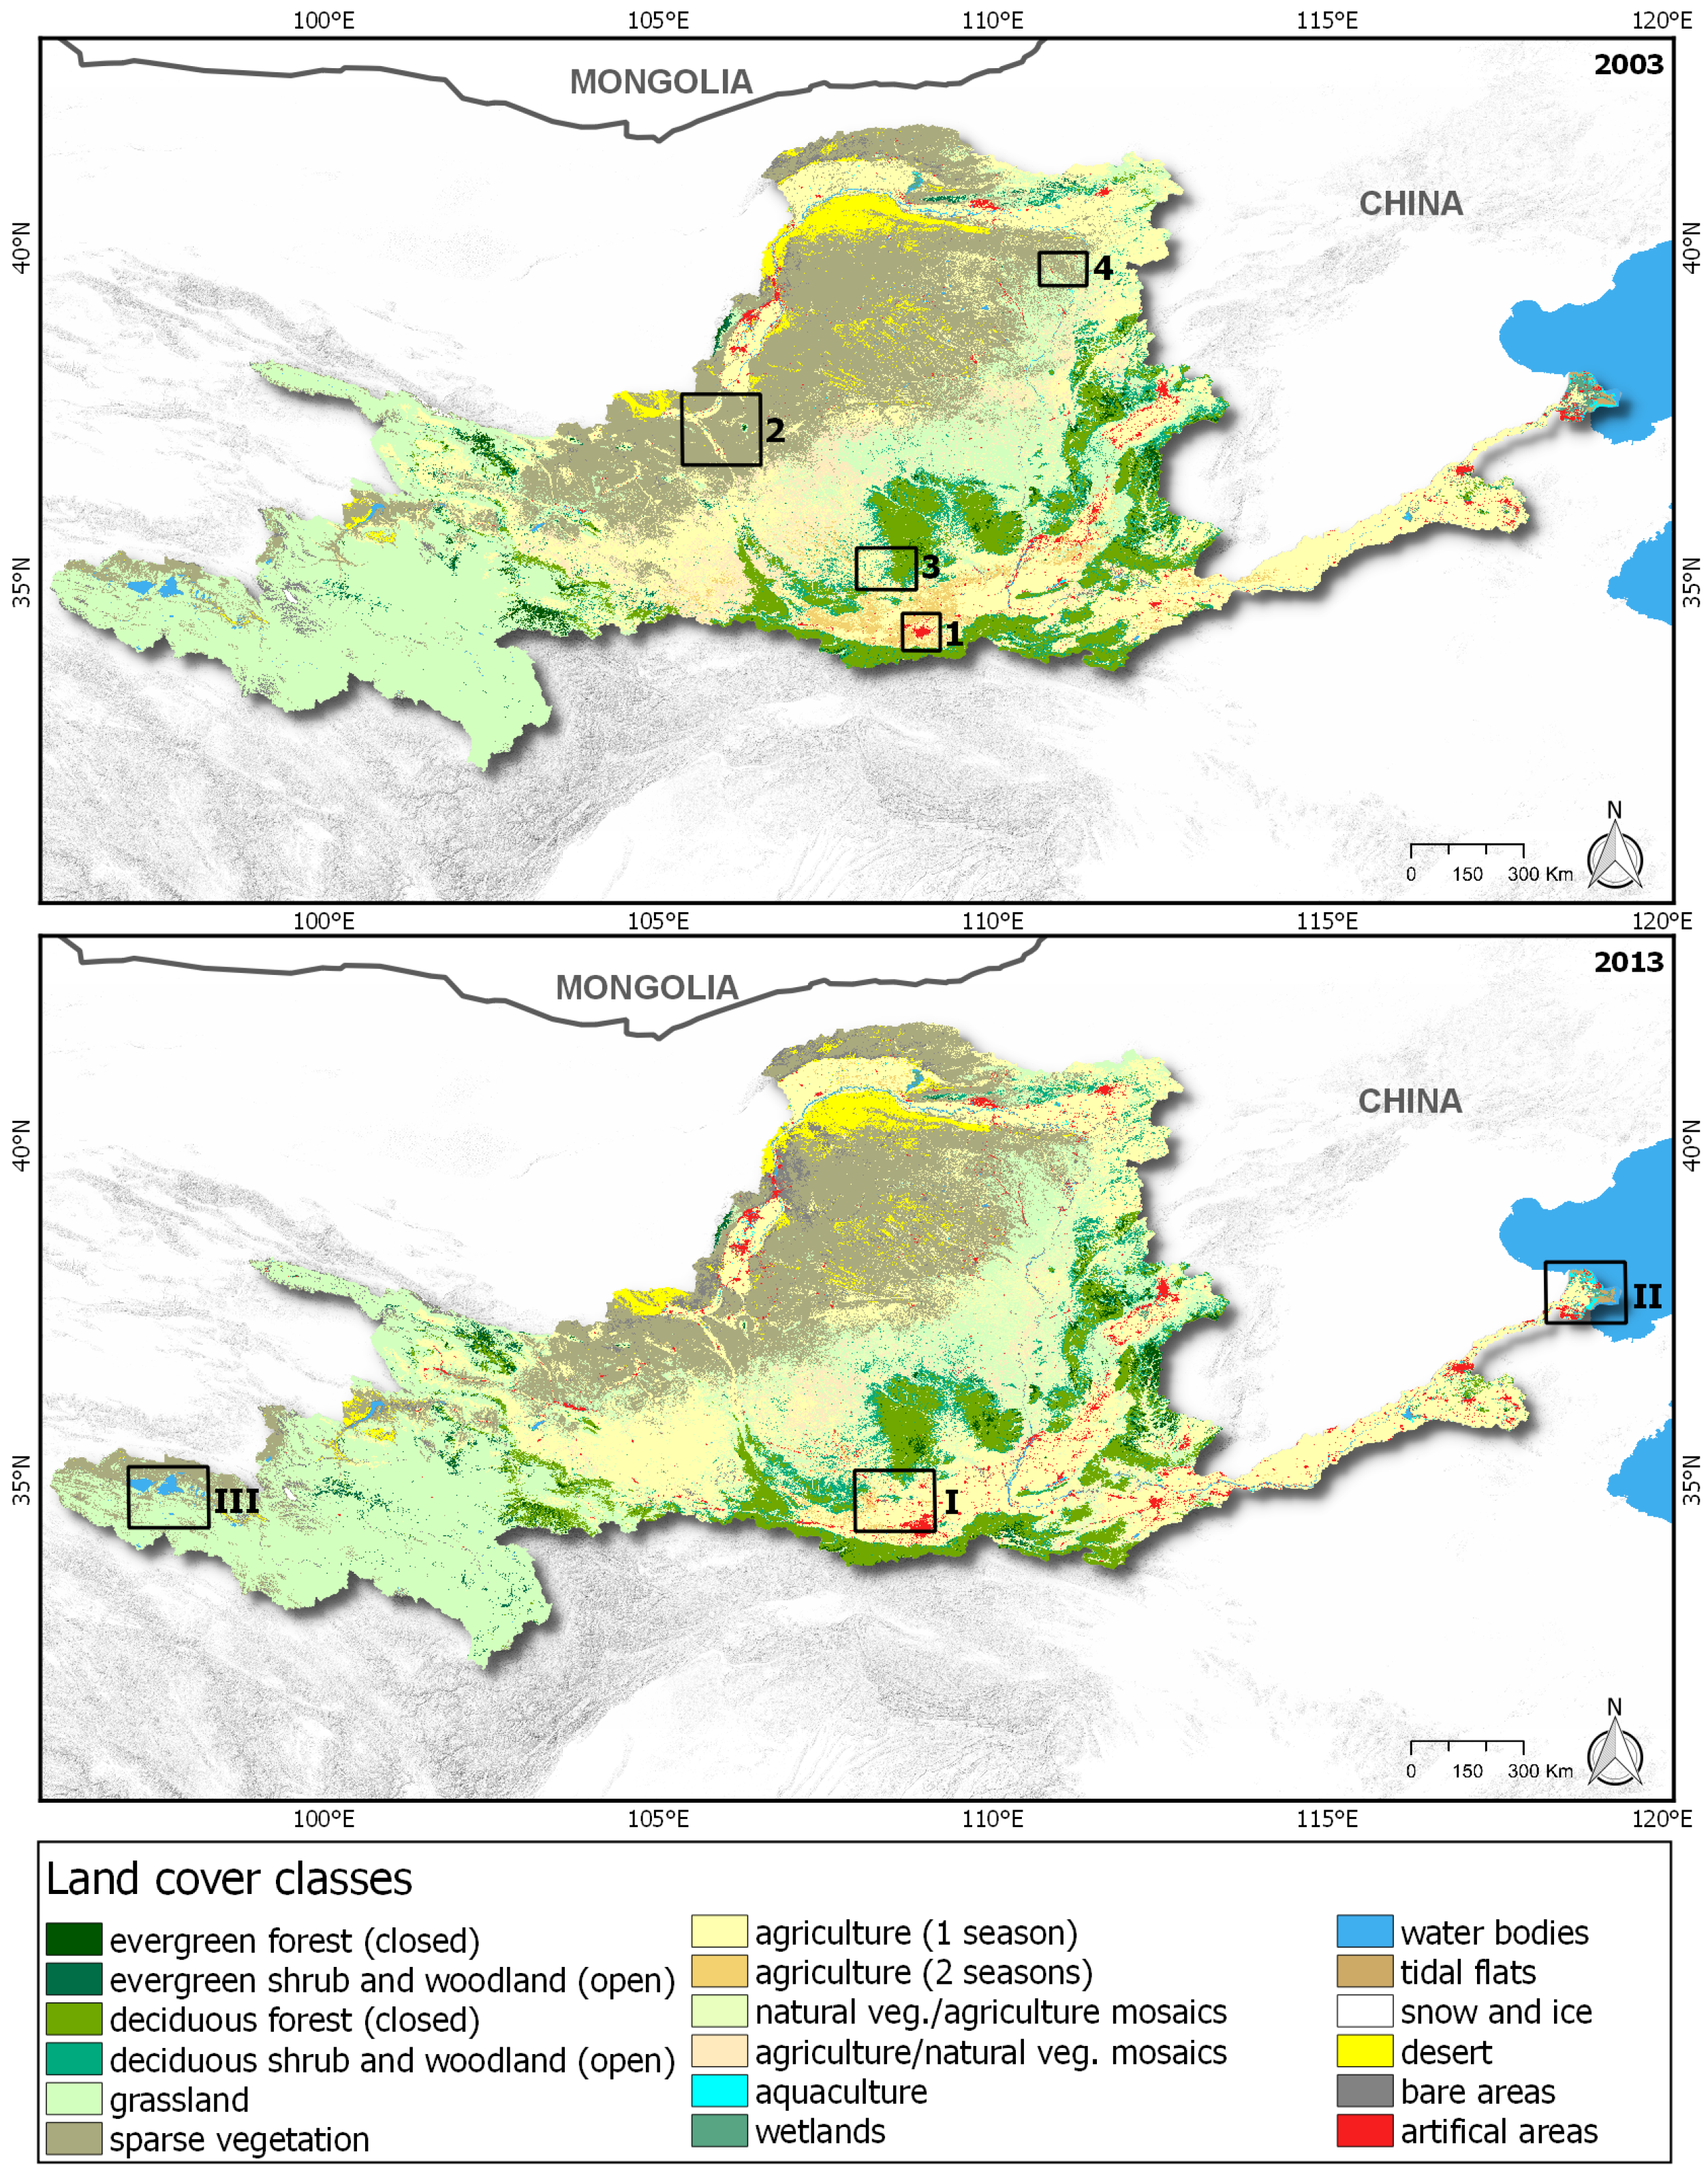
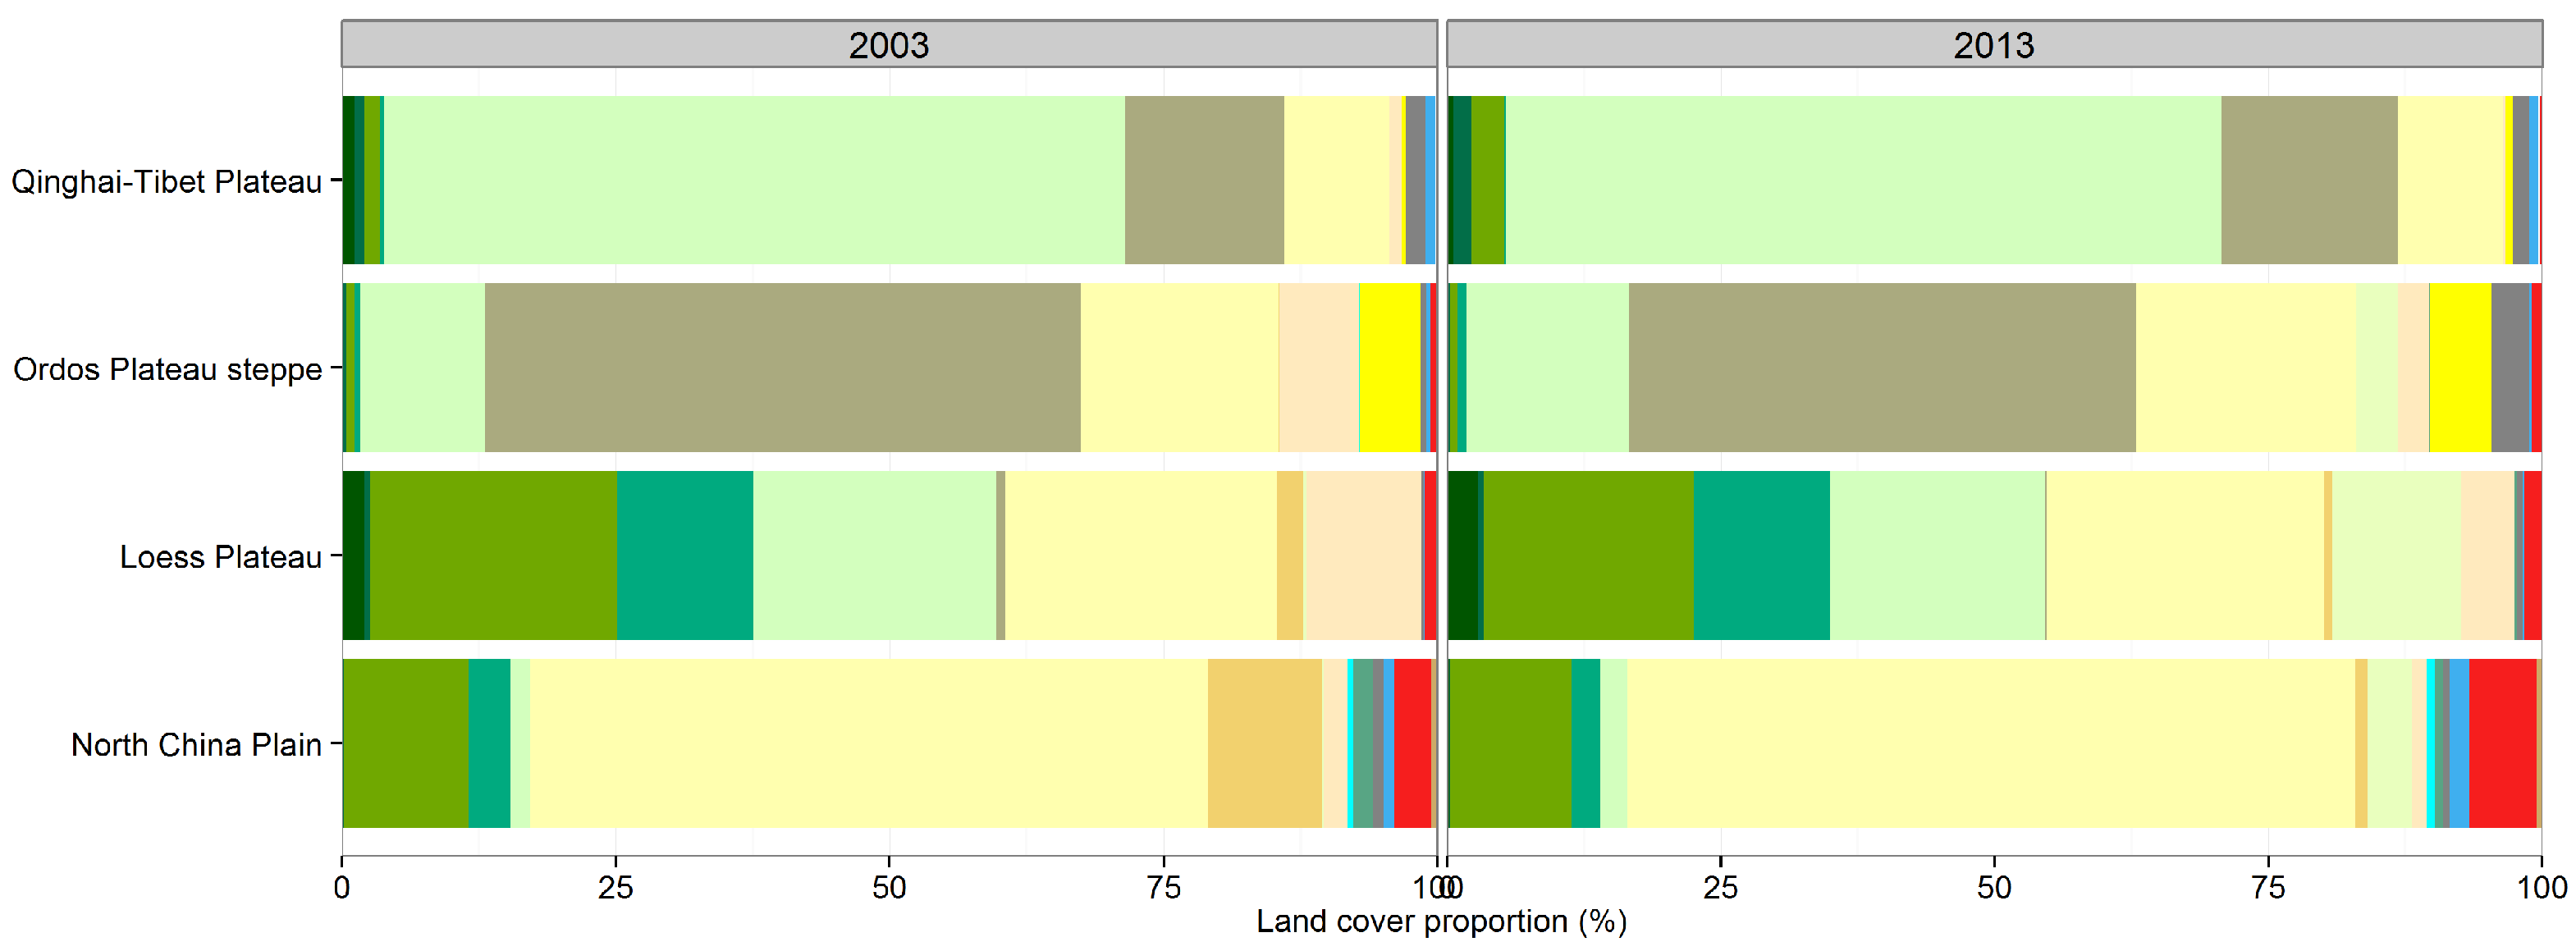
4.1. Current Land Cover Characteristics and Dynamics in the Yellow River Basin
4.1.1. The Qinghai-Tibet Plateau
4.1.2. The Ordos Plateau Steppe
4.1.3. The Loess Plateau
4.1.4. The North China Plain and Delta
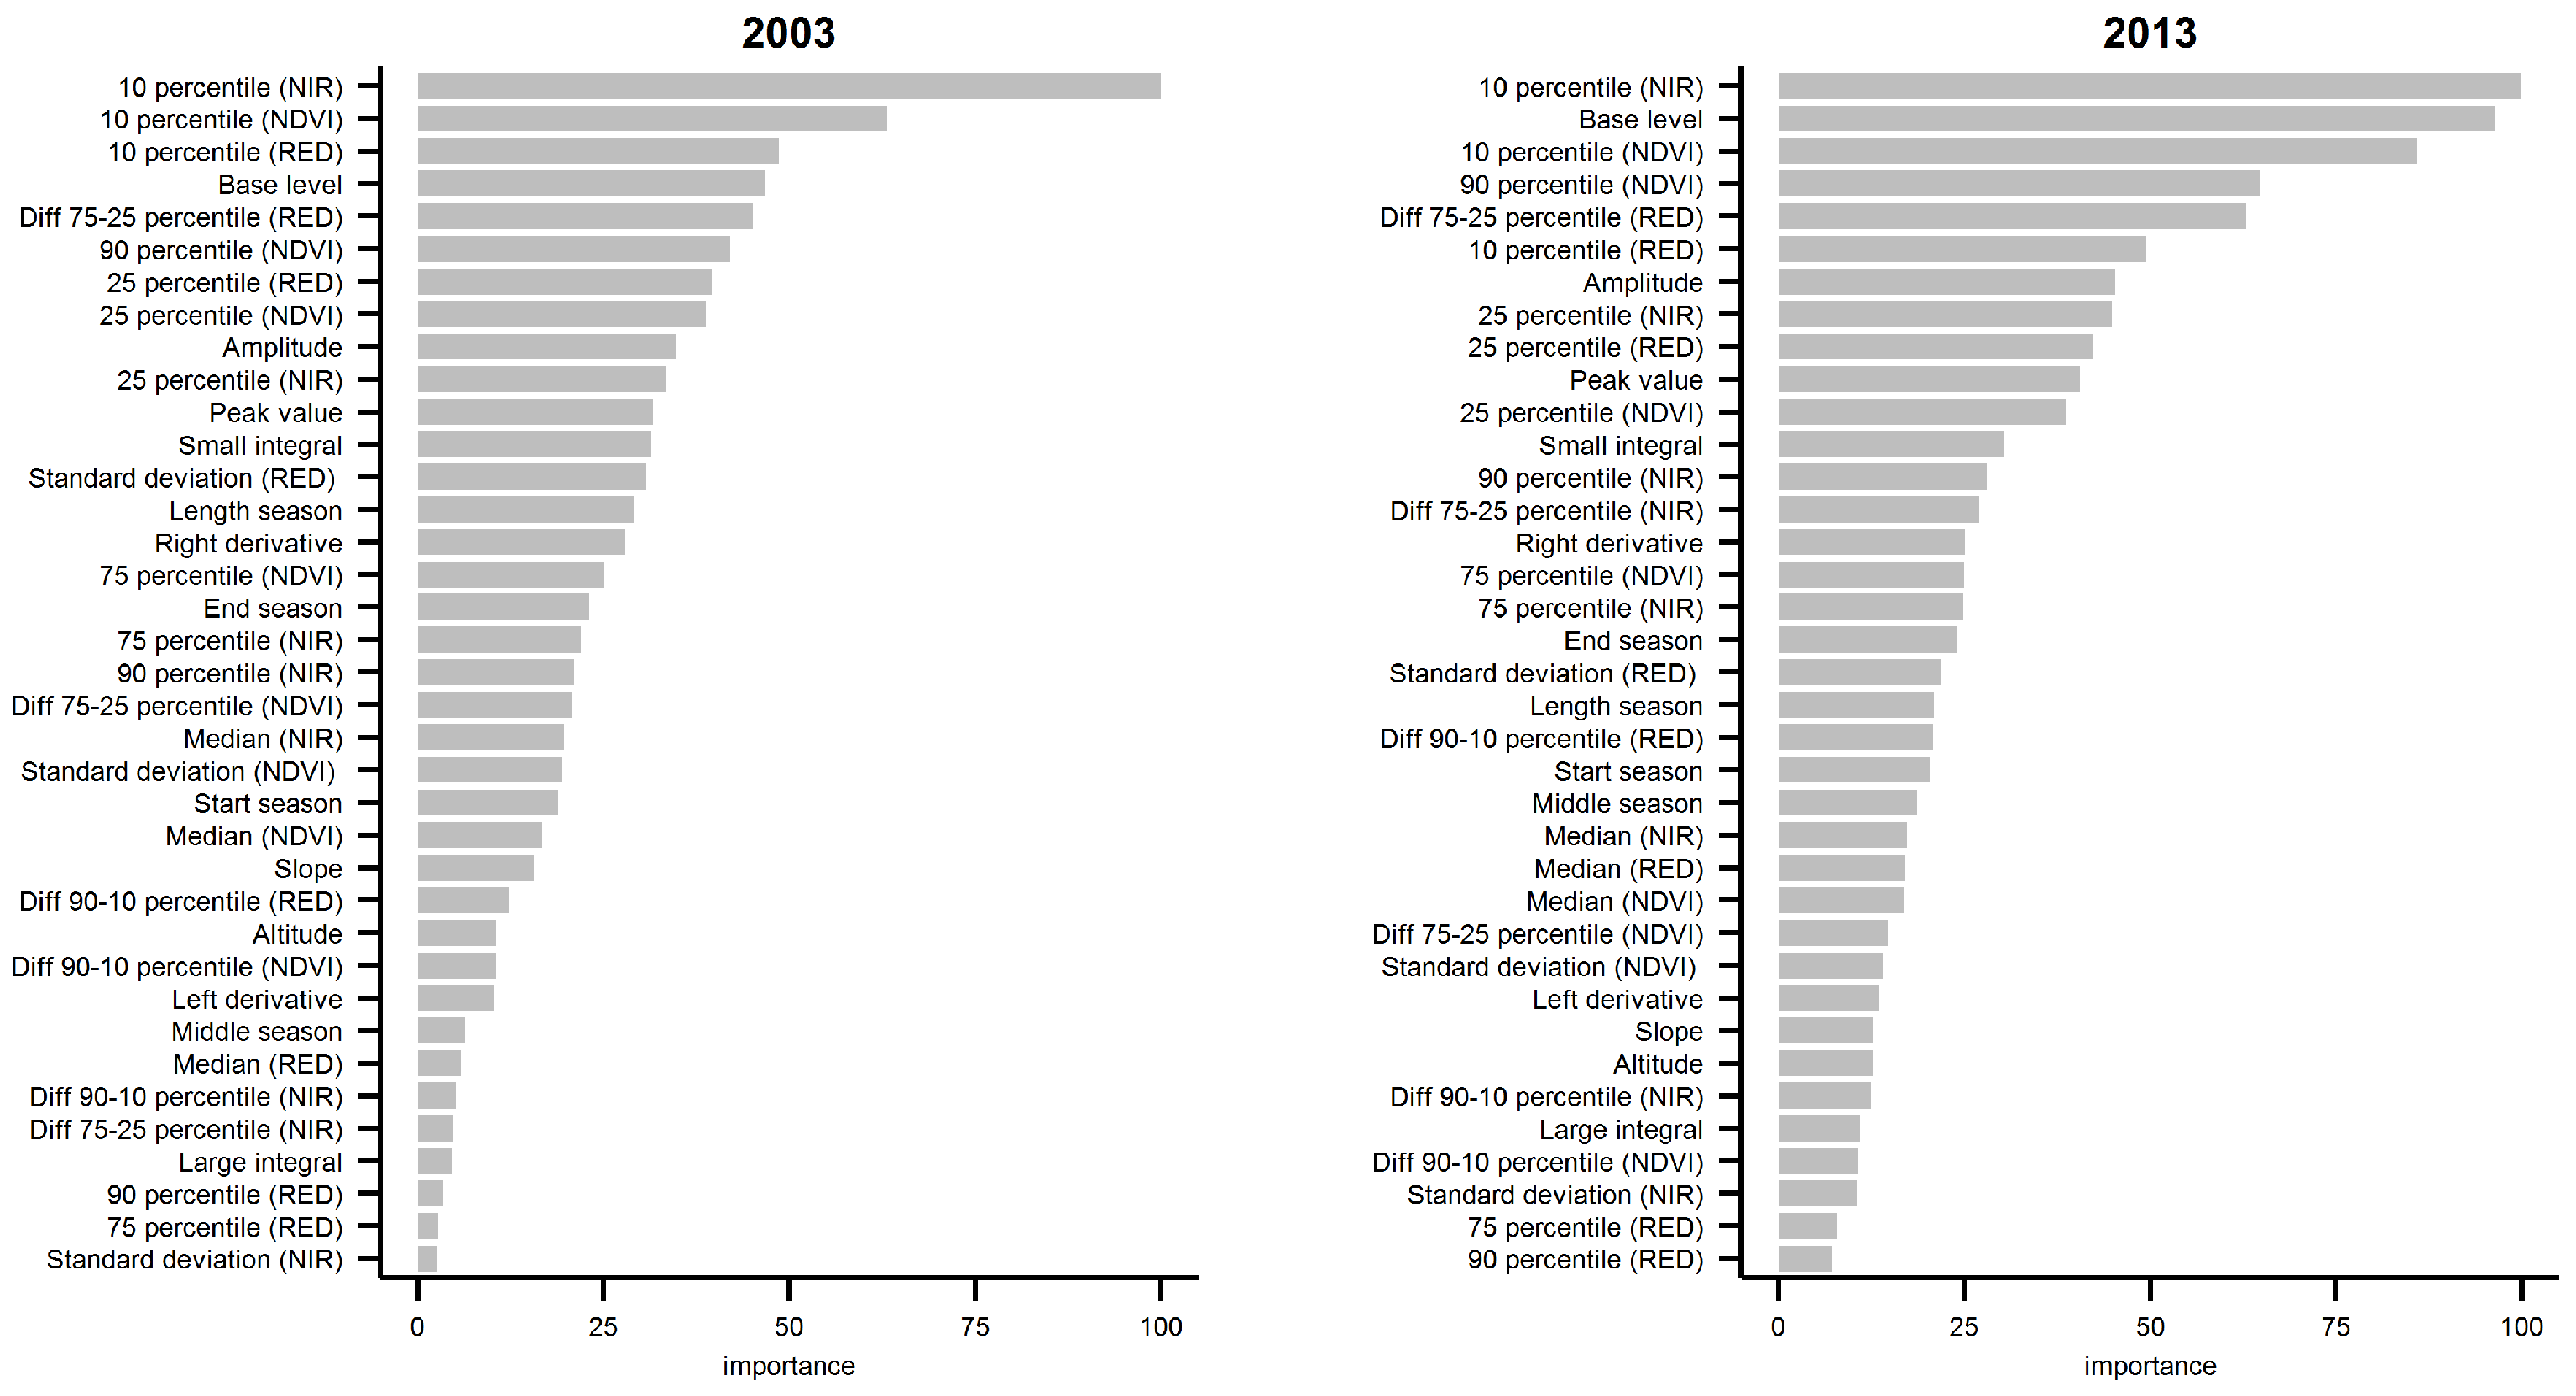
4.2. Variable Importance
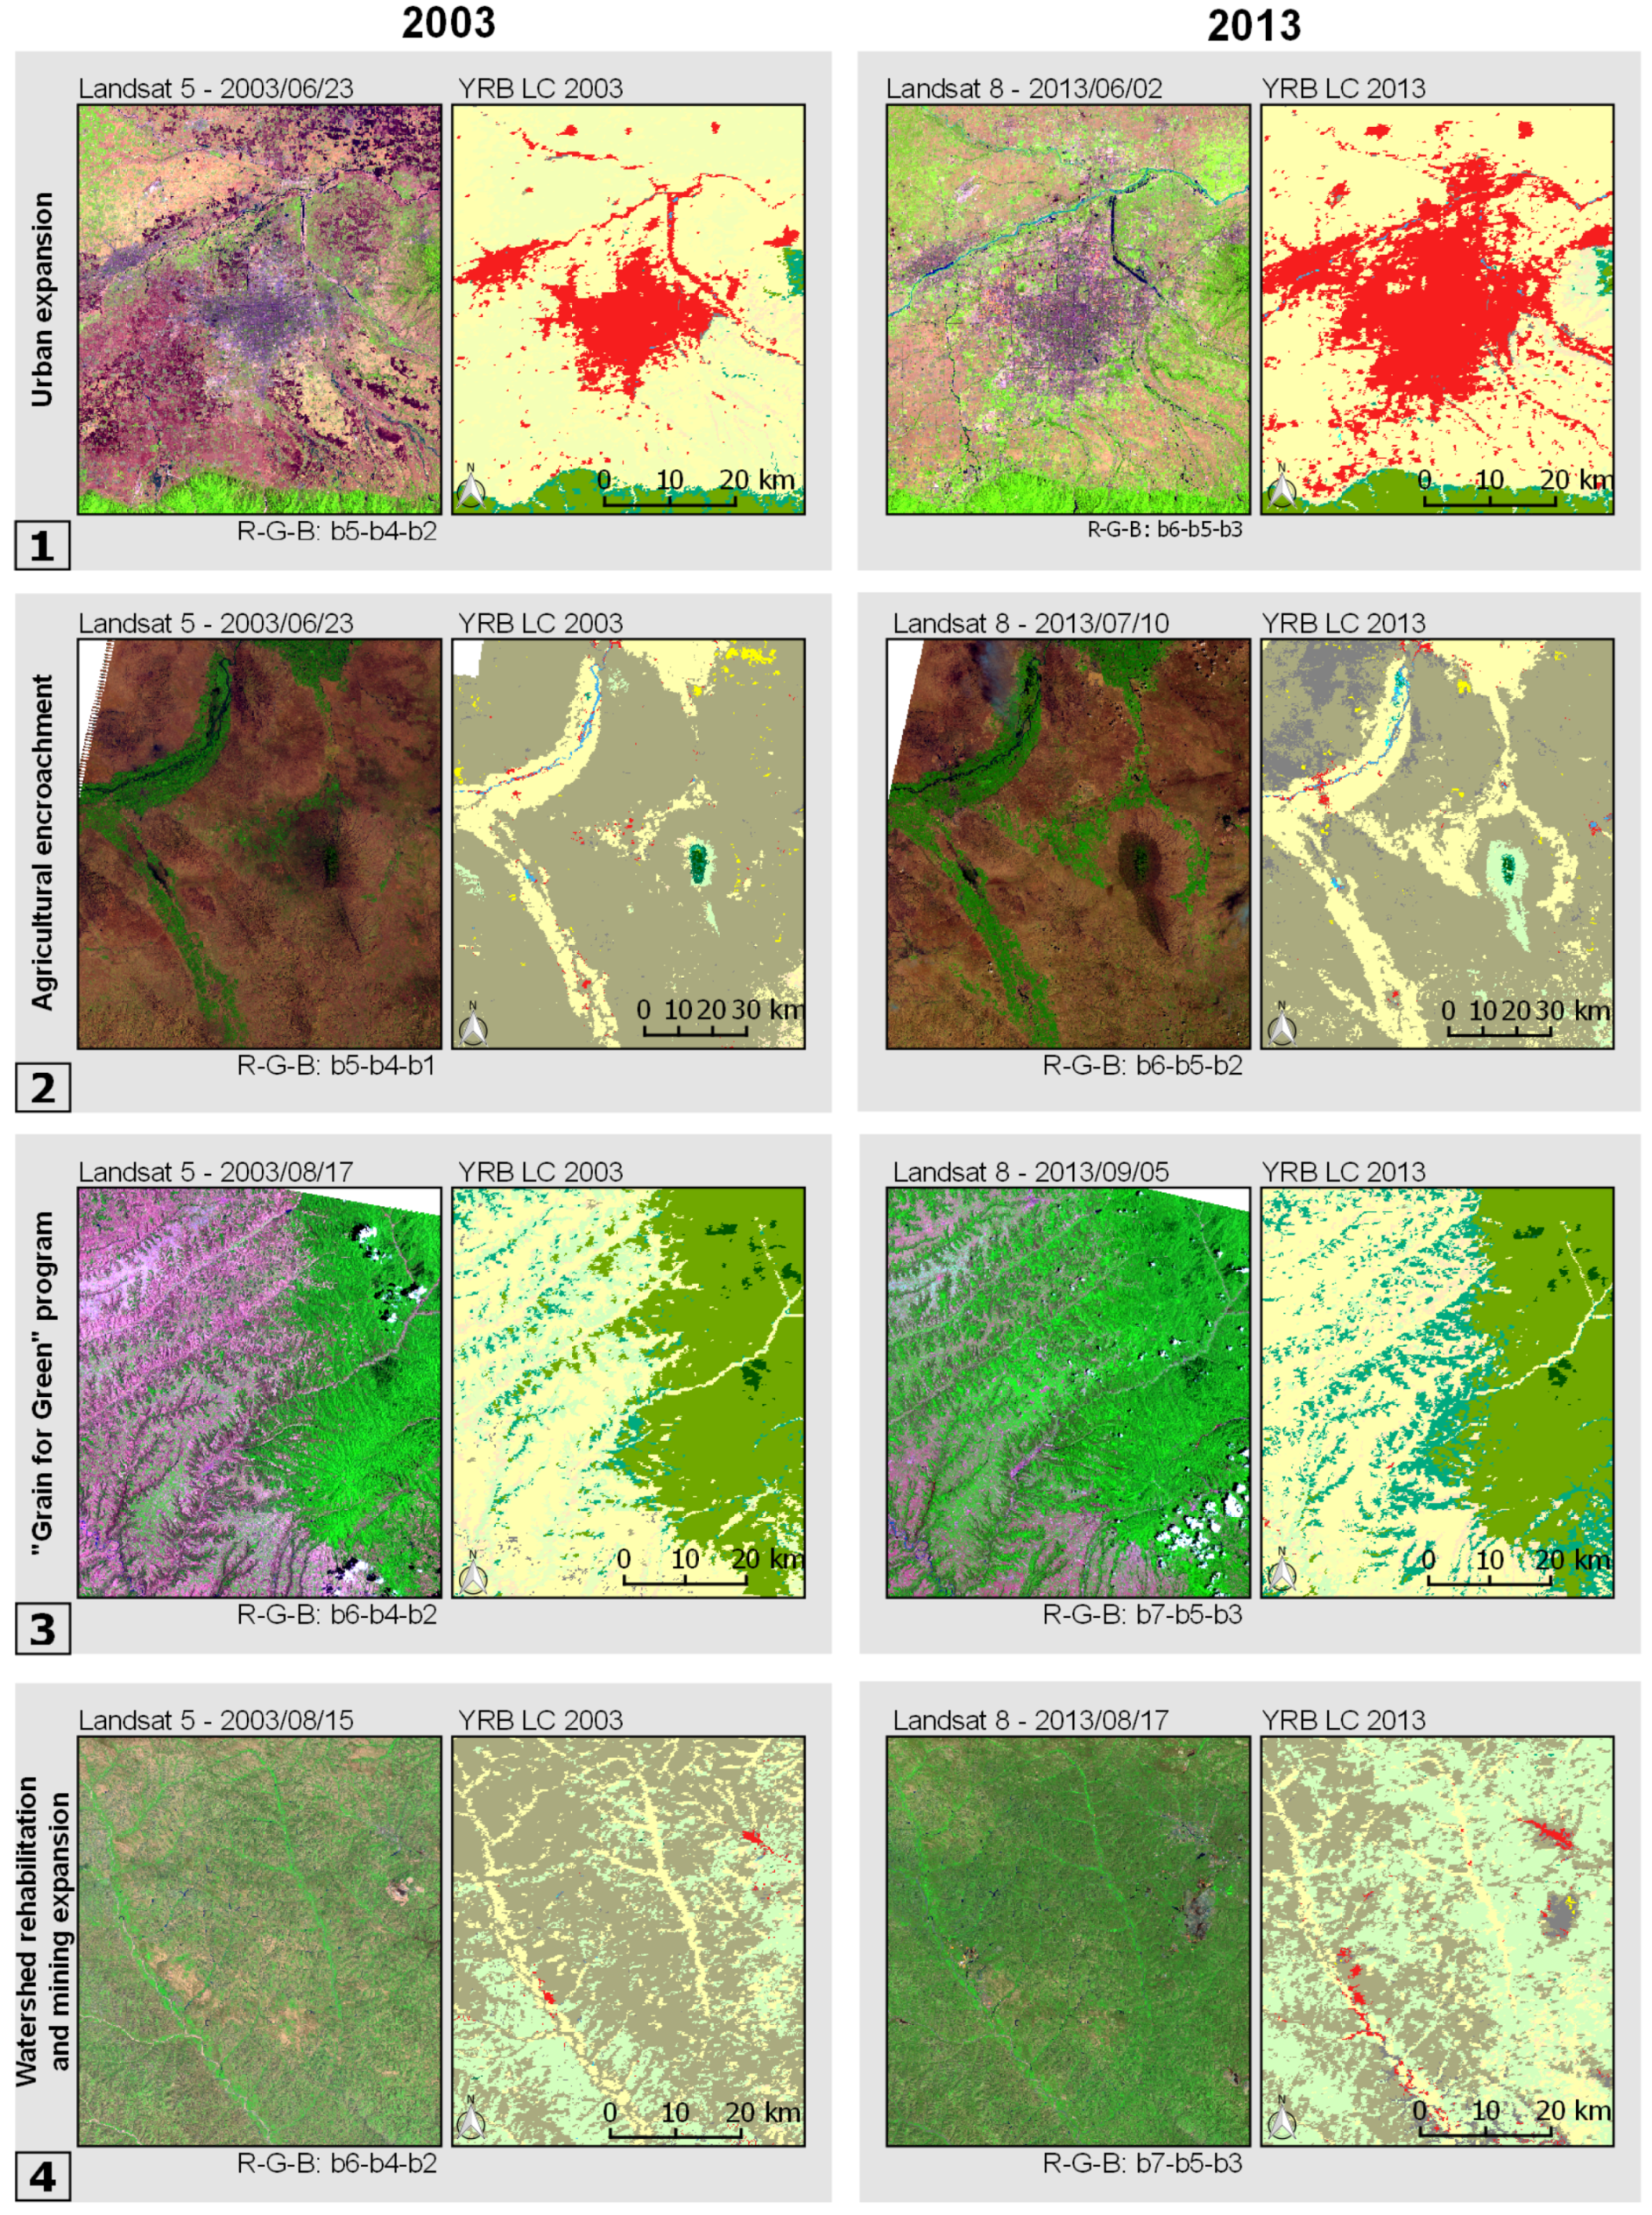
4.3. Local Dynamic Hotspot Regions in the Basin
4.3.1. Urban Expansion
4.3.2. Agricultural Encroachment
4.3.3. Ecological Restoration
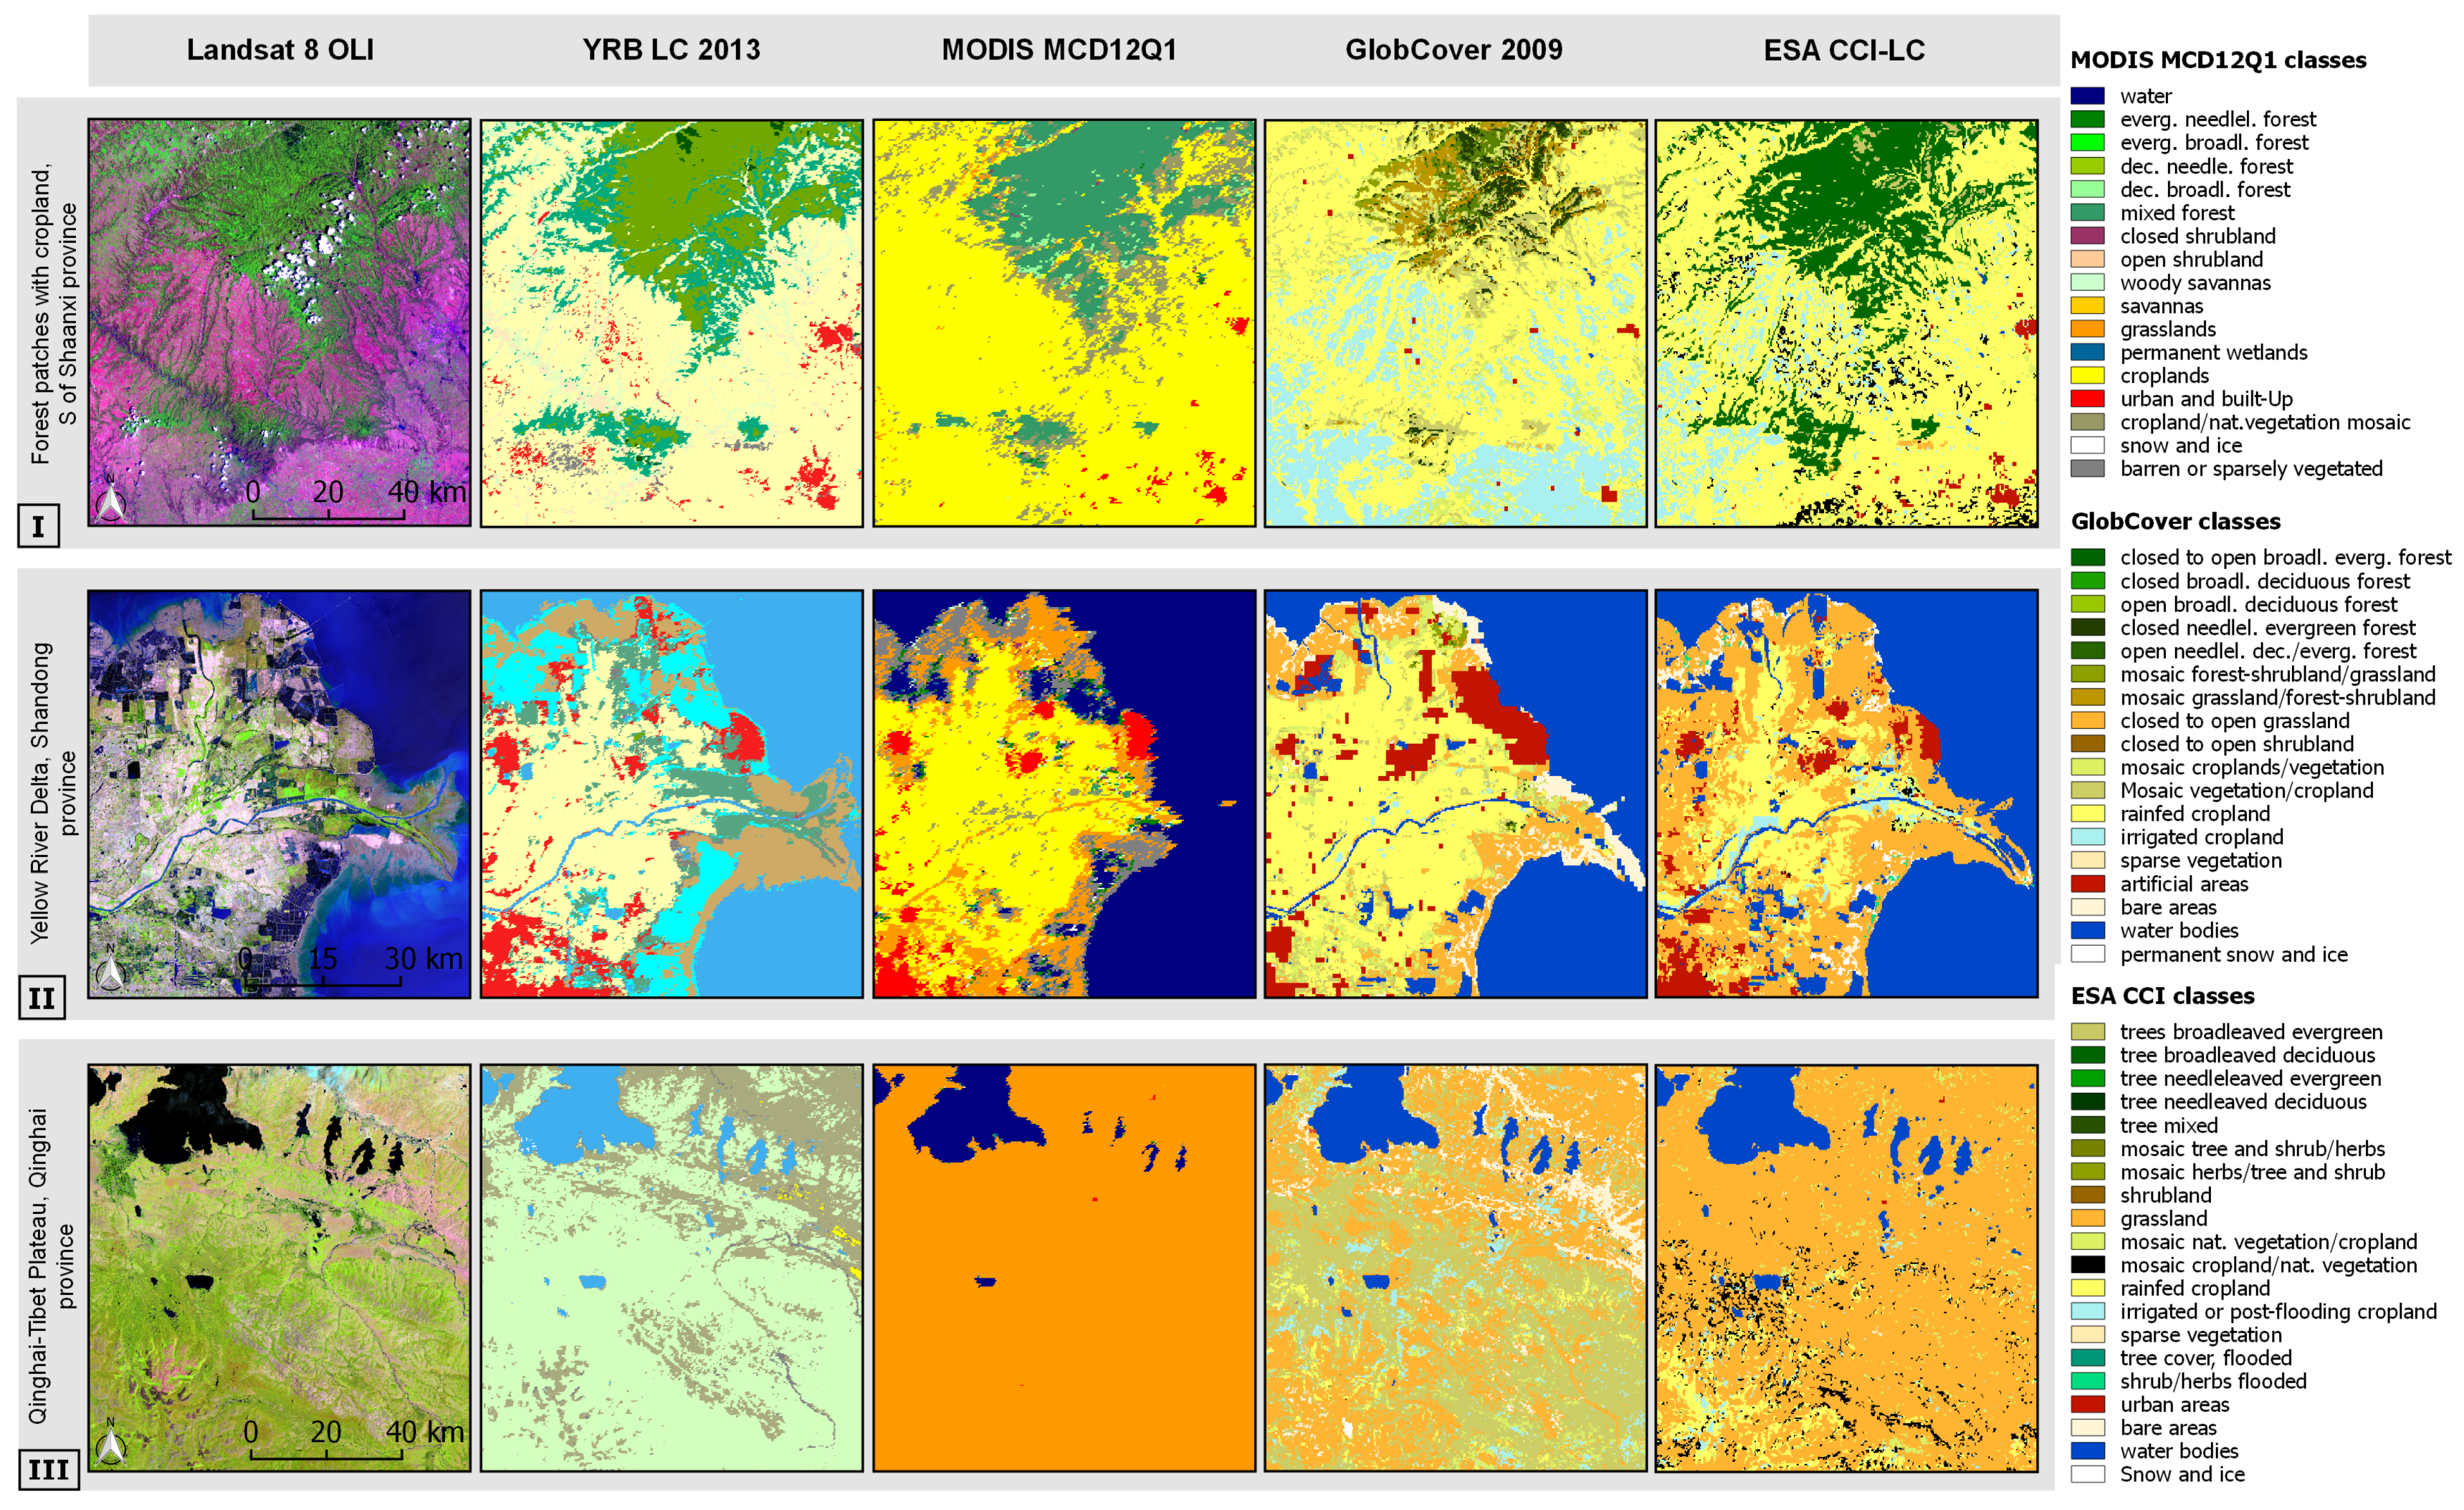
4.4. The YRB LC Product vs. Global and National Land Cover Products
5. Discussion
5.1. Land Cover Classification and Dynamics
5.2. Land Cover Accuracies
6. Conclusions
Acknowledgments
Author Contributions
Conflicts of Interest
References
- NBS (National Bureau of Statistics). China Statistical Database; National Bureau of Statistics: Beijing, China, 2013. [Google Scholar]
- Ringler, C.; Cai, X.; Wang, J.; Ahmed, A.; Xue, Y.; Xu, Z.; Yang, E.; Zhao, J.; Zhu, T.; Cheng, L.; et al. Yellow River basin: Living with scarcity. Water Int. 2010, 35, 681–701. [Google Scholar] [CrossRef]
- Nakayama, T. Simulation of the effect of irrigation on the hydrologic cycle in the highly cultivated Yellow River Basin. Agric. For. Meteorol. 2011, 151, 314–327. [Google Scholar] [CrossRef]
- Miao, C.Y.; Yang, L.; Chen, X.H.; Gao, Y. The vegetation cover dynamics (1982–2006) in different erosion regions of the Yellow River Basin, China. Land Degrad. Dev. 2012, 23, 62–71. [Google Scholar] [CrossRef]
- Cai, X. Water stress, water transfer and social equity in Northern China—Implications for policy reforms. J. Environ. Manag. 2008, 87, 14–25. [Google Scholar] [CrossRef] [PubMed]
- Bi, X.; Wang, B.; Lu, Q. Fragmentation effects of oil wells and roads on the Yellow River Delta, North China. Ocean Coast. Manag. 2011, 54, 256–264. [Google Scholar] [CrossRef]
- Ottinger, M.; Kuenzer, C.; Liu, G.; Wang, S.; Dech, S. Monitoring land cover dynamics in the Yellow River Delta from 1995 to 2010 based on Landsat 5 TM. Appl. Geogr. 2013, 44, 53–68. [Google Scholar] [CrossRef]
- Kuenzer, C.; Ottinger, M.; Liu, G.; Sun, B.; Baumhauer, R.; Dech, S. Earth observation-based coastal zone monitoring of the Yellow River Delta: Dynamics in China’s second largest oil producing region over four decades. Appl. Geogr. 2014, 55, 92–107. [Google Scholar] [CrossRef]
- Dong, L.; Wang, W.; Ma, M.; Kong, J.; Veroustraete, F. The change of land cover and land use and its impact factors in upriver key regions of the Yellow River. Int. J. Remote Sens. 2009, 30, 1251–1265. [Google Scholar] [CrossRef]
- Song, X.; Yang, G.; Yan, C.; Duan, H.; Liu, G.; Zhu, Y. Driving forces behind land use and cover change in the Qinghai-Tibetan Plateau: a case study of the source region of the Yellow River, Qinghai Province, China. Environ. Earth Sci. 2009, 59, 793–801. [Google Scholar] [CrossRef]
- Chen, Y.F.; Liu, Y.S.; Wang, J.; Yan, J.P.; Guo, X.D. Land use changes of an aeolian-loessial soil area in Northwest China: implications for ecological restoration. Pedosphere 2009, 19, 356–361. [Google Scholar] [CrossRef]
- Guo, W.Q.; Yang, T.B.; Dai, J.G.; Shi, L.; Lu, Z.Y. Vegetation cover changes and their relationship to climate variation in the source region of the Yellow River, China, 1990–2000. Int. J. Remote Sens. 2008, 29, 2085–2103. [Google Scholar] [CrossRef]
- Liang, S.; Ge, S.; Wan, L.; Xu, D. Characteristics and causes of vegetation variation in the source regions of the Yellow River, China. Int. J. Remote Sens. 2012, 33, 1529–1542. [Google Scholar] [CrossRef]
- Zhang, X.; Sun, R.; Zhang, B.; Tong, Q. Land cover classification of the North China Plain using MODIS-EVI time series. ISPRS J. Photogram. Remote Sens. 2008, 63, 476–484. [Google Scholar] [CrossRef]
- Daofeng, L.; Chunhui, L.; Fanghua, H.; Zheng, L. Complex vegetation cover classification study of the Yellow River Basin based on NDVI data. In Proceedings of the 2004 IEEE International Geoscience and Remote Sensing Symposium, IGARSS ’04, Anchorage, AK, USA, 20–24 September 2004; pp. 3360–3363.
- Wang, S.; Ding, C.; Liu, J. Landscape evolution in the Yellow River Basin using satellite remote sensing and GIS during the past decade. Int. J. Remote Sens. 2009, 30, 5573–5591. [Google Scholar] [CrossRef]
- Bartholomé, E.; Belward, A.S. GLC2000: A new approach to global land cover mapping from Earth observation data. Int. J. Remote Sens. 2005, 26, 1959–1977. [Google Scholar] [CrossRef]
- Bicheron, P.; Defourny, P.; Brockmann, C.; Schouten, L.; Vancutsem, C.; Huc, M.; Bontemps, S.; Leroy, M.; Achard, F.; Herold, M.; Ranera, F.; Arino, O. GLOBCOVER - Products Description and Validation Report; MEDIAS-France: Toulouse, France, 2010. [Google Scholar]
- Friedl, M.A.; Sulla-Menashe, D.; Tan, B.; Schneider, A.; Ramankutty, N.; Sibley, A.; Huang, X. MODIS Collection 5 global land cover: Algorithm refinements and characterization of new datasets. Remote Sens. Environ. 2010, 114, 168–182. [Google Scholar] [CrossRef]
- Defourney, P.; Kirches, G.; Brockmann, C.; Boettcher, M.; Peters, M.; Bontemps, S.; Lamarche, C.; Schlerf, M.; Santoro, M. Land Cover CCI Product User Guide Version 2; UCL-Geomatics: Louvain, Belgium, 2014. [Google Scholar]
- McCallum, I.; Obersteiner, M.; Nilsson, S.; Shvidenko, A. A spatial comparison of four satellite derived 1 km global land cover datasets. Int. J. Appl. Earth Obs. Geoinform. 2006, 8, 246–255. [Google Scholar] [CrossRef]
- Herold, M.; Mayaux, P.; Woodcock, C.; Baccini, A.; Schmullius, C. Some challenges in global land cover mapping: An assessment of agreement and accuracy in existing 1 km datasets. Remote Sens. Environ. 2008, 112, 2538–2556. [Google Scholar] [CrossRef]
- Alcantara, C.; Kuemmerle, T.; Prishchepov, A.V.; Radeloff, V.C. Mapping abandoned agriculture with multi-temporal {MODIS} satellite data. Remote Sens. Environ. 2012, 124, 334–347. [Google Scholar] [CrossRef]
- Klein, I.; Gessner, U.; Kuenzer, C. Regional land cover mapping and change detection in Central Asia using MODIS time-series. Appl. Geogr. 2012, 35, 219–234. [Google Scholar] [CrossRef]
- Wohlfart, C.; Wegmann, M.; Leimgruber, P. Mapping threatened dry deciduous dipterocarp forest in South-east Asia for conservation management. Trop. Conserv. Sci. 2014, 7, 597–613. [Google Scholar]
- Gessner, U.; Machwitz, M.; Esch, T.; Tillack, A.; Naeimi, V.; Kuenzer, C.; Dech, S. Multi-sensor mapping of West African land cover using MODIS, ASAR and TanDEM-X/TerraSAR-X data. Remote Sens. Environ. 2015, 164, 282–297. [Google Scholar] [CrossRef]
- Clark, M.L.; Aide, T.M.; Riner, G. Land change for all municipalities in Latin America and the Caribbean assessed from 250-m MODIS imagery (2001–2010). Remote Sens. Environ. 2012, 126, 84–103. [Google Scholar] [CrossRef]
- Kiptala, J.; Mohamed, Y.; Mul, M.; Cheema, M.; der Zaag, P.V. Land use and land cover classification using phenological variability from MODIS vegetation in the Upper Pangani River Basin, Eastern Africa. Phys. Chem. Earth, Parts A/B/C 2013, 66, 112–122. [Google Scholar] [CrossRef]
- Leinenkugel, P.; Kuenzer, C.; Oppelt, N.; Dech, S. Characterisation of land surface phenology and land cover based on moderate resolution satellite data in cloud prone areas—A novel product for the Mekong Basin. Remote Sens. Environ. 2013, 136, 180–198. [Google Scholar] [CrossRef]
- Hansen, M.C.; Townshend, J.R.G.; DeFries, R.S.; Carroll, M. Estimation of tree cover using MODIS data at global, continental and regional/local scales. Int. J. Remote Sens. 2005, 26, 4359–4380. [Google Scholar] [CrossRef]
- Hijmans, R.J.; Cameron, S.E.; Parra, J.L.; Jones, P.G.; Jarvis, A. Very high resolution interpolated climate surfaces for global land areas. Int. J. Climatol. 2005, 25, 1965–1978. [Google Scholar] [CrossRef]
- Miao, C.; Ni, J.; Borthwick, A.G.; Yang, L. A preliminary estimate of human and natural contributions to the changes in water discharge and sediment load in the Yellow River. Glob. Planet. Chang. 2011, 76, 196–205. [Google Scholar] [CrossRef]
- Chen, Y.; Syvitski, J.; Gao, S.; Overeem, I.; Kettner, A. Socio-economic impacts on flooding: A 4000-Year history of the Yellow River, China. AMBIO 2012, 41, 682–698. [Google Scholar] [CrossRef] [PubMed]
- Chen, L.; Wei, W.; Fu, B.; Lu, Y. Soil and water conservation on the Loess Plateau in China: Review and perspective. Prog. Phys. Geogr. 2007, 31, 389–403. [Google Scholar] [CrossRef]
- Olson, D.M.; Dinerstein, E.; Wikramanayake, E.D.; Burgess, N.D.; Powell, G.V.N.; Underwood, E.C.; D’amico, J.A.; Itoua, I.; Strand, H.E.; Morrison, J.C.; et al. Terrestrial ecoregions of the world: A new map of life on earth. BioScience 2001, 51, 933–938. [Google Scholar] [CrossRef]
- Wang, H.; Yang, Z.; Saito, Y.; Liu, J.P.; Sun, X.; Wang, Y. Stepwise decreases of the Huanghe (Yellow River) sediment load (1950–2005): Impacts of climate change and human activities. Glob. Planet. Chang. 2007, 57, 331–354. [Google Scholar] [CrossRef]
- Ran, L.; Lu, X.; Xin, Z.; Yang, X. Cumulative sediment trapping by reservoirs in large river basins: A case study of the Yellow River basin. Glob. Planet. Chang. 2013, 100, 308–319. [Google Scholar] [CrossRef]
- Huete, A.; Didan, K.; Miura, T.; Rodriguez, E.; Gao, X.; Ferreira, L. Overview of the radiometric and biophysical performance of the MODIS vegetation indices. Remote Sens. Environ. 2002, 83, 195–213. [Google Scholar] [CrossRef]
- R Core Team. R: A Language and Environment for Statistical Computing; R Foundation for Statistical Computing: Vienna, Austria, 2014. [Google Scholar]
- Mattiuzzi, M.; Verbesselt, J.; Stevens, F.; Mosher, S.; Hengl, T.; Klisch, A.; Evans, B.; Lobo, A. MODIS: MODIS Acquisition and Processing Package. Available online: http://R-Forge.R-project.org/projects/modis/ (accessed on 10 February 2015).
- Jönsson, P.; Eklundh, L. TIMESAT—A program for analyzing time-series of satellite sensor data. Comput. Geosci. 2004, 30, 833–845. [Google Scholar] [CrossRef]
- Savitzky, A.; Golay, M.J.E. Smoothing and differentiation of data by simplified least squares procedures. Anal. Chem. 1964, 36, 1627–1639. [Google Scholar] [CrossRef]
- Chang, J.; Hansen, M.C.; Pittman, K.; Carroll, M.; DiMiceli, C. Corn and soybean mapping in the United States using MODIS time-series data sets. Agron. J. 2007, 99, 1654–1664. [Google Scholar] [CrossRef]
- Conrad, C.; Colditz, R.R.; Dech, S.; Klein, D.; Vlek, P.L.G. Temporal segmentation of MODIS time series for improving crop classification in Central Asian irrigation systems. Int. J. Remote Sens. 2011, 32, 8763–8778. [Google Scholar] [CrossRef]
- Colditz, R.; Schmidt, M.; Conrad, C.; Hansen, M.; Dech, S. Land cover classification with coarse spatial resolution data to derive continuous and discrete maps for complex regions. Remote Sens. Environ. 2011, 115, 3264–3275. [Google Scholar] [CrossRef]
- Congalton, R.; Green, K. Assessing the Accuracy of Remotely Sensed Data: Principles and Practices; Mapping Science, CRC Press: Boca Raton, FL, USA, 2009. [Google Scholar]
- Congalton, R.G. A comparison of sampling schemes used in generating error matrices for assessing the accuracy of maps generated from remotely sensed data. Photogram. Eng. Remote Sens. 1988, 54, 587–592. [Google Scholar]
- Jensen, J.R. Introductory Digital Image Processing: A Remote Sensing Perspective; Prentice Hall: Upper Saddle River, NJ, USA, 2005. [Google Scholar]
- Congalton, R.G. A review of assessing the accuracy of classifications of remotely sensed data. Remote Sens. Environ. 1991, 37, 35–46. [Google Scholar] [CrossRef]
- Chan, J.C.W.; Paelinckx, D. Evaluation of random forest and adaboost tree-based ensemble classification and spectral band selection for ecotope mapping using airborne hyperspectral imagery. Remote Sens. Environ. 2008, 112, 2999–3011. [Google Scholar] [CrossRef]
- Lawrence, R.L.; Wood, S.D.; Sheley, R.L. Mapping invasive plants using hyperspectral imagery and Breiman Cutler classifications (randomForest). Remote Sens. Environ. 2006, 100, 356–362. [Google Scholar] [CrossRef]
- Gislason, P.O.; Benediktsson, J.A.; Sveinsson, J.R. Random forests for land cover classification. Pattern Recognit. Lett. 2006, 27, 294–300. [Google Scholar] [CrossRef]
- Breiman, L. Random Forests. In Machine Learning; Springer: New York, NY, USA, 2001; pp. 5–32. [Google Scholar]
- Liaw, A.; Wiener, M. Classification and regression by randomForest. R News 2002, 2, 18–22. [Google Scholar]
- Kuhn, M.; Wing, J.; Weston, S.; Williams, A.; Keefer, C.; Engelhardt, A.; Cooper, T.; Mayer, Z.; Kenkel, B.; the R Core Team; et al. Caret: Classification and Regression Training. Available online: http://CRAN.R-project.org/package=caret (accessed on 22 August 2015).
- Kursa, M.B.; Rudnicki, W.R. Feature selection with the Boruta package. J. Stat. Softw. 2010, 36, 1–13. [Google Scholar] [CrossRef]
- Adelabu, S.; Mutanga, O.; Adam, E. Testing the reliability and stability of the internal accuracy assessment of random forest for classifying tree defoliation levels using different validation methods. Geocarto Int. 2015, 30, 810–821. [Google Scholar] [CrossRef]
- Foody, G. Status of land cover classification accuracy assessment. Remote Sens. Environ. 2002, 80, 185–201. [Google Scholar] [CrossRef]
- NOAA-NGDC. In Night-Time Lights of the World (Version 4). Available online: http://ngdc.noaa.gov/eog/dmsp/downloadV4composites.html (accessed on 22 August 2015).
- Small, C.; Pozzi, F.; Elvidge, C. Spatial analysis of global urban extent from DMSP-OLS night lights. Remote Sens. Environ. 2005, 96, 277–291. [Google Scholar] [CrossRef]
- Li, L.; Friedl, M.A.; Xin, Q.; Gray, J.; Pan, Y.; Frolking, S. Mapping crop cycles in China using MODIS-EVI time series. Remote Sens. 2014, 6, 2473–2493. [Google Scholar] [CrossRef]
- Liu, J.; Wu, P.; Wang, Y.; Zhao, X.; Sun, S.; Cao, X. Impacts of changing cropping pattern on virtual water flows related to crops transfer: A case study for the Hetao irrigation district, China. J. Sci. Food Agric. 2014, 94, 2992–3000. [Google Scholar] [CrossRef] [PubMed]
- Guobin, L. Soil conservation and sustainable agriculture on the Loess Plateau: Challenges and prospects. Ambio 1999, 28, 663–668. [Google Scholar]
- Zhou, H.; Rompaey, A.V.; Wang, J. Detecting the impact of the “Grain for Green” program on the mean annual vegetation cover in the Shaanxi province, China using SPOT-VGT NDVI data. Land Use Policy 2009, 26, 954–960. [Google Scholar] [CrossRef]
- Clark, M.L.; Aide, T.M.; Grau, H.R.; Riner, G. A scalable approach to mapping annual land cover at 250 m using MODIS time series data: A case study in the Dry Chaco ecoregion of South America. Remote Sens. Environ. 2010, 114, 2816–2832. [Google Scholar] [CrossRef]
- Blanco, P.D.; Colditz, R.R.; Saldaña, G.L.; Hardtke, L.A.; Llamas, R.M.; Mari, N.A.; Fischer, A.; Caride, C.; Aceñolaza, P.G.; del Valle, H.F.; et al. A land cover map of Latin America and the Caribbean in the framework of the SERENA project. Remote Sens. Environ. 2013, 132, 13–31. [Google Scholar] [CrossRef]
- Liu, J.; Li, Z.; Zhang, X.; Li, R.; Liu, X.; Zhang, H. Responses of vegetation cover to the Grain for Green Program and their driving forces in the He-Long region of the middle reaches of the Yellow River. J. Arid Land 2013, 5, 511–520. [Google Scholar] [CrossRef]
- Gao, P.; Niu, X.; Wang, B.; Zheng, Y. Land use changes and its driving forces in hilly ecological restoration area based on gis and rs of northern china. Sci. Rep. 2015, 5, 1–5. [Google Scholar] [CrossRef] [PubMed]
- Zhai, J.; Liu, R.; Liu, J.; Huang, L.; Qin, Y. Human-induced Landcover changes drive a diminution of land surface albedo in the Loess Plateau (China). Remote Sens. 2015, 7, 2926–2941. [Google Scholar] [CrossRef]
- Eisfelder, C.; Kuenzer, C. Investigating fourteen years of net primary productivity based on remote sensing data for China. In Remote Sensing Time Series; Springer International Publishing: Cham, Switzerland, 2015; pp. 269–288. [Google Scholar]
- Feng, X.; Fu, B.; Lu, N.; Zeng, Y.; Wu, B. How ecological restoration alters ecosystem services: An analysis of carbon sequestration in China’s Loess Plateau. Sci. Rep. 2013, 3, 1–5. [Google Scholar] [CrossRef] [PubMed]
- Ghose, B. Food security and food self-sufficiency in China: From past to 2050. Food Energy Secur. 2014, 3, 86–95. [Google Scholar] [CrossRef]
- Matson, P.A.; Parton, W.J.; Power, A.G.; Swift, M.J. Agricultural intensification and ecosystem properties. Science 1997, 277, 504–509. [Google Scholar] [CrossRef] [PubMed]
- Tilman, D.; Fargione, J.; Wolff, B.; D’Antonio, C.; Dobson, A.; Howarth, R.; Schindler, D.; Schlesinger, W.H.; Simberloff, D.; Swackhamer, D. Forecasting agriculturally driven global environmental change. Science 2001, 292, 281–284. [Google Scholar] [CrossRef] [PubMed]
- Rudel, T.K.; Schneider, L.; Uriarte, M.; Turner, B.L.; DeFries, R.; Lawrence, D.; Geoghegan, J.; Hecht, S.; Ickowitz, A.; Lambin, E.F.; et al. Agricultural intensification and changes in cultivated areas, 1970–2005. Proc. Natl. Acad. Sci. USA 2009, 106, 20675–20680. [Google Scholar] [CrossRef] [PubMed]
- Siebert, S.; Portmann, F.T.; Döll, P. Global patterns of cropland use intensity. Remote Sens. 2010, 2, 1625–1643. [Google Scholar] [CrossRef]
- Wang, J.; Liu, Y.; Liu, Z. Spatio-temporal patterns of cropland conversion in response to the “Grain for Green Project” in China’s loess hilly region of Yanchuan County. Remote Sens. 2013, 5, 5642–5661. [Google Scholar] [CrossRef]
- Meng, E.C.; Hu, R.; Shi, X.; Zhang, S. Maize in China: Production Systems, Constraints, and Research Priorities; Maize Production Systems Papers 7648; (CIMMYT) International Maize and Wheat Improvement Center: El Batan, Mexico, 2006. [Google Scholar]
- Fernandes, R.; Fraser, R.; Latifovic, R.; Cihlar, J.; Beaubien, J.; Du, Y. Approaches to fractional land cover and continuous field mapping: A comparative assessment over the BOREAS study region. Remote Sens. Environ. 2004, 89, 234–251. [Google Scholar] [CrossRef]
- Gessner, U.; Machwitz, M.; Conrad, C.; Dech, S. Estimating the fractional cover of growth forms and bare surface in savannas. A multi-resolution approach based on regression tree ensembles. Remote Sens. Environ. 2013, 129, 90–102. [Google Scholar] [CrossRef] [Green Version]


| Metrics | Description | |
|---|---|---|
| Seasonal metrics | Start of season | Time for which the left edge has increased to 40% of the seasonal amplitude measured |
| from the left minimum level | ||
| End of the season | Time for which the right edge has decreased to 40% of the seasonal amplitude measured | |
| from the right minimum level | ||
| Length of the season | Time from the start to the end of the season | |
| Base level | Average of the left and right minimum values | |
| Middle of the season | Mean value of the times for which the left edge has increased to the 80% level and | |
| the right edge has decreased to the 80% level | ||
| Peak value | Largest value between the start and end of the season | |
| Seasonal amplitude | Difference between the peak value and the base level | |
| Rate of increase at the beginning of the season | Ratio of the difference between the 20% and 80% levels and the corresponding time difference | |
| Rate of decrease at the end of the season | Ratio of the difference between the right 20% and 80% levels and the corresponding time difference | |
| Large seasonal integral | Integral of all values between the start and the end of the season | |
| Small seasonal integral | Integral of all values from the start to the end of the season minus the base level | |
| Annual metrics | Median | Median value derived from annual multi-temporal statistics |
| Standard deviation | Standard deviation from annual multi-temporal statistics | |
| 10th percentile | 10th percentile value from annual multi-temporal statistics | |
| 25th percentile | 25th percentile value from annual multi-temporal statistics | |
| 75th percentile | 75th percentile value from annual multi-temporal statistics | |
| 90th percentile | 90the percentile value from annual multi-temporal statistics | |
| Diff 90th–10th percentile | Difference between 90th and 10thpercentile | |
| Diff 75th–25th percentile | Difference between 75 and 25 percentile |
| ID | Class name | Description |
|---|---|---|
| 1 | Evergreen needle-leaved forests (closed) | Forest with predominant evergreen needle-leaved tree species, covering at least 65% |
| and height exceeding 2 m | ||
| 2 | Evergreen needle-leaved shrub and woodland (open) | Evergreen needle-leaved forests covering 15%–40% and mixed with grassland and/or shrub entities. |
| 3 | Deciduous broadleaved forests (closed) | Forest with predominant broadleaved deciduous tree species, covering at least 65% |
| and height exceeding 2 m | ||
| 4 | Deciduous broadleaved shrub and woodland (open) | Deciduous broadleaved forests covering 15%–40% and mixed with grassland and/or shrub entities |
| 5 | Grassland | Herbaceous vegetation layer with less than 10% woodland and shrub coverage |
| 6 | Sparse vegetation | Sparse shrub and herbaceous vegetation entities covering 5%–15% |
| 7 | One season cropland | Agricultural areas with one harvest per year |
| 8 | Two season cropland | Agricultural areas with two harvests per year |
| 9 | Natural vegetation/agriculture mosaics | Predominant natural vegetation entities (grassland, shrub, woodland), accompanied with cropland |
| 10 | Agriculture/natural vegetation mosaics | Predominant cropland, accompanied with natural vegetation entities |
| 11 | Aquaculture | Water ponds used for aquaculture production, mainly for fish, crustaceans and turtles, |
| usually surrounded and intersected with grassland | ||
| 12 | Wetlands | Areas saturated with salt or fresh water with a permanent mosaic of water and herbs or woodland |
| 13 | Water bodies | Areas covered with either fresh or salt water |
| 14 | Tidal flats | Coastal wetlands exposed to tidal amplitude consisting of unconsolidated sediments |
| 15 | Snow and ice | Areas permanently covered by snow or ice |
| 16 | Deserts (sandy) | Barren area covered by sand dunes |
| 17 | Bare areas | Barren land with natural vegetation less than 5% |
| 18 | Artificial areas | Built up areas and associated areas |
| Classification | 1 | 0 | 0 | 0 | 0 | 0 | 0 | 0 | 0 | 0 | 0 | 0 | 0 | 0 | ||||||
| 2 | 0 | 0 | 0 | 0 | 0 | 0 | 0 | 0 | 0 | 0 | 0 | 0 | ||||||||
| 3 | 0 | 0 | 0 | 0 | 0 | 0 | 0 | 0 | 0 | 0 | 0 | 0 | ||||||||
| 4 | 0 | 0 | 0 | 0 | 0 | 0 | 0 | 0 | 0 | 0 | ||||||||||
| 5 | 0 | 0 | 0 | 0 | 0 | 0 | 0 | 0 | ||||||||||||
| 6 | 0 | 0 | 0 | 0 | 0 | 0 | 0 | 0 | 0 | 0 | 0 | |||||||||
| 7 | 0 | 0 | 0 | 0 | 0 | 0 | 0 | 0 | 0 | 0 | ||||||||||
| 9 | 0 | 0 | 0 | 0 | 0 | 0 | 0 | 0 | 0 | 0 | ||||||||||
| 10 | 0 | 0 | 0 | 0 | 0 | 0 | 0 | 0 | 0 | 0 | 0 | |||||||||
| 11 | 0 | 0 | 0 | 0 | 0 | 0 | 0 | 0 | 0 | 0 | 0 | 0 | 0 | 0 | ||||||
| 12 | 0 | 0 | 0 | 0 | 0 | 0 | 0 | 0 | 0 | 0 | 0 | 0 | ||||||||
| 13 | 0 | 0 | 0 | 0 | 0 | 0 | 0 | 0 | 0 | 0 | 0 | 0 | ||||||||
| 14 | 0 | 0 | 0 | 0 | 0 | 0 | 0 | 0 | 0 | 0 | 0 | 0 | 0 | |||||||
| 15 | 0 | 0 | 0 | 0 | 0 | 0 | 0 | 0 | 0 | 0 | 0 | 0 | 0 | 0 | 0 | |||||
| 16 | 0 | 0 | 0 | 0 | 0 | 0 | 0 | 0 | 0 | 0 | 0 | 0 | 0 | 0 | ||||||
| 17 | 0 | 0 | 0 | 0 | 0 | 0 | 0 | 0 | 0 | 0 | 0 | |||||||||
| 18 | 0 | 0 | 0 | 0 | 0 | 0 | 0 | 0 | 0 | |||||||||||
| PA (%) | ||||||||||||||||||||
| Reference | ||||||||||||||||||||
| 2013 | 1 | 2 | 3 | 4 | 5 | 6 | 7 | 9 | 10 | 11 | 12 | 13 | 14 | 15 | 16 | 17 | 18 | UA (%) | ||
| 1 | 0 | 0 | 0 | 0 | 0 | 0 | 0 | 0 | 0 | 0 | 0 | 0 | 0 | 0 | ||||||
| 2 | 0 | 0 | 0 | 0 | 0 | 0 | 0 | 0 | 0 | 0 | ||||||||||
| 3 | 0 | 0 | 0 | 0 | 0 | 0 | 0 | 0 | 0 | 0 | ||||||||||
| 4 | 0 | 0 | 0 | 0 | 0 | 0 | 0 | 0 | 0 | 0 | ||||||||||
| 5 | 0 | 0 | 0 | 0 | 0 | |||||||||||||||
| 6 | 0 | 0 | 0 | 0 | 0 | 0 | 0 | |||||||||||||
| 7 | 0 | 0 | 0 | 0 | 0 | 0 | 0 | |||||||||||||
| 9 | 0 | 0 | 0 | 0 | 0 | 0 | 0 | |||||||||||||
| 10 | 0 | 0 | 0 | 0 | 0 | 0 | 0 | 0 | 0 | 0 | 0 | |||||||||
| 11 | 0 | 0 | 0 | 0 | 0 | 0 | 0 | 0 | 0 | 0 | 0 | 0 | 0 | |||||||
| 12 | 0 | 0 | 0 | 0 | 0 | 0 | 0 | 0 | ||||||||||||
| 13 | 0 | 0 | 0 | 0 | 0 | 0 | 0 | 0 | 0 | 0 | 0 | 0 | 0 | 0 | 0 | |||||
| 14 | 0 | 0 | 0 | 0 | 0 | 0 | 0 | 0 | 0 | 0 | 0 | 0 | 0 | 0 | 0 | |||||
| 15 | 0 | 0 | 0 | 0 | 0 | 0 | 0 | 1 | 0 | 0 | 0 | 0 | 0 | 0 | ||||||
| 16 | 0 | 0 | 0 | 0 | 0 | 0 | 0 | 0 | 0 | 0 | 0 | 0 | 0 | 0 | ||||||
| 17 | 0 | 0 | 0 | 0 | 0 | 0 | 0 | 0 | ||||||||||||
| 18 | 0 | 0 | 0 | 0 | 0 | 0 | 0 | 0 | 0 | |||||||||||
| 2003 | 2013 | ||||
|---|---|---|---|---|---|
| Class ID | Area (km) | Area (%) | Area (km) | Area (%) | |
| 1 | 32,663 | 0.88 | 33,992 | 0.92 | |
| 2 | 30,425 | 0.82 | 25,828 | 0.70 | |
| 3 | 261,110 | 7.03 | 271.269 | 7.31 | |
| 4 | 127,876 | 3.44 | 135,607 | 3.65 | |
| 5 | 1,049,087 | 28.26 | 1,053,858 | 28.39 | |
| 6 | 759,812 | 20.47 | 723.970 | 19.50 | |
| 7 | 895,934 | 23.93 | 902,009 | 25.37 | |
| 8 | 63,480 | 1.69 | 15,582 | 0.42 | |
| 9 | 90,534 | 2.44 | 199,671 | 5.38 | |
| 10 | 153,710 | 4.14 | 46,135 | 1.24 | |
| 11 | 5123 | 0.14 | 7269 | 0,20 | |
| 12 | 8992 | 0.24 | 7752 | 0.21 | |
| 13 | 23,797 | 0.64 | 22,427 | 0.60 | |
| 14 | 2003 | 0.05 | 2782 | 0.07 | |
| 15 | 1319 | 0.04 | 1359 | 0.04 | |
| 16 | 100,075 | 2.70 | 92,849 | 2.50 | |
| 17 | 44,907 | 1.21 | 44,004 | 1.19 | |
| 18 | 63,676 | 1.72 | 87,332 | 2.35 | |
© 2016 by the authors; licensee MDPI, Basel, Switzerland. This article is an open access article distributed under the terms and conditions of the Creative Commons by Attribution (CC-BY) license (http://creativecommons.org/licenses/by/4.0/).
Share and Cite
Wohlfart, C.; Liu, G.; Huang, C.; Kuenzer, C. A River Basin over the Course of Time: Multi-Temporal Analyses of Land Surface Dynamics in the Yellow River Basin (China) Based on Medium Resolution Remote Sensing Data. Remote Sens. 2016, 8, 186. https://doi.org/10.3390/rs8030186
Wohlfart C, Liu G, Huang C, Kuenzer C. A River Basin over the Course of Time: Multi-Temporal Analyses of Land Surface Dynamics in the Yellow River Basin (China) Based on Medium Resolution Remote Sensing Data. Remote Sensing. 2016; 8(3):186. https://doi.org/10.3390/rs8030186
Chicago/Turabian StyleWohlfart, Christian, Gaohuan Liu, Chong Huang, and Claudia Kuenzer. 2016. "A River Basin over the Course of Time: Multi-Temporal Analyses of Land Surface Dynamics in the Yellow River Basin (China) Based on Medium Resolution Remote Sensing Data" Remote Sensing 8, no. 3: 186. https://doi.org/10.3390/rs8030186