1. Introduction
The goal of the Clouds and the Earth’s Radiant Energy System (CERES) project is to produce a long-term global record of Earth’s radiation budget at the top-of-atmosphere (TOA), within the atmosphere, and at the surface with consistent cloud and aerosol properties at climate accuracy [
1]. CERES consists of an integrated instrument-algorithm-validation science team that provides development of higher-level products (Levels 1–3) and investigations. It involves a high level of data fusion, merging inputs from 25 unique input data sources to produce 18 CERES data products. Over 90% of the CERES data product volume involves two or more instruments.
At the heart of the CERES project are the CERES instruments. Thus far, six CERES instruments have flown on four different spacecraft. The CERES Proto-Flight Model (PFM) instrument launched aboard NASA’s Tropical Rainfall Measuring Mission (TRMM) spacecraft on 27 November 1997, into a 350 km, 35-degree mid-inclined orbit. The CERES Flight Model (FM) 1 and 2 instruments were launched aboard NASA’s Earth Observing System (EOS) Terra Spacecraft on 18 December 1999, into a 705 km sun-synchronous orbit with a 10:30 a.m. equatorial crossing time. These instruments continue to operate nominally after over 16 years in orbit. CERES FM3 and FM4 aboard NASA’s EOS Aqua spacecraft were launched on 4 May 2002 in a 705-km sun-synchronous orbit with a 1:30 p.m. equatorial crossing time. CERES FM5 launched on the Suomi National Polar-orbiting Partnership (S-NPP) spacecraft on 28 October 2011, and FM6 will fly on the first Joint Polar Satellite System (JPSS-1) spacecraft in 2017. The orbit for both S-NPP and JPSS-1 is a 1:30 p.m. equatorial crossing time at an orbital altitude of 824 km. On each of the platforms, CERES flies alongside an imager that is used in CERES processing to provide detailed scene information within each CERES footprint. On TRMM, CERES flew with the Visible and Infrared Scanner (VIRS), on Terra and Aqua the imager is the Moderate-Resolution Imaging Spectroradiometer (MODIS), and on S-NPP the imager is the Visible Infrared Imaging Radiometer Suite (VIIRS).
The primary purpose of an instrument’s onboard calibration system is to enable detection and correction of changes in instrument sensitivity throughout the mission so that real changes in the climate system can unambiguously be detected. CERES instruments (and passive visible/infrared instruments in general) are more stable than they are absolutely accurate. Absolute accuracy is determined on the ground prior to launch while the onboard calibration equipment in conjunction with vicarious techniques is used to detect and correct for instrument drift. This paper focuses on how the CERES team corrects for on-orbit changes in instrument calibration. The CERES team is currently reprocessing the CERES record (Edition 4) using an improved suite of algorithms resulting from extensive validation of earlier versions. This paper focuses on the improvements to the CERES radiances used to produce higher-level data products. We summarize the methodology used to account for temporal variations in instrument calibration and demonstrate its performance using gridded and temporally averaged data. The main emphasis is on the characterization of instrument gain and spectral response function changes for CERES instruments on the Terra and Aqua platforms. Comparisons are also made with radiative fluxes from the Atmospheric Infrared Sounder (AIRS) and CERES FM5 on S-NPP.
3. Instrument Calibration
The two main quantities required to convert CERES detector output signals to radiances are the instrument gain coefficients and spectral response functions (SRFs). Both are initially determined prior to launch in a radiometric calibration facility [
3]. The gain coefficients convert CERES output voltages from digital counts to filtered radiances, which represent the radiation that gets filtered through the instrument optics. To correct for the imperfect spectral response of the instrument, filtered radiances are converted to unfiltered radiances, which correspond to radiation received by the instrument prior to entering the optics. The unfiltered radiances are converted to radiative fluxes in the CERES processing system using empirical angular distribution models [
4,
5]. The unfiltering process involves applying an algorithm that relates unfiltered and filtered radiances based upon knowledge of the instrument SRF and a radiance spectral database representative of Earth scenes [
6]. Shankar
et al. [
7] re-evaluated the ground calibration data collected prior to the CERES Terra and Aqua launches and derived new pre-launch SRFs for each CERES instrument.
Figure 1 provides CERES SRFs for the FM1 instrument. The SRFs are spectrally flat over most of the spectrum except between 0.3–0.4 μm, where there is a sharp decrease. The shape is characteristic of silver coated primary and secondary mirrors.
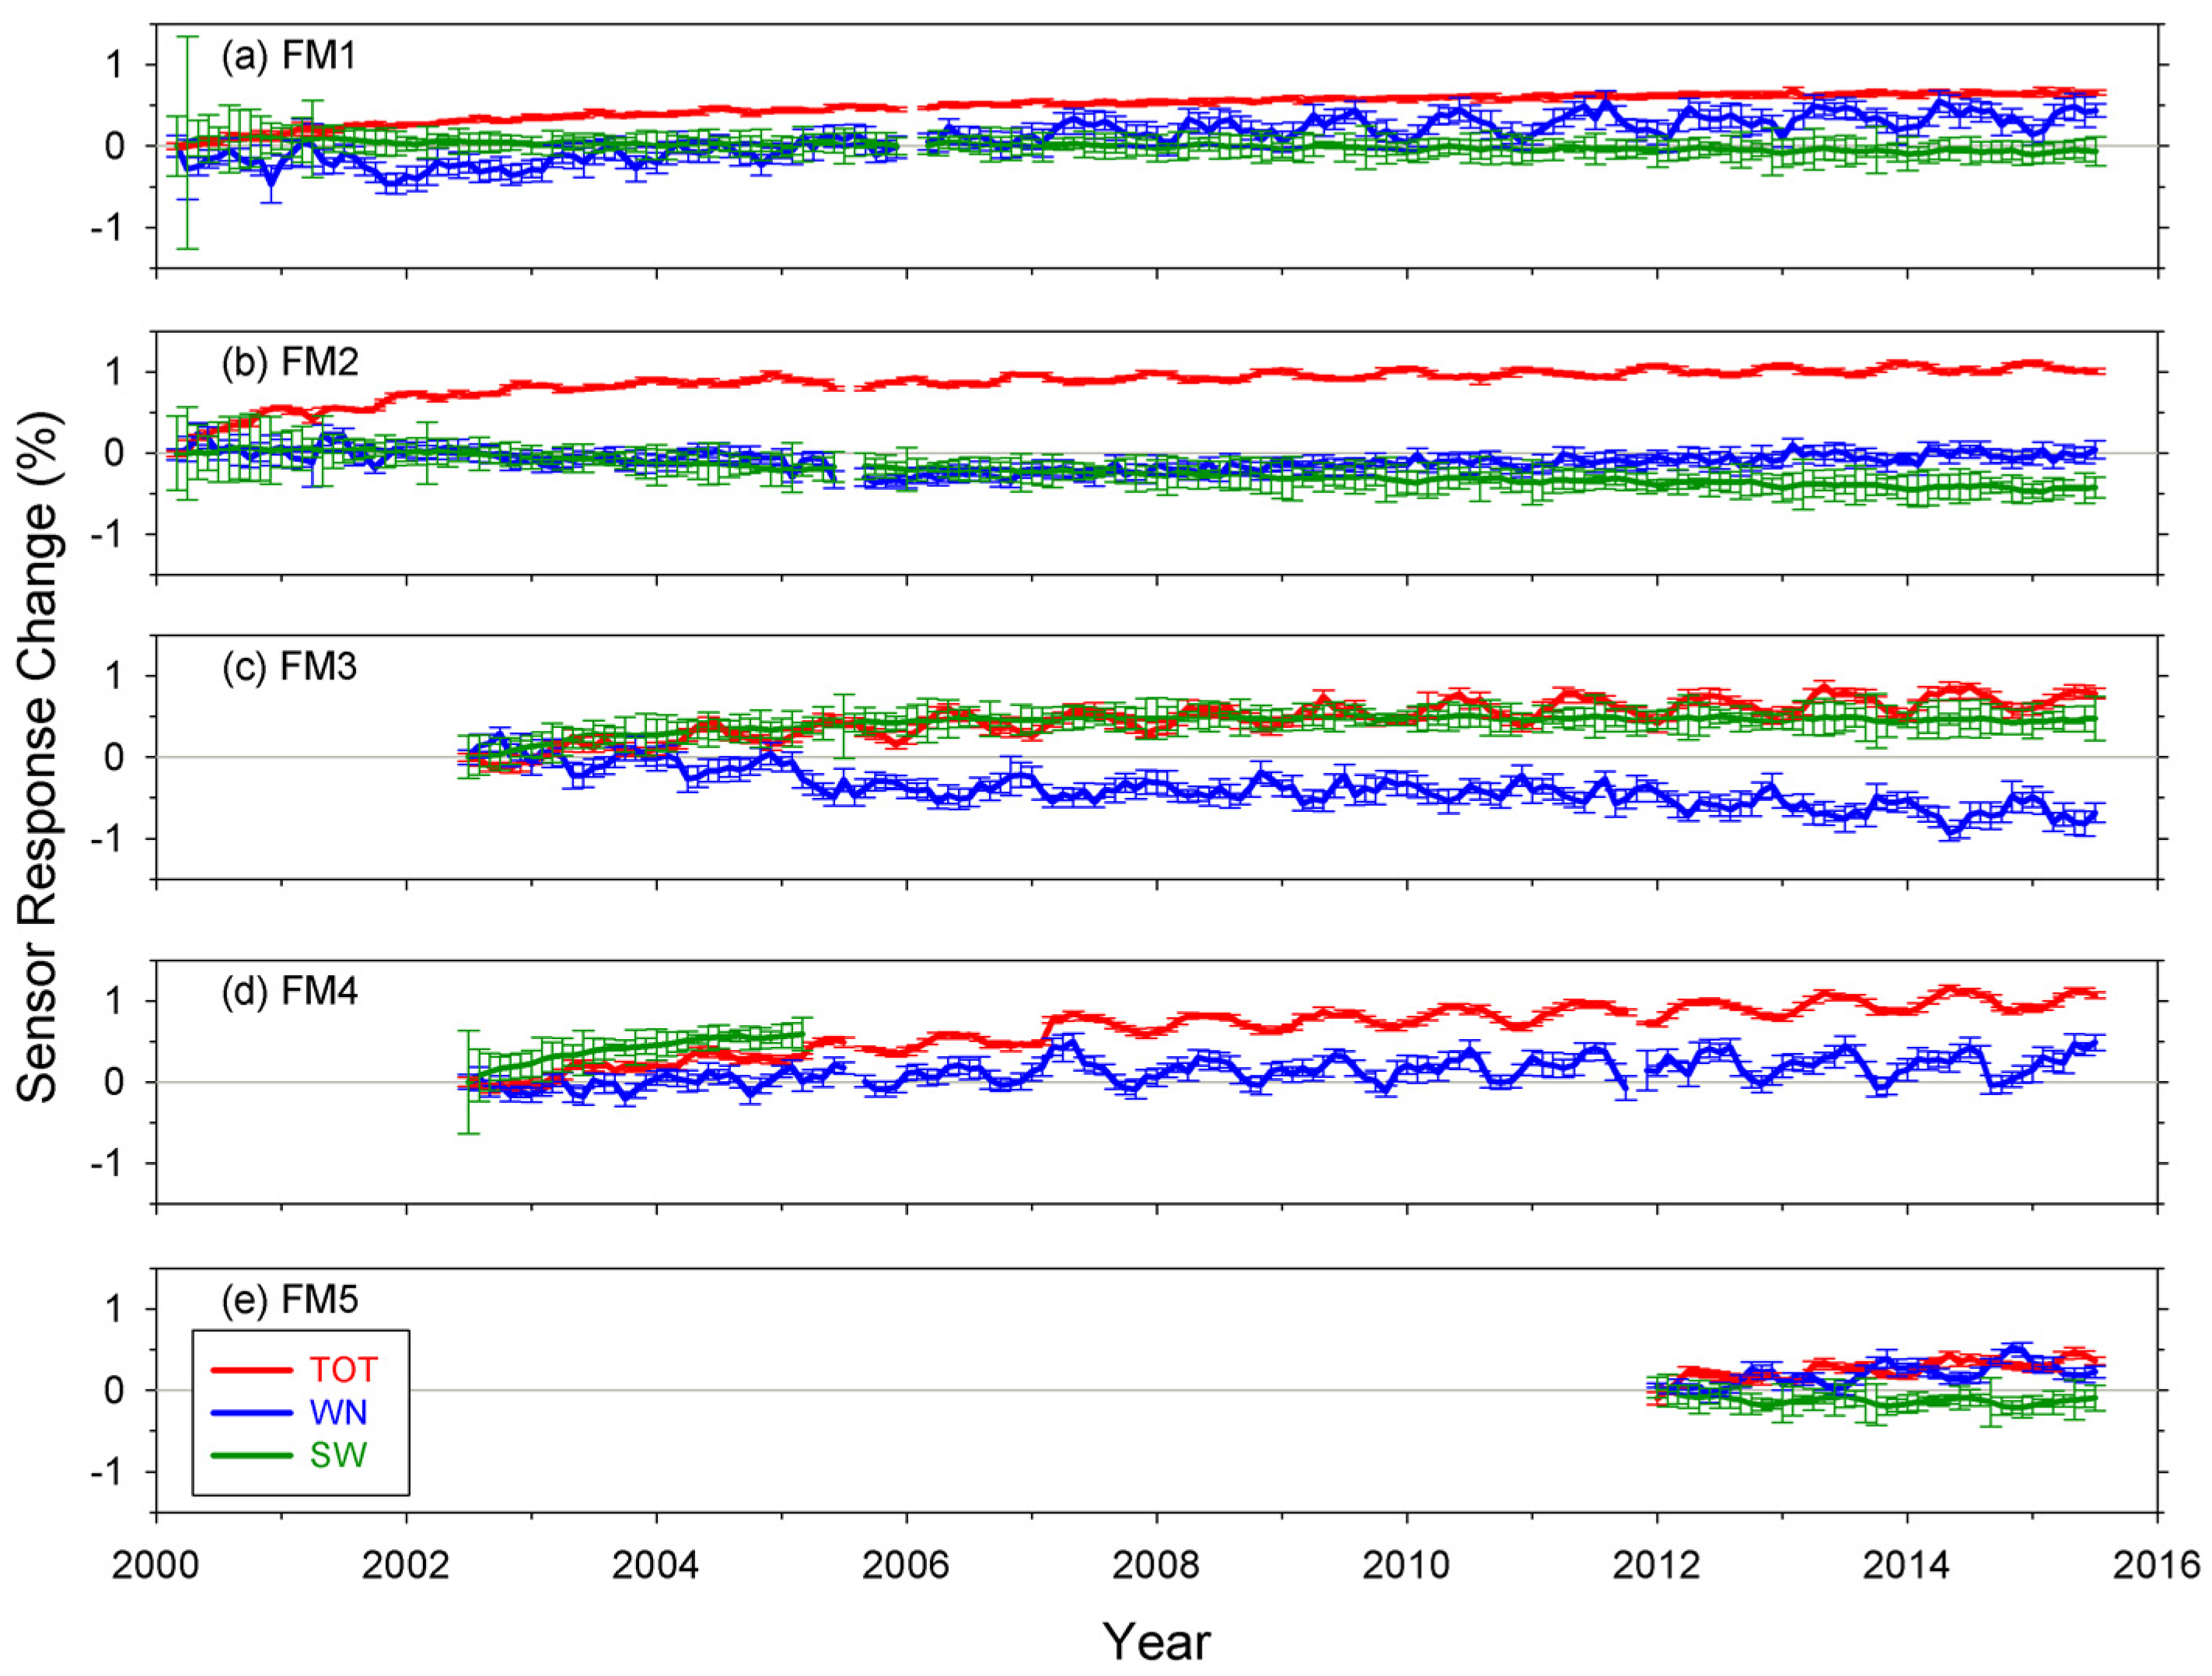
Table 1 provides a summary of the instrument calibration approaches used to produce the different CERES data product editions since the beginning of the CERES project. Apart from the Edition1_CV product, time varying gain coefficients from the instrument’s onboard calibration sources (
Section 3.1) have been applied in all editions. The main distinguishing feature between the various editions is how spectral changes have been accounted for. In Edition1_CV, SRFs were static and based upon prelaunch measurements. However, direct comparisons of nadir radiances from instruments on the same satellite showed that the RAP instrument was degrading relative to the crosstrack instrument [
8], and the magnitude of the degradation depended on scene type. To provide users a means of correcting for this prior to release of Edition 3, user applied revisions were produced for clear ocean and all-sky scenes [
8]. In Edition 3, temporal changes in the RAP instrument’s SW SRF were included in the processing, removing the need for user-applied revisions. Variations in the SW portion of the TOT SRF were also explicitly accounted for spectrally using an exponential degradation model. A constraint based upon regressions of day-night differences between LW and WN tropical all-sky ocean radiances was used to determine the magnitude of the degradation (Loeb
et al., 2012). As discussed in this paper, the approach used in Edition 4 is very similar to Edition 3. The main difference is the spectral degradation model used to account for SRF changes in the TOT channel (
Section 3.3).
3.1. In-Flight Calibration Changes
The primary in-flight calibration systems used to detect drifts in CERES sensor gains are the Internal Calibration Module (ICM) and the Mirror Attenuator Mosaic (MAM) [
9,
10,
11]. The ICM consists of two blackbody calibration sources for the total and window sensors and a Shortwave Internal Calibration Source (SWICS) for the shortwave sensor. The blackbodies operate at temperatures of 295 K, 305 K and 315 K, and are monitored by a platinum-resistance thermometer. The SWICS consists of an evacuated quartz tungsten lamp operating at three discrete current levels producing spectra equivalent to 2100 K, 1900 K and 1700 K brightness temperatures. The radiometers observe the ICM in every normal cross-track elevation scan. Monthly gains are determined from ICM calibrations performed weekly, and a five-month running mean is used to reduce noise. The MAM is a solar diffuser plate used for calibrating the shortwave sensor and the total sensor. It consists of a baffle to block stray light and a nickel substrate with aluminum coated spherical divots that attenuate and redirect the solar radiation into the field of view of the sensors. For CERES instruments on Terra and Aqua, the MAM coatings degraded in orbit and therefore are not used here [
11]. In contrast, solar calibration results for CERES FM5 do not show any discernable trends during the first 42 months of the mission. They vary between 0.3% for the SW sensor and 0.4% for the TOT sensor, well within the MAM stability requirement. The CERES FM5 MAM underwent pre-launch conditioning to stabilize it through accelerated direct solar exposure. In addition, the CERES FM5 MAM has avoided the ram direction as a precaution. The MAM results for the SW sensor show the same trend as the ICM SWICS calibration, providing additional confidence in the SW sensor performance. The solar calibration result for the TOT sensor is used to monitor the performance of the SW portion of the TOT sensor.
Normalized instrument gains for the SW, TOT and WN channels on CERES FM1-FM5 are provided in
Figure 2a–e. The total channel response to LW radiation has gradually increased with time for all five instruments. The increases relative to the beginning-of-mission are 0.6% for FM1, 0.7% for FM2, 0.7% for FM3, 1% for FM4, and 0.4% for FM5. The SW channel response changed only slightly for FM1 (<0.1%), while for FM2 the change is approximately −0.4%, and for FM3 it is 0.4%. There was an increase of about 0.6% for the FM4 SW sensor through April 2005, when it failed prematurely. The FM5 SW channel response decreased by 0.2%. The window sensor gains show an increasing trend for four of the instruments except FM3, which shows a decrease with time.
3.2. SW Channel Spectral Response Function Changes
In-orbit changes in SRFs involve a loss of measurement sensitivity with time due mainly to instrument UV exposure and molecular contamination, particularly in the blue end of the solar spectrum [
12]. As there are no onboard calibration sources that cover the entire spectral range observed by CERES, it is necessary to use vicarious methods. Early analyses of the CERES SW data revealed significant decreases in albedo that were more pronounced for clear ocean scenes than for cloudy scenes. In addition, direct comparison of coincident CERES nadir radiances from CERES instrument pairs on both platforms depended strongly upon the instrument scan mode, with more degradation occurring when the instruments were operated in RAP mode [
8]. This degradation is likely due to the instrument scan plane being aligned with the spacecraft direction of motion during part of the RAP scan cycle, which makes the sensor more susceptible to increased UV exposure and molecular contamination.
Following [
13], the loss of transmission with wavelength, or spectral degradation, in the CERES SW channel is represented by:
where α is coefficient of the fit to the data. We derive α for each month of the Terra and Aqua missions assuming spectral darkening in the SW only occurs for the instrument in RAP mode. During RAP mode, the instrument scans in the ram direction of travel and is therefore more susceptible to molecular contamination [
14]. The RAP instrument’s α in a given month is selected from a set of candidate values, after accounting for time varying gain coefficient changes in filtered radiances. The α’s are selected to ensure the ratio of coincident unfiltered nadir radiances (FM2/FM1 or FM3/FM4) for clear ocean scenes between 35°S and 35°N remains constant for all months. We choose the best α value each month from amongst the candidate values, which are pre-selected to provide a wide range of possible solutions. Clear ocean scenes are identified using the CERES cloud mask applied to MODIS radiances. Because modifying α changes the shape of the SRF such that there is greater degradation in the blue end of the spectrum, the current approach implicitly makes larger corrections for scenes with more energy at shorter wavelengths (e.g., clear ocean), thereby eliminating the need for separate scene-type dependent correction factors.
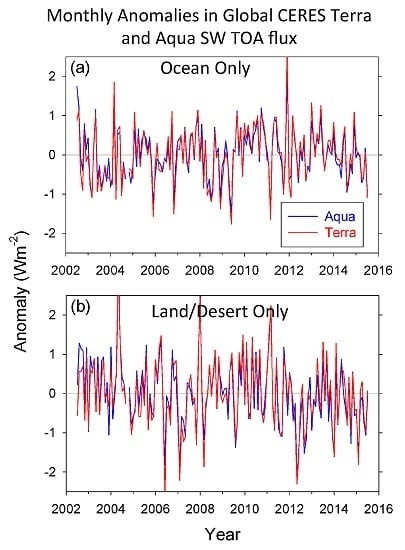
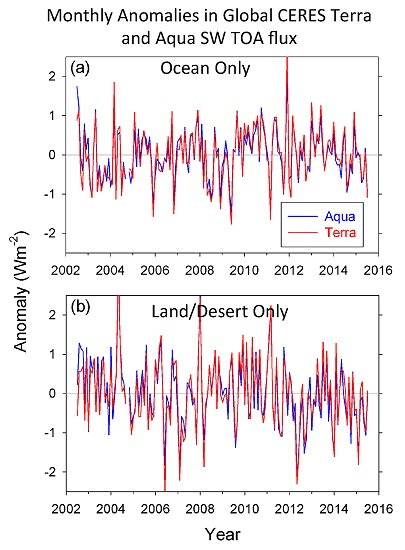
Given that the calibration approach is applied independently to instruments on Terra and Aqua, a useful test is to directly compare their respective time series. We compare global SW TOA flux anomalies separately for ocean and land/desert in
Figure 3a,b and
Table 2. The instantaneous fluxes have been placed on a 1° equal-area grid and converted to diurnally averaged 24-h values following the approach in [
15], whereby an instantaneous TOA flux observation is scaled by the ratio of a 24-h average TOA flux derived from an empirical diurnal albedo model corresponding to the observed scene to the corresponding diurnal albedo model flux at the observation time (see Equation (3) in [
15]). Monthly variations in CERES Terra and Aqua TOA flux anomalies are highly correlated (correlation coefficient of 0.96), and the standard deviation in the difference in monthly anomalies is only 0.2 Wm
−2 for ocean and 0.3 Wm
−2 for land/desert (
Figure 3a,b). Additionally, trends in anomalies are consistent to 0.21 Wm
−2 per decade for ocean, and 0.31 Wm
−2 per decade for land/desert (
Table 2). Furthermore, differences between Editions 3 and 4 trends are quite small (<0.1 Wm
−2 per decade). Loeb
et al. [
13,
16] found similar agreement when they compared the stability of observations from CERES and the Sea-Viewing Wide-Field-of-View Sensor (SeaWiFS; [
17] (2009 reprocessing). They compared deseasonalized anomalies in CERES Terra SW TOA flux over tropical oceans with anomalies in Photosynthetically Active Radiation (PAR) after scaling the latter by a constant factor given by the regression slope of CERES SW flux and PAR anomalies. Those results showed a consistency of 0.3 Wm
−2 per decade at the 95% confidence level.
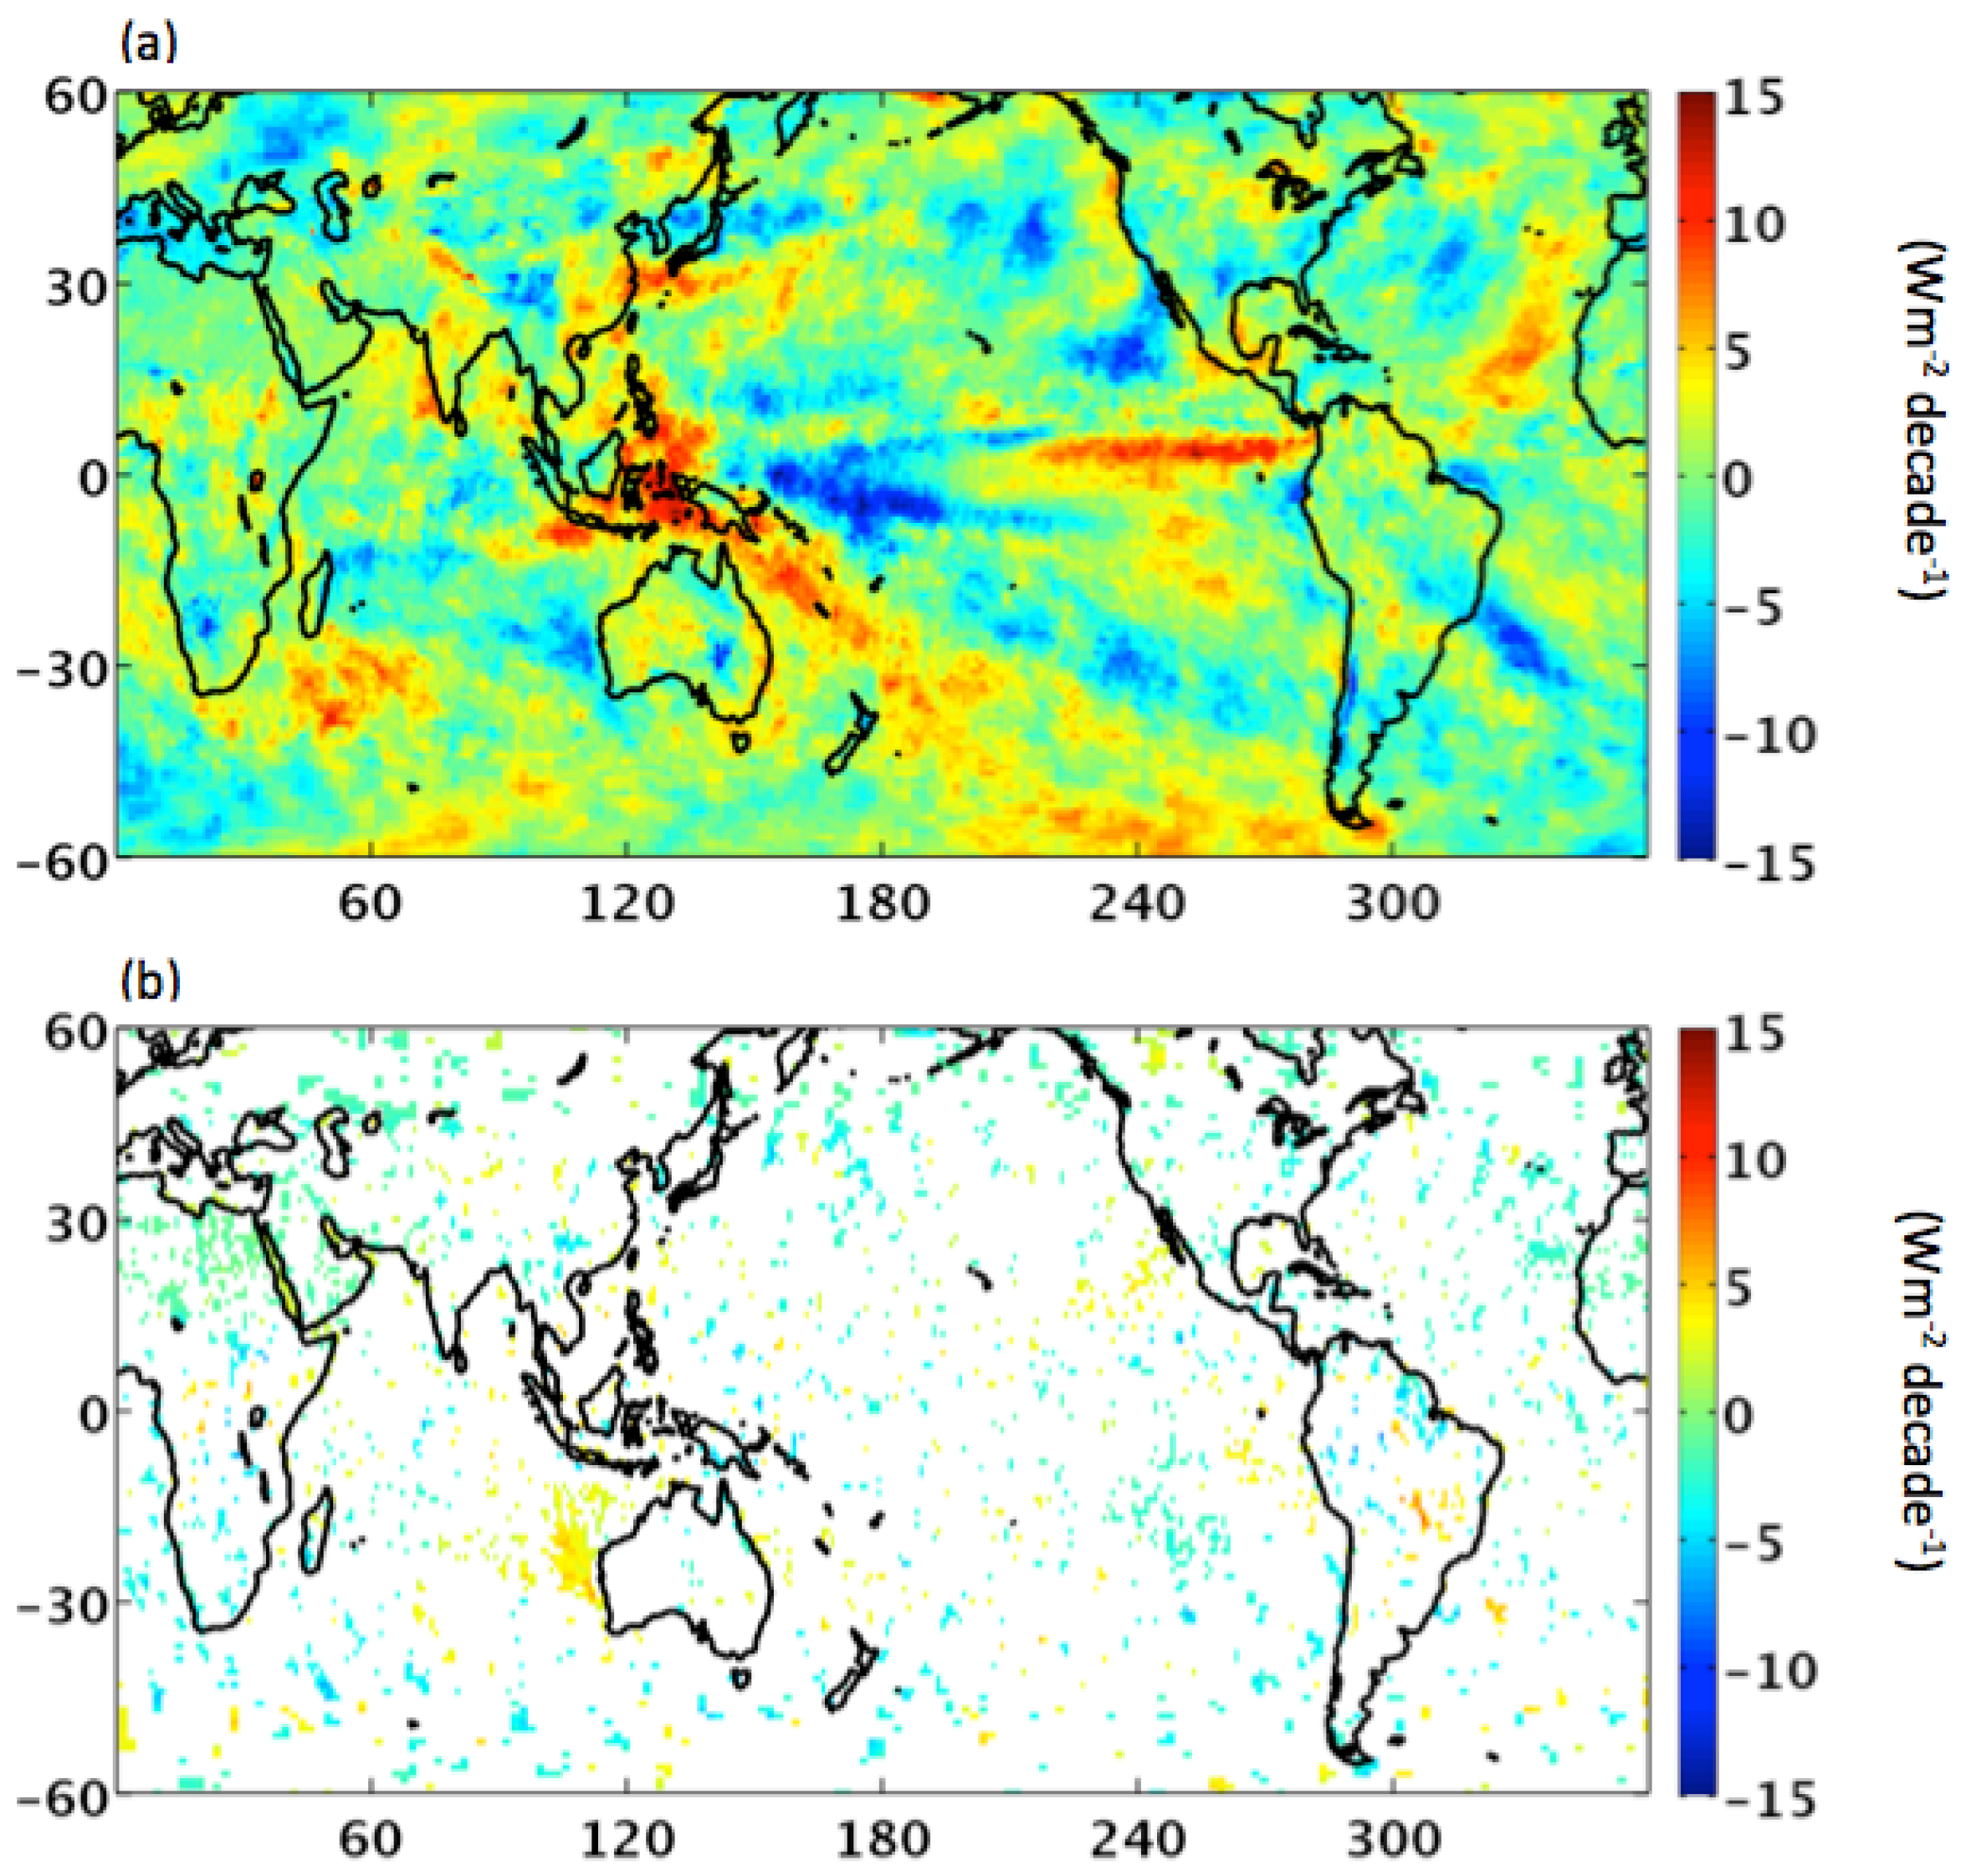
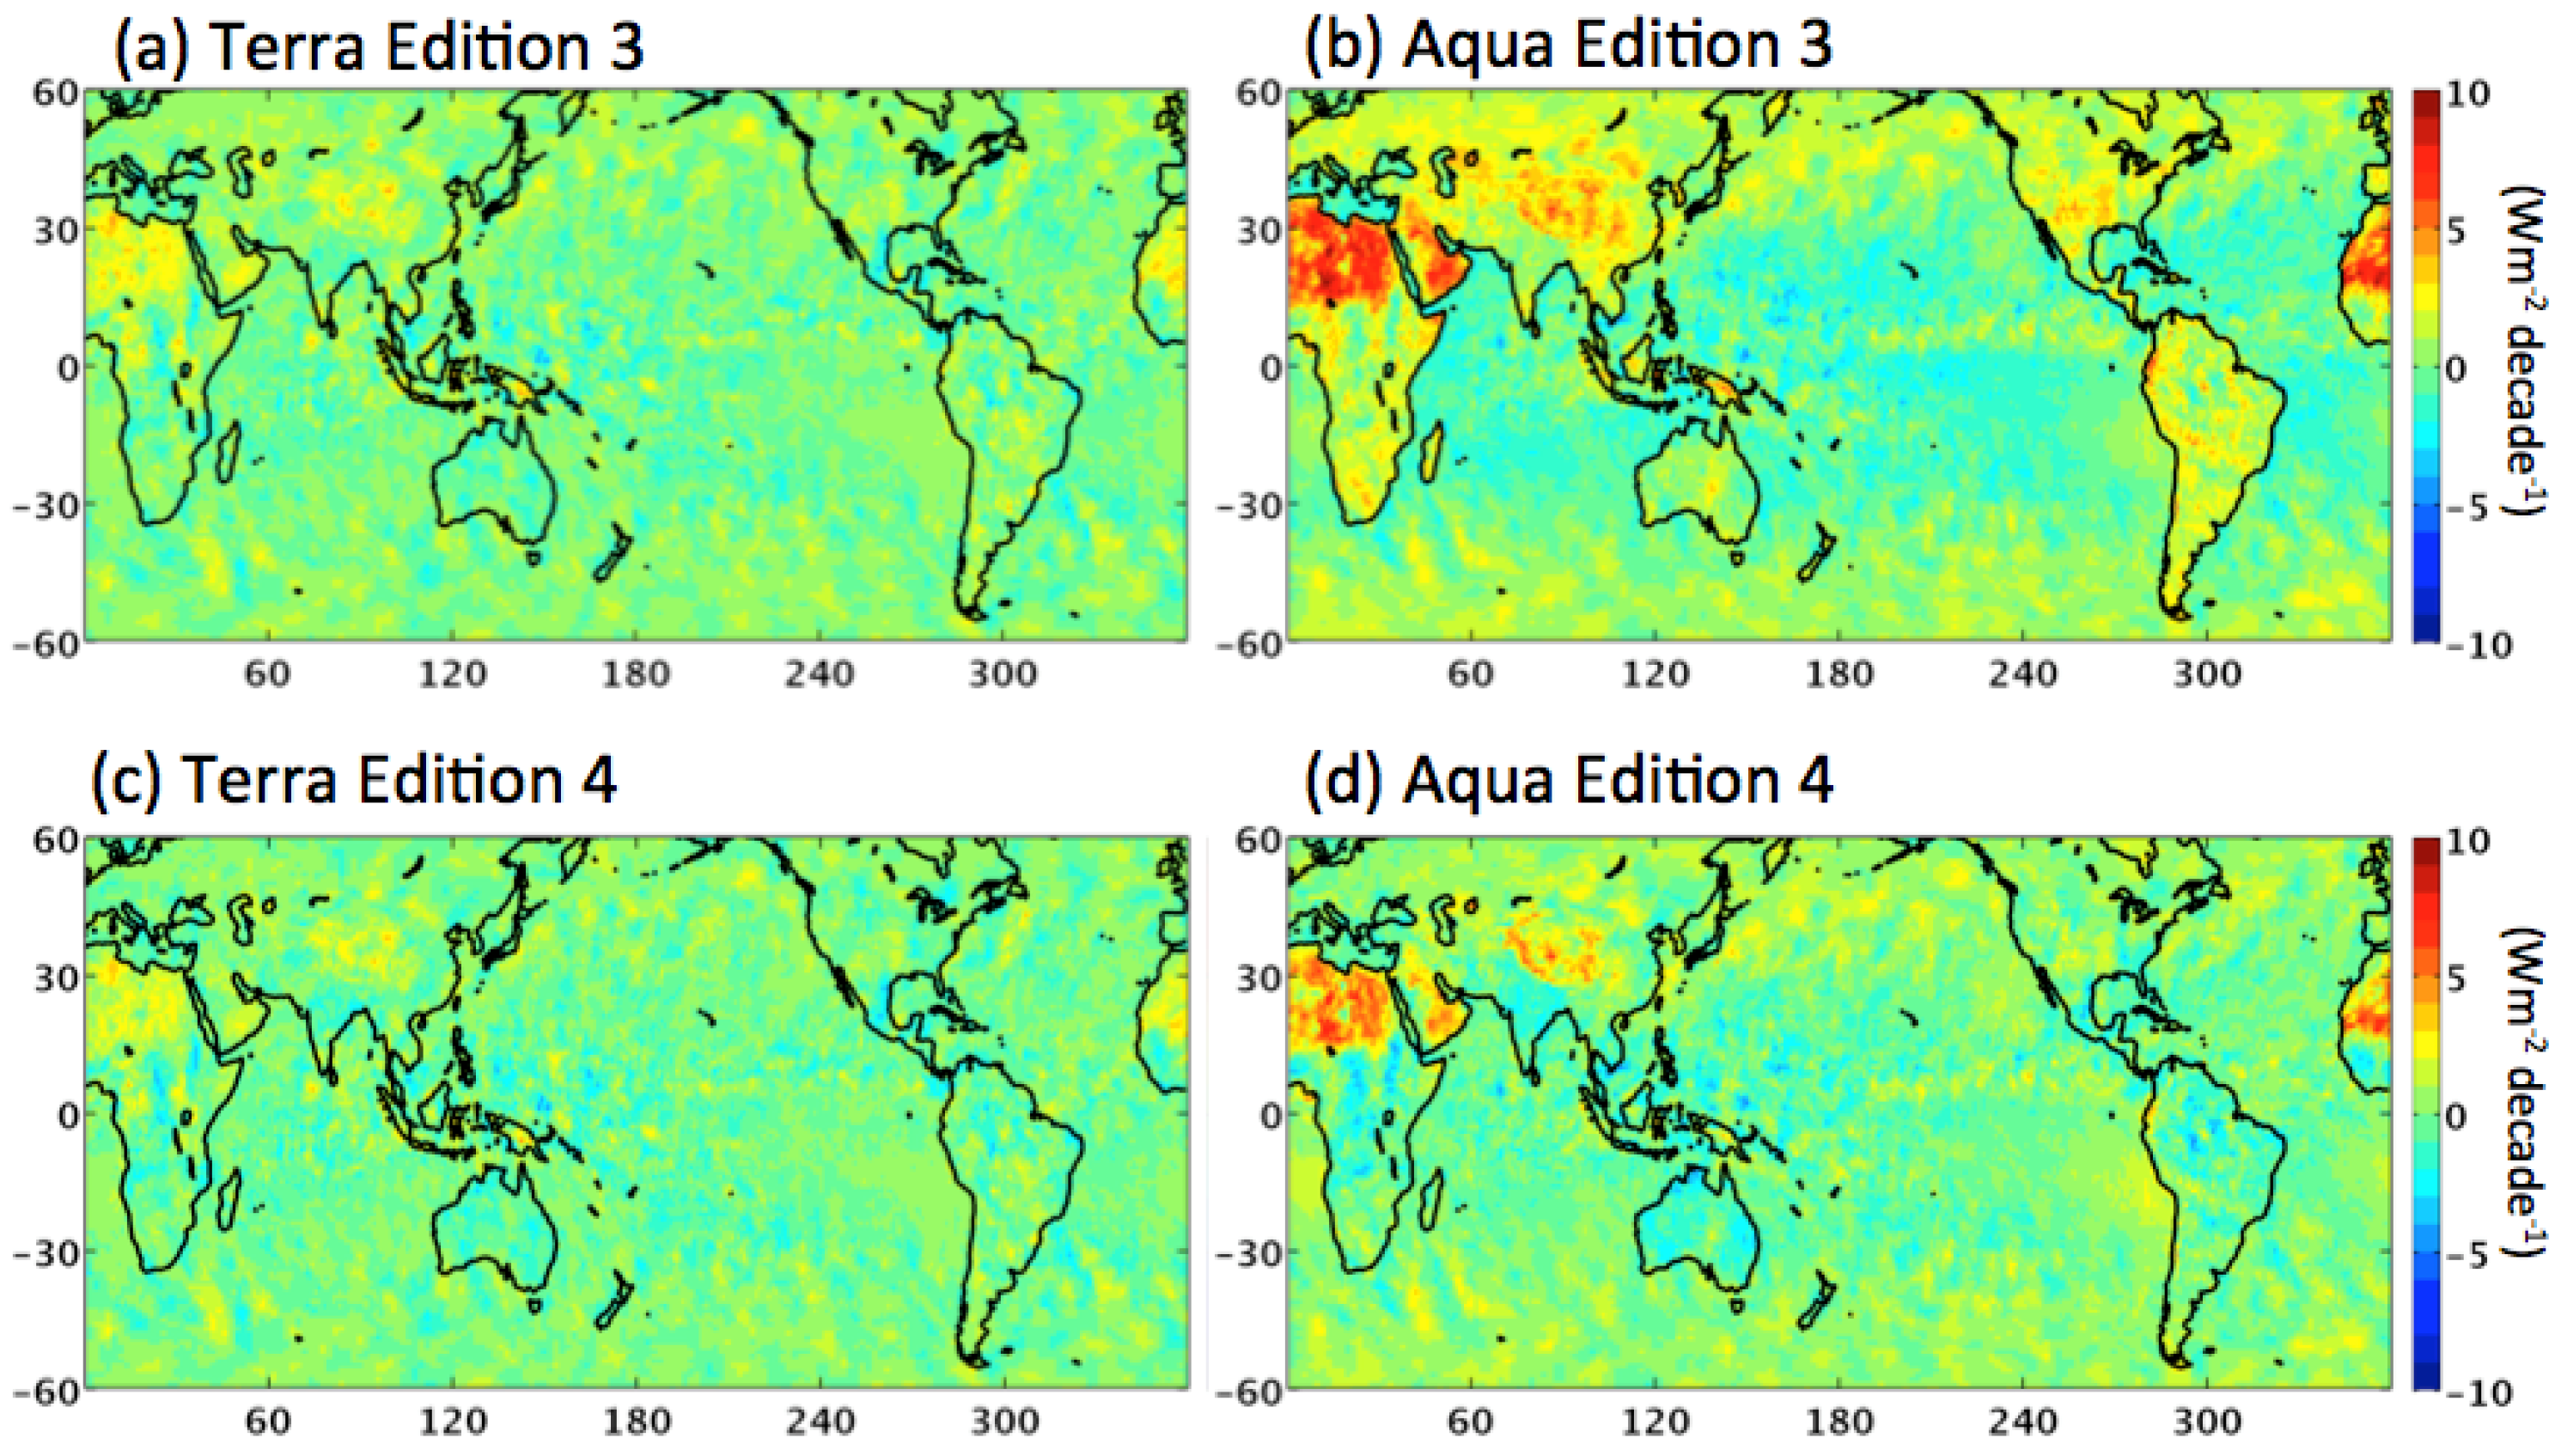
The regional distribution of trends in monthly CERES Terra SW TOA flux anomalies is provided in
Figure 4a for July 2002–July 2015. The trend pattern is characterized by a marked westward shift in the South Pacific Convergence Zone to the east of Australia associated with prolonged moderate-to-strong La Niña conditions in the latter part of the CERES record. There is also a marked decrease in SW flux off the west coasts of California and Australia, where shallow clouds dominate. The colored areas in
Figure 4b denote trends in Aqua minus Terra SW flux anomalies exceeding the 95% significance level. While trends in the difference fall below this level in most regions (denoted in white), significant negative differences are observed over the Saharan and Saudi Arabian deserts, and positive differences occur off the west coast of Australia. The reason for these differences is not known. Elsewhere, regions of significant trends in the CERES Aqua minus Terra difference are distributed more randomly.
3.3. Total Channel Spectral Response Function Changes
Unfiltered emitted thermal LW radiances are determined directly from filtered TOT channel measurements at night, while both the TOT and SW filtered radiance measurements are used during daytime [
6]. A drift in either the SW or LW portions of the TOT channel or in the SW channel can result in a drift in daytime unfiltered LW radiance. Loeb
et al. [
13] find evidence for a drift in the SW portion of the TOT channel for Terra and Aqua. They show that tropical monthly mean ocean day–night LW flux differences systematically decrease by 2 Wm
−2 during the first six years of the CERES Terra record when the TOT SRF is held constant, after accounting for time-dependent changes in gain coefficients and SW SRF corrections. In contrast, tropical monthly mean ocean day–night WN radiative flux differences remain constant. To compensate for the day–night drift in CERES LW unfiltered radiance, [
13] adjust the SW portion of the TOT channel SRF to remove the drift from mission start in the day–night LW difference relative to the day–night WN difference. The adjustments to the SW portion of the TOT channel are derived each month following the same approach as for the SW channel based upon Equation (1). This approach is used to produce the Edition 3 CERES data products.
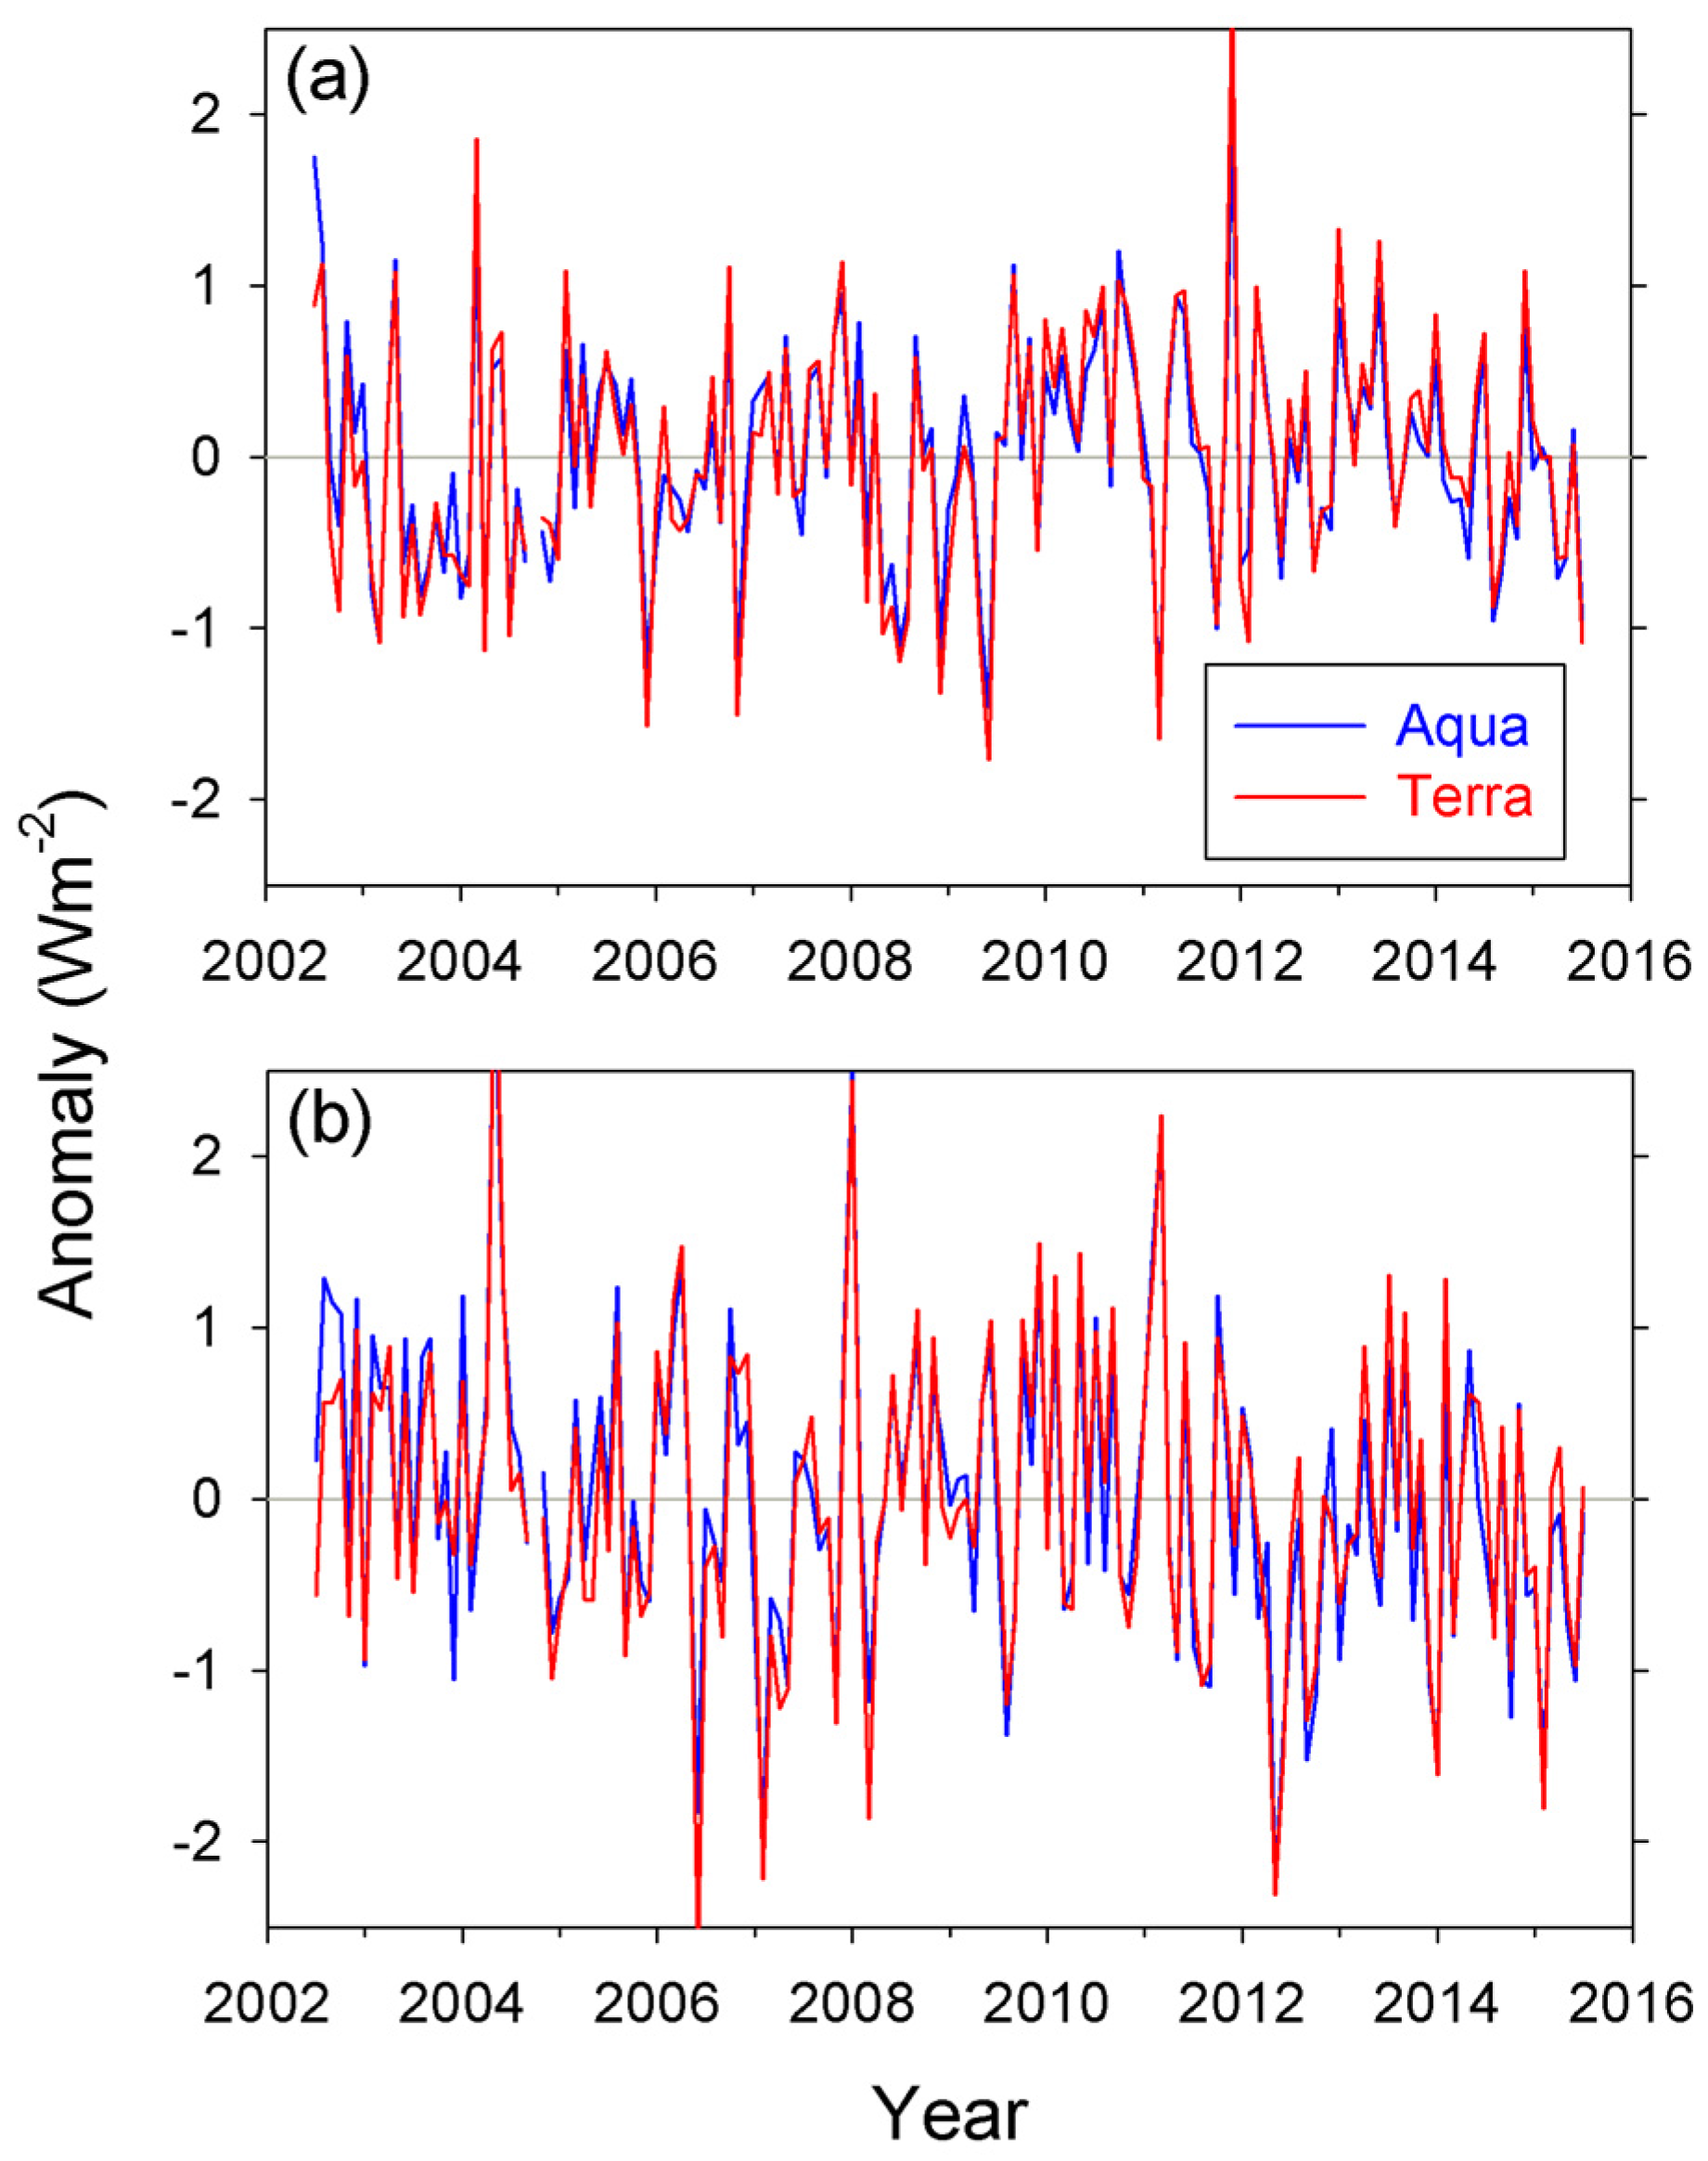
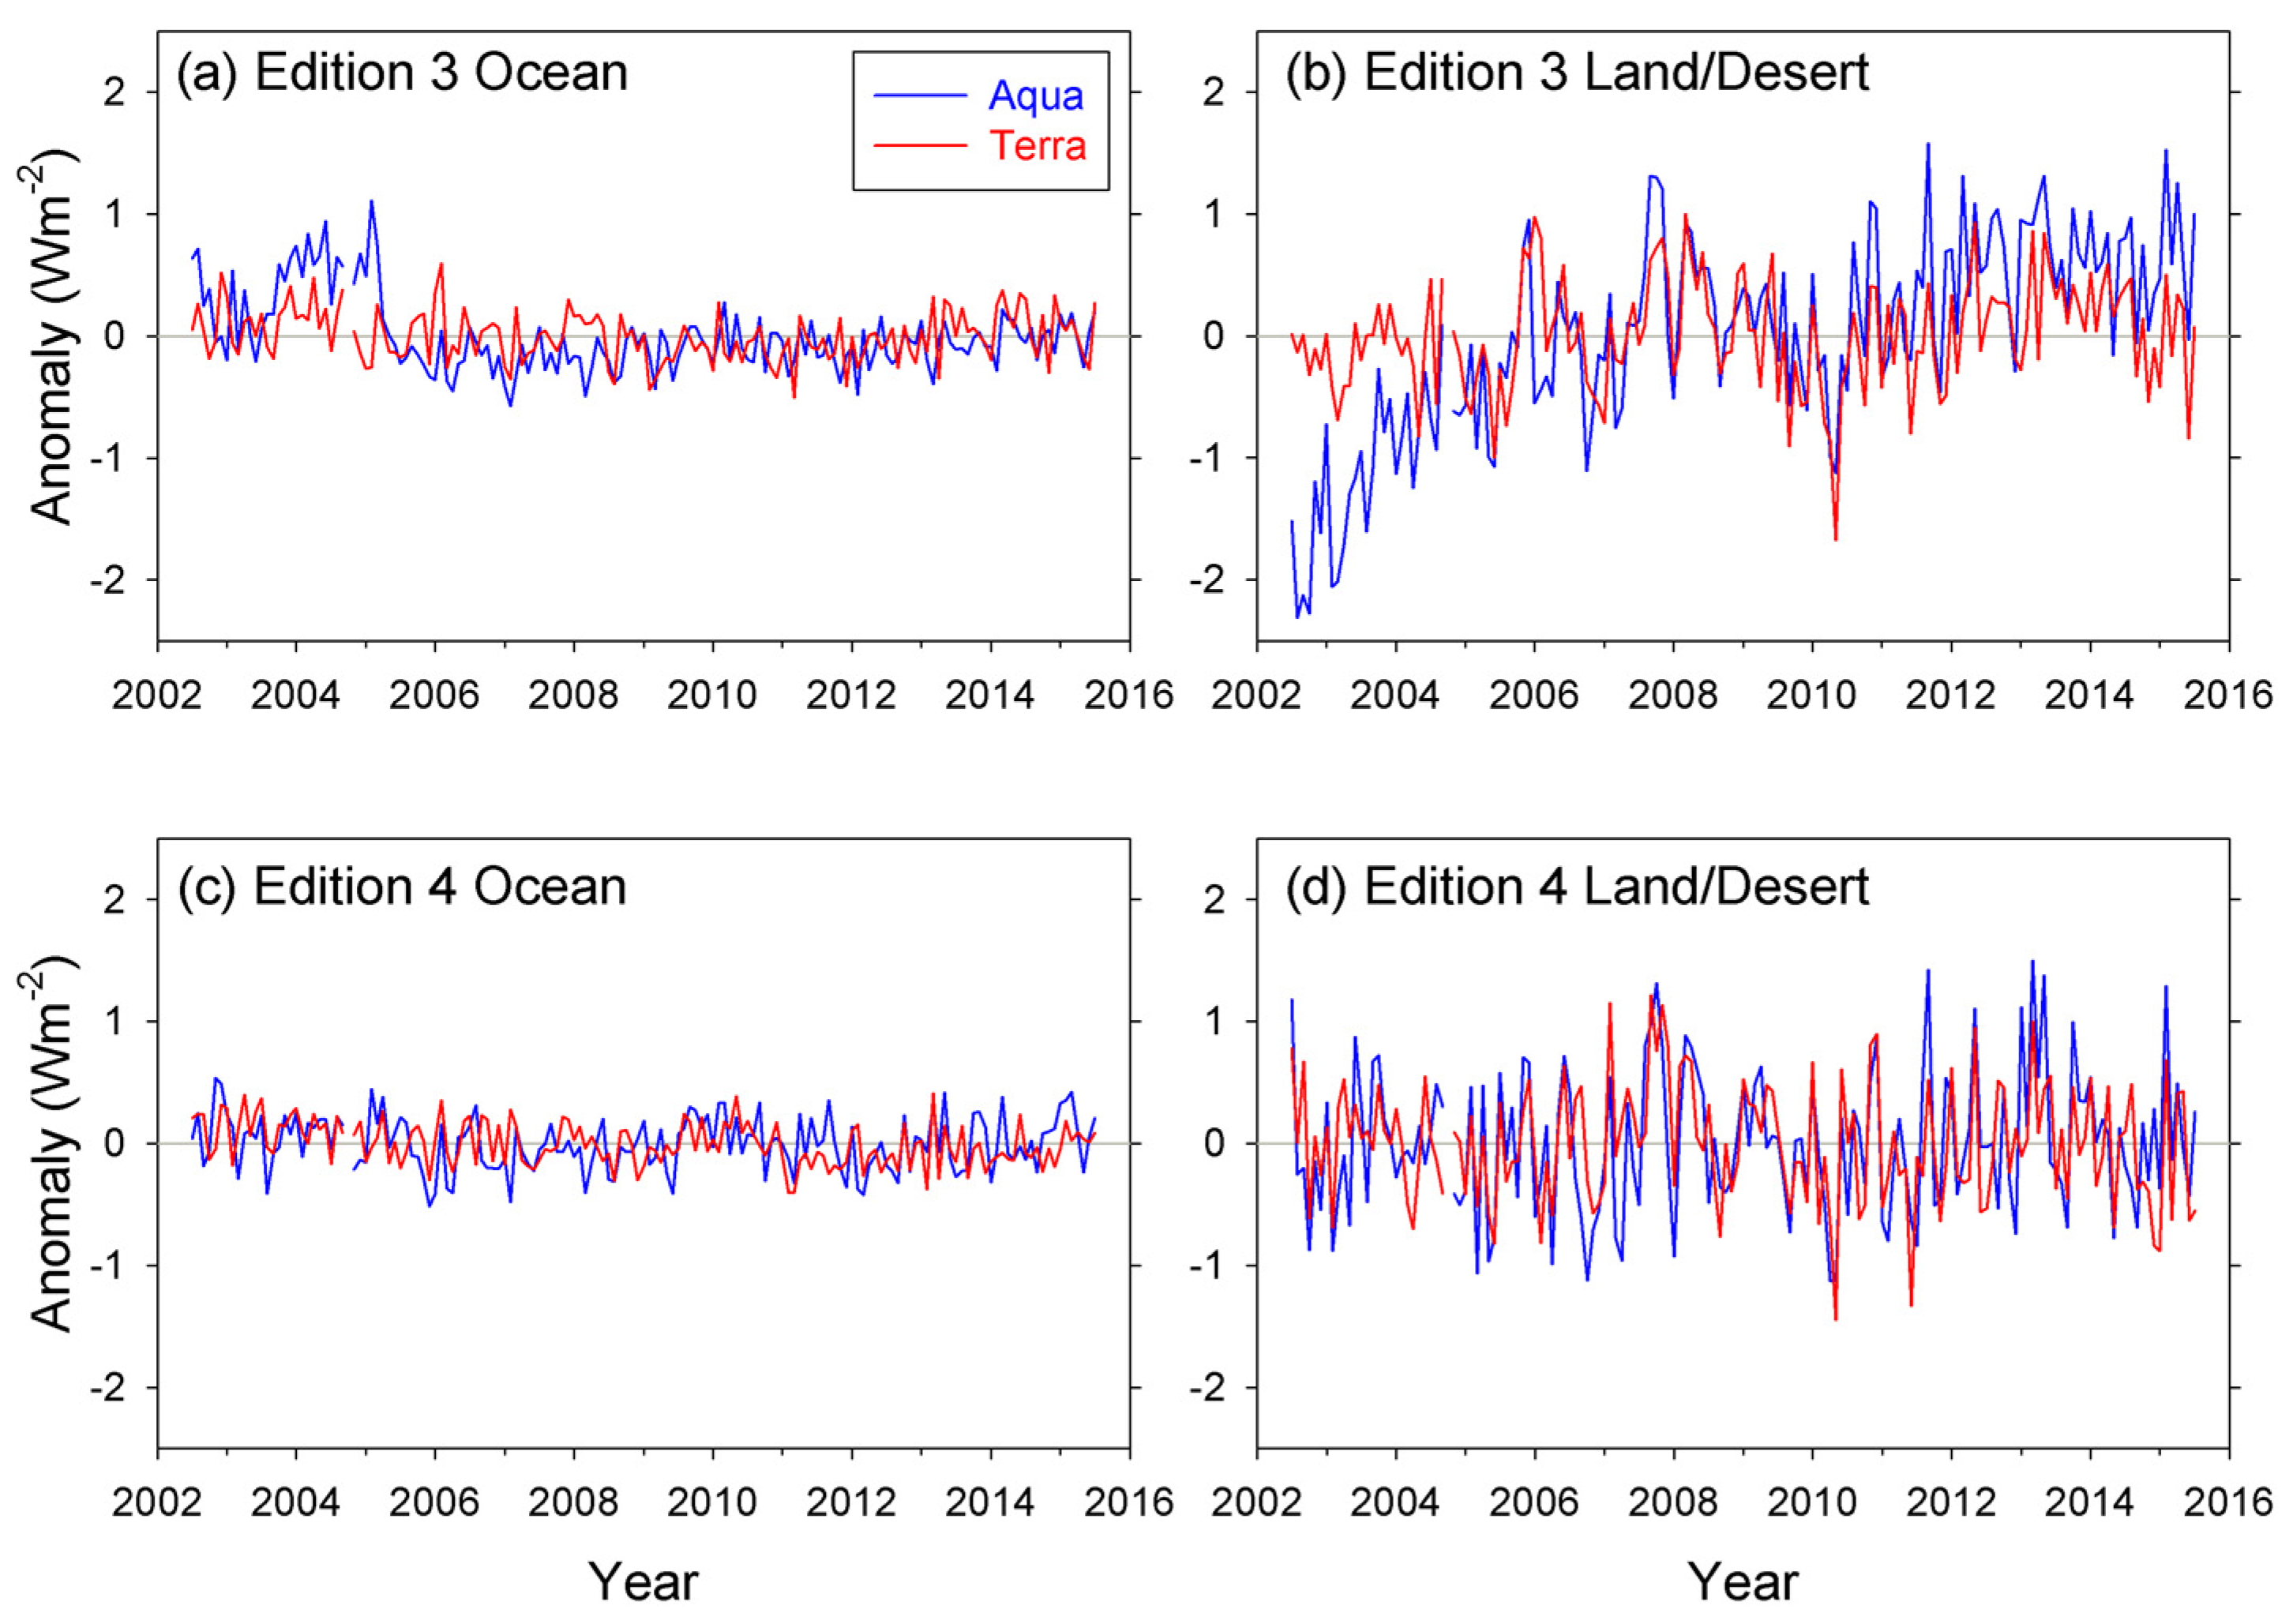
While the Edition 3 approach outlined in Reference [
13] produced stable day–night LW anomaly differences over ocean (
Figure 5a;
Table 3), the Aqua Edition 3 results over land/desert still show a drift of 1.5 Wm
−2 per decade (
Figure 5b). In order to generalize the SRF spectral degradation shape for the SW portion of the total channel, we use the following form in Edition 4:
where α and β are fit to the data. Equation (2) enables greater flexibility for SRF changes in the mid-visible wavelength range without excessive SRF changes at wavelengths shorter than 0.5 μm. The correction for a given month is determined from a database of SRFs generated for approximately 3700 combinations of α and β values. Linear regression coefficients are computed for tropical daytime-nighttime LW
versus daytime-nighttime WN radiance differences for all-sky ocean and all-sky land/desert scene types for each candidate in the database. For the first month of the mission, the beginning of mission SRF is used to compute these regressions. Among the various SRF candidates, the one that yields the smallest variation in regression fits compared to the first month of the mission is selected as the total channel SRF for the month.
Figure 5c,d and
Table 3 show anomalies in day–night LW difference after this approach is applied. The results are generally much more stable compared to Edition 3, particularly for the Aqua land/desert case.
Regional trends in daytime-nighttime LW minus daytime-nighttime WN radiance difference for Terra and Aqua are shown in
Figure 6a–d, for Editions 3 and 4. Under the assumption that any diurnal change in the LW is captured by WN daytime-nighttime changes, the trends should be near zero everywhere. While the Terra LW and WN daytime-nighttime trends are generally close for both Editions 3 and 4 (
Figure 6a,b), there are marked differences for Aqua (
Figure 6c,d). The Aqua Edition 4 results show smaller overall differences compared to Edition 3, particularly over land. However, both show large positive differences over the Saharan and Saudi Arabian deserts, as well as over the Tibet region. Spatial patterns for Terra (
Figure 6b) in these regions resemble those for Aqua (
Figure 6d), but are less pronounced. Further, these regions also show significant differences in Aqua minus Terra SW flux anomaly trends, as was noted earlier (
Figure 4b). Thus, we suspect the larger regional trends in daytime-nighttime LW minus daytime-nighttime WN radiances is due to SW unfiltering rather than TOT channel unfiltering. However, further study is needed.
3.4. Comparison with AIRS
Recent studies have demonstrated the utility of comparing the stability of LW observations from the AIRS and CERES [
13,
18,
19]. Huang
et al. [
18] compared daytime and nighttime CERES FM3 LW radiances with coincident spectral radiances observed by AIRS. Loeb
et al. [
13] and Susskind
et al. [
19] compared the AIRS Version-5 monthly Outgoing Longwave Radiation (OLR) data product with CERES Terra and Aqua LW TOA fluxes. Here we compare AIRS Version-6 monthly OLR and CERES Edition 4 Terra and Aqua LW fluxes for 30°S–30°N between January 2003 and December 2014 (
Figure 7). All three data products show a consistent decrease in LW TOA flux (
Figure 7a). The trends (
Table 4), which are mainly associated with ENSO variability, agree to 0.16 Wm
−2 per decade. All three datasets also show a slight decline of 0.2–0.3 Wm
−2 per decade in the daytime minus nighttime LW flux difference that is statistically significant at the 95% significance level (
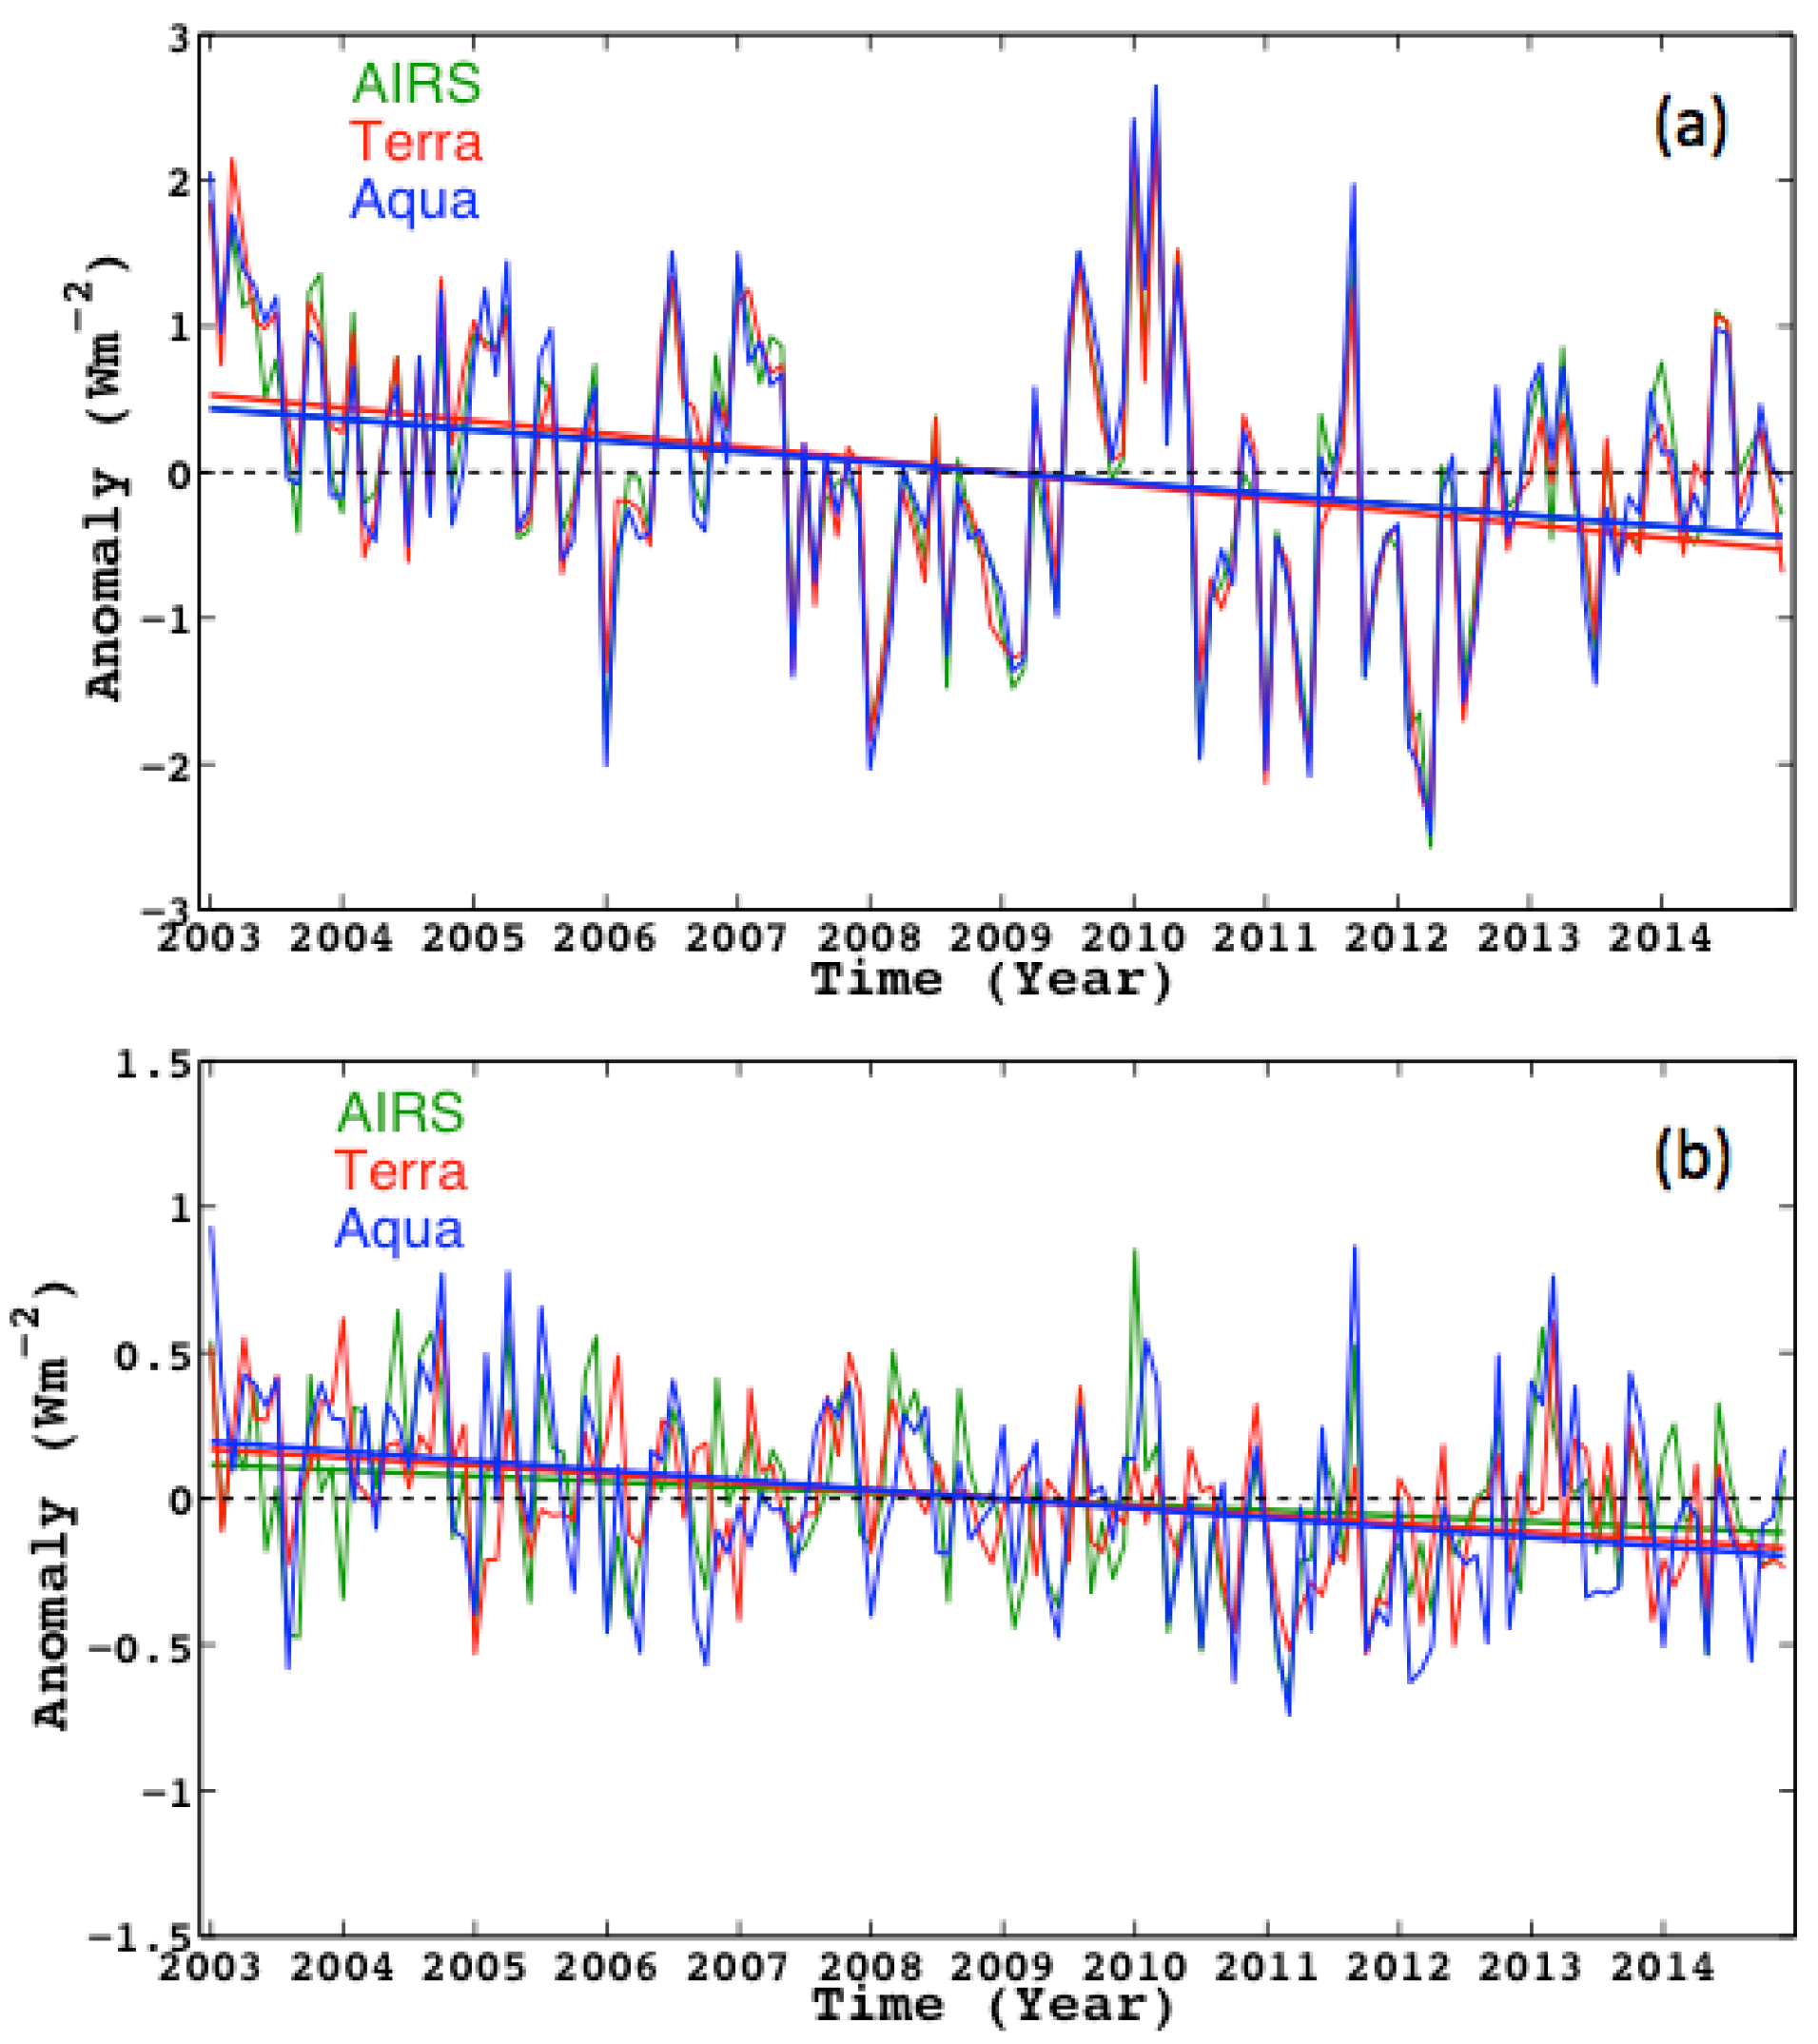
Figure 7b;
Table 4). Regionally, the most pronounced decreases in daytime-nighttime LW TOA flux difference occur over the west and central Pacific Ocean and over the Indian Ocean east of Madagascar (not shown). That all three instruments detect such a small signal so consistently is noteworthy. The results suggest that there is a small diurnal component to the LW TOA flux response to ENSO variations.
3.5. Comparisons with CERES FM5 on S-NPP
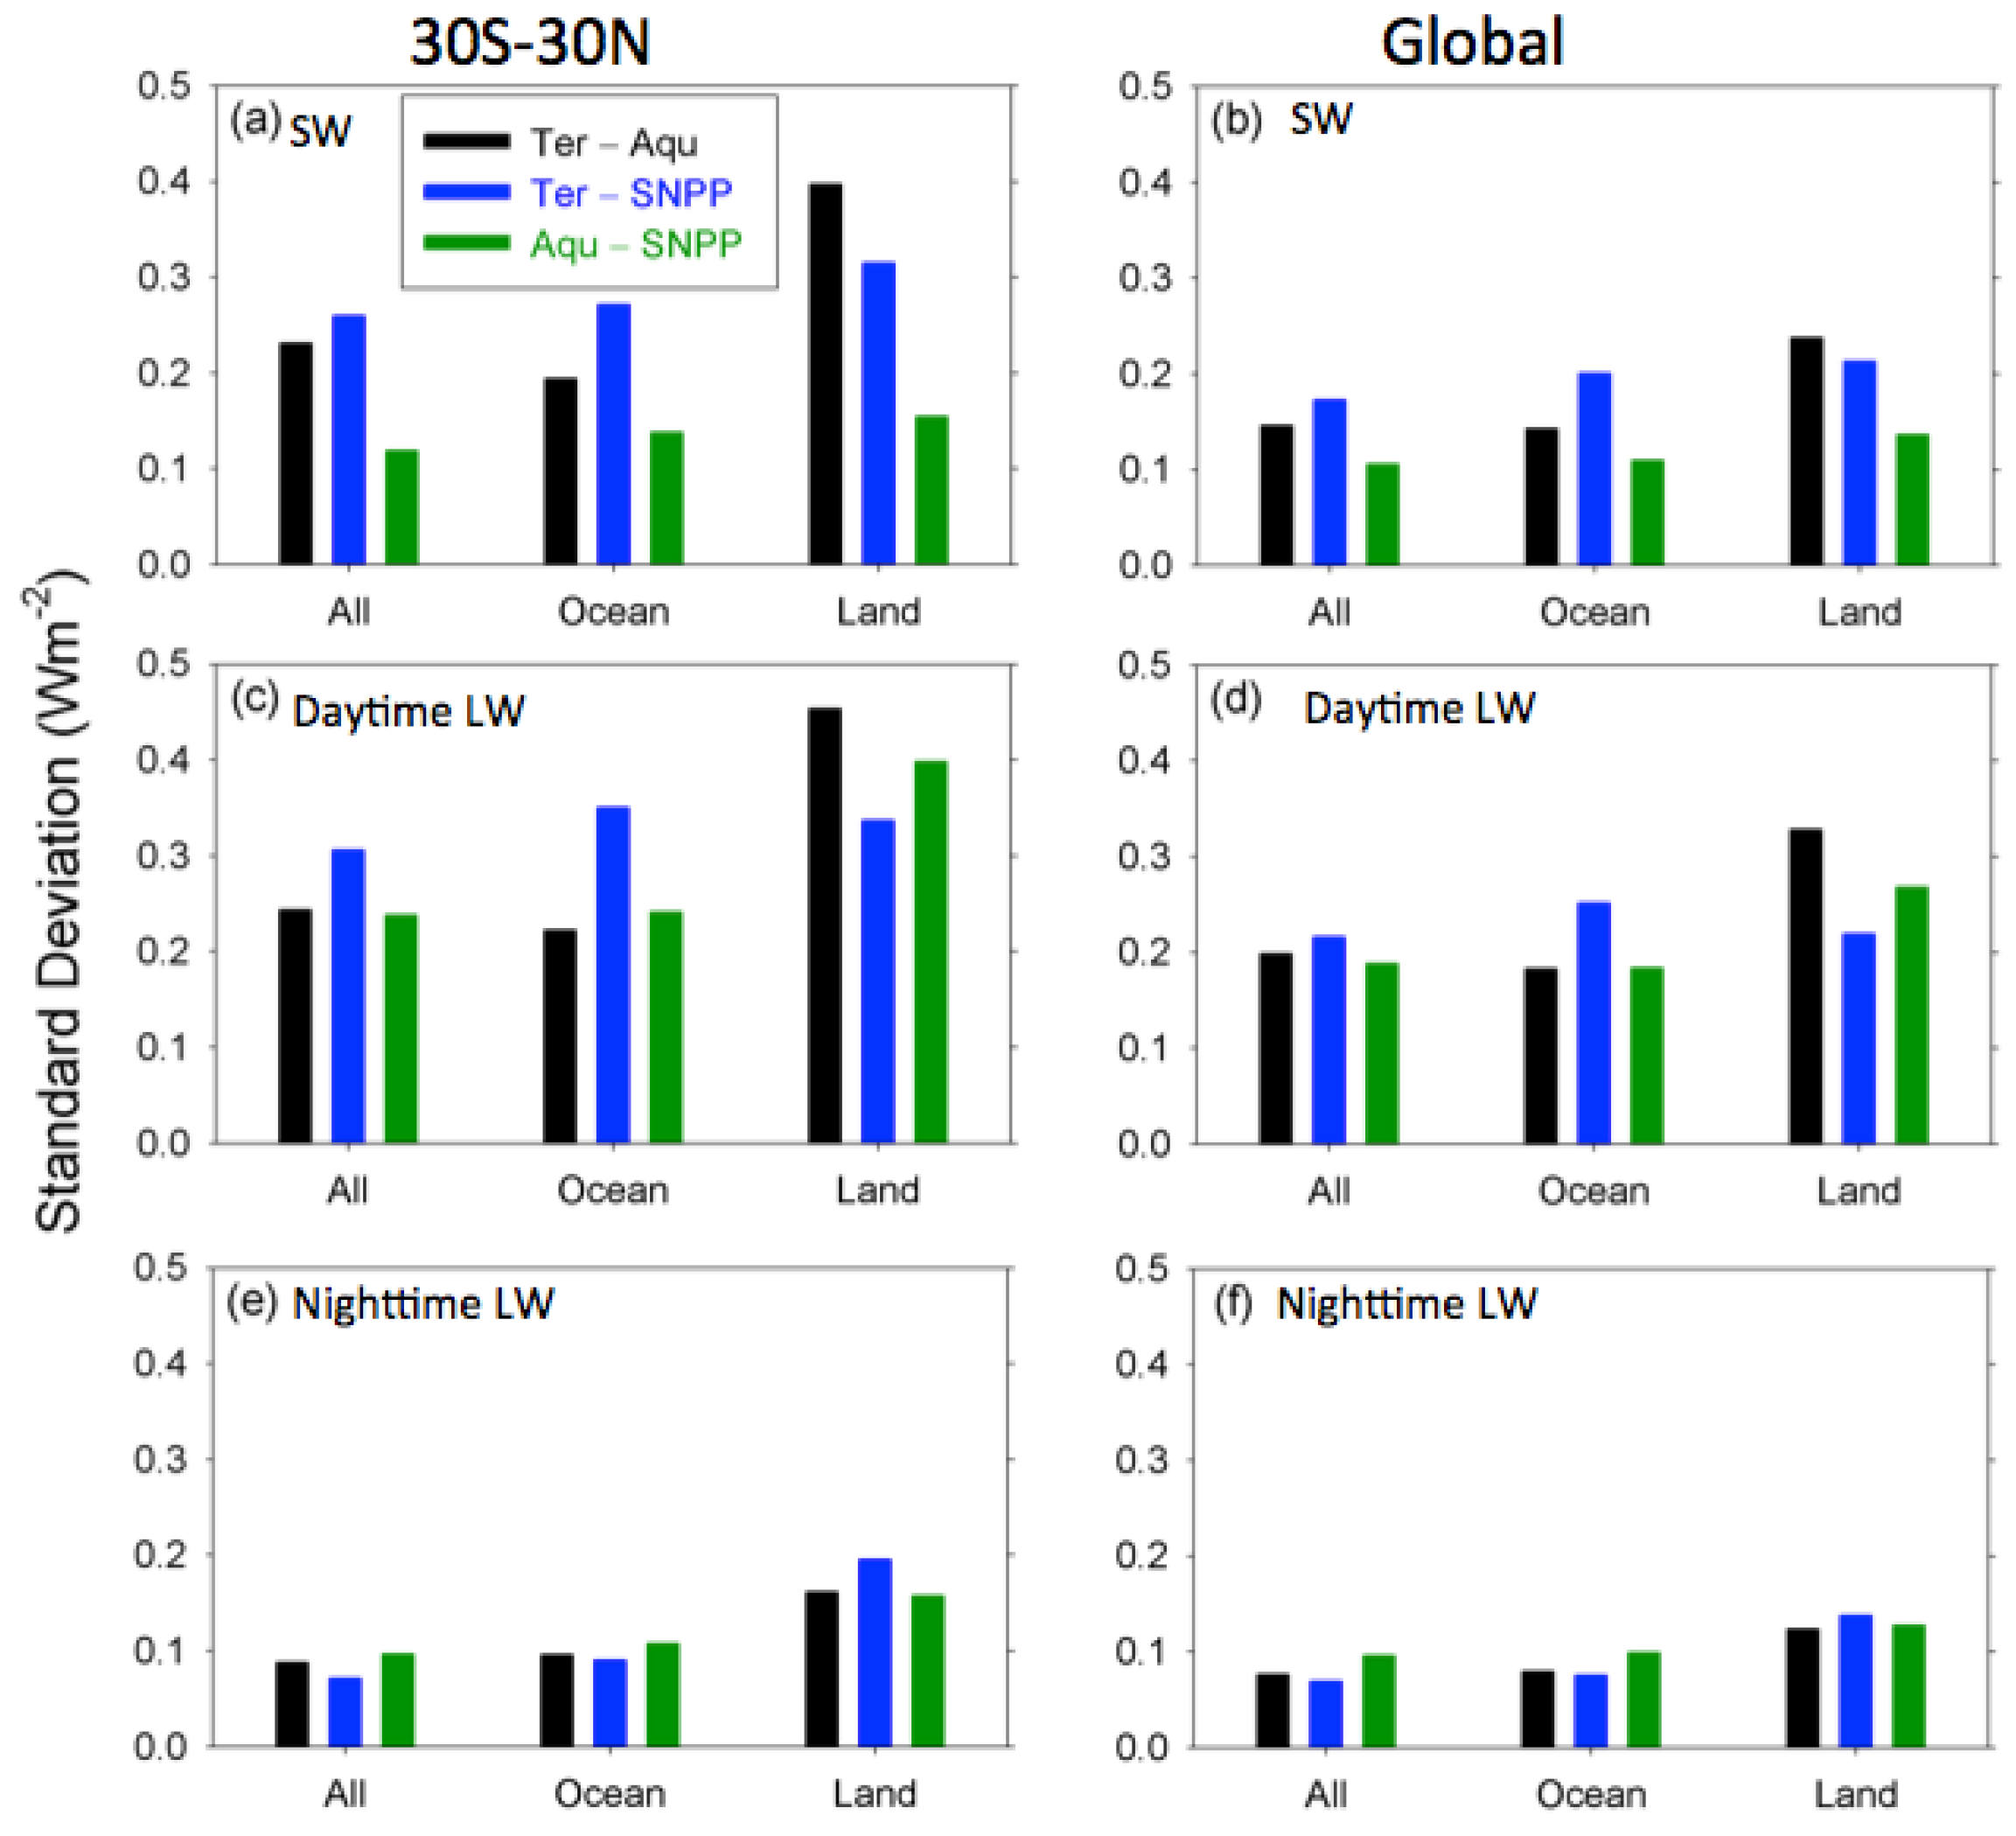
We compare anomalies in SW, daytime LW and nighttime LW TOA fluxes from CERES Terra, Aqua and S-NPP for February 2012 through March 2014 in
Figure 8a–f, which show the standard deviation in monthly anomaly differences for 30°S–30°N and globally. In the SW, the standard deviation in the difference ranges from 0.1 Wm
−2 to 0.4 Wm
−2. In all cases, the best agreement is between CERES Aqua and S-NPP, likely because these instruments are in afternoon orbits, albeit at different orbital altitudes. As a result, the distribution of observed scenes is likely closer for CERES Aqua and S-NPP than it is for CERES Terra and either of the afternoon instruments. The daytime LW standard deviations (
Figure 8c,d) are greater, ranging from 0.18 Wm
−2 to 0.45 Wm
−2. Unlike for SW, the standard deviation in the difference does not appear to be dependent upon the orbit. The LW nighttime standard deviations (
Figure 8e–f) are much smaller than for LW daytime, ranging from 0.07 Wm
−2 to 0.2 Wm
−2. The stark contrast between nighttime and daytime LW clearly shows the greater uncertainty associated with having to remove the SW contribution to the TOT channel with the SW channel.
4. Conclusions
This paper focuses on the improvements and validation of CERES Terra and Aqua radiances used to produce higher-level climate data products (Edition 4). The main change from the previous version (Edition 3) is a better accounting of instrument spectral response function changes with time. After applying instrument gains determined from onboard calibration sources, SW channel spectral response function changes are determined vicariously through a direct comparison of coincident CERES nadir radiances from instrument pairs on the same platform. The loss of transmission with wavelength (or spectral degradation) is represented by an exponential relationship with one free parameter, which is inferred monthly from CERES nadir radiances. We assume the instrument in RAP mode degrades relative to the crosstrack instrument and account for any drift in the ratio of coincident unfiltered radiances. After applying this approach independently to CERES instruments on Terra and Aqua, monthly variations in SW TOA flux anomalies show a correlation of 0.96 and the standard deviation in the difference in monthly anomalies is only 0.2 Wm−2 for ocean and 0.3 Wm−2 for land/desert. Additionally, trends in monthly anomalies are consistent to 0.21 Wm−2 per decade for ocean, and 0.31 Wm−2 per decade for land/desert.
In the LW, the most challenging measurement is during daytime, as it involves removing the contribution from the SW portion of the TOT channel with the SW channel radiance measurement. To account for SRF changes in the SW portion of the TOT channel, a spectral degradation relation similar to that for the SW channel is assumed, but with a second free parameter (Equation (2)). After applying instrument gain coefficients to the TOT and SW channels, and accounting for SRF changes in the SW, linear regression coefficients are computed each month for tropical daytime-nighttime LW versus daytime-nighttime WN radiance differences for all-sky ocean and all-sky land/desert scene types. A correction to the SW portion of the TOT SRF is derived using the spectral degradation curve that yields the smallest variation in regression fits compared to the first month of the mission. This ensures that the relationship between tropical daytime-nighttime LW and daytime-nighttime WN radiance differences remains consistent throughout the mission. When this method is applied to Terra and Aqua, global daytime–nighttime LW differences remain stable throughout the missions over both global ocean and land/desert. However, there is greater uncertainty over the Saharan and Saudi Arabian desert for CERES Aqua. We suspect this is due to SW unfiltering rather than TOT channel unfiltering, as these regions show significant differences in Aqua minus Terra SW flux anomaly trends.
When the CERES Terra and Aqua Edition 4 LW TOA fluxes are compared with the AIRS Version-6 OLR product over the tropics, all three data products show a consistent decrease in LW TOA flux that is mainly associated with ENSO variability. The trends from these datasets agree to 0.16 Wm−2 per decade. All three datasets also show a slight decline (0.2–0.3 Wm−2 per decade) in the daytime minus nighttime OLR difference that is statistically significant at the 95% significance level.
Comparisons between CERES Terra, Aqua and S-NPP monthly anomalies in SW TOA flux for February 2012 through March 2014 reveal that there is markedly better consistency between CERES Aqua and S-NPP than between CERES Terra and either of the afternoon satellites. The standard deviation in SW TOA flux monthly anomaly differences between CERES Aqua and S-NPP ranges from 0.1 Wm−2 for all-sky ocean to 0.16 Wm−2 for all-sky land. In contrast, the standard deviation for CERES Terra and CERES Aqua or S-NPP SW anomaly differences ranges from 0.15 Wm−2 to 0.4 Wm−2. Standard deviations in LW daytime TOA flux anomaly differences are generally much greater compared to nighttime owing to increased uncertainty resulting from the need to remove the SW contribution to the TOT channel with SW radiances. However, unlike SW, there does not appear to be a dependence upon satellite equator-crossing time.
The validation results presented in this paper suggest that the CERES Edition 4 data record falls within the stability requirements outlined in [
20]. For TOA radiation budget, Ohring
et al. [
20] (
Table 2) recommends a long-term stability of 0.3 Wm
−2 per decade for SW at the 95% confidence level. The CERES Terra and Aqua SW TOA flux comparisons shown here in addition to earlier comparisons between CERES Terra and SeaWIFS over the tropical oceans (Loeb
et al., [
9]) fall within this stability requirement. Similarly, Ohring
et al. [
20] recommends a stability of 0.2 Wm
−2 per decade for LW TOA flux at the 95% confidence level. The comparisons between CERES instruments on Terra and Aqua and the AIRS OLR record also fall within this requirement.
In order to maintain these levels of stability in the CERES radiation budget CDR in the long term, it is critical that there be no gaps between successive CERES instruments on different satellite platforms. Bridging a gap would require a reliance on the absolute calibration of CERES sensors, which is inadequate for this purpose [
21]. One way to reduce the risk of a gap is to fly multiple CERES instruments on different platforms. This is the current strategy as CERES instruments are currently flying on Terra, Aqua and S-NPP, and the CERES FM-6 instrument is scheduled to fly on JPSS-1 in 2017. Efforts are also under way to build a CERES follow-on instrument (Radiation Budget Instrument or RBI) that will fly on JPSS-2. Another approach that could potentially help bridge a data gap in the CERES record is to fly the Climate Absolute Radiance and Refractivity Observatory (CLARREO; [
22]), which aims to provide an in-orbit reference calibration standard for other satellite sensors. While CLARREO will have enhanced absolute accuracy and stability compared to existing satellite instruments, its spatial sampling will be much poorer. By intercalibrating CERES instruments across a data gap with one CLARREO instrument spanning the gap or possibly even two CLARREO instruments on either side of the gap, it may be feasible to overcome a gap in the CERES record and still meet the stability requirements.


